
CT Body Composition of Sarcopenia and Sarcopenic Obesity: Predictors of Postoperative Complications and Survival in Patients with Locally Advanced Esophageal Adenocarcinoma

 , , , , , , , ,
  and
and
Abstract
Simple Summary
Abstract
1. Introduction
2. Material and Methods
2.1. Patients and Clinical Data
2.2. Imaging
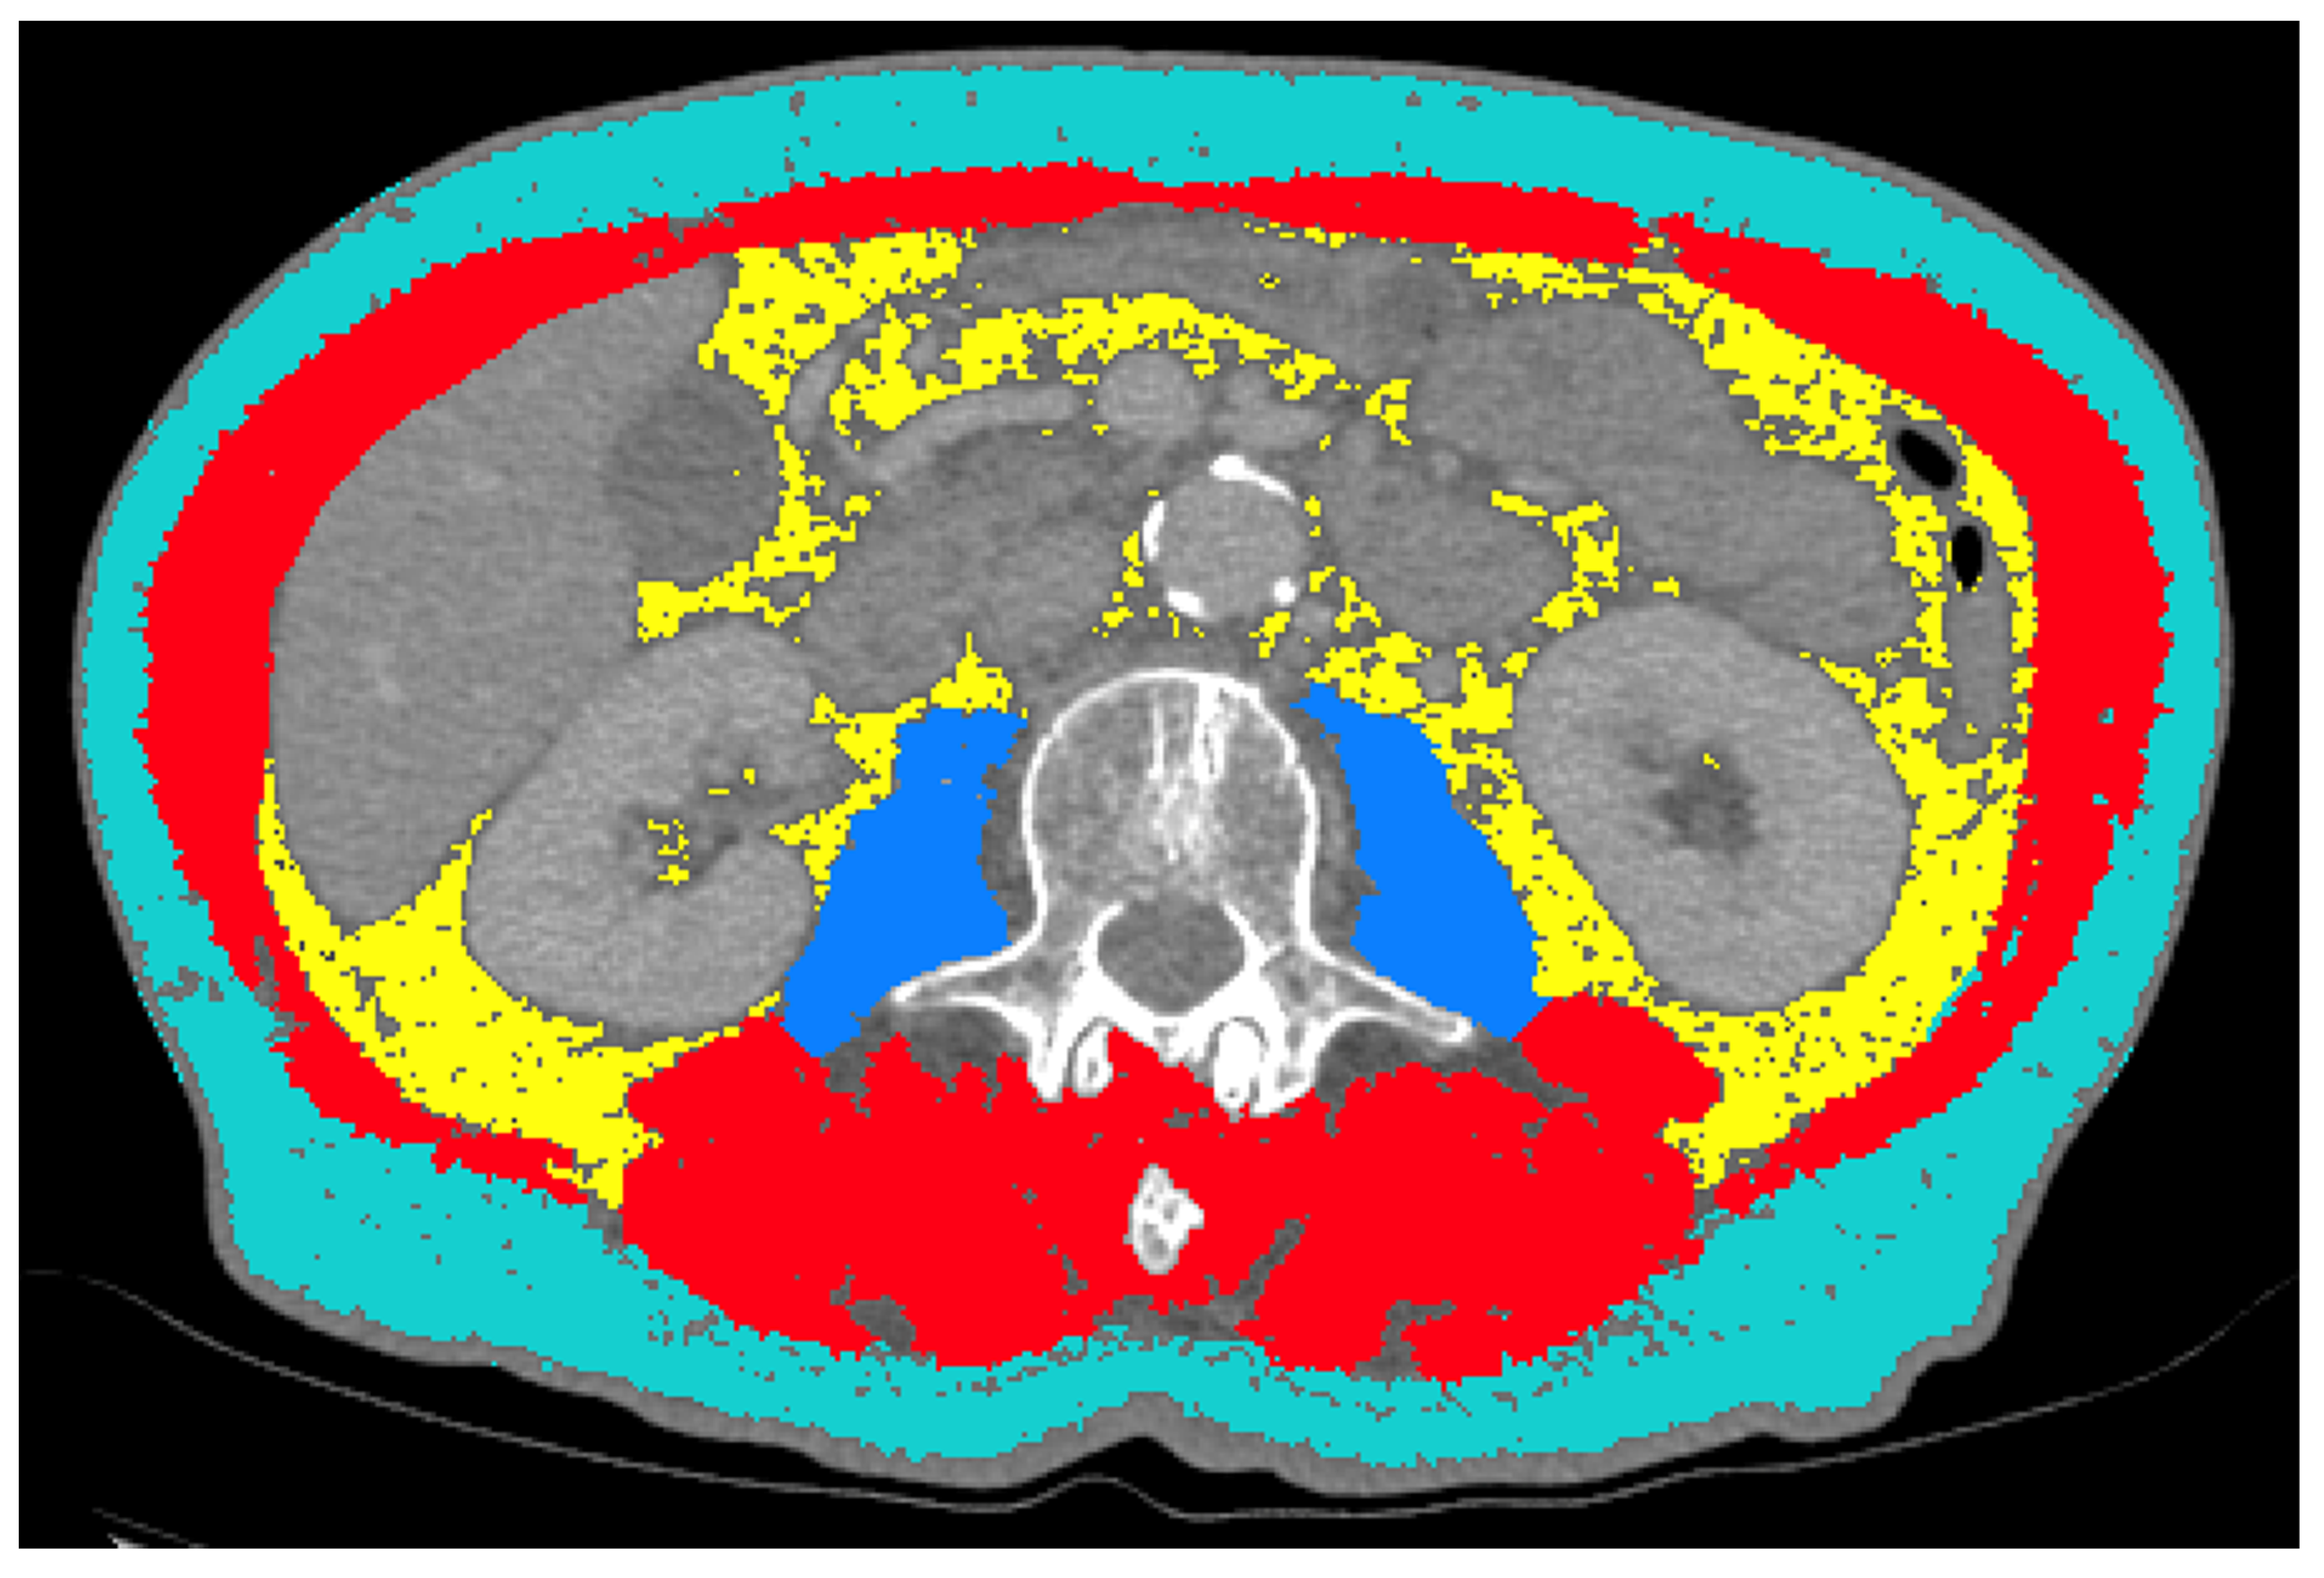
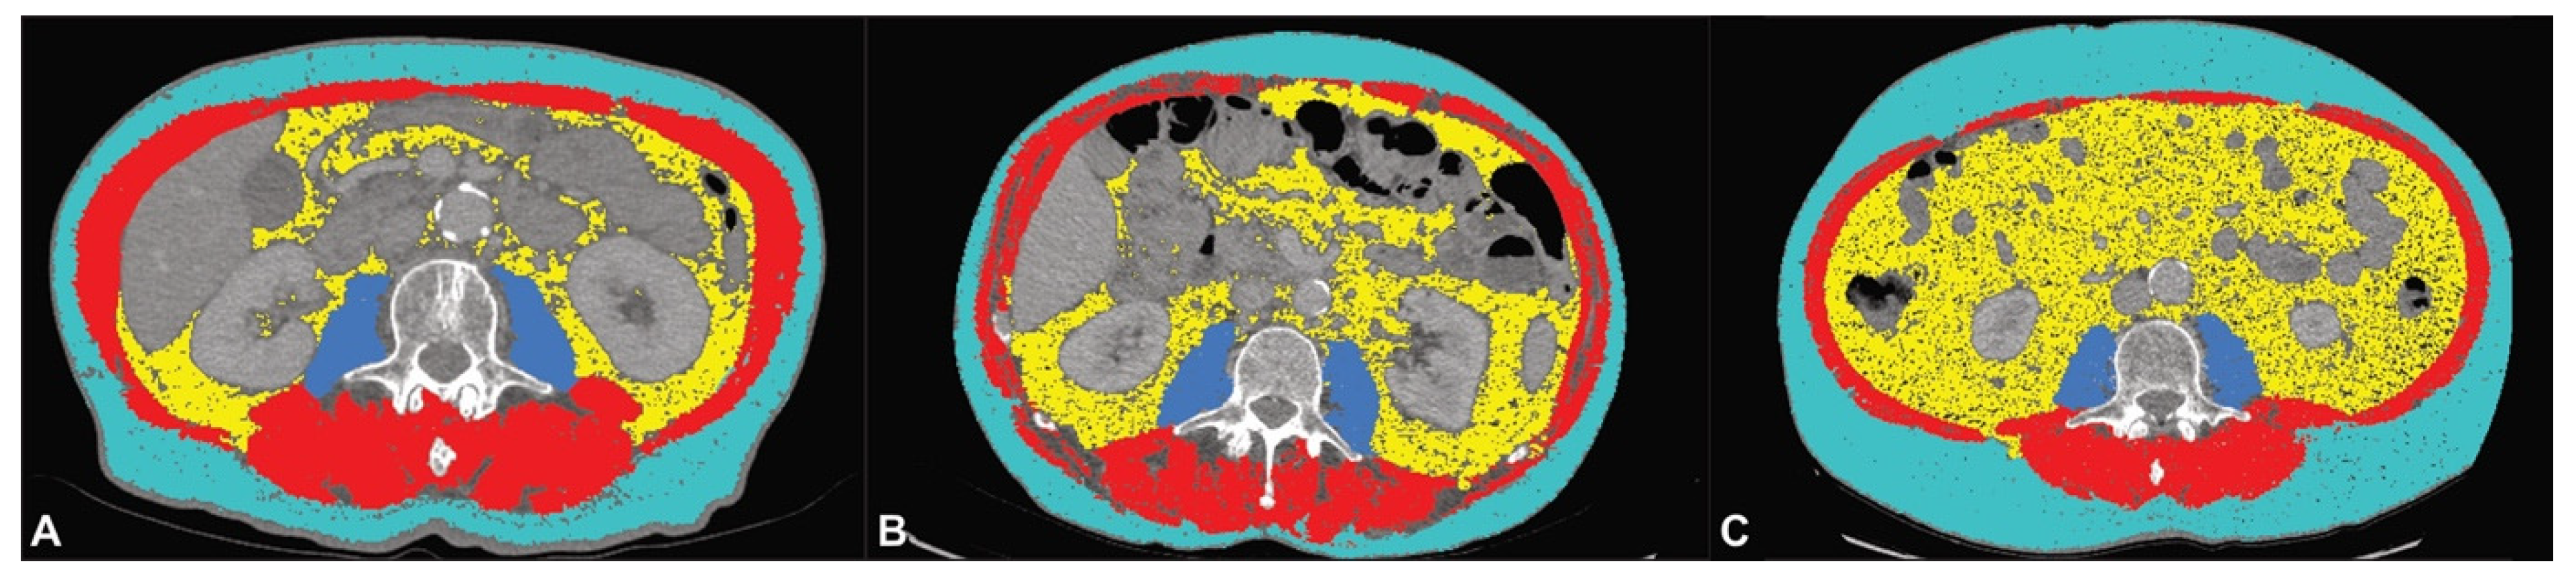
2.3. CT Body Composition Analysis
2.4. Statistical Analysis
3. Results
3.1. Analysis of Preoperative CT Body Composition Imaging Biomarkers
3.2. Analysis of Change in CT Body Composition Imaging Biomarkers during Follow-Up
4. Discussion
5. Conclusions
Author Contributions
Funding
Institutional Review Board Statement
Informed Consent Statement
Data Availability Statement
Acknowledgments
Conflicts of Interest
References
- Ferlay, J.; Colombet, M.; Soerjomataram, I.; Mathers, C.; Parkin, D.M.; Piñeros, M.; Znaor, A.; Bray, F. Estimating the global cancer incidence and mortality in 2018: GLOBOCAN sources and methods. Int. J. Cancer 2019, 144, 1941–1953. [Google Scholar] [CrossRef]
- Arnold, M.; Ferlay, J.; van Berge Henegouwen, M.I.; Soerjomataram, I. Global burden of oesophageal and gastric cancer by histology and subsite in 2018. Gut 2020, 69, 1564–1571. [Google Scholar] [CrossRef] [PubMed]
- Karstens, K.F.; Stüben, B.O.; Reeh, M. Oesophageal adenocarcinomas: Where do we stand today? Cancers 2020, 13, 109. [Google Scholar] [CrossRef]
- Melhado, R.E.; Alderson, D.; Tucker, O. The changing face of esophageal cancer. Cancers 2010, 2, 1379–1404. [Google Scholar] [CrossRef]
- Kawakatsu, Y.; Koyanagi, Y.N.; Oze, I.; Kasugai, Y.; Morioka, H.; Yamaguchi, R.; Ito, H.; Matsuo, K. Association between Socioeconomic Status and Digestive Tract Cancers: A Case-Control Study. Cancers 2020, 12, 3258. [Google Scholar] [CrossRef] [PubMed]
- Keeble, S.; Abel, G.A.; Saunders, C.L.; McPhail, S.; Walter, F.M.; Neal, R.D.; Rubin, G.P.; Lyratzopoulos, G. Variation in promptness of presentation among 10,297 patients subsequently diagnosed with one of 18 cancers: Evidence from a National Audit of Cancer Diagnosis in Primary Care. Int. J. Cancer 2014, 135, 1220–1228. [Google Scholar] [CrossRef]
- Stahl, M.; Budach, W.; Meyer, H.J.; Cervantes, A. Esophageal cancer: Clinical practice guidelines for diagnosis, treatment and follow-up. Ann. Oncol. Off. J. Eur. Soc. Med. Oncol./ESMO 2010, 21 (Suppl. 5), v46–v49. [Google Scholar] [CrossRef]
- Pech, O.; Bollschweiler, E.; Manner, H.; Leers, J.; Ell, C.; Hölscher, A.H. Comparison between endoscopic and surgical resection of mucosal esophageal adenocarcinoma in Barrett’s esophagus at two high-volume centers. Ann. Surg. 2011, 254, 67–72. [Google Scholar] [CrossRef] [PubMed]
- Quaas, A. Current and future treatment strategies for esophageal adenocarcinoma. Cancers 2020, 12, 2930. [Google Scholar] [CrossRef] [PubMed]
- Reeh, M.; Nentwich, M.F.; Asani, S.; Uzunoglu, F.G.; Bockhorn, M.; Sauter, G.; Rösch, T.; Izbicki, J.R.; Bogoevski, D. Locally advanced esophageal carcinoma: Is there still a role of surgery alone without neoadjuvant treatment? J. Gastrointest. Surg. 2015, 19, 587–593. [Google Scholar] [CrossRef] [PubMed]
- Porschen, R.; Fischbach, W.; Gockel, I.; Hollerbach, S.; Hölscher, A.; Jansen, P.L.; Miehlke, S.; Pech, O.; Stahl, M.; Thuss-Patience, P.; et al. S3-Leitlinie–Diagnostik und Therapie der Plattenepithelkarzinome und Adenokarzinome des Ösophagus. Z. Gastroenterol. 2019, 57, 336–418. [Google Scholar] [CrossRef] [PubMed]
- Viklund, P.; Lindblad, M.; Lu, M.; Ye, W.; Johansson, J.; Lagergren, J. Risk factors for complications after esophageal cancer resection: A prospective population-based study in Sweden. Ann. Surg. 2006, 243, 204–211. [Google Scholar] [CrossRef]
- Mariette, C.; Markar, S.R.; Dabakuyo-Yonli, T.S.; Meunier, B.; Pezet, D.; Collet, D.; D’Journo, X.B.; Brigand, C.; Perniceni, T.; Carrère, N.; et al. Hybrid minimally invasive esophagectomy for esophageal cancer. N. Engl. J. Med. 2019, 380, 152–162. [Google Scholar] [CrossRef]
- Peng, J.S.; Kukar, M.; Mann, G.N.; Hochwald, S.N. Minimally invasive esophageal cancer surgery. Surg. Oncol. Clin. N. Am. 2019, 28, 177–200. [Google Scholar] [CrossRef]
- Yibulayin, W.; Abulizi, S.; Lv, H.; Sun, W. Minimally invasive oesophagectomy versus open esophagectomy for resectable esophageal cancer: A meta-analysis. World J. Surg. Oncol. 2016, 14, 304. [Google Scholar] [CrossRef]
- Lee, C.D.; Blair, S.N.; Jackson, A.S. Cardiorespiratory fitness, body composition, and all-cause and cardiovascular disease mortality in men. Am. J. Clin. Nutr. 1999, 69, 373–380. [Google Scholar] [CrossRef]
- Pamoukdjian, F.; Bouillet, T.; Lévy, V.; Soussan, M.; Zelek, L.; Paillaud, E. Prevalence and predictive value of pre-therapeutic sarcopenia in cancer patients: A systematic review. Clin. Nutr. 2018, 37, 1101–1113. [Google Scholar] [CrossRef]
- Faron, A.; Luetkens, J.A.; Schmeel, F.C.; Kuetting, D.L.R.; Thomas, D.; Sprinkart, A.M. Quantification of fat and skeletal muscle tissue at abdominal computed tomography: Associations between single-slice measurements and total compartment volumes. Abdom. Radiol. 2019, 44, 1907–1916. [Google Scholar] [CrossRef] [PubMed]
- Huang, D.D.; Wang, S.L.; Zhuang, C.L.; Zheng, B.S.; Lu, J.X.; Chen, F.F.; Zhou, C.J.; Shen, X.; Yu, Z. Sarcopenia, as defined by low muscle mass, strength and physical performance, predicts complications after surgery for colorectal cancer. Colorectal. Dis. 2015, 17, O256–O264. [Google Scholar] [CrossRef] [PubMed]
- Ida, S.; Watanabe, M.; Yoshida, N.; Baba, Y.; Umezaki, N.; Harada, K.; Karashima, R.; Imamura, Y.; Iwagami, S.; Baba, H. Sarcopenia is a predictor of postoperative respiratory complications in patients with esophageal cancer. Ann. Surg. Oncol. 2015, 22, 4432–4437. [Google Scholar] [CrossRef]
- Lee, K.; Shin, Y.; Huh, J.; Sung, Y.S.; Lee, I.S.; Yoon, K.H.; Kim, K.W. Recent issues on body composition imaging for sarcopenia evaluation. Korean J. Radiol. 2019, 20, 205–217. [Google Scholar] [CrossRef]
- Berry, M.F. Esophageal cancer: Staging system and guidelines for staging and treatment. J. Thorac. Dis. 2014, 6 (Suppl. 3), S289–S297. [Google Scholar] [CrossRef]
- Dziodzio, T.; Kröll, D.; Denecke, C.; Öllinger, R.; Pratschke, J.; Biebl, M. Minimally invasive esophagectomy. Multimed. Man Cardiothorac. Surg. 2021, 2021. [Google Scholar] [CrossRef]
- Misawa, K.; Hachisuka, T.; Kuno, Y.; Mori, T.; Shinohara, M.; Miyauchi, M. New procedure for purse-string suture in thoracoscopic esophagectomy with intrathoracic anastomosis. Surg. Endosc. 2005, 19, 40–42. [Google Scholar] [CrossRef]
- Dindo, D.; Demartines, N.; Clavien, P.A. Classification of surgical complications: A new proposal with evaluation in a cohort of 6336 patients and results of a survey. Ann. Surg. 2004, 240, 205–213. [Google Scholar] [CrossRef]
- Su, H.; Ruan, J.; Chen, T.; Lin, E.; Shi, L. CT-assessed sarcopenia is a predictive factor for both long-term and short-term outcomes in gastrointestinal oncology patients: A systematic review and meta-analysis. Cancer Imaging Off. Publ. Int. Cancer Imaging Soc. 2019, 19, 82. [Google Scholar] [CrossRef] [PubMed]
- Prado, C.M.; Lieffers, J.R.; McCargar, L.J.; Reiman, T.; Sawyer, M.B.; Martin, L.; Baracos, V.E. Prevalence and clinical implications of sarcopenic obesity in patients with solid tumours of the respiratory and gastrointestinal tracts: A population-based study. Lancet Oncol. 2008, 9, 629–635. [Google Scholar] [CrossRef]
- Carneiro, I.P.; Mazurak, V.C.; Prado, C.M. Clinical implications of sarcopenic obesity in cancer. Curr. Oncol. Rep. 2016, 18, 62. [Google Scholar] [CrossRef] [PubMed]
- Choi, M.H.; Kim, K.A.; Hwang, S.S.; Byun, J.Y. CT-quantified muscle and fat change in patients after surgery or endoscopic resection for early gastric cancer and its impact on long-term outcomes. Medicine 2018, 97, e13878. [Google Scholar] [CrossRef]
- Zhou, C.J.; Zhang, F.M.; Zhang, F.Y.; Yu, Z.; Chen, X.L.; Shen, X.; Zhuang, C.L.; Chen, X.X. Sarcopenia: A new predictor of postoperative complications for elderly gastric cancer patients who underwent radical gastrectomy. J. Surg. Res. 2017, 211, 137–146. [Google Scholar] [CrossRef]
- Yip, C.; Goh, V.; Davies, A.; Gossage, J.; Mitchell-Hay, R.; Hynes, O.; Maisey, N.; Ross, P.; Gaya, A.; Landau, D.B.; et al. Assessment of sarcopenia and changes in body composition after neoadjuvant chemotherapy and associations with clinical outcomes in oesophageal cancer. Eur. Radiol. 2014, 24, 998–1005. [Google Scholar] [CrossRef]
- Paireder, M.; Asari, R.; Kristo, I.; Rieder, E.; Tamandl, D.; Ba-Ssalamah, A.; Schoppmann, S.F. Impact of sarcopenia on outcome in patients with esophageal resection following neoadjuvant chemotherapy for esophageal cancer. Eur. J. Surg. Oncol. 2017, 43, 478–484. [Google Scholar] [CrossRef]
- Ligthart-Melis, G.C.; Weijs, P.J.; te Boveldt, N.D.; Buskermolen, S.; Earthman, C.P.; Verheul, H.M.; de Lange-de Klerk, E.S.; van Weyenberg, S.J.; van der Peet, D.L. Dietician-delivered intensive nutritional support is associated with a decrease in severe postoperative complications after surgery in patients with esophageal cancer. Dis. Esophagus 2013, 26, 587–593. [Google Scholar] [CrossRef]
- Levine, M.E.; Crimmins, E.M. The impact of insulin resistance and inflammation on the association between sarcopenic obesity and physical functioning. Obesity (Silver Spring) 2012, 20, 2101–2106. [Google Scholar] [CrossRef] [PubMed]
- Pedersen, B.K.; Febbraio, M.A. Muscles, exercise and obesity: Skeletal muscle as a secretory organ. Nat. Rev. Endocrinol. 2012, 8, 457–465. [Google Scholar] [CrossRef] [PubMed]
- Kornum, J.B.; Nørgaard, M.; Dethlefsen, C.; Due, K.M.; Thomsen, R.W.; Tjønneland, A.; Sørensen, H.T.; Overvad, K. Obesity and risk of subsequent hospitalisation with pneumonia. Eur. Respir. J. 2010, 36, 1330–1336. [Google Scholar] [CrossRef] [PubMed]
- Mancuso, P. Obesity and respiratory infections: Does excess adiposity weigh down host defense? Pulm. Pharmacol. Ther. 2013, 26, 412–419. [Google Scholar] [CrossRef]
- Schröder, W.; Bollschweiler, E.; Kossow, C.; Hölscher, A.H. Preoperative risk analysis-a reliable predictor of postoperative outcome after transthoracic esophagectomy? Langenbeck’s Arch. Surg. 2006, 391, 455–460. [Google Scholar] [CrossRef]
- Steyerberg, E.W.; Neville, B.A.; Koppert, L.B.; Lemmens, V.E.; Tilanus, H.W.; Coebergh, J.W.; Weeks, J.C.; Earle, C.C. Surgical mortality in patients with esophageal cancer: Development and validation of a simple risk score. J. Clin. Oncol. Off. J. Am. Soc. Clin. Oncol. 2006, 24, 4277–4284. [Google Scholar] [CrossRef] [PubMed]
- Warnell, I.; Chincholkar, M.; Eccles, M. Predicting perioperative mortality after oesophagectomy: A systematic review of performance and methods of multivariate models. Br. J. Anaesth. 2015, 114, 32–43. [Google Scholar] [CrossRef]
- Tamandl, D.; Paireder, M.; Asari, R.; Baltzer, P.A.; Schoppmann, S.F.; Ba-Ssalamah, A. Markers of sarcopenia quantified by computed tomography predict adverse long-term outcome in patients with resected oesophageal or gastro-oesophageal junction cancer. Eur. Radiol. 2016, 26, 1359–1367. [Google Scholar] [CrossRef] [PubMed]
- Urashima, M.; Okuyama, M.; Akutsu, T.; Ohdaira, H.; Kaji, M.; Suzuki, Y. Effect of Vitamin D supplementation on survival of digestive tract cancer patients with low bioavailable 25-hydroxyvitamin D levels: A post hoc analysis of the AMATERASU Randomized Clinical Trial. Cancers 2020, 12, 347. [Google Scholar] [CrossRef] [PubMed]


| Characteristic | Factor | Number (%)/Mean (SD) | Range |
|---|---|---|---|
| Sex | Female | 10 (11.8%) | |
| Male | 75 (88.2%) | ||
| Age (years) | 64.3 (9.8) | 45–83 | |
| BMI | 26.79 (4.01) | 16–40 | |
| Surgical technique | Open | 8 (9.4%) | |
| Laparoscopic | 51 (60%) | ||
| Hybrid | 13 (15.3%) | ||
| Robotic | 13 (15.3%) | ||
| UICC stage (missing information in n = 3 patients) | I | 7 (8.2%) | |
| II | 18 (21.2%) | ||
| III | 49 (57.6%) | ||
| IV | 8 (9.4%) | ||
| Neoadjuvant chemotherapy | No | 0 (0.0%) | |
| Yes | 85 (100.0%) | ||
| Neoadjuvant chemoradiotherapy | No | 67 (78.8%) | |
| Yes | 18 (21.2%) | ||
| Complications (overall) | No | 24 (28.2%) | |
| Yes | 61 (71.8%) | ||
| Major complications | No | 40 (47.1%) | |
| Yes | 45 (52.9%) | ||
| Anastomotic leakage | No | 74 (87.1%) | |
| Yes | 11 (12.9%) | ||
| Pneumonia | No | 58 (68.2%) | |
| Yes | 27 (31.8%) | ||
| Hospitalization (d) | 27.75 (38.75) | 10–261 | |
| DFS (months) | 11.51 (13.01) | 0–61 | |
| OS | 14.38 (13.75) | 1–61 | |
| VAT (cm2) | 156.37 (89.95) | 6.62–399.70 | |
| SAT (cm2) | 166.25 (71.59) | 14.00–393.30 | |
| ATR | 0.977 (0.516) | 0.04–2.44 | |
| PMA (cm2) | 19.89 (5.50) | 9.92–37.96 | |
| PMV | 183.75 (59.87) | 67.04–346.91 | |
| TAMA (cm2) | 147.98 (30.26) | 78.40–228.13 | |
| LSMI (cm2/m2) | 47.44 (7.91) | 30.63–68.42 | |
| Sarcopenia | No | 27 (31.8%) | |
| Yes | 58 (68.2%) | ||
| Sarcopenic obesity | No | 78 (91.8%) | |
| Yes | 7 (8.2%) |
| Outcome | Preoperative CT Body Composition Imaging Biomarkers | ||||||||
| Adipose Tissue | |||||||||
| VAT | p | SAT | p | ATR | p | ||||
| Mean (SD) | Mean (SD) | Mean (SD) | |||||||
| Complications | Yes | 156.77 (90.63) | 0.946 | 177.30 (73.43) | 0.036 | 0.90 (0.47) | 0.056 | ||
| No | 155.38 (90.12) | 138.17 (59.20) | 1.17 (0.59) | ||||||
| Major complications | Yes | 158.45 (90.70) | 0.850 | 180.02 (75.27) | 0.108 | 0.89 (0.44) | 0.149 | ||
| No | 154.04 (90.20) | 150.76 (64.67) | 1.08 (0.58) | ||||||
| Anastomotic leakage | Yes | 168.01 (68.71) | 0.596 | 183.70 (85.31) | 0.647 | 0.97 (0.33) | 0.793 | ||
| No | 154.64 (92.96) | 163.65 (69.62) | 0.98 (0.54) | ||||||
| Pneumonia | Yes | 164.53 (90.19) | 0.604 | 190.24 (84.96) | 0.065 | 0.92 (0.46) | 0.491 | ||
| No | 152.58 (90.38) | 155.08 (62.13) | 1.00 (0.54) | ||||||
| Muscle tissue | |||||||||
| PMA | p | PMV | p | TAMA | p | LSMI | p | ||
| Mean (SD) | Mean (SD) | Mean (SD) | Mean (SD) | ||||||
| Complications | Yes | 20.01 (5.55) | 0.653 | 177.39 (58.04) | 0.101 | 146.90 (27.65) | 0.911 | 47.38 (7.36) | 0.762 |
| No | 19.57 (5.48) | 199.92 (62.64) | 150.73 (36.59) | 47.59 (9.35) | |||||
| Major Complications | Yes | 19.46 (5.82) | 0.235 | 182.29 (59.50) | 0.460 | 146.59 (25.32) | 0.843 | 47.05 (5.93) | 1.000 |
| No | 20.36 (5.15) | 185.43 (61.01) | 149.54 (35.28) | 47.88 (9.74) | |||||
| Anastomotic leakage | Yes | 21.17 (7.59) | 0.804 | 199.08 (75.06) | 0.591 | 151.22 (26.72) | 0.778 | 48.21 (6.63) | 0.530 |
| No | 19.70 (5.16) | 181.47 (57.55) | 147.50 (30.89) | 47.32 (8.12) | |||||
| Pneumonia | Yes | 20.06 (6.62) | 0.981 | 178.41 (64.53) | 0.565 | 140.91 (28.42) | 0.164 | 45.48 (6.40) | 0.199 |
| No | 19.81 (4.96) | 186.24 (58.00) | 151.27 (30.77) | 48.35 (8.42) | |||||
| Outcome | Sarcopenia | Sarcopenic Obesity | |||||
|---|---|---|---|---|---|---|---|
| Yes | No | p | Yes | No | p | ||
| Complications | Yes | 45 | 16 | 0.081 | 7 | 54 | 0.083 |
| No | 13 | 11 | 0 | 24 | |||
| Major Complications | Yes | 35 | 10 | 0.045 | 6 | 39 | 0.070 |
| No | 23 | 17 | 1 | 39 | |||
| Anastomotic leakage | Yes | 8 | 3 | 0.732 | 2 | 9 | 0.198 |
| No | 50 | 24 | 5 | 69 | |||
| Pneumonia | Yes | 22 | 5 | 0.073 | 5 | 22 | 0.019 |
| No | 36 | 22 | 2 | 56 | |||
| Outcome | Hazard Ratio | 95% CI | p | ||
|---|---|---|---|---|---|
| Lower | Upper | ||||
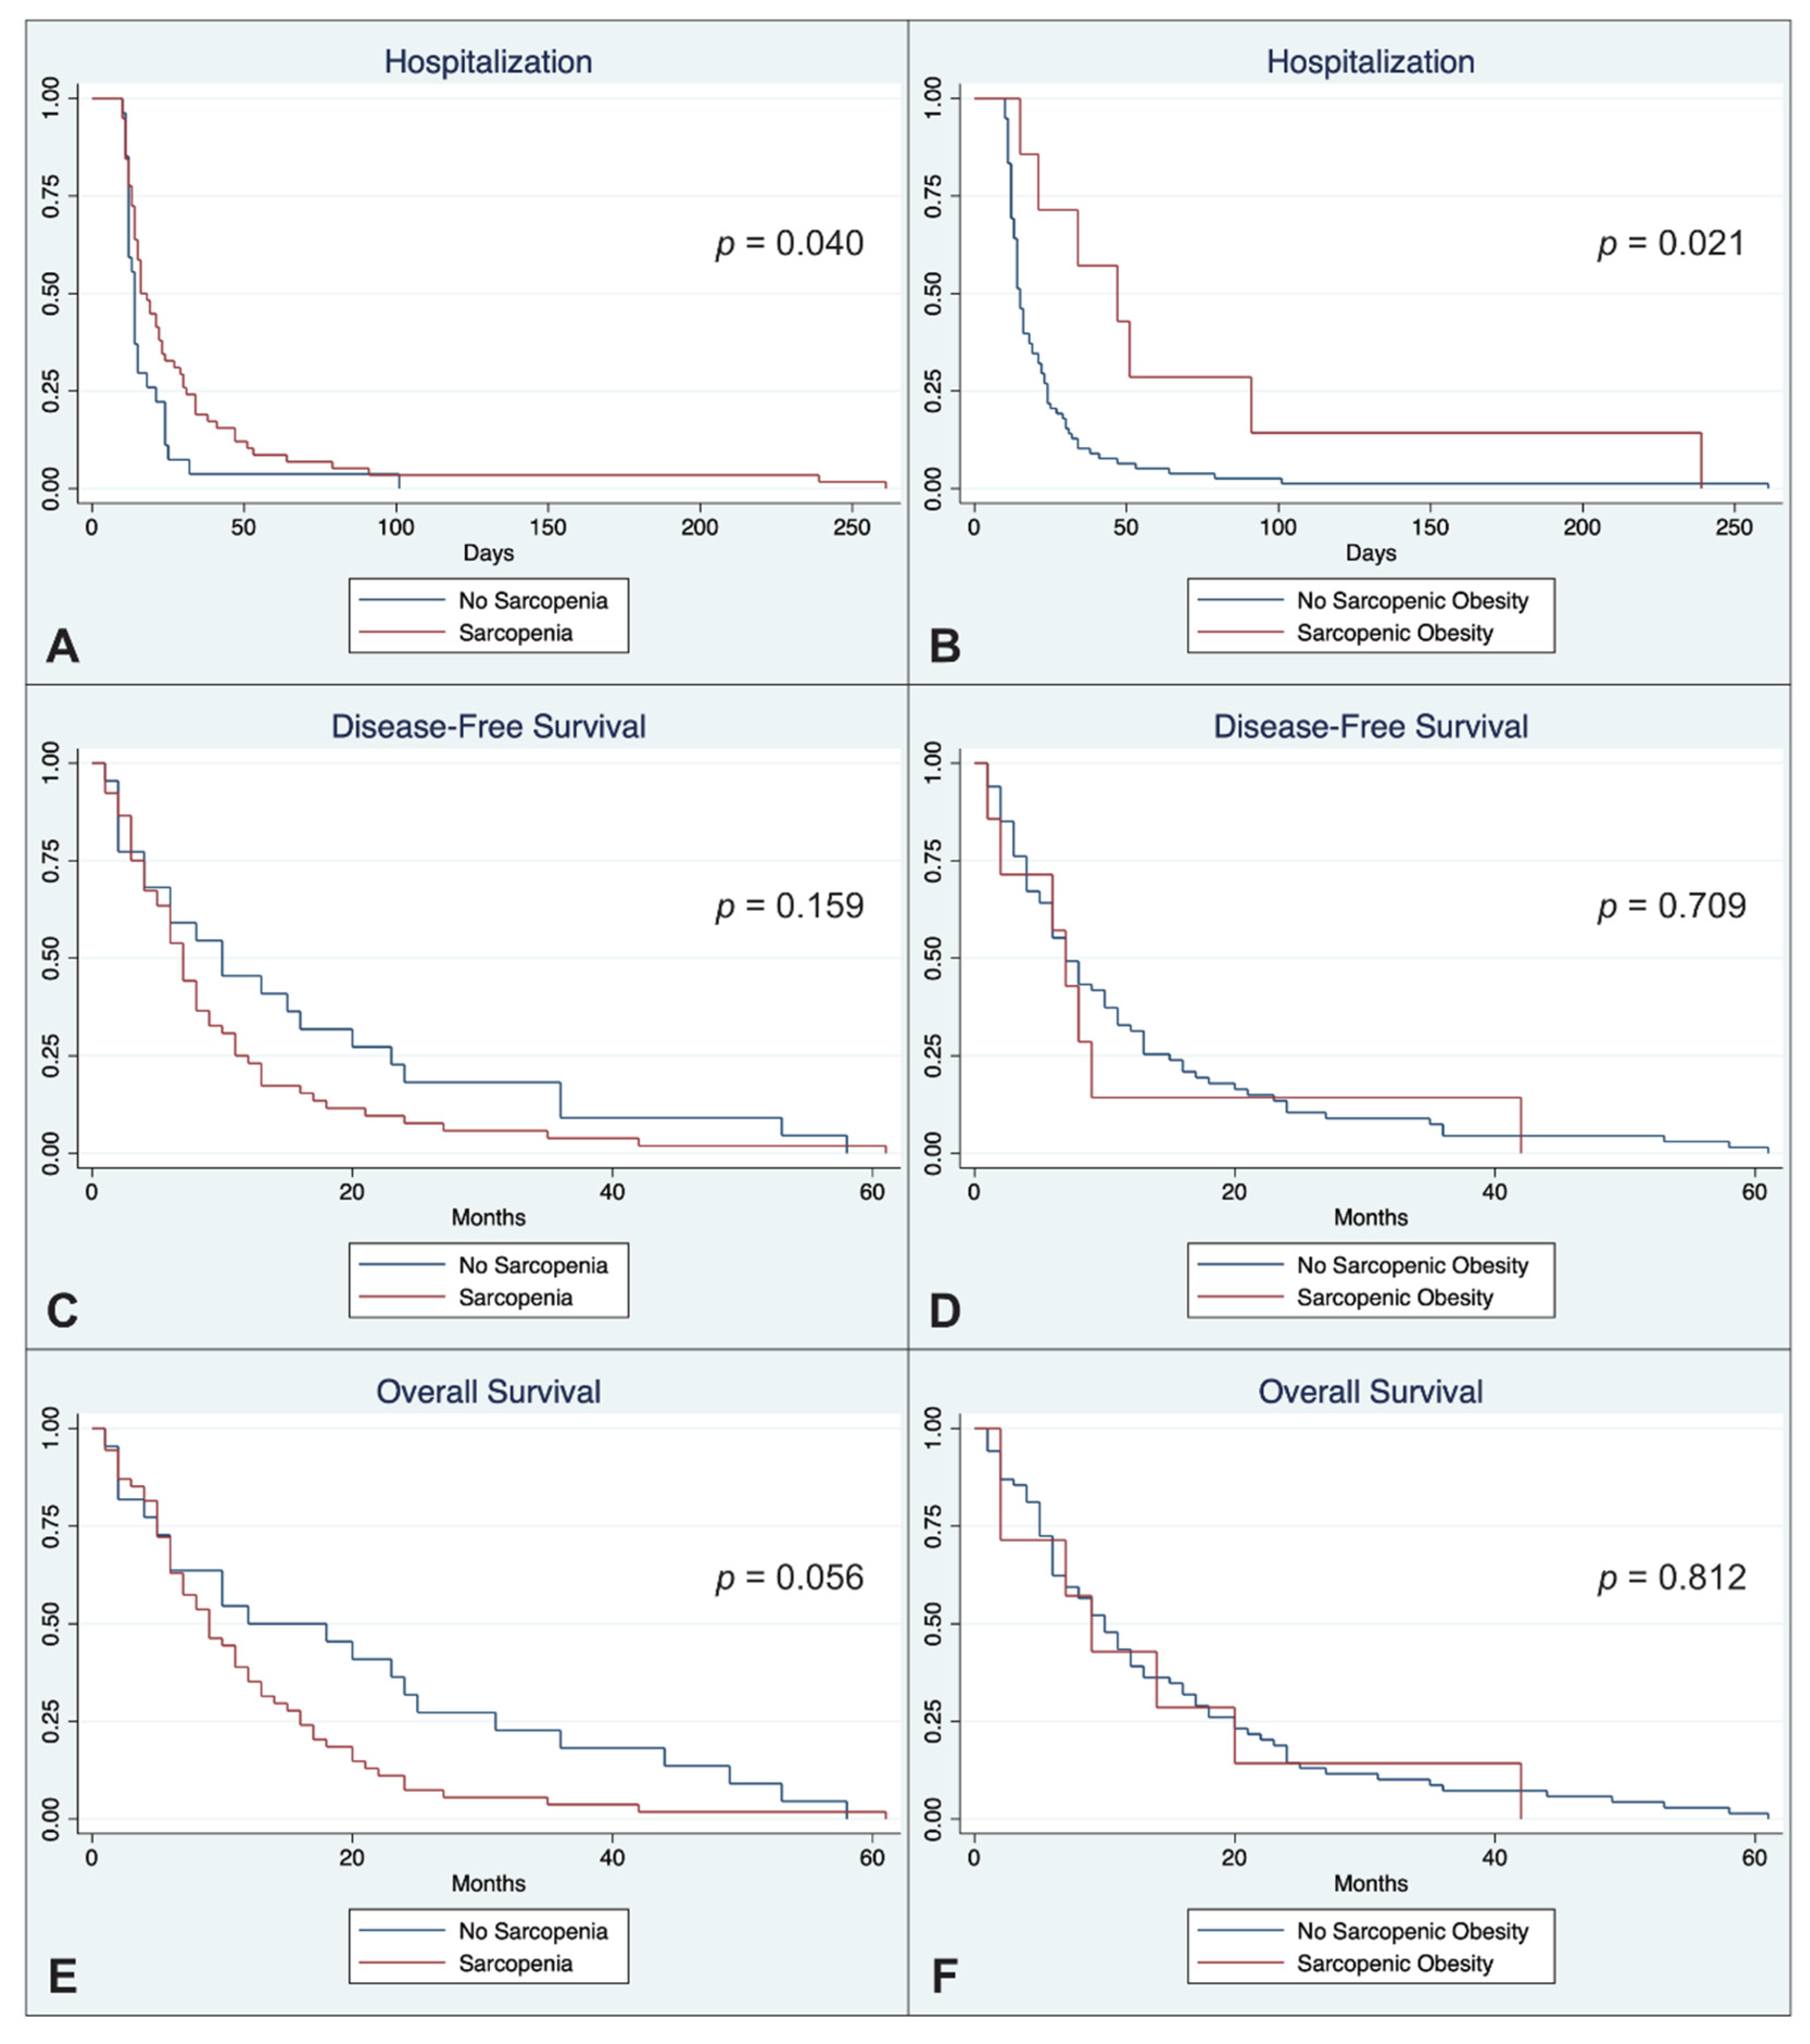
| Hospitalization (d) | Sarcopenia | 0.611 | 0.382 | 0.977 | 0.040 |
| Sarcopenic Obesity | 0.394 | 0.179 | 0.870 | 0.021 | |
| DFS (months) | Sarcopenia | 1.444 | 0.866 | 2.406 | 0.159 |
| Sarcopenic Obesity | 1.162 | 0.529 | 2.550 | 0.709 | |
| OS (months) | Sarcopenia | 1.656 | 0.987 | 2.781 | 0.056 |
| Sarcopenic Obesity | 1.099 | 0.503 | 2.402 | 0.812 | |
| Outcome | Relative Changes in CT Body Composition Imaging Biomarkers between Pre- and Postoperative Scans | ||||||||
| Adipose tissue | |||||||||
| ΔVAT | p | ΔSAT | p | ΔATR | p | ||||
| Mean (SD) | Mean (SD) | Mean (SD) | |||||||
| Complications | Yes | −48.96 (32.39) | 0.905 | −31.62 (28.17) | 0.234 | −34.31 (23.47) | 0.849 | ||
| No | −50.63 (22.07) | −22.14 (24.26) | −30.71 (35.93) | ||||||
| Major Complications | Yes | −49.92 (32.68) | 0.544 | −30.53 (29.56) | 0.477 | −34.22 (30.01) | 0.802 | ||
| No | −48.65 (26.42) | −27.40 (24.51) | −28.13 (37.15) | ||||||
| Anastomotic leakage | Yes | −57.41 (41.51) | 0.268 | −32.91 (40.58) | 0.860 | −48.54 (41.66) | 0.069 | ||
| No | −47.74 (27.32) | −28.44 (24.38) | −28.16 (30.42) | ||||||
| Pneumonia | Yes | −46.44 (36.37) | 0.681 | −37.81 (25.74) | 0.281 | −22.53 (47.17) | 0.322 | ||
| No | −50.77 (26.85) | −25.16 (27.44) | −35.89 (23.48) | ||||||
| Muscle tissue | |||||||||
| ΔPMA | p | ΔPMV | p | ΔTAMA | p | ΔLSMI | p | ||
| Mean (SD) | Mean (SD) | Mean (SD) | Mean (SD) | ||||||
| Complications | Yes | −8.08 (16.15) | 0.063 | −8.03 (23.74) | 0.803 | −7.63 (10.13) | 0.105 | −63.29 (10.38) | 0.886 |
| No | 1.20 (14.29) | −7.19 (14.61) | −1.59 (10.85) | −37.24 (99.82) | |||||
| Major Complications | Yes | −6.68 (15.52) | 0.369 | −10.39 (23.36) | 0.552 | −8.17 (10.61) | 0.168 | −63.60 (11.10) | 0.490 |
| No | −4.40 (17.12) | −4.00 (19.06) | −3.29 (10.03) | −47.24 (77.14) | |||||
| Anastomotic leakage | Yes | −14.78 (18.76) | 0.183 | −20.04 (38.23) | 0.568 | −15.04 (12.09) | 0.032 | −61.50 (19.44) | 0.319 |
| No | −3.85 (15.07) | −5.15 (15.72) | −4.26 (9.34) | −55.64 (55.36) | |||||
| Pneumonia | Yes | −12.79 (20.45) | 0.145 | −2.72 (24.04) | 0.362 | −9.13 (9.43) | 0.158 | −62.52 (13.75) | 0.747 |
| No | −2.39 (12.61) | −10.46 (20.38) | −4.67 (10.87) | −53.88 (61.15) | |||||
Publisher’s Note: MDPI stays neutral with regard to jurisdictional claims in published maps and institutional affiliations. |
© 2021 by the authors. Licensee MDPI, Basel, Switzerland. This article is an open access article distributed under the terms and conditions of the Creative Commons Attribution (CC BY) license (https://creativecommons.org/licenses/by/4.0/).
Share and Cite
Fehrenbach, U.; Wuensch, T.; Gabriel, P.; Segger, L.; Yamaguchi, T.; Auer, T.A.; Beetz, N.L.; Denecke, C.; Kröll, D.; Raakow, J.; et al. CT Body Composition of Sarcopenia and Sarcopenic Obesity: Predictors of Postoperative Complications and Survival in Patients with Locally Advanced Esophageal Adenocarcinoma. Cancers 2021, 13, 2921. https://doi.org/10.3390/cancers13122921
Fehrenbach U, Wuensch T, Gabriel P, Segger L, Yamaguchi T, Auer TA, Beetz NL, Denecke C, Kröll D, Raakow J, et al. CT Body Composition of Sarcopenia and Sarcopenic Obesity: Predictors of Postoperative Complications and Survival in Patients with Locally Advanced Esophageal Adenocarcinoma. Cancers. 2021; 13(12):2921. https://doi.org/10.3390/cancers13122921
Chicago/Turabian StyleFehrenbach, Uli, Tilo Wuensch, Pia Gabriel, Laura Segger, Takeru Yamaguchi, Timo Alexander Auer, Nick Lasse Beetz, Christian Denecke, Dino Kröll, Jonas Raakow, and et al. 2021. "CT Body Composition of Sarcopenia and Sarcopenic Obesity: Predictors of Postoperative Complications and Survival in Patients with Locally Advanced Esophageal Adenocarcinoma" Cancers 13, no. 12: 2921. https://doi.org/10.3390/cancers13122921
APA StyleFehrenbach, U., Wuensch, T., Gabriel, P., Segger, L., Yamaguchi, T., Auer, T. A., Beetz, N. L., Denecke, C., Kröll, D., Raakow, J., Knitter, S., Chopra, S., Thuss-Patience, P., Pratschke, J., Hamm, B., Biebl, M., & Geisel, D. (2021). CT Body Composition of Sarcopenia and Sarcopenic Obesity: Predictors of Postoperative Complications and Survival in Patients with Locally Advanced Esophageal Adenocarcinoma. Cancers, 13(12), 2921. https://doi.org/10.3390/cancers13122921