Simple Summary
The incidence of adenocarcinomas of the GE-junction (AEG) increases evermore over the recent decades in the Western world. The postoperative tumor stage with or without multimodal treatment provides important information with regard to post-therapeutic survival. However, this tumor staging may be influenced by the histologic tumor subtype. These subtypes were described by Lauren before and provide substantial prognostic information in gastric cancer patients. The Lauren classification, however, was not yet evaluated in AEG before the purpose of the present retrospective analysis. It was confirmed in a cohort of 1153 AEG patients that Lauren subtypes convey substantial prognostic information after surgical resection. Furthermore, a simplified sub-classification into differentiated and undifferentiated histotypes was developed and evaluated. This newly proposed sub-classification system requires further confirmation by multicentric re-evaluation analyses.
Abstract
Adenocarcinoma of the gastroesophageal junction (AEG) ranks among the most common cancers in the Western world with increasing incidence. However, the prognostic influence and applicability of the Lauren classification was not examined in detail before. The purpose of this analysis was to analyze the oncologic outcomes of GE-junction cancer related to the Lauren histotype in a large single center cohort. Data from the prospectively documented database of the Klinikum Rechts der Isar (TUM School of Medicine) for patients undergoing curatively intended oncologic resection for GE-junction cancer between 1984 and 2018 were extracted. Univariate and multivariate regression analyses were performed to identify predictors for overall survival. Kaplan-Meier analyses were done to investigate the survival rates according to the Lauren histotype. After identification of two distinct histologic categories with prognostic implications, propensity score matching (PSM) was performed to balance for confounders and evaluate its oncologic outcomes retrospectively. In the time period indicated, 1710 patients were treated for GE-junction cancer. Exclusion criteria were: R2-resections (n = 134), metastatic disease (n = 296), 30-day mortality (n = 45), Siewert type I (n = 21), and missing/incomplete data (n = 61). Finally, 1153 patients were analyzed. In a multiple variable analysis, age, UICC-stage, all Lauren histotypes, R-stage, and postoperative complications were significant predictors of overall survival. Kaplan Meier analysis demonstrated significant survival differences between intestinal, diffuse, and mixed Lauren-histotypes (p = 0.001 and p = 0.029). Survival rates were comparable between non-classifiable and intestinal Lauren-types (p = 0.16) and between diffuse and mixed types (p = 0.56). When combining non-classifiable, well, and moderately differentiated Lauren-types and combining poorly differentiated intestinal, diffuse, and mixed types, two highly prognostic groups were identified (p < 0.0001). This was confirmed after PSM for possible confounders. The Lauren histotypes demonstrate highly prognostic value after oncologic resection of GE-junction cancer (Siewert type II and type III) in a single center Western patient cohort. A simplified histotype classification based on Lauren subtypes revealed a clear distinction of prognostic groups and should be considered for further evaluation.
1. Introduction
Adenocarcinomas of gastroesophageal junction (AEG) are an increasing tumor entity in the western world [1] in contrast to Eastern Asia. The Lauren classification is the most common histological classification of gastric cancer and distinguishes between types: intestinal, diffuse, and mixed types [2]. Another commonly applied histologic classification was published by the World Health Organization (WHO) [3]. Part of the current scientific discussion is a unification of the different classifications [4]. With regard to gastric cancer, it has been shown in recent years that the Lauren classification has prognostic impact. Furthermore, it was shown that Lauren subtypes respond differently to chemotherapy [5,6,7,8,9,10]. However, this was demonstrated in mostly retrospective patient data, since large therapy studies were not adequately powered for subgroup analyses regarding the different Lauren subtypes [11,12,13,14]. Since the tumors of the gastroesophageal junction (GEJ) are partly considered gastric carcinomas, the Lauren classification is traditionally applied here as well. Several analyses were carried out in recent years to determine whether tumors of the GEJ should be classified as gastric carcinomas or esophageal carcinomas. In this context, both molecular biological patterns and prognostic behaviors were researched before [15,16,17]. Hitherto, no clear consensus was reached if AEG belongs to gastric cancer, esophageal cancer, or if they even represent an own entity. However, to the authors’ knowledge, no validation to apply the Lauren classification in AEG for prognostic implications was carried out yet. Since neither the applicability nor the prognostic value of the Lauren classification has been investigated in AEG yet, the authors aimed to clarify these issues by analyzing a large single center cohort from a specialized tertiary treatment center.
2. Results
1710 patients who were treated for GE-junction malignancy were identified from the institutional database in a period from 1984 to 2018. Finally, after removing patients meeting the exclusion criteria (R2-resection (n = 134), metastatic disease (n = 296), 30-day mortality (n = 45), Siewert type I (n = 21), and missing/incomplete data (n = 61)) 1153 patients were available for analysis. These were 666 patients with a Lauren intestinal type, 172 patients of a Lauren diffuse type, 127 patients of a Lauren mixed type, and 188 patients who could not be classified according to Lauren. The analysis of the baseline characteristics showed significant differences between Lauren subtypes regarding gender distribution, comorbidities, tumor-localization (diffuse type was more frequent in Siewert type III), neoadjuvant treatment, and surgery type. There were more advanced pT-stages and UICC-stages in Lauren diffuse types and mixed types. Well and moderately differentiated types were more frequent for intestinal and non-classified types, and higher R1 rates were identified for diffuse and mixed subtypes. No significant differences were found regarding D2-lymphadenectomy rates, age distributions, and postoperative complication rates (Table 1).

Table 1.
Baseline characteristics for patients with respective Lauren subtypes before propensity score matching (PSM).
Median follow-up was 34 months (range 1–273 months), comprising of 79 months (range 1–273 months) for survivors and 22 months (range 1–219) for deceased patients. During the follow-up period, 664 patients (57.6%) died, the five-year survival rate (FYSR) was 44%, and the ten-year survival rate (TYSR) was 26%. Median survival was 90 months for patients with a non-classifiable Lauren type (55/37% FYSR/TYSR), 58 months for intestinal type (45/27% FYSR/TYSR), 31 months for diffuse type (34/17% FYSR/TYSR), and 38 months for a mixed Lauren type (37/24% FYSR/TYSR).
Kaplan Meier analysis revealed no statistically significant survival differences between non-classifiable and intestinal G1 and G2 subtypes (HR 1.0 vs. HR 1.02, CI95% 0.69–1.51, p = 0.93 for non-classifiable vs. intestinal G1 type, HR 1.02, CI95% 0.69–1.51 vs. HR 1.04, CI95% 0.80–1.35, p = 0.92 for intestinal G1 type vs. intestinal G2 types). Patients with poorly differentiated intestinal types (G3), diffuse types, and mixed types did not show significant survival differences between each other (HR 1.43, CI95% 1.10–1.86 vs. HR 1.68, CI95% 1.27–2.23, p = 0.18, G3 intestinal vs. diffuse and HR 1.68, CI95% 1.27–2.23 vs- HR 1.55, CI95% 1.14–2.11, p = 0.56, diffuse vs. mixed types, Figure 1). Based on these observations, these subgroups were summarized into two prognostically relevant groups (simplified Lauren types): Differentiated type (non-classifiable, intestinal G1 and intestinal G2 types) vs. undifferentiated type (intestinal G3, diffuse, and mixed type). These groups were statistically significant prognosticators of survival (HR 1.49, CI95% 1.28–1.73, p < 0.0001, Figure 2).
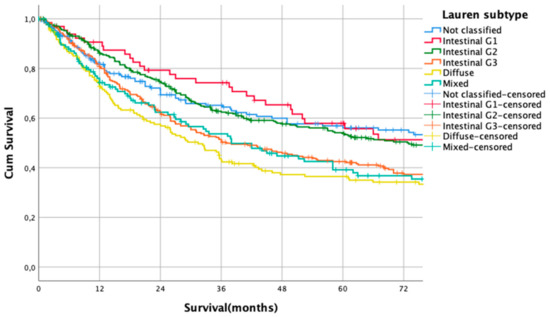
Figure 1.
Survival curves for Lauren subtypes. HR 1.0 vs. HR 1.02, CI95% 0.69–1.51, p = 0.93 for non-classifiable vs. intestinal G1 type, HR 1.02, CI95% 0.69–1.51 vs. HR 1.04, CI95% 0.80–1.35, p = 0.92 for intestinal G1 type vs. intestinal G2 types. HR 1.43, CI95% 1.10–1.86 vs. HR 1.68, CI95% 1.27–2.23, p = 0.18. G3 intestinal vs. diffuse and HR 1.68, CI95% 1.27–2.23 vs. HR 1.55, CI95% 1.14–2.11, p = 0.56, diffuse vs. mixed types.
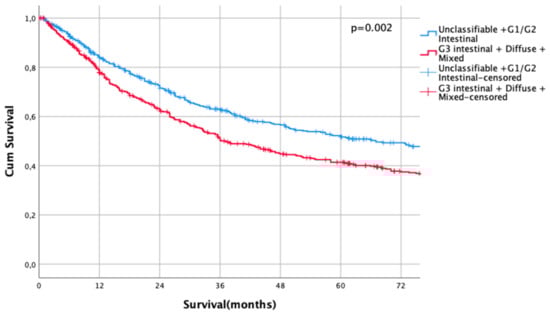
Figure 2.
Survival curves for differentiated/undifferentiated subtypes after propensity score matching (PSM). Differentiated type (unclassifiable Lauren type, Lauren intestinal type G1 and G2) vs. Undifferentiated type (Lauren intestinal type, diffuse type, and mixed type). HR 1.31, CI95% 1.11–1.54, p = 0.002.
In order to analyze independent survival predictors, the following variables were included in the cox regression analysis: Age, Siewert type, gender, neoadjuvant therapy, Lauren subtype, lymph node dissection, UICC stage, R-status, grading, comorbidity, and complications. pT-stages and pN-stages were not included since these factors were cumulated in the UICC stage. All factors were entered in the multivariate model without selections. Univariate regression analysis revealed age, localization, Lauren histotype, D2-dissection, UICC stage, R-status, grading, and occurrence of post-operative complications to be significantly associated with post-therapeutic survival. The multiple variable analysis showed that age, Lauren subtype, UICC stage, R-status, and postoperative complications were independent survival predictors (Table 2).
Table 2.
Univariate and multivariate regression analysis for OS.
After identification of two distinct subtypes (differentiated/undifferentiated), baseline characteristics were re-analyzed. In the comparison of both groups, there were significant differences for the following baseline characteristics: Gender, comorbidities, tumor localization, type of surgery performed, pT-/pN-/UICC-stages, grading, and R0 resection rates. Age, type, and number of patients receiving neoadjuvant therapies, the number of dissected lymph nodes, and postoperative complication rates were equally distributed (Table 3). In order to overcome potential confounders due to these differences, the two cohorts were matched by adjusting for these potentially confounding factors: Gender, localization, and R-status.
Table 3.
Baseline characteristics for patients with differentiated/undifferentiated histotypes before propensity score matching (PSM).
Results after Propensity Score Matching (PSM)
Those variables demonstrating clinically meaningful baseline differences within the respective Lauren subgroups were matched through PSM (gender, location, R-status) to balance possible confounders. The matching algorithm matched 471 patients each in the differentiated and undifferentiated subtype groups. Analysis of the baseline characteristics demonstrated that the following variables were then well balanced in all groups: gender, age distribution, comorbidities, tumor localization, neoadjuvant therapies, D2 dissection rate, post-operative complications, and R0 status. The results are shown in Table 3 and Table 4. The post PSM balancing analysis revealed adequate matching of the respective variables (covariate balancing plots and matching data are shown in Supplemental Figure S1 and Table S1).
Table 4.
Baseline characteristics for patients with differentiated/undifferentiated histotypes after PSM.
Median follow-up was 35 months (range 1–273 months), comprising of 83 months (range 1–273 months) for survivors and 22 months (range 1–218) months for deceased patients (p < 0.0001). During the follow-up period, 560 patients (58.5%) died, the FYSR was 44%, and the TYSR was 26%. Median survival was 67 months for patients with a differentiated histotype and 37 months for patients with an undifferentiated subtype (HR 1.31, CI95% 1.11–1.54, p = 0.002) (Figure 2). FYSR/TYSR for differentiated/undifferentiated subtypes were 49/29% and 38/23%, respectively.
The UICC stage-dependent analysis revealed no significant survival differences for UICC stages I and II (UICC I: median survival not met for differentiated type vs. 216 months in undifferentiated types, HR 0.79, CI95% 0.5–1.27, p = 0.33, Figure 3, UICC II: median survival 60 months (differentiated type) vs. 67 months (undifferentiated type), HR 1.00, CI95% 0.73–1.36, p = 0.996, Figure 4). In UICC III, there was a statistically significant survival difference between differentiated and undifferentiated types. Median survival was 25 months (differentiated type) vs. 16 months (undifferentiated type) (HR 1.32, CI95% 1.05–1.64, p = 0.016) (Figure 5). FYSR and TYSR were 26/7% in differentiated types vs. 15/10% in undifferentiated types in the UICC III stage.
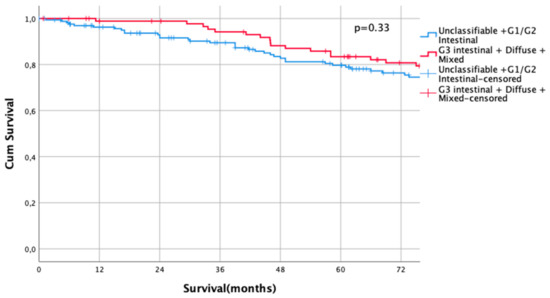
Figure 3.
Survival curves for differentiated/undifferentiated subtypes after propensity score matching (PSM) in UICC I stage. Survival UICC I (n = 260) for a differentiated type (unclassifiable Lauren type, Lauren intestinal type, G1 and G2) vs. undifferentiated type (Lauren intestinal type, diffuse type, and mixed type). HR 0.79, CI95% 0.5–1.27, p = 0.33.
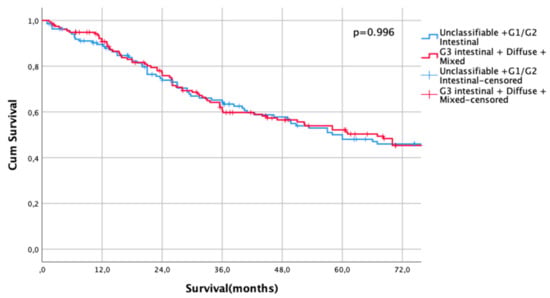
Figure 4.
Survival curves for differentiated/undifferentiated subtypes after propensity score matching (PSM) in UICC II stage. Survival UICC II (n = 291) for a differentiated type (unclassifiable Lauren type, Lauren intestinal type G1 and G2) vs. undifferentiated type (Lauren intestinal type, diffuse type, and mixed type). HR 1.00, CI95% 0.73–1.36, p = 0.996.
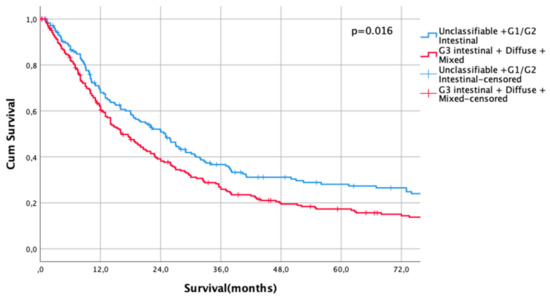
Figure 5.
Survival curves for differentiated/undifferentiated subtypes after PSM in UICC III stage. Survival UICC III (n = 407) for a differentiated type (unclassifiable Lauren type, Lauren intestinal type G1 and G2) vs. undifferentiated type (Lauren intestinal type, diffuse type, and mixed type). HR 1.32, CI95% 1.05–1.64, p = 0.016.
The univariate analysis of the PSM-cohort demonstrated that age, undifferentiated type, UICC-stage, R1-resection, grading, and occurrence of postoperative complications were significantly related to overall survival. In the multivariate model age, undifferentiated type and UICC-stage were demonstrated to be independent prognostic variables with regard to overall survival (Supplemental Table S2).
3. Discussion
This retrospective analysis of a large single center patient cohort of 1153 patients demonstrates that the Lauren subtype is a significant and independent prognostic variable related to overall survival of adenocarcinoma at the gastroesophageal junction. Besides this, a novel simplified categorization of the Lauren subtypes into a differentiated and undifferentiated category was demonstrated to be independently and significantly related to overall survival. This was demonstrated by multivariate cox regression and Kaplan Meier analyses. The analysis of the respective Lauren subtypes showed that a simplified model can be formed due to similar plotting of the respective survival curves. It was shown that intestinal subtypes with good and moderate differentiation and non-classifiable tumors were comparable regarding survival outcome and were, therefore, pooled in a group of a differentiated category. Poorly differentiated intestinal types, diffuse types, and mixed types demonstrated (statistically) similar survival outcomes and were, therefore, summarized for the undifferentiated category, which proved to be prognostically significant in a propensity score matched cohort.
It was not yet shown that the Lauren classification would be applicable for AEG. This analysis revealed that the Lauren subtypes convey important prognostic implications similar to gastric cancer patients for AEG, which is predominantly evident in the Western world. The Lauren classification is a histological classification introduced in 1965 for adenocarcinoma of the stomach and defines three subtypes: intestinal, diffuse, and mixed type adenocarcinomas [2]. Another simplified version was proposed by Nakamura in 1968, which resembles the two histologic categories in the present analysis [18]. Nonetheless, the Nakamura classification was not yet evaluated for applicability in AEG either. The important finding of the present analysis is that there are marked differences between the novel proposed categories. The predominant proportion of male patients is reduced in patients with the undifferentiated category. The undifferentiated types were more located in the sub-cardial parts of the GE-junction and differentiated types revealed to be less advanced (in terms of UICC, pT-stages, and pN-stages) in the histologic workup after resection, and R0 resection rates were higher in the differentiated category. The differences regarding UICC-stages were confirmed after the possibly confounding factors were balanced by PSM, creating comparable groups with regard to gender, localization, and R-staging. The rationale for applying PSM was based on literature recommendations. Most experts in the field of PS-matching describe four relevant methods to estimate treatment effects: matching, stratification (or subclassification), weighting, and covariate adjustment using the propensity score. Weighting and covariate adjustment were ruled out in the setting of the present analysis because these methods use the propensity score directly for estimating the effect of treatment. PSM and stratification use the propensity score for grouping subjects but not estimating the effect of treatment, which was intended here (grouping patients without estimating treatment effects). Furthermore, it was described that weighting and covariate adjustments may be more sensitive to misspecification of the propensity score model than matching and stratification [19,20,21,22]. It was not intended to balance for UICC-stages in order to describe the biologic behaviors of the novel proposed and simplified histologic categories. Therefore, it was shown that, in the stage-dependent survival analysis, the prognostic effect of the simplified categories was evident only in UICC III. Taking these observations into consideration, it can be stated that, in earlier UICC-stages, the Lauren classification or simplified histotypes do not have the same prognostic relevance as in more advanced stages. The present data further imply that the cancer progression is biologically more aggressive in the undifferentiated category. The relevance for clinical practice would be to provide narrower follow-up intervals to these patients in order to detect early recurrence or cancer progression. It remains elusive if different or more aggressive chemotherapy protocols in the perioperative setting should be offered to those patients in the undifferentiated histologic category. It may be speculated that most of the chemotherapy regimens presently available may be effective at all, as it was shown before that poorly cohesive tumors/tumors with signet ring-cell-like histology in gastric cancer do not respond very well to currently approved chemotherapy regimens, such as FLOT [5,8,23,24]. This is also reflected by the results of the multiple variable analysis in the present cohort, which failed to demonstrate a beneficial effect.
Certainly, this analysis has multiple limitations, which are not only the monocentric and retrospective character, but also the long observation period during which both surgical and perioperative regimens have changed. Although potential biases inherent to the different baseline characteristics of the two histologic categories were possibly corrected by PSM, this method cannot compensate for unconscious and biological biases or for undetermined factors. More than that, it is critical that the PSM resulted in a smaller number of patients per group than in the primary analysis. Therefore, no exact statements can be made about unmatched patients. Another limitation is that the PS-matching did not balance adequately for the UICC-stages, so that the balance is skewed toward more advanced cases in the undifferentiated subtype group, which might limit further conclusions regarding survival prognosis. Furthermore, generalizability of the present results is certainly restricted, as AEG is predominantly evident in the Western world and the findings are not transferable to Asian patients due to ethnicity and more importantly due to the fact that AEG incidence is still considerably low in countries such as Korea, Japan, and China. Besides this, perioperative chemotherapeutic regimens have changed over time and, therefore, its effect was not studied in this analysis.
Taking these limitations and findings into consideration, a future study should focus on multicentric evaluations of the proposed simplified histologic categories. In future prospective studies, this model should be further evaluated to better assess its significance with regard to therapeutic decisions.
4. Materials and Methods
4.1. Patients
The prospectively documented gastric cancer database at the surgical Department of TUM, Munich, Germany was screened for patients with adenocarcinoma of the GE-junction (AEG) undergoing surgery between 1984 and 2018 to identify eligible patients for this retrospective analysis. Clinical data was entered into the database after discharge and based on patient charts and records. Inclusion criteria were: Histologically proven GE-junction cancer (Siewert type II and III), curatively intended resections (R0/R1), and a documented histological type, according to Lauren. Exclusion criteria were: R2 resections (n = 134), metastatic disease (n = 296), 30-day mortality (n = 45), Siewert Type I (n = 21), and missing or incomplete data (n = 61). The patient inclusion flow chart is depicted in Supplemental Figure S2.
All patients underwent multidisciplinary team review ahead of treatment after staging was performed by endoscopy, an endoscopic ultrasound, and a CT scan. For locally advanced cancer, multimodal therapy (neoadjuvant/perioperative chemotherapy or radiotherapy) was recommended based on the German S3-guideline. Neoadjuvant/perioperative treatment consisted of either two preoperative cycles of cisplatin or oxaliplatin/leucovorin/5-FU (PLF/OLF) or three pre-operative and post-operative cycles of ECX/ECF (MAGIC) or four pre-operative and post-operative cycles of FLOT. In case of chemoradiation, the CROSS protocol (Ref) was applied. All surgical procedures were performed according to the Japanese gastric cancer treatment guideline including D2-lymphadenectomy. The surgical procedure was extended to the distal esophagus if intra-operative frozen sections demonstrated an oral margin infiltration until an intra-operative R0 situation was confirmed by a frozen section. In case of tumor extension of more than 5 cm (as determined by clinical staging) into the distal esophagus, an Ivor-Lewis procedure was performed including a two-field lymphadenectomy. All resected specimens were examined by one or two specialized pathologists, classified according to the TNM-classification and staged according to UICC-recommendations (8th edition). Patients were followed for 60 months from the day of surgery every six to twelve months in a dedicated outpatient department (Roman Herzog Comprehensive Cancer Center) by endoscopy and CT scans, according to the institutional protocol. Survival data was collected based on either additional visits or phone contacts. The dataset consisted of patients’ gender, age, tumor location, application of neoadjuvant chemoradiation or chemotherapy, type of surgery (esophagectomy, gastrectomy with transhiatal extension, gastrectomy), type of required extension (none, luminal/transhiatal, splenectomy, colon, pancreas, others), number of dissected lymph nodes, D2 lymphadenectomy success rate, postoperative complications (none, Clavien–Dindo Grade I/II and III/IV), pT-(pT1/pT2/pT3/pT4), pN-(pN0/pN1/pN2/pN3a), and UICC-stages (UICC-I/-II/-III), grading (G1/2, G3/4), R-status (R0/R1), Lauren histotype (intestinal, diffuse, mixed, unclassifiable), and follow-up period with a survival status.
4.2. Statistical Analyses
Descriptive statistics on demographic and clinical tumor characteristics were calculated as the mean ± standard deviation (continuous variables) and frequencies (categorical variables). Survival time was calculated from the day of surgery to death or last follow-up date. The Kaplan-Meier method was used to estimate survival probabilities stratified by the application of neoadjuvant/perioperative chemotherapy. The log-rank test was used to compare the estimated survival. Survival prognosticators were analyzed by univariate and multivariate cox regression analyses. Variables entered into the model were age, Siewert type II and III, gender, neoadjuvant chemotherapy, Lauren subtype (differentiated/undifferentiated type in the PSM cohort), D2 dissection, UICC-stage, R-status, grading, comorbidity, and postoperative complications. After univariate analysis, all variables were entered in the multivariate model. After the primary analysis, the two groups (differentiated/undifferentiated type) demonstrated marked baseline differences, which were balanced for the clinically most relevant confounders (Gender, localization, R-status). The groups were matched by a “nearest neighbor” 1:1 matching with a 0.1 caliper. After PSM, data from 958 patients were reanalyzed after exclusion of 195 patients. All statistical analyses were performed using SPSS version 25 (IBM Inc., Ehningen, Germany). p-values less than 0.05 were considered statistically significant. This retrospective analysis was approved by the local Instituional Review Board (IRB) (No.364/20s; Ethikkommission der Fakultät für Medizin, TUM School of Medicine).
5. Conclusions
In conclusion, the present findings demonstrate that Lauren subtypes might be relevant prognostic factors in gastroesophageal cancer outcomes. Data from this analysis suggest that there might be two different histopathologic categories (differentiated/undifferentiated) with a prognostic impact. These proposed categories require further validation in multicenter cohorts. Their prognostic abilities to predict outcomes of neoadjuvant therapies are to be evaluated.
Supplementary Materials
The following are available online at https://www.mdpi.com/2072-6694/13/6/1303/s1. Supplemental Figure S1: Covariate Balancing of the Propensity Score matching variables. Supplemental Figure S2: Flow diagram of patient database extraction. Supplemental Table S1: Propensity Score Balancing data. Supplemental Table S2: Univariate and multivariate regression analysis for OS in a PSM cohort.
Author Contributions
Conceptualization, R.S. and A.N. Data curation, J.S.-H. and D.R. Formal analysis, D.R. Investigation, R.S. Project administration, D.R. Resources, H.F. Supervision, A.N. and H.F. Validation, D.R. Writing—original draft, R.S. and D.R. Writing—review & editing, A.N., J.S.-H., and H.F. All authors have read and agreed to the published version of the manuscript.
Funding
This research received no external funding.
Institutional Review Board Statement
The study was conducted according to the guidelines of the Declaration of Helsinki, and approved by the Ethics Committee of Faculty of Medicine, Technical University Munich (protocol code 346/20 S-EB, date of approval 1 July 2020).
Informed Consent Statement
Patient consent was waived due to the retrospective nature of this study according to §27 Bayerisches Krankenhausgese.
Data Availability Statement
The data presented in this study are available on request from the corresponding author. The data are not publicly available due to the European General Data Protection Regulation (GDPR).
Conflicts of Interest
The authors declare no conflict of interest.
References
- Bray, F.; Ferlay, J.; Soerjomataram, I.; Siegel, R.L.; Torre, L.A.; Jemal, A. Global cancer statistics 2018: GLOBOCAN estimates of incidence and mortality worldwide for 36 cancers in 185 countries. CA Cancer J. Clin. 2018, 68, 394–424. [Google Scholar] [CrossRef]
- Laurén, P. The two histological main types of gastric carcinoma: Diffuse and so-called intestinal-type carcinoma. Acta Pathol. Microbiol. Scand. 1965, 64, 31–49. [Google Scholar] [CrossRef]
- Nagtegaal, I.D.; Odze, R.D.; Klimstra, D.; Paradis, V.; Rugge, M.; Schirmacher, P.; Washington, M.K.; Carneiro, F.; Cree, I.A.; The WHO Classification of Tumours Editorial Board. The 2019 WHO classification of tumours of the digestive system. Histopathology 2020, 76, 182–188. [Google Scholar] [CrossRef] [PubMed]
- Mariette, C.; European Chapter of International Gastric Cancer Association; Carneiro, F.; Grabsch, H.I.; Van Der Post, R.S.; Allum, W.; De Manzoni, G. Consensus on the pathological definition and classification of poorly cohesive gastric carcinoma. Gastric Cancer 2018, 22, 1–9. [Google Scholar] [CrossRef] [PubMed]
- Jiménez Fonseca, P.; Carmona-Bayonas, A.; Hernández, R.; Custodio, A.; Cano, J.M.; Lacalle, A.; Echavarria, I.; Macias, I.; Mangas, M.; Visa, L.; et al. Lauren subtypes of advanced gastric cancer influence survival and response to chemotherapy: Real-world data from the AGAMENON National Cancer Registry. Br. J. Cancer 2017, 117, 775–782. [Google Scholar] [CrossRef] [PubMed]
- Lee, J.H.; Chang, K.K.; Yoon, C.; Tang, L.H.; Strong, V.E.; Yoon, S.S. Lauren Histologic Type Is the Most Important Factor Associated With Pattern of Recurrence Following Resection of Gastric Adenocarcinoma. Ann. Surg. 2018, 267, 105–113. [Google Scholar] [CrossRef] [PubMed]
- Msc, M.A.P.; Ramos, M.F.K.P.; Dias, A.R.; Cardili, L.; Ribeiro, R.R.E.; Charruf, A.Z.; De Castria, T.B.; Zilberstein, B.; Ceconello, I.; Alves, V.A.F.; et al. Lymph node regression after neoadjuvant chemotherapy: A predictor of survival in gastric cancer. J. Surg. Oncol. 2019, 121, 795–803. [Google Scholar] [CrossRef]
- Petrelli, F.; Berenato, R.; Turati, L.; Mennitto, A.; Steccanella, F.; Caporale, M.; Dallera, P.; De Braud, F.; Pezzica, E.; Di Bartolomeo, M.; et al. Prognostic value of diffuse versus intestinal histotype in patients with gastric cancer: A systematic review and meta-analysis. J. Gastrointest. Oncol. 2017, 8, 148–163. [Google Scholar] [CrossRef]
- Van der Kaaij, R.T.; Snaebjornsson, P.; Voncken, F.E.; van Dieren, J.M.; Jansen, E.P.; Sikorska, K.; Cats, A.; van Sandick, J.W. The prognostic and potentially predictive value of the Lauren classification in oesophageal adenocarcinoma. Eur. J. Cancer 2017, 76, 27–35. [Google Scholar] [CrossRef]
- Piessen, G.; Messager, M.; Leteurtre, E.; Jean-Pierre, T.; Mariette, C. Signet Ring Cell Histology is an Independent Predictor of Poor Prognosis in Gastric Adenocarcinoma Regardless of Tumoral Clinical Presentation. Ann. Surg. 2009, 250, 878–887. [Google Scholar] [CrossRef] [PubMed]
- Ronellenfitsch, U.; Schwarzbach, M.; Hofheinz, R.; Kienle, P.; Kieser, M.; Slanger, T.E.; Burmeister, B.; Kelsen, D.; Niedzwiecki, D.; Schuhmacher, C.; et al. Preoperative chemo(radio)therapy versus primary surgery for gastroesophageal adenocarcinoma: Systematic review with meta-analysis combining individual patient and aggregate data. Eur. J. Cancer 2013, 49, 3149–3158. [Google Scholar] [CrossRef] [PubMed]
- Rhuhmacher, C.; Gretschel, S.; Lordick, F.; Reichardt, P.; Hohenberger, W.; Eisenberger, C.F.; Haag, C.; Mauer, M.E.; Hasan, B.; Welch, J.; et al. Neoadjuvant chemotherapy compared with surgery alone for locally advanced cancer of the stomach and cardia: European Organisation for Research and Treatment of Cancer randomized trial 40954. J. Clin. Oncol. 2010, 28, 5210–5218. [Google Scholar] [CrossRef]
- Cunningham, D.; Allum, W.H.; Smith, D.B.; Langley, R.E.; Verma, M.; Weeden, S.; Chua, Y.J.; Stenning, S.P.; Thompson, J.N.; Van De Velde, C.J.; et al. Perioperative Chemotherapy versus Surgery Alone for Resectable Gastroesophageal Cancer. N. Engl. J. Med. 2006, 355, 11–20. [Google Scholar] [CrossRef]
- Ychou, M.; Boige, V.; Pignon, J.P.; Conroy, T.; Bouché, O.; Lebreton, G.; Ducourtieux, M.; Bedenne, L.; Fabre, J.M.; Saint-Aubert, B.; et al. Perioperative chemotherapy compared with surgery alone for resectable gastroesophageal adenocarcinoma: An FNCLCC and FFCD multicenter phase III trial. J. Clin. Oncol. 2011, 29, 1715–1721. [Google Scholar] [CrossRef]
- Cancer Genome Atlas Research. Integrated genomic characterization of oesophageal carcinoma. Nature 2017, 541, 169–175. [Google Scholar] [CrossRef]
- Gertler, R.; Stein, H.J.; Loos, M.; Langer, R.; Friess, H.; Feith, M. How to classify adenocarcinomas of the esophagogastric junction: As esophageal or gastric cancer? Am. J. Surg. Pathol. 2011, 35, 1512–1522. [Google Scholar] [CrossRef] [PubMed]
- Huang, Q.; Read, M.; Gold, J.S.; Zou, X.P. Unraveling the identity of gastric cardiac cancer. J. Dig. Dis. 2020, 21, 674–686. [Google Scholar] [CrossRef] [PubMed]
- Sugano, H.; Nakamura, K.; Kato, Y. Pathological studies of human gastric cancer. Acta Pathol. Jpn. 1982, 32, 329–347. [Google Scholar]
- Austin, P.C. The Relative Ability of Different Propensity Score Methods to Balance Measured Covariates Between Treated and Untreated Subjects in Observational Studies. Med. Decis. Mak. 2009, 29, 661–677. [Google Scholar] [CrossRef]
- Austin, P.C. An Introduction to Propensity Score Methods for Reducing the Effects of Confounding in Observational Studies. Multivar. Behav. Res. 2011, 46, 399–424. [Google Scholar] [CrossRef] [PubMed]
- Austin, P.C.; Stuart, E.A. Moving towards best practice when using inverse probability of treatment weighting (IPTW) using the propensity score to estimate causal treatment effects in observational studies. Stat. Med. 2015, 34, 3661–3679. [Google Scholar] [CrossRef]
- Wells, A.R.; Hamar, B.; Bradley, C.; Gandy, W.M.; Harrison, P.L.; Sidney, J.A.; Coberley, C.R.; Rula, E.Y.; Pope, J.E. Exploring Robust Methods for Evaluating Treatment and Comparison Groups in Chronic Care Management Programs. Popul. Health Manag. 2013, 16, 35–45. [Google Scholar] [CrossRef] [PubMed]
- Bencivenga, M.; Treppiedi, E.; Dal Cero, M.; Torroni, L.; Verlato, G.; Iglesias, M.; Renaud, F.; Tomezzoli, A.; Castelli, C.; Piessen, G.; et al. The amount of signet ring cells is significantly associated with tumour stage and survival in gastric poorly cohesive tumours. J. Surg. Oncol. 2020, 121, 1084–1089. [Google Scholar] [CrossRef] [PubMed]
- Al-Batran, S.-E.; Homann, N.; Pauligk, C.; Goetze, T.O.; Meiler, J.; Kasper, S.; Kopp, H.-G.; Mayer, F.; Haag, G.M.; Luley, K.; et al. Perioperative chemotherapy with fluorouracil plus leucovorin, oxaliplatin, and docetaxel versus fluorouracil or capecitabine plus cisplatin and epirubicin for locally advanced, resectable gastric or gastro-oesophageal junction adenocarcinoma (FLOT4): A randomised, phase 2/3 trial. Lancet 2019, 393, 1948–1957. [Google Scholar] [CrossRef] [PubMed]
Publisher’s Note: MDPI stays neutral with regard to jurisdictional claims in published maps and institutional affiliations. |
© 2021 by the authors. Licensee MDPI, Basel, Switzerland. This article is an open access article distributed under the terms and conditions of the Creative Commons Attribution (CC BY) license (http://creativecommons.org/licenses/by/4.0/).