
Could Ovarian Cancer Prediction Models Improve the Triage of Symptomatic Women in Primary Care? A Modelling Study Using Routinely Collected Data


Abstract
Simple Summary
Abstract
1. Introduction
2. Methods
2.1. Data Source
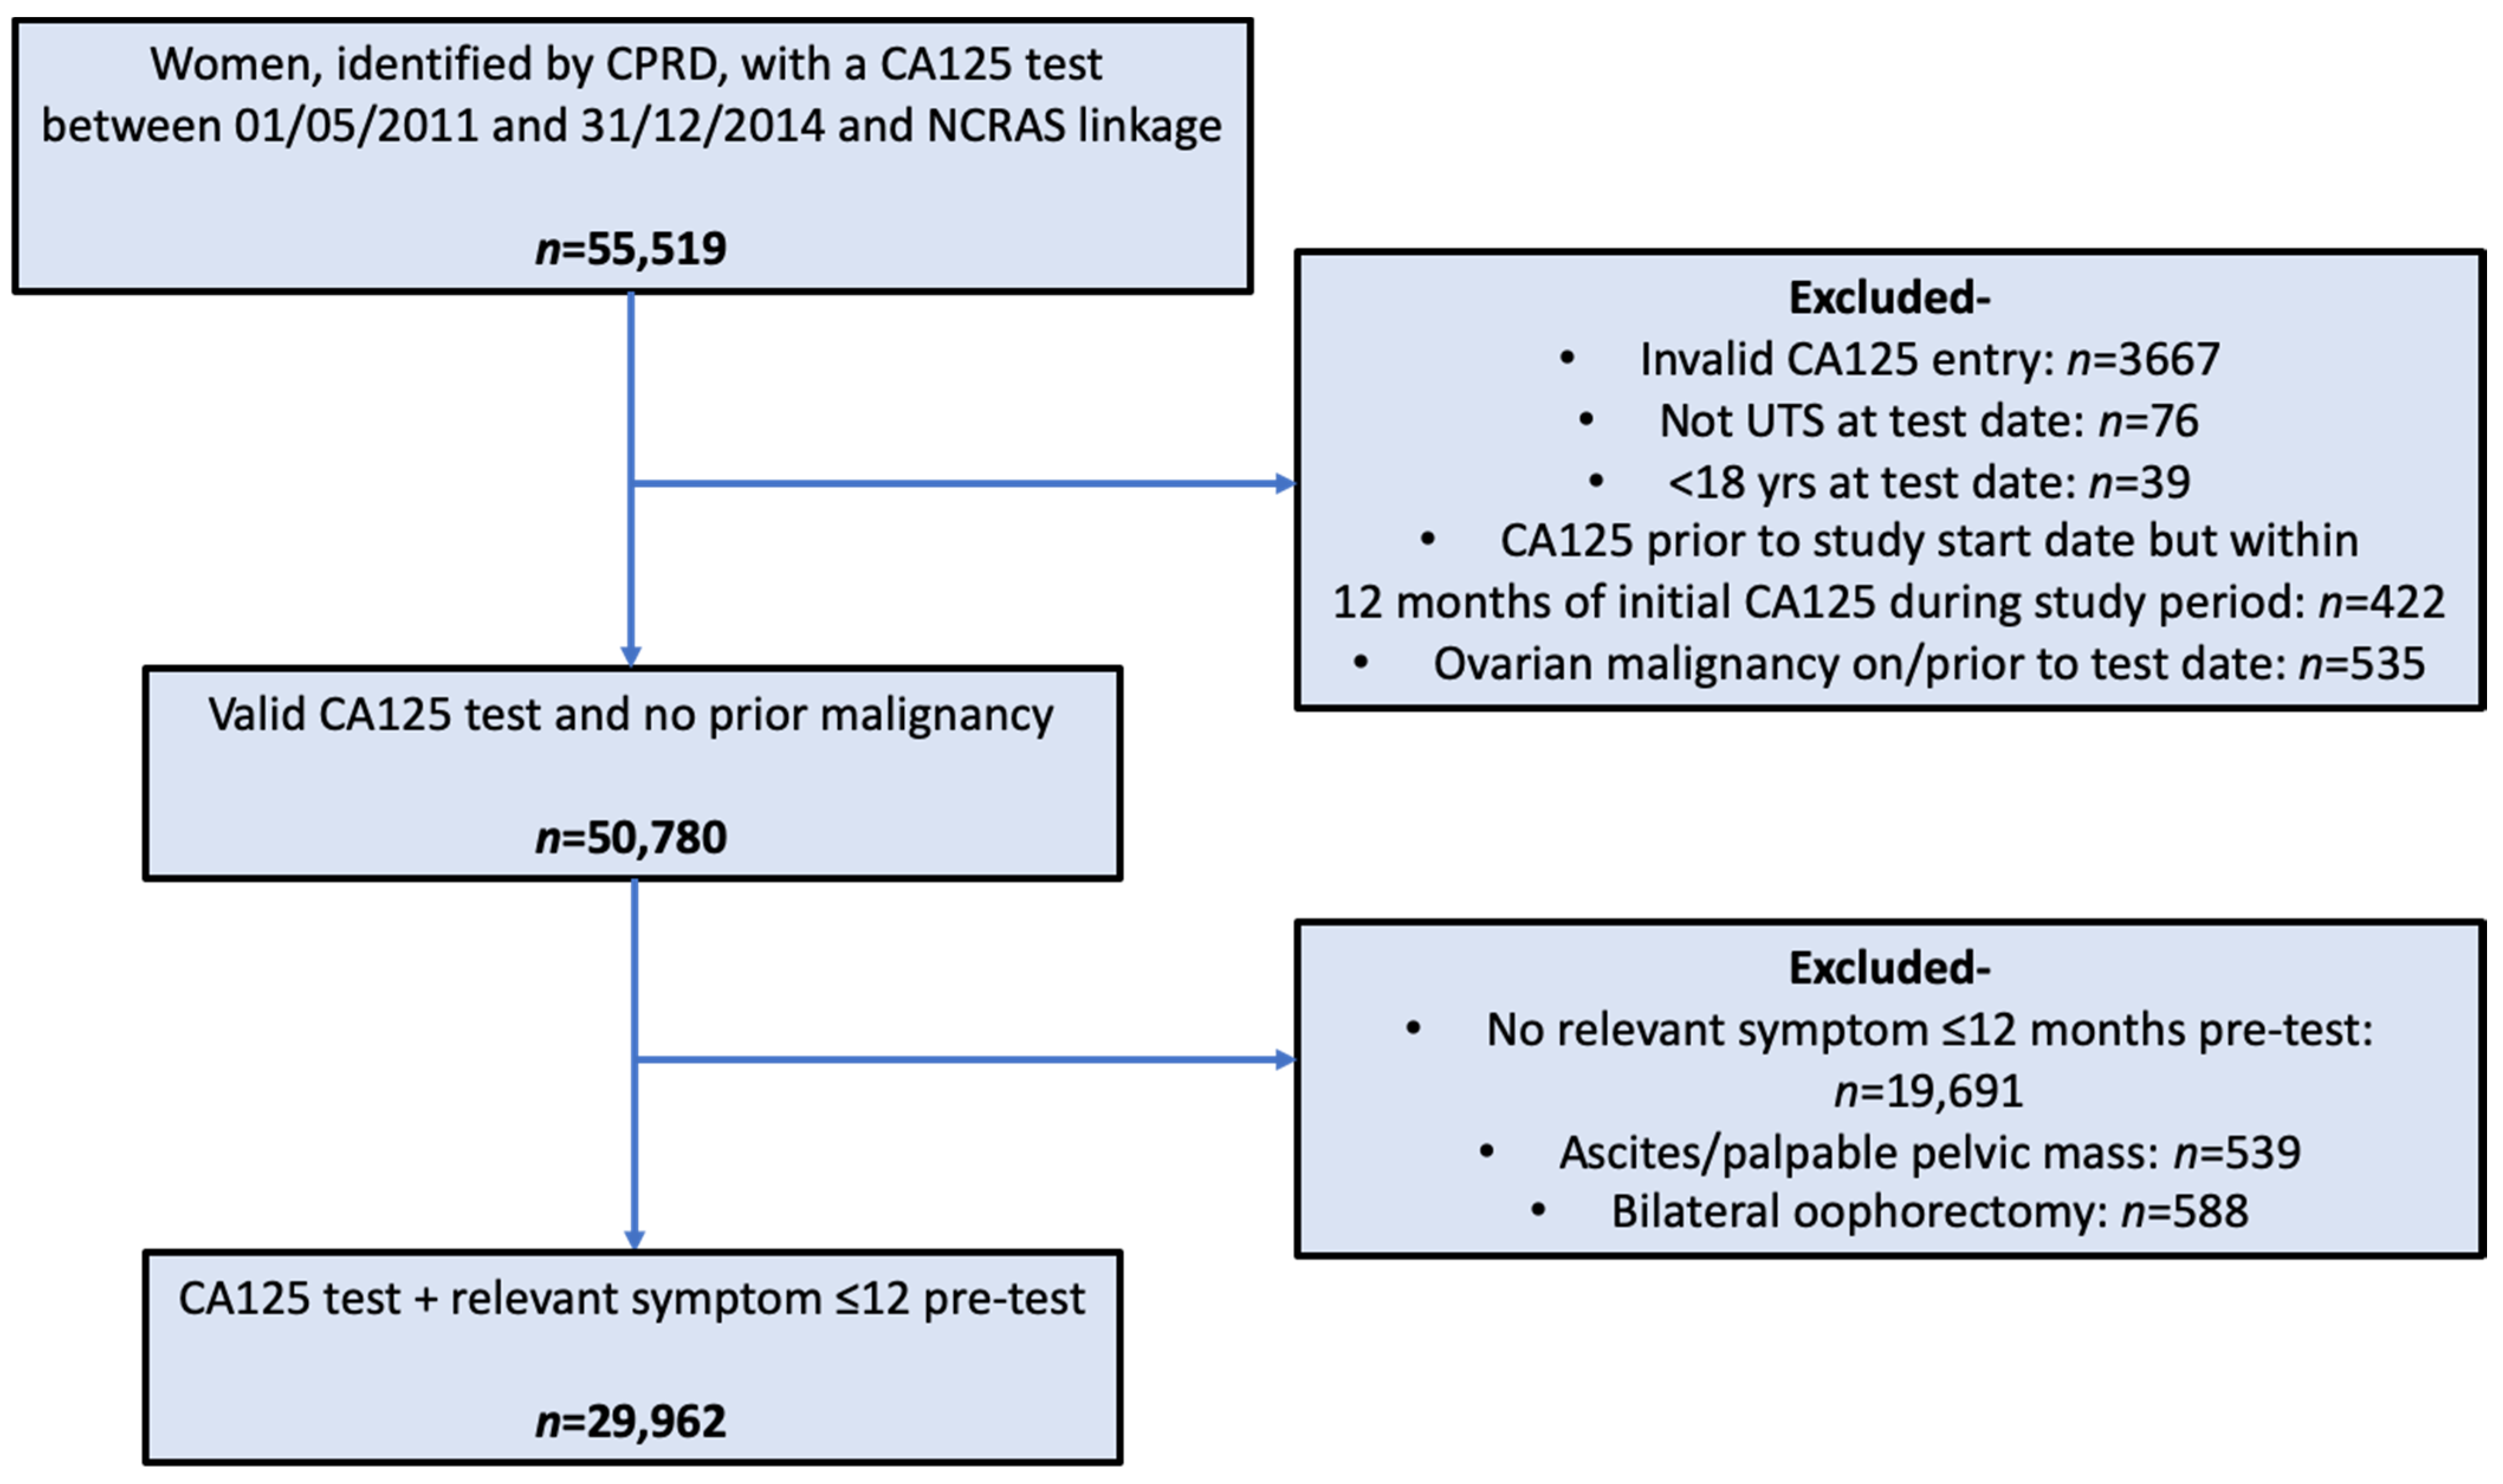
2.2. Participants
2.3. Outcome Definition
2.4. Prediction Models
2.4.1. Candidate Variables
2.4.2. Model Derivation and Internal Validation
2.4.3. Model Thresholds
3. Results
3.1. Predictor Variables
3.2. Model Discrimination and Calibration
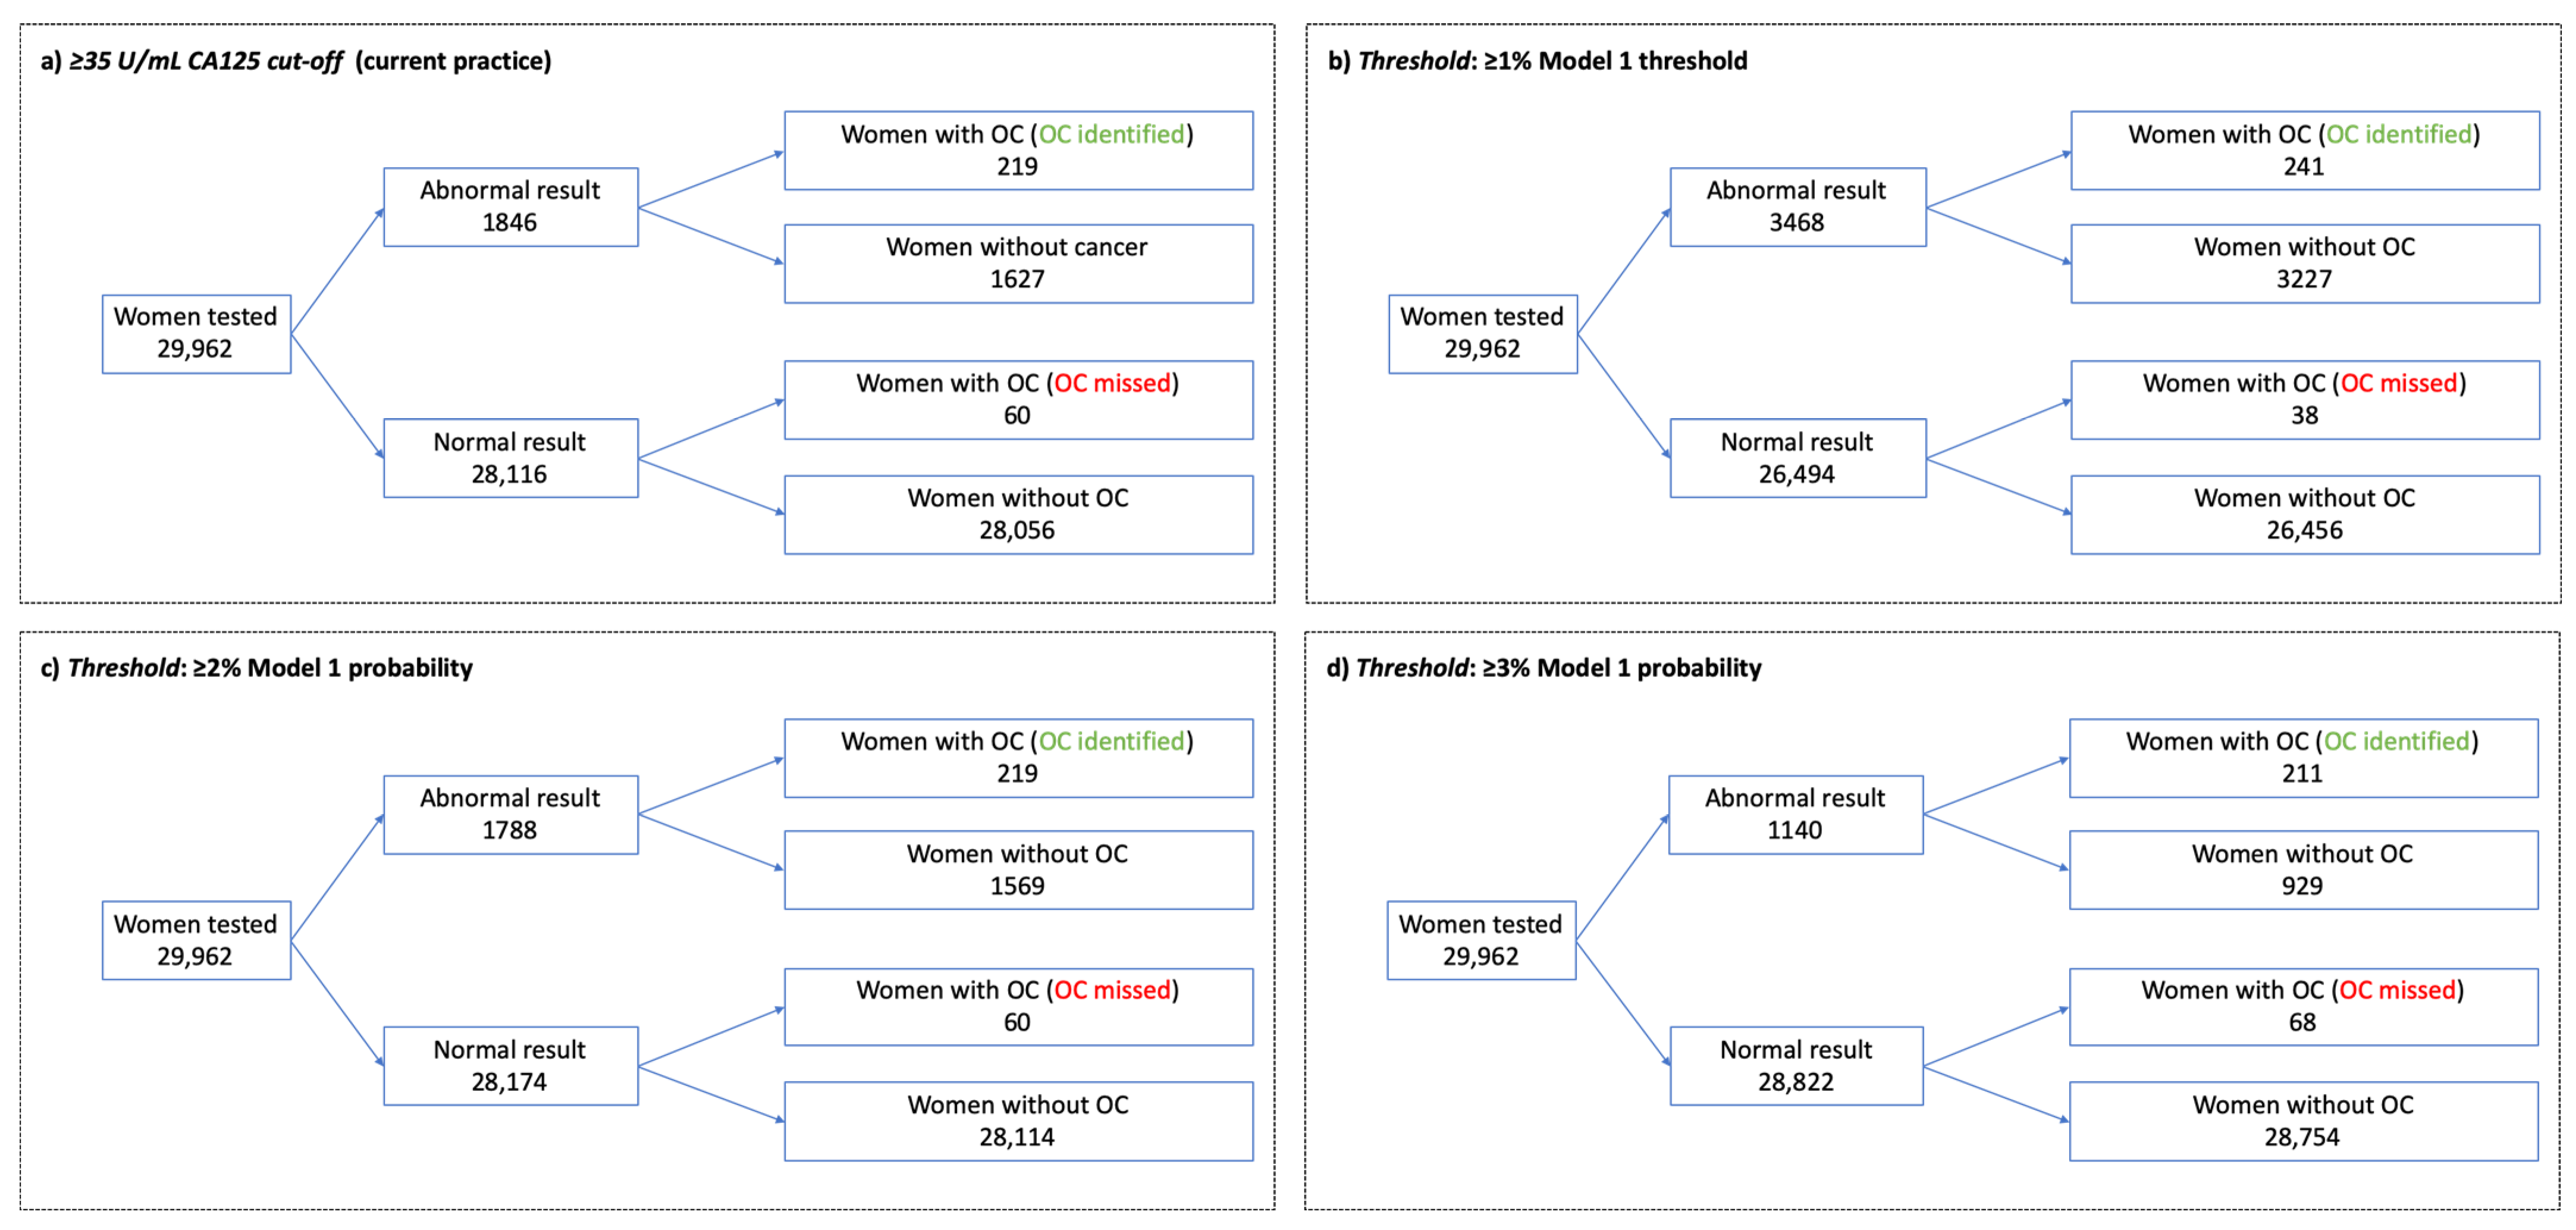
3.3. Thresholds for Further Investigation
4. Discussion
4.1. Strengths and Limitations
4.2. Comparison with Existing Literature
4.3. Implications for Research and Practice
5. Conclusions
Supplementary Materials
Author Contributions
Funding
Institutional Review Board Statement
Informed Consent Statement
Data Availability Statement
Acknowledgments
Conflicts of Interest
References
- Sung, H.; Ferlay, J.; Siegel, R.L.; Laversanne, M.; Soerjomataram, I.; Jemal, A.; Bray, F. Global cancer statistics 2020: GLOBOCAN estimates of incidence and mortality worldwide for 36 cancers in 185 countries. CA Cancer J. Clin. 2021, 71, 209–249. [Google Scholar] [CrossRef] [PubMed]
- Cancer Research UK. Ovarian Cancer Survival Statistics. Available online: http://www.cancerresearchuk.org/health-professional/cancer-statistics/statistics-by-cancer-type/ovarian-cancer/survival#heading-Three (accessed on 22 April 2021).
- Menon, U.; Gentry-Maharaj, A.; Burnell, M.; Singh, N.; Ryan, A.; Karpinskyj, C.; Carlino, G.; Taylor, J.; Massingham, S.K.; Raikou, M.; et al. Ovarian cancer population screening and mortality after long-term follow-up in the UK Collaborative Trial of Ovarian Cancer Screening (UKCTOCS): A randomised controlled trial. Lancet 2021, 397, 2182–2193. [Google Scholar] [CrossRef]
- Pinsky, P.F.; Yu, K.; Kramer, B.S.; Black, A.; Buys, S.S.; Partridge, E.; Gohagan, J.; Berg, C.D.; Prorok, P.C. Extended mortality results for ovarian cancer screening in the PLCO trial with median 15 years follow-up. Gynecol. Oncol. 2016, 143, 270–275. [Google Scholar] [CrossRef]
- Barrett, J.; Sharp, D.J.; Stapley, S.; Stabb, C.; Hamilton, W. Pathways to the diagnosis of ovarian cancer in the UK: A cohort study in primary care. BJOG 2010, 117, 610–614. [Google Scholar] [CrossRef] [PubMed]
- National Cancer Intellegence Network. Routes to Diagnosis 2006–2016 by Year, V2.1a. Available online: http://www.ncin.org.uk/publications/routes_to_diagnosis (accessed on 21 May 2020).
- National Institute for Health and Care Excellence. Ovarian Cancer: Recognition and Initial Management CG122. Available online: https://www.nice.org.uk/guidance/cg122 (accessed on 8 April 2021).
- Funston, G.; Hamilton, W.; Abel, G.; Crosbie, E.J.; Rous, B.; Walter, F.M. The diagnostic performance of CA125 for the detection of ovarian and non-ovarian cancer in primary care: A population-based cohort study. PLoS Med. 2020, 17, e1003295. [Google Scholar] [CrossRef] [PubMed]
- Olaitan, A. Recognition and initial management of ovarian cancer: Summary of NICE guidance (Rapid response). BMJ 2011, 342, d2073. [Google Scholar]
- Funston, G.; Hardy, V.; Abel, G.; Crosbie, E.J.; Emery, J.; Hamilton, W.; Walter, F.M. Identifying Ovarian Cancer in Symptomatic Women: A Systematic Review of Clinical Tools. Cancers 2020, 12, 3686. [Google Scholar] [CrossRef]
- Herrett, E.; Gallagher, A.M.; Bhaskaran, K.; Forbes, H.; Mathur, R.; van Staa, T.; Smeeth, L. Data Resource Profile: Clinical Practice Research Datalink (CPRD). Int. J. Epidemiol. 2015, 44, 827–836. [Google Scholar] [CrossRef] [PubMed]
- Herbert, A.; Wijlaars, L.; Zylbersztejn, A.; Cromwell, D.; Hardelid, P. Data Resource Profile: Hospital Episode Statistics Admitted Patient Care (HES APC). Int. J. Epidemiol. 2017, 46, 1093–1093i. [Google Scholar] [CrossRef]
- Henson, K.E.; Elliss-Brookes, L.; Coupland, V.H.; Payne, E.; Vernon, S.; Rous, B.; Rashbass, J. Data Resource Profile: National Cancer Registration Dataset in England. Int. J. Epidemiol. 2019, 49, 16. [Google Scholar] [CrossRef]
- Padmanabhan, S.; Carty, L.; Cameron, E.; Ghosh, R.E.; Williams, R.; Strongman, H. Approach to record linkage of primary care data from Clinical Practice Research Datalink to other health-related patient data: Overview and implications. Eur. J. Epidemiol. 2019, 34, 91–99. [Google Scholar] [CrossRef]
- National Institute for Health and Care Excellence. Suspected Cancer: Recognition and Referral (NG12); NICE: London, UK, 2015. [Google Scholar]
- Ebell, M.H.; Culp, M.B.; Radke, T.J. A Systematic Review of Symptoms for the Diagnosis of Ovarian Cancer. Am. J. Prev. Med. 2016, 50, 384–394. [Google Scholar] [CrossRef]
- Watson, J.; Salisbury, C.; Banks, J.; Whiting, P.; Hamilton, W. Predictive value of inflammatory markers for cancer diagnosis in primary care: A prospective cohort study using electronic health records. Br. J. Cancer 2019, 120, 1045–1051. [Google Scholar] [CrossRef]
- Bailey, S.E.R.; Ukoumunne, O.C.; Shephard, E.A.; Hamilton, W. Clinical relevance of thrombocytosis in primary care: A prospective cohort study of cancer incidence using English electronic medical records and cancer registry data. Br. J. Gen. Pract. 2017, 67, e405–e413. [Google Scholar] [CrossRef] [PubMed]
- Hamilton, W.; Peters, T.J.; Bankhead, C.; Sharp, D. Risk of ovarian cancer in women with symptoms in primary care: Population based case-control study. BMJ 2009, 339, b2998. [Google Scholar] [CrossRef]
- Funston, G.; Mounce, L.; Price, S.J.; Rous, B.; Crosbie, E.J.; Hamilton, W.; Walter, F.M. CA125 test result, test-to-diagnosis interval and stage at diagnosis in ovarian cancer: A cohort study using electronic health records. Br. J. Gen. Pract. 2021, 71, e465–e472. [Google Scholar] [CrossRef] [PubMed]
- FIGO Committee on Gynecologic Oncology. Staging classification for cancer of the ovary, fallopian tube, and peritoneum. Int. J. Gynaecol. Obstet. 2014, 124, 1–5. [Google Scholar] [CrossRef]
- Kurman, R.J.; Carcangiu, M.L.; Herrington, C.S.; Young, R.H. WHO Classification of Tumours of Female Reproductive Organs, 4th ed.; International Agency for Research on Cancer: Lyon, France, 2014; ISBN 9283224353. [Google Scholar]
- Watson, J.; Mounce, L.; Bailey, S.E.R.; Cooper, S.L.; Hamilton, W. Blood markers for cancer. BMJ 2019, 367, l5774. [Google Scholar] [CrossRef] [PubMed]
- Mathur, R.; Bhaskaran, K.; Chaturvedi, N.; Leon, D.A.; VanStaa, T.; Grundy, E.; Smeeth, L. Completeness and usability of ethnicity data in UK-based primary care and hospital databases. J. Public Health 2014, 36, 684–692. [Google Scholar] [CrossRef]
- National Cancer Registration and Analysis Service. Cancer Incidence and Survival by Major Ethnic Group. Available online: http://www.ncin.org.uk/search/ethnic+group (accessed on 20 April 2021).
- Cancer Research UK. Ovarian Cancer Incidence by Age. Available online: https://www.cancerresearchuk.org/health-professional/cancer-statistics/statistics-by-cancer-type/ovarian-cancer/incidence#heading-One (accessed on 5 March 2021).
- Reid, B.M.; Permuth, J.B.; Sellers, T.A. Epidemiology of ovarian cancer: A review. Cancer Biol. Med. 2017, 14, 9–32. [Google Scholar] [PubMed]
- World Cancer Research Fund/American Institute for Cancer Research Diet, Nutrition, Physical Activity and Ovarian Cancer. Available online: https://www.wcrf.org/sites/default/files/Ovarian-cancer-report.pdf (accessed on 20 April 2021).
- Aune, D.; Rosenblatt, D.A.N.; Chan, D.S.M.; Abar, L.; Vingeliene, S.; Vieira, A.R.; Greenwood, D.C.; Norat, T. Anthropometric factors and ovarian cancer risk: A systematic review and nonlinear dose-response meta-analysis of prospective studies. Int. J. Cancer 2015, 136, 1888–1898. [Google Scholar] [CrossRef] [PubMed]
- Beral, V.; Hermon, C.; Peto, R.; Reeves, G.; Brinton, L.; Marchbanks, P.; Negri, E.; Ness, R.; Peeters, P.H.M.; Vessey, M.; et al. Ovarian cancer and body size: Individual participant meta-analysis including 25,157 women with ovarian cancer from 47 epidemiological studies. PLoS Med. 2012, 9, e1001200. [Google Scholar]
- Green, J.; Cairns, B.J.; Casabonne, D.; Wright, F.L.; Reeves, G.; Beral, V. Height and cancer incidence in the Million Women Study: Prospective cohort, and meta-analysis of prospective studies of height and total cancer risk. Lancet Oncol. 2011, 12, 785–794. [Google Scholar] [CrossRef]
- Liu, Z.; Zhang, T.T.; Zhao, J.J.; Qi, S.F.; Du, P.; Liu, D.W.; Tian, Q.B. The association between overweight, obesity and ovarian cancer: A meta-analysis. Jpn. J. Clin. Oncol. 2015, 45, 1107–1115. [Google Scholar] [CrossRef]
- Bhaskaran, K.; Douglas, I.; Forbes, H.; Dos-Santos-Silva, I.; Leon, D.A.; Smeeth, L. Body-mass index and risk of 22 specific cancers: A population-based cohort study of 5·24 million UK adults. Lancet 2014, 384, 755–765. [Google Scholar] [CrossRef]
- Stewart, L.M.; Spilsbury, K.; Jordan, S.; Stewart, C.; Holman, C.D.A.J.; Powell, A.; Reekie, J.; Cohen, P. Risk of high-grade serous ovarian cancer associated with pelvic inflammatory disease, parity and breast cancer. Cancer Epidemiol. 2018, 55, 110–116. [Google Scholar] [CrossRef]
- Merriel, S.W.D.; Carroll, R.; Hamilton, F.; Hamilton, W. Association between unexplained hypoalbuminaemia and new cancer diagnoses in UK primary care patients. Fam. Pract. 2016, 33, 449–452. [Google Scholar] [CrossRef]
- Hippisley-Cox, J.; Coupland, C. Identifying women with suspected ovarian cancer in primary care: Derivation and validation of algorithm. BMJ 2012, 344, d8009. [Google Scholar] [CrossRef]
- Peres, L.C.; Mallen, A.R.; Townsend, M.K.; Poole, E.M.; Trabert, B.; Allen, N.E.; Arslan, A.A.; Dossus, L.; Fortner, R.T.; Gram, I.T.; et al. High levels of C-reactive protein are associated with an increased risk of ovarian cancer: Results from the ovarian cancer Cohort Consortium. Cancer Res. 2019, 15, 5442–5451. [Google Scholar] [CrossRef] [PubMed]
- Harrell, F.E. Regression Modeling Strategies, with Applications to Linear Models, Logistic Regression, and Survival Analysis; Springer: New York, NY, USA, 2001. [Google Scholar]
- Stata Impute Missing Values Using Chained Equations. Available online: https://www.stata.com/manuals13/mimiimputechained.pdf (accessed on 14 December 2020).
- Marshall, A.; Altman, D.G.; Holder, R.L.; Royston, P. Combining estimates of interest in prognostic modelling studies after multiple imputation: Current practice and guidelines. BMC Med. Res. Methodol. 2009, 9, 57. [Google Scholar] [CrossRef]
- Banks, J.; Hollinghurst, S.; Bigwood, L.; Peters, T.J.; Walter, F.M.; Hamilton, W. Preferences for cancer investigation: A vignette-based study of primary-care attendees. Lancet Oncol. 2014, 15, 232–240. [Google Scholar] [CrossRef]
- Luque-Fernandez, M.A.; Redondo-Sánchez, D.; Maringe, C. cvauroc: Command to compute cross-validated area under the curve for ROC analysis after predictive modeling for binary outcomes. Stata J. 2019, 19, 615–625. [Google Scholar] [CrossRef]
- Price, S.J.; Stapley, S.A.; Shephard, E.; Barraclough, K.; Hamilton, W.T. Is omission of free text records a possible source of data loss and bias in Clinical Practice Research Datalink studies? A case-control study. BMJ Open 2016, 6, e011664. [Google Scholar] [CrossRef] [PubMed]
- Jacobs, I.; Oram, D.; Fairbank, J.; Turner, J.; Frost, C.; Grudzinskas, J.G. A risk of malignancy index incorporating CA 125, ultrasound and menopausal status for the accurate preoperative diagnosis of ovarian cancer. BJOG 1990, 100, 927–931. [Google Scholar] [CrossRef] [PubMed]
- Moore, R.G.; McMeekin, D.S.; Brown, A.K.; DiSilvestro, P.; Miller, M.C.; Allard, W.J.; Gajewski, W.; Kurman, R.; Bast, R.C.; Skates, S.J.; et al. A novel multiple marker bioassay utilizing HE4 and CA125 for the prediction of ovarian cancer in patients with a pelvic mass. Gynecol. Oncol. 2009, 112, 40–46. [Google Scholar] [CrossRef] [PubMed]
- Nicholson, B.D.; Oke, J.L.; Rose, P.W.; Mant, D. Variation in direct access to tests to investigate cancer: A survey of english general practitioners. PLoS ONE 2016, 11, e0159725. [Google Scholar] [CrossRef] [PubMed]


| Variable | Data Source | Categorisation | Variable Inclusion Time/Period |
|---|---|---|---|
| Risk/protective factors | |||
| Age [26] | CPRD | Continuous (years) | On date of CA125 testing |
| Ethnicity [25,27] | CPRD and HES | Categorical: White Other ethnicities | Most frequently recorded [24] |
| Height [28,29,30,31] | CPRD | Continuous (cm) | Most recent on/prior to CA125 test date recorded when ≥18 years old |
| BMI [28,32,33] | CPRD | Continuous (kg/m2) | Most recent on/in the 10 years prior to CA125 test date ≥18 years old |
| Personal history breast cancer [34] | CPRD/NCRAS | Binary | Up to CA125 test date |
| Symptoms | |||
| Ovarian cancer symptoms [7] | CPRD | Binary for each symptom. Presence/absence of abdominal/pelvic pain, appetite loss, bloating, distension, change in bowel habit, fatigue, urinary frequency/urgency, new irritable bowel syndrome (≥50 years old), weight loss | 12 months prior to CA125 testing |
| Blood biomarkers | |||
| CA125 [8] | CPRD | Continuous | First valid CA125 level in study period |
| Albumin [35] | CPRD | Categorical: Not tested <35 g/L ≥35 g/L | Most recent record on or in the 12 months prior to the CA125 test date |
| Haemoglobin [36] | CPRD | Categorical: Not tested <12 g/dL ≥12 g/d | Most recent record on or in the 12 months prior to the CA125 test date |
| Platelets [18] | CPRD | Categorical: Not tested <300 × 109/L 300–449 × 109/L ≥450 × 109/L | Most recent record on or in the 12 months prior to the CA125 test date |
| CRP [17,37] | CPRD | Categorical: Not tested <3 mg/L 3–9.99 mg/L ≥10 mg/L | Most recent record on or in the 12 months prior to the CA125 test date |
| Variable | n = 29,962 |
|---|---|
| Risk/protective factors | |
| Age (years) | Mean = 55 (SD: 15) |
| Ethnicity: | |
| White | n = 26,511 (88.5%) |
| Other ethnicities * | n = 2217 (7.4%) |
| Height (cm) | Mean = 162 (SD: 6.8) |
| BMI (kg/m2) | Median = 25.8 (IQR: 22.8–29.7) |
| Personal history breast cancer | n = 1168 (3.9%) |
| Symptoms | |
| Abdominal/pelvic pain | n = 17,538 (58.5%) |
| Appetite loss | n = 203 (0.7%) |
| Bloating | n = 5649 (18.9%) |
| Distension | n = 821 (2.7%) |
| CIBH | n = 5808 (19.4%) |
| Fatigue | n = 3968 (13.2%) |
| Urinary frequency/urgency | n = 1503 (5%) |
| ≥50 years of age with new IBS | n = 286 (1%) |
| Weight loss | n = 1168 (3.9%) |
| Blood biomarkers | |
| CA125 | Median = 12 (IQR: 8–17) |
| Albumin: | |
| Not tested | n = 3723 (12.4%) |
| <35 g/L | n = 834 (2.8%) |
| ≥35 g/L | n = 25,405 (84.8%) |
| Haemoglobin: | |
| Not tested | n = 1648 (5.5%) |
| <12 g/dL | n = 3089 (10.3%) |
| ≥12 g/dL | n = 25,225 (84.2%) |
| Platelets: | |
| Not tested | n = 1679 (5.6%) |
| <300 × 109/L | n = 20,442 (68.2%) |
| 300–449 × 109/L | n = 7314 (24.4%) |
| ≥450 × 109/L | n = 527 (1.8%) |
| CRP: | |
| Not tested | n = 13,181 (44%) |
| <3 mg/L | n = 6907 (23.1%) |
| 3–9.99 mg/L | n = 7370 (24.6%) |
| ≥10 mg/L | n = 2504 (8.4%) |
| Model | Apparent AUC | Cross-Validation AUC * | Cross-Validation Calibration Slope (95% CI) |
|---|---|---|---|
| Model 1 | 0.938 | 0.935 | 1.01 (0.606–1.42) |
| Model 2 | 0.941 | 0.935 | 1.05 (0.673–1.42) |
| Threshold | Sens | Spec | PPV | NPV |
|---|---|---|---|---|
| ≥1% model probability | 86.4 (81.8–90.2) | 89.1 (88.8–89.5) | 6.9 (6.1–7.8) | 99.9 (99.8–99.9) |
| CA125 of ≥23 U/mL | 86.4 (81.8–90.2) | 86.0 (85.6–86.4) | 5.5 (4.8–6.2) | 99.9 (99.8–99.9) |
| ≥2% model probability | 78.5 (73.2–83.2) | 94.7 (94.5–95.0) | 12.2 (10.8–13.9) | 99.8 (99.7–99.8) |
| Ca125 of ≥35 U/mL | 78.5 (73.2–83.2) | 94.5 (94.3–94.8) | 11.9 (10.4–13.4) | 99.8 (99.7–99.8) |
| ≥3% model probability | 75.6 (70.2–80.5) | 96.9 (96.7–97.1) | 18.5 (16.3–20.9) | 99.8 (99.7–99.8) |
| CA125 of ≥39 U/mL | 75.6 (70.2–80.5) | 95.6 (95.3–95.8) | 13.8 (12.1–15.7) | 99.8 (99.7–99.8) |
Publisher’s Note: MDPI stays neutral with regard to jurisdictional claims in published maps and institutional affiliations. |
© 2021 by the authors. Licensee MDPI, Basel, Switzerland. This article is an open access article distributed under the terms and conditions of the Creative Commons Attribution (CC BY) license (https://creativecommons.org/licenses/by/4.0/).
Share and Cite
Funston, G.; Abel, G.; Crosbie, E.J.; Hamilton, W.; Walter, F.M. Could Ovarian Cancer Prediction Models Improve the Triage of Symptomatic Women in Primary Care? A Modelling Study Using Routinely Collected Data. Cancers 2021, 13, 2886. https://doi.org/10.3390/cancers13122886
Funston G, Abel G, Crosbie EJ, Hamilton W, Walter FM. Could Ovarian Cancer Prediction Models Improve the Triage of Symptomatic Women in Primary Care? A Modelling Study Using Routinely Collected Data. Cancers. 2021; 13(12):2886. https://doi.org/10.3390/cancers13122886
Chicago/Turabian StyleFunston, Garth, Gary Abel, Emma J. Crosbie, Willie Hamilton, and Fiona M. Walter. 2021. "Could Ovarian Cancer Prediction Models Improve the Triage of Symptomatic Women in Primary Care? A Modelling Study Using Routinely Collected Data" Cancers 13, no. 12: 2886. https://doi.org/10.3390/cancers13122886
APA StyleFunston, G., Abel, G., Crosbie, E. J., Hamilton, W., & Walter, F. M. (2021). Could Ovarian Cancer Prediction Models Improve the Triage of Symptomatic Women in Primary Care? A Modelling Study Using Routinely Collected Data. Cancers, 13(12), 2886. https://doi.org/10.3390/cancers13122886