Article

Plasma Protein Biomarkers Associated with Higher Ovarian Cancer Risk in BRCA1/2 Carriers

1
Asan Medical Center, Asan Institute for Life Sciences, Seoul 05505, Korea
2
Department of Obstetrics and Gynecology, Seoul St. Mary’s Hospital, College of Medicine, The Catholic University of Korea, Seoul 06591, Korea
3
Cancer Research Institute, College of Medicine, The Catholic University of Korea, Seoul 06591, Korea
4
Convergence Medicine Research Center, Asan Institute for Life Sciences, Asan Medical Center, Seoul 05505, Korea
5
Department of Biomedical Sciences, University of Ulsan College of Medicine, Seoul 05505, Korea
6
Convergence Medicine Research Center, Asan Medical Center, Clinical Proteomics Core Laboratory, Seoul 05505, Korea
7
Asan Medical Center, Bio-Medical Institute of Technology, Seoul 05505, Korea
*
Authors to whom correspondence should be addressed.
Cancers 2021, 13(10), 2300; https://doi.org/10.3390/cancers13102300
Submission received: 26 February 2021 / Revised: 3 May 2021 / Accepted: 8 May 2021 / Published: 11 May 2021
(This article belongs to the Special Issue Cause, Screening and Diagnosis in Ovarian Cancer)

Abstract

:

Simple Summary

Most hereditary ovarian cancer is associated with BRCA1/2 variants, and risk-reducing salpingo-oophorectomy during the follow-up monitoring of ovarian cancer development in heathy women with the BRCA1/2 variant reduces ovarian cancer incidence. The aim of this study was to identify plasma protein biomarkers that can indicate an increased risk of developing ovarian cancer using a proteomic approach based on a population of genetic variants. Two identified biomarkers among differentially expressed proteins, SPARC and THBS1, had lower plasma concentrations in healthy BRCA1/2 variant carriers than in ovarian cancer patients with the BRCA1/2 variant; concentration of two proteins increased at the onset of ovarian cancer. These protein markers from non-invasive liquid biopsy sampling could be used to help women with the BRCA1/2 variant determine whether to undergo an oophorectomy that could potentially affect the quality of life.

Abstract

Ovarian cancer (OC) is the most lethal gynecologic malignancy and in-time diagnosis is limited because of the absence of effective biomarkers. Germline BRCA1/2 genetic alterations are risk factors for hereditary OC; risk-reducing salpingo-oophorectomy (RRSO) is pursued for disease prevention. However, not all healthy carriers develop the disease. Therefore, identifying predictive markers in the BRCA1/2 carrier population could help improve the identification of candidates for preventive RRSO. In this study, plasma samples from 20 OC patients (10 patients with BRCA1/2 wild type (wt) and 10 with the BRCA1/2 variant (var)) and 20 normal subjects (10 subjects with BRCA1/2wt and 10 with BRCA1/2var) were analyzed for potential biomarkers of hereditary OC. We applied a bottom-up proteomics approach, using nano-flow LC-MS to analyze depleted plasma proteome quantitatively, and potential plasma protein markers specific to the BRCA1/2 variant were identified from a comparative statistical analysis of the four groups. We obtained 1505 protein candidates from the 40 subjects, and SPARC and THBS1 were verified by enzyme-linked immunosorbent assay. Plasma SPARC and THBS1 concentrations in healthy BRCA1/2 carriers were found to be lower than in OC patients with BRCA1/2var. If plasma SPARC concentrations increase over 337.35 ng/mL or plasma THBS1 concentrations increase over 65.28 μg/mL in a healthy BRCA1/2 carrier, oophorectomy may be suggested.

1. Introduction

Ovarian cancer (OC) is the most lethal gynecologic malignancy, likely because of its late diagnosis. Indeed, most cases are diagnosed at stage III—IV and their five-year survival rate is less than 50% [1]. Since OC patients with early stage (I—II) disease have a five-year survival rate of 93% [1], increasing the early detection rate has always been a top priority in OC research. The currently recommended blood screening test for OC is the detection of tumor marker cancer antigen 125 (CA125) [2]. However, previous studies have concluded that annual screening for this factor has not improved the survival outcomes for OC patients [3,4]. A more effective tumor marker is therefore urgently needed.
It has been reported that ~18% of OC, particularly high-grade serous adenocarcinoma, is caused by germline genetic variants such as BRCA1/2, BRCA1-interacting protein C-terminal helicase 1 (BRIP1), and RAD51 paralog D (RAD51D) [5,6,7,8]. BRCA1/2 germline carriers account for ~15% of OC [5]. Because early detection of an OC is difficult, women carrying BRCA1/2 variants are advised to undergo a risk-reducing bilateral salpingo-oophorectomy (RRSO) for OC prevention [9]. This procedure may decrease the risk of OC by 80% and is thus recommended, once childbearing is completed, by the American College of Obstetricians and Gynecologists, the Society of Gynecologic Oncology, The National Comprehensive Cancer Network, and other bodies [10,11,12,13]. Notably however, RRSO can cause early menopause with associated osteoporosis and cardiovascular risk [14], and there remains a risk of BRCA1/2-related primary peritoneal cancer [11].
Similar to hereditary OC, most current evidence-based strategies for managing patients with known inherited risks of breast cancer (e.g. germline BRCA1/2 variants) rely on prophylactic surgeries such as bilateral mastectomies [15]. Recent studies have suggested that RANK (receptor activator of nuclear factor kappa-B) and RANK ligand (RANKL) are associated with breast cancer risk in BRCA gene variant carriers and may be used for precision prevention for treatment [16,17]. However, further OC prevention strategies in women with an inherited risk have not been fully explored.
In recent years, there have been diverse proteomic studies associated with OC that have utilized liquid chromatography-mass spectrometry (LC-MS). Most of these prior investigations have mainly focused on new biomarker identification among differentially abundant proteins in blood-derived specimens [18,19,20,21] or in tumor tissues [22,23]. Previous studies on the integration of genes and proteins have also been conducted in OC [24,25,26]. In our present comparative proteomic analysis, we performed nano-LC-MS analyses of plasma samples taken from both healthy subjects and OC patients with and without BRCA1/2 variants and identified potential new protein biomarkers of this cancer that were subsequently validated using an enzyme-linked immunosorbent assay (ELISA). The aim was to find novel diagnostic biomarkers of inherited OC development.

2. Results

2.1. Study Design

Blood samples from 40 study participants were collected and their demographic data are described in Table 1. There were no significant differences in a range of factors other than genetic differences due to the family history between the groups with or without the BRCA1/2 variants. The subjects comprised equal numbers of healthy participants and OC patients with (HPvar/OCvar, n = 10 each) and without (HPwt, OCwt n = 10 each) a BRCA1/2 variant. Among all 20 healthy subjects (HPTotal), no significant differences were found between the HPwt and HPvar groups in terms of age. In the total OC patient cohort (OCTotal), none of the key clinical factors differed significantly between the OCwt and OCvar groups, including age, cancer stage, BRCA variant type (Supplementary Methods), preoperative CA125 concentration, or preoperative platelet concentration (Bonferroni corrected p-value > 0.05/7 = 0.0071).

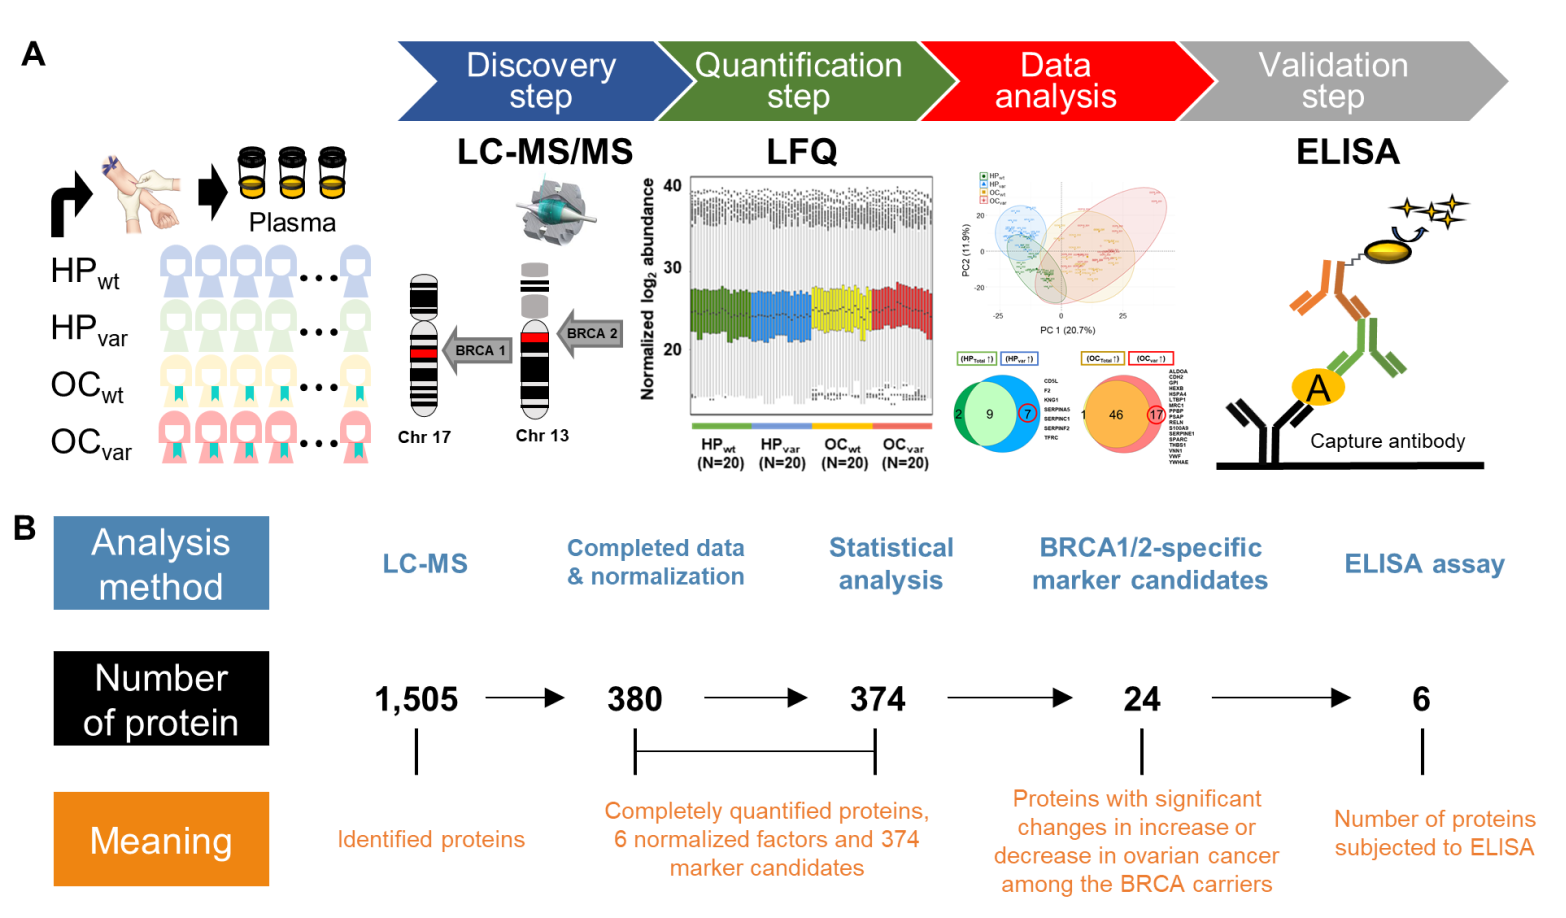
2.2. Workflow for the LC-MS/MS-Based Biomarker Candidate Screen and ELISA-Based Validation

A workflow was constructed for biomarker identification and validation in the healthy subjects harboring BRCA1/2 variants who could potentially develop OC (Figure 1A). To screen for BRCA1/2 variant-specific biomarker candidates, we first identified any differentially abundant plasma proteins between our HPTotal and OCTotal populations and then subdivided each group into HPvar, OCvar, HPwt, and OCwt. We obtained 1505 plasma proteins from the initial screening, from which 380 candidate proteins were identified from all samples upon more stringent filtering. We then used six endogenous factors (C2, C6, CFH, CFI, LCP1, and SERPINA7) to normalize the protein abundance levels (Figure S1a) and found that 238 proteins showed a significant positive correlation when comparing these normalized values with the plasma concentrations of the published Plasma Proteome Database [27] (ρ = 0.7; Pearson’s correlation coefficient, permutation p-value < 0.001; Figure S1B). Statistical analysis was then used to identify BRCA1/2 variant-specific marker candidates through our strategy. We subsequently validated these candidates by the immunoassay (Figure 1B).

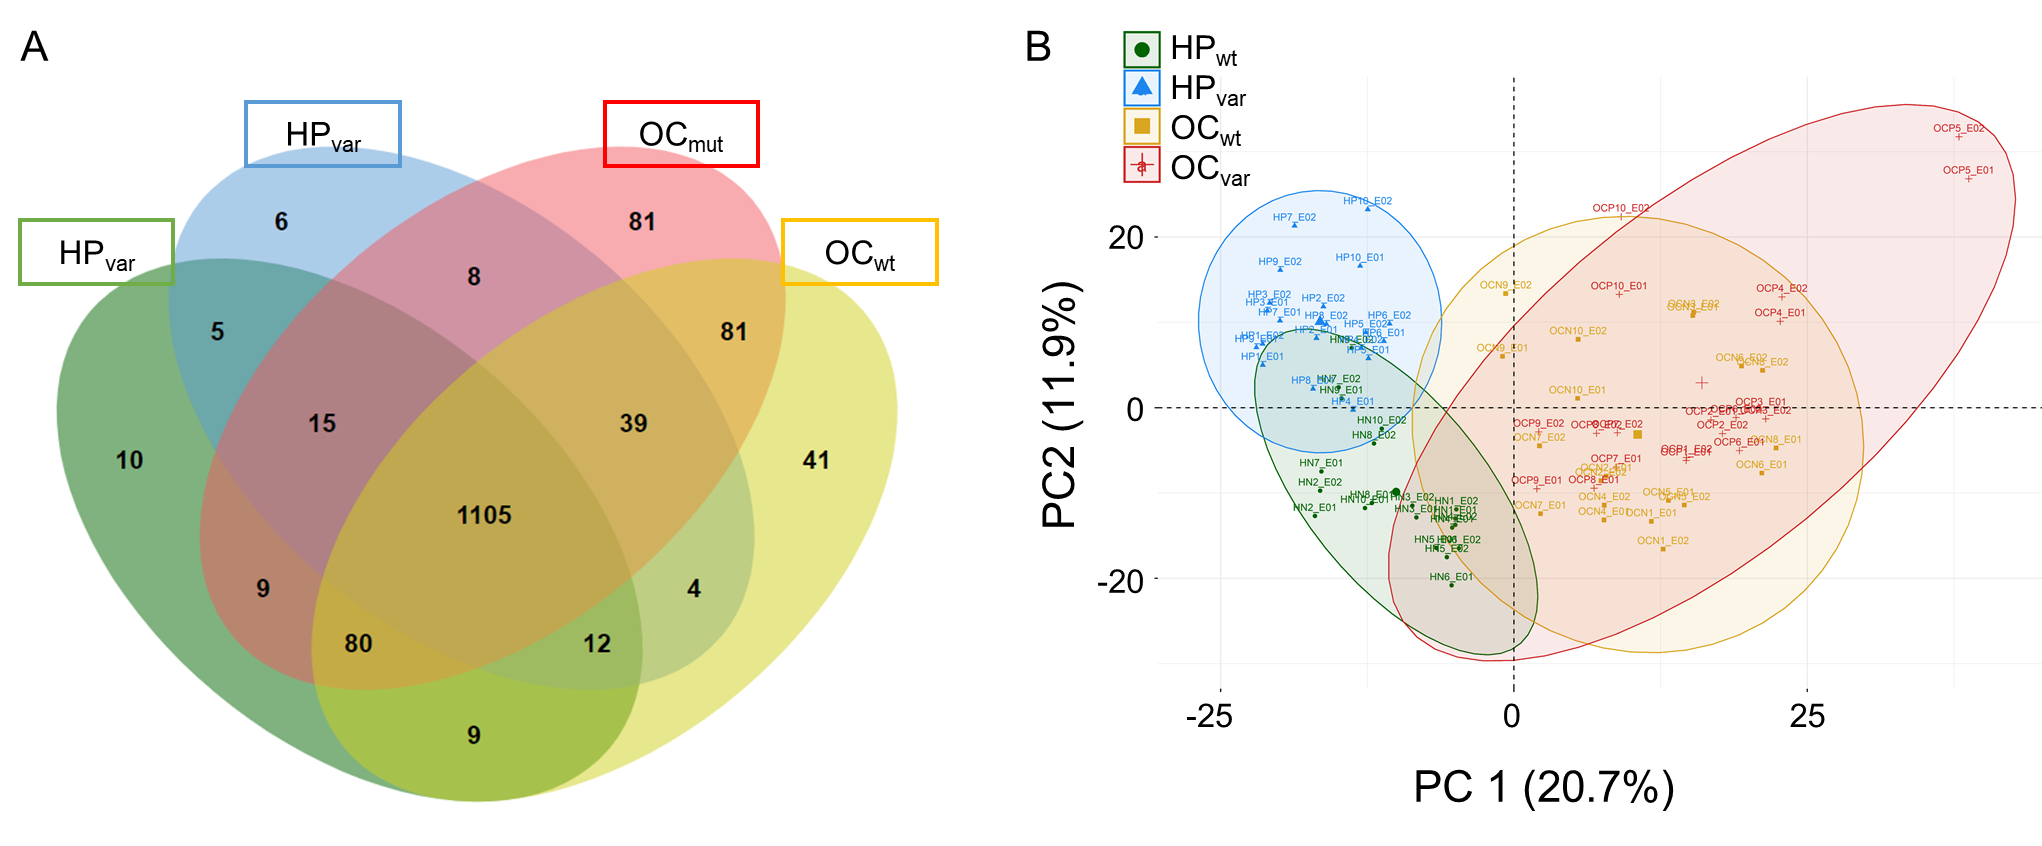
2.3. Proteomic Results from Clinical Plasma Samples by LC-MS/MS

Plasma samples from all 40 study participants were used for the measurement of constitutive proteins via duplicate LC-MS/MS runs. A total of 1505 proteins were identified from 80 LC-MS/MS measurements across the four study groups (HPwt, HPvar, OCwt, and OCvar; Figure 2A and Table S1). From this initial panel of plasma proteins, 380 were completely obtained using a label-free quantification method. These included six relatively stable abundant proteins, C2, C6, CFH, CFI, LCP1, and SERPINA7, that were used to normalize the raw abundance of the other candidates, as detailed in the methods section. Accordingly, 374 normalized proteins were used in the next step analysis (Table S2). By principal component analysis, HPTotal and OCTotal groups were clearly divided by the first principal component, and the HPTotal group could be stratified into HPwt and HPvar by PC2, but this was not the case for the OCTotal subjects (Figure 2B). This indicated that the BRCA1/2 genetic background was related to the second principal component in a healthy state but that this association was lost after the development of OC. Next, we present a statistical analysis using different groups of comparison samples in two scenarios (Section 2.4 and Section 2.5) and identify the BRCA-specific plasma biomarkers used in this study (Section 2.6).

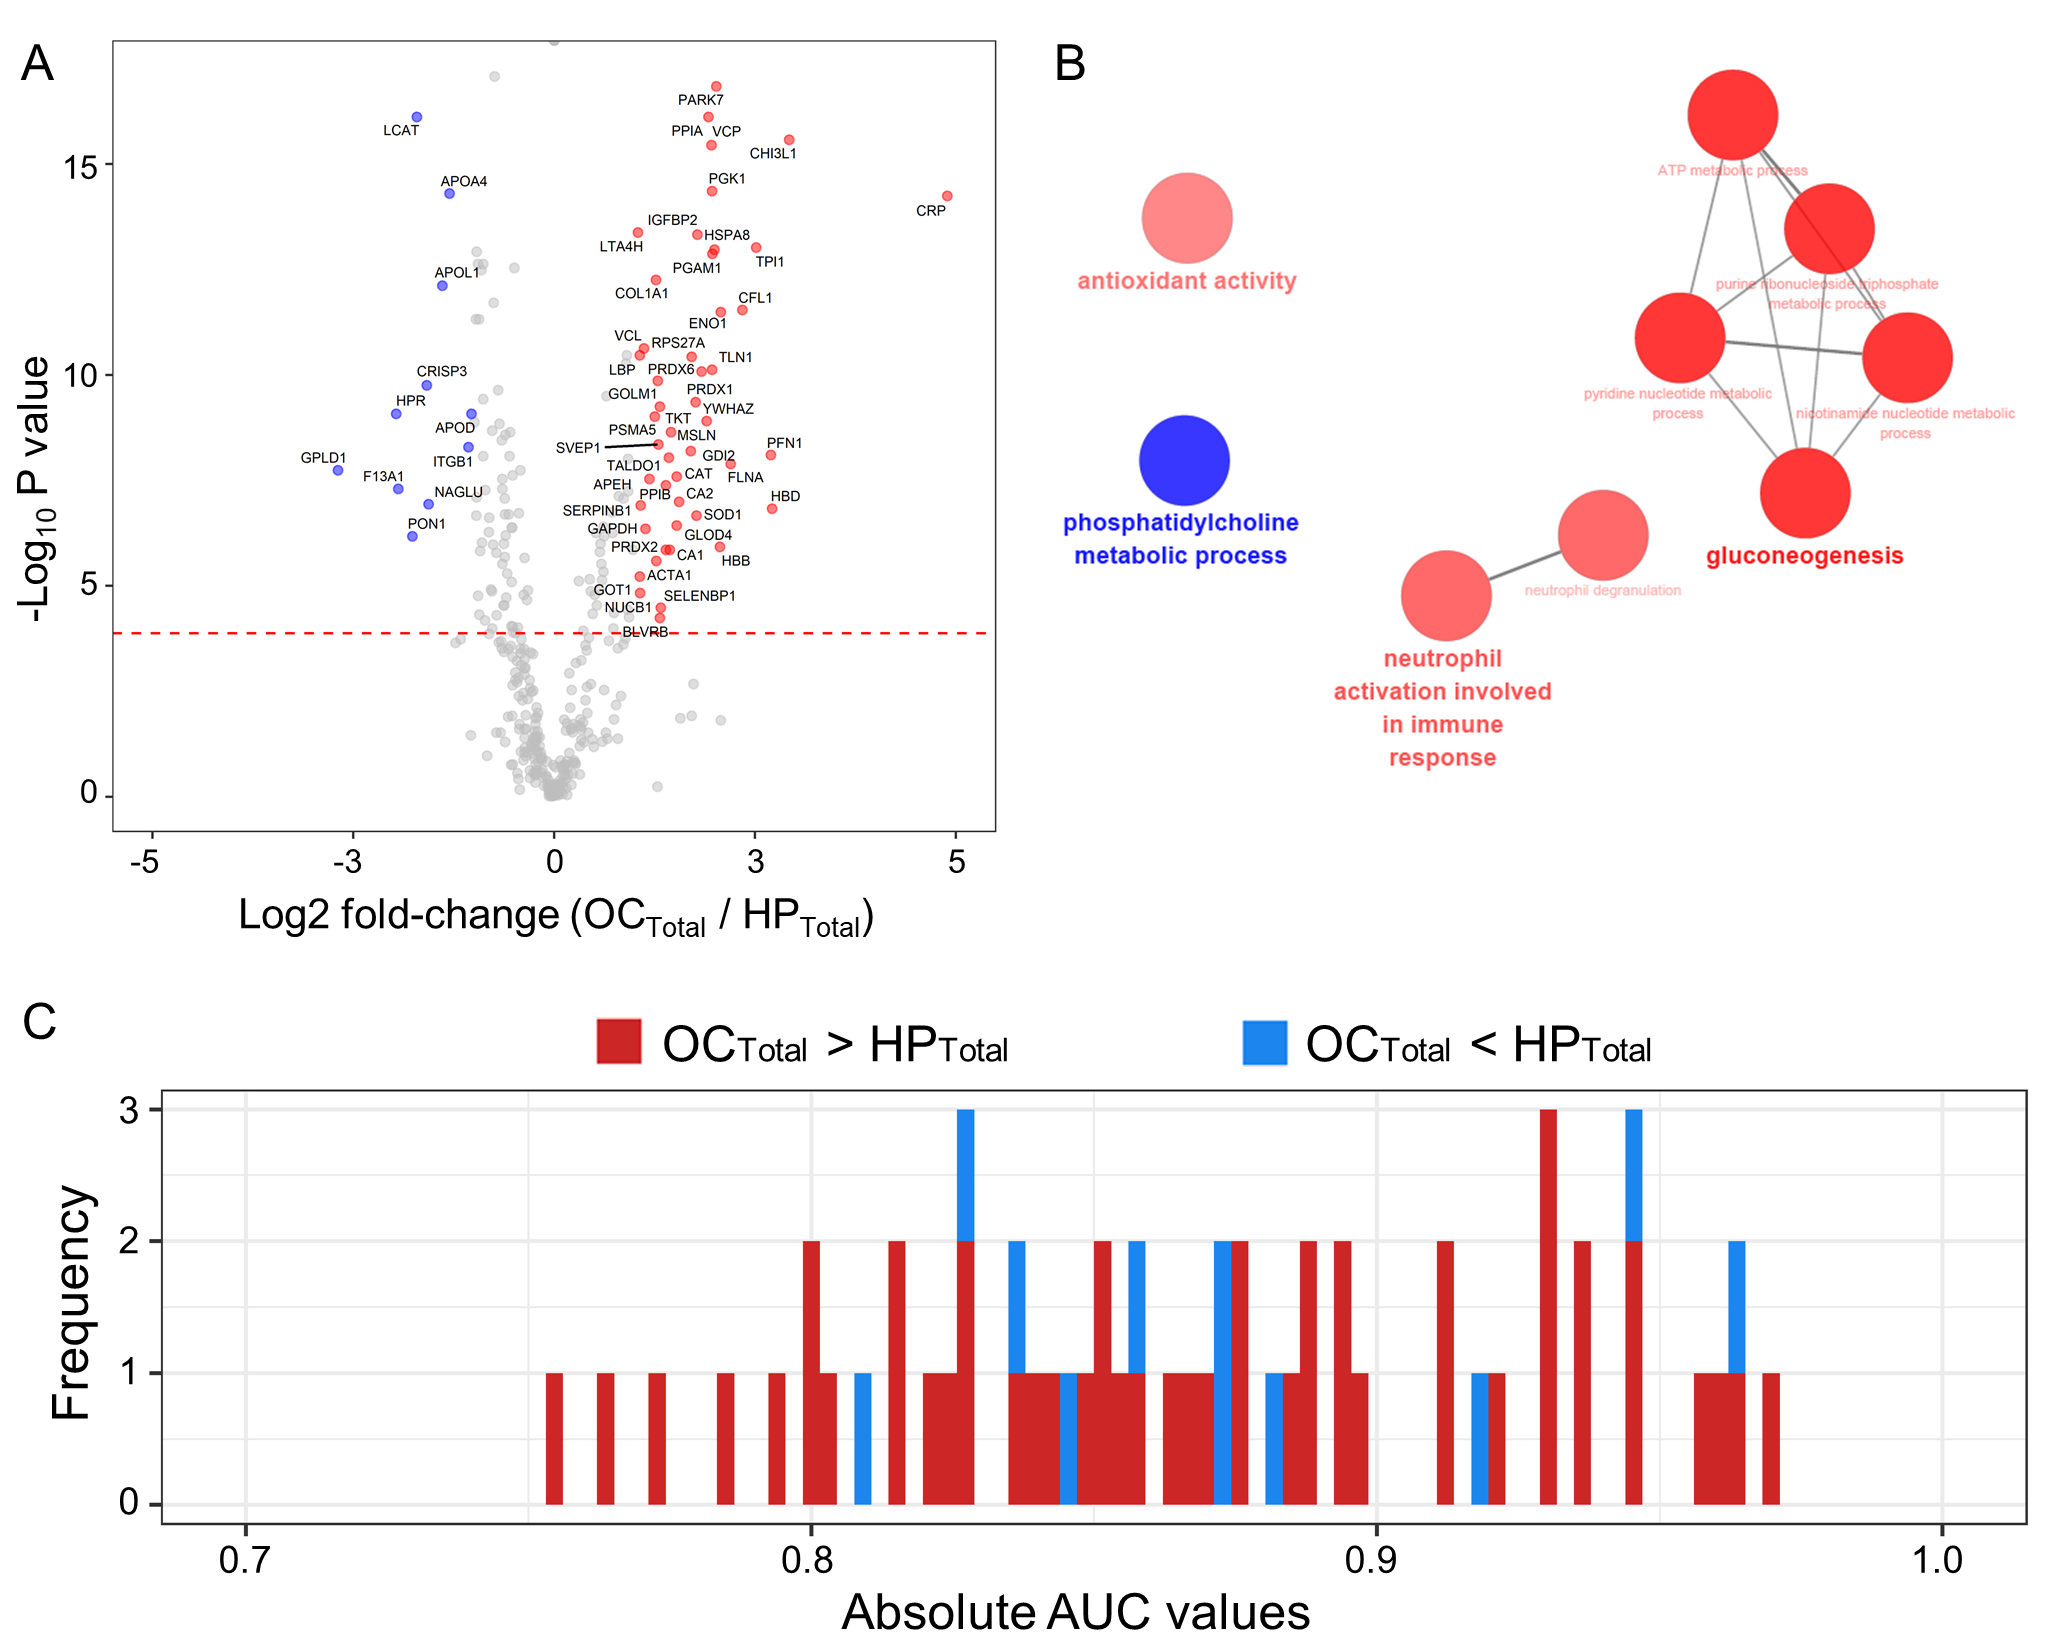
2.4. Scenario I: Differentially Abundant Plasma Proteins between the Total Cohorts of Healthy Subjects and Ovarian Cancer Patients

We compared the abundance of the 374 normalized candidate proteins between the HPTotal and OCTotal populations using the Mann–Whitney U test, a non-parametric test for comparison. A volcano plot representing the log2-fold-changes (OCTotal/HPTotal) against the minus log10-adjusted p-values identified 11 proteins as being upregulated in the HPTotal and 47 proteins in the OCTotal groups (|log2 fold-change| > 1; Bonferroni-corrected p-values < 0.05; Figure 3A and Table S3). These differentially abundant proteins (DAPs) in the plasma were linked to known biological processes. Downregulated proteins in the OCTotal group were highly involved in phosphatidylcholine metabolic processes, and upregulated proteins in this population were linked to the neutrophil activation involved in immune responses, gluconeogenesis, and antioxidant activity in the ClueGo tools (FDR < 0.01; Figure 3B). We next conducted univariate receiver operating characteristic (ROC) analysis of the proteins showing an association with OC (Figure 3C and Table S3). The results indicated a significant relationship for 58 proteins (p < 0.05) with five of these candidates (PARK7, LCAT, PPIA, CHI3L1, and VCP) showing an area under the curve (AUC) value greater than 0.95.

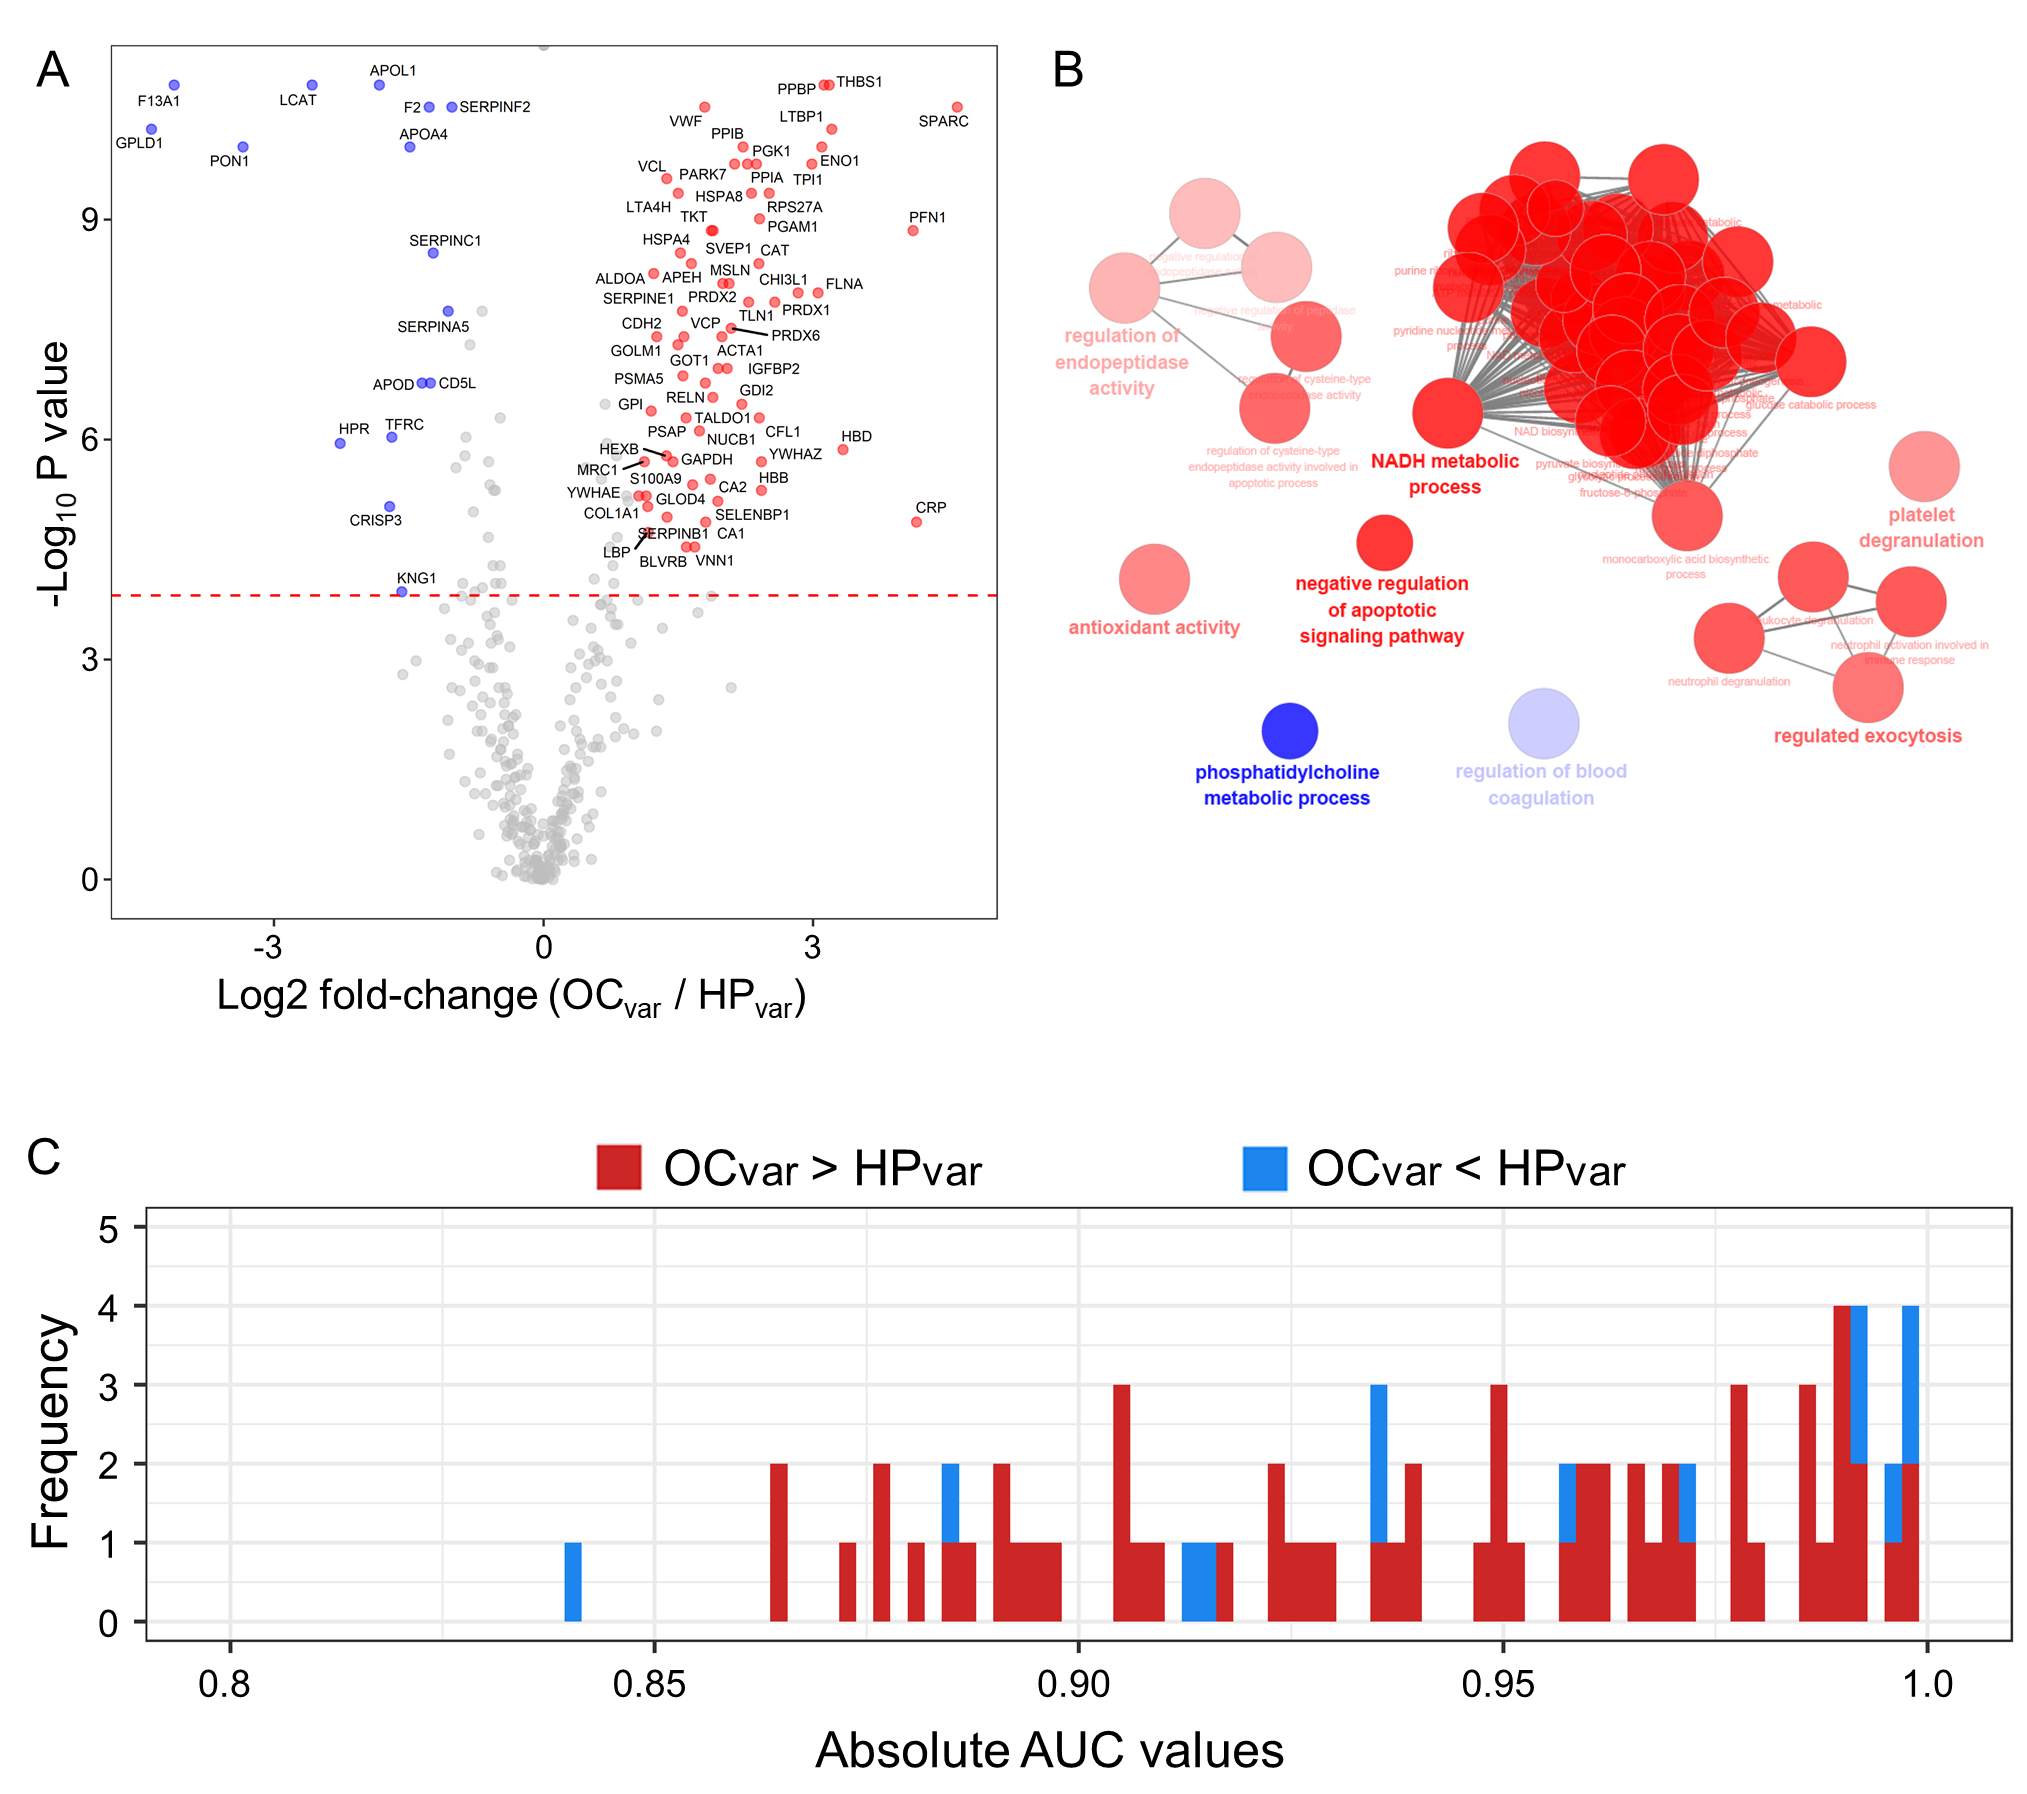
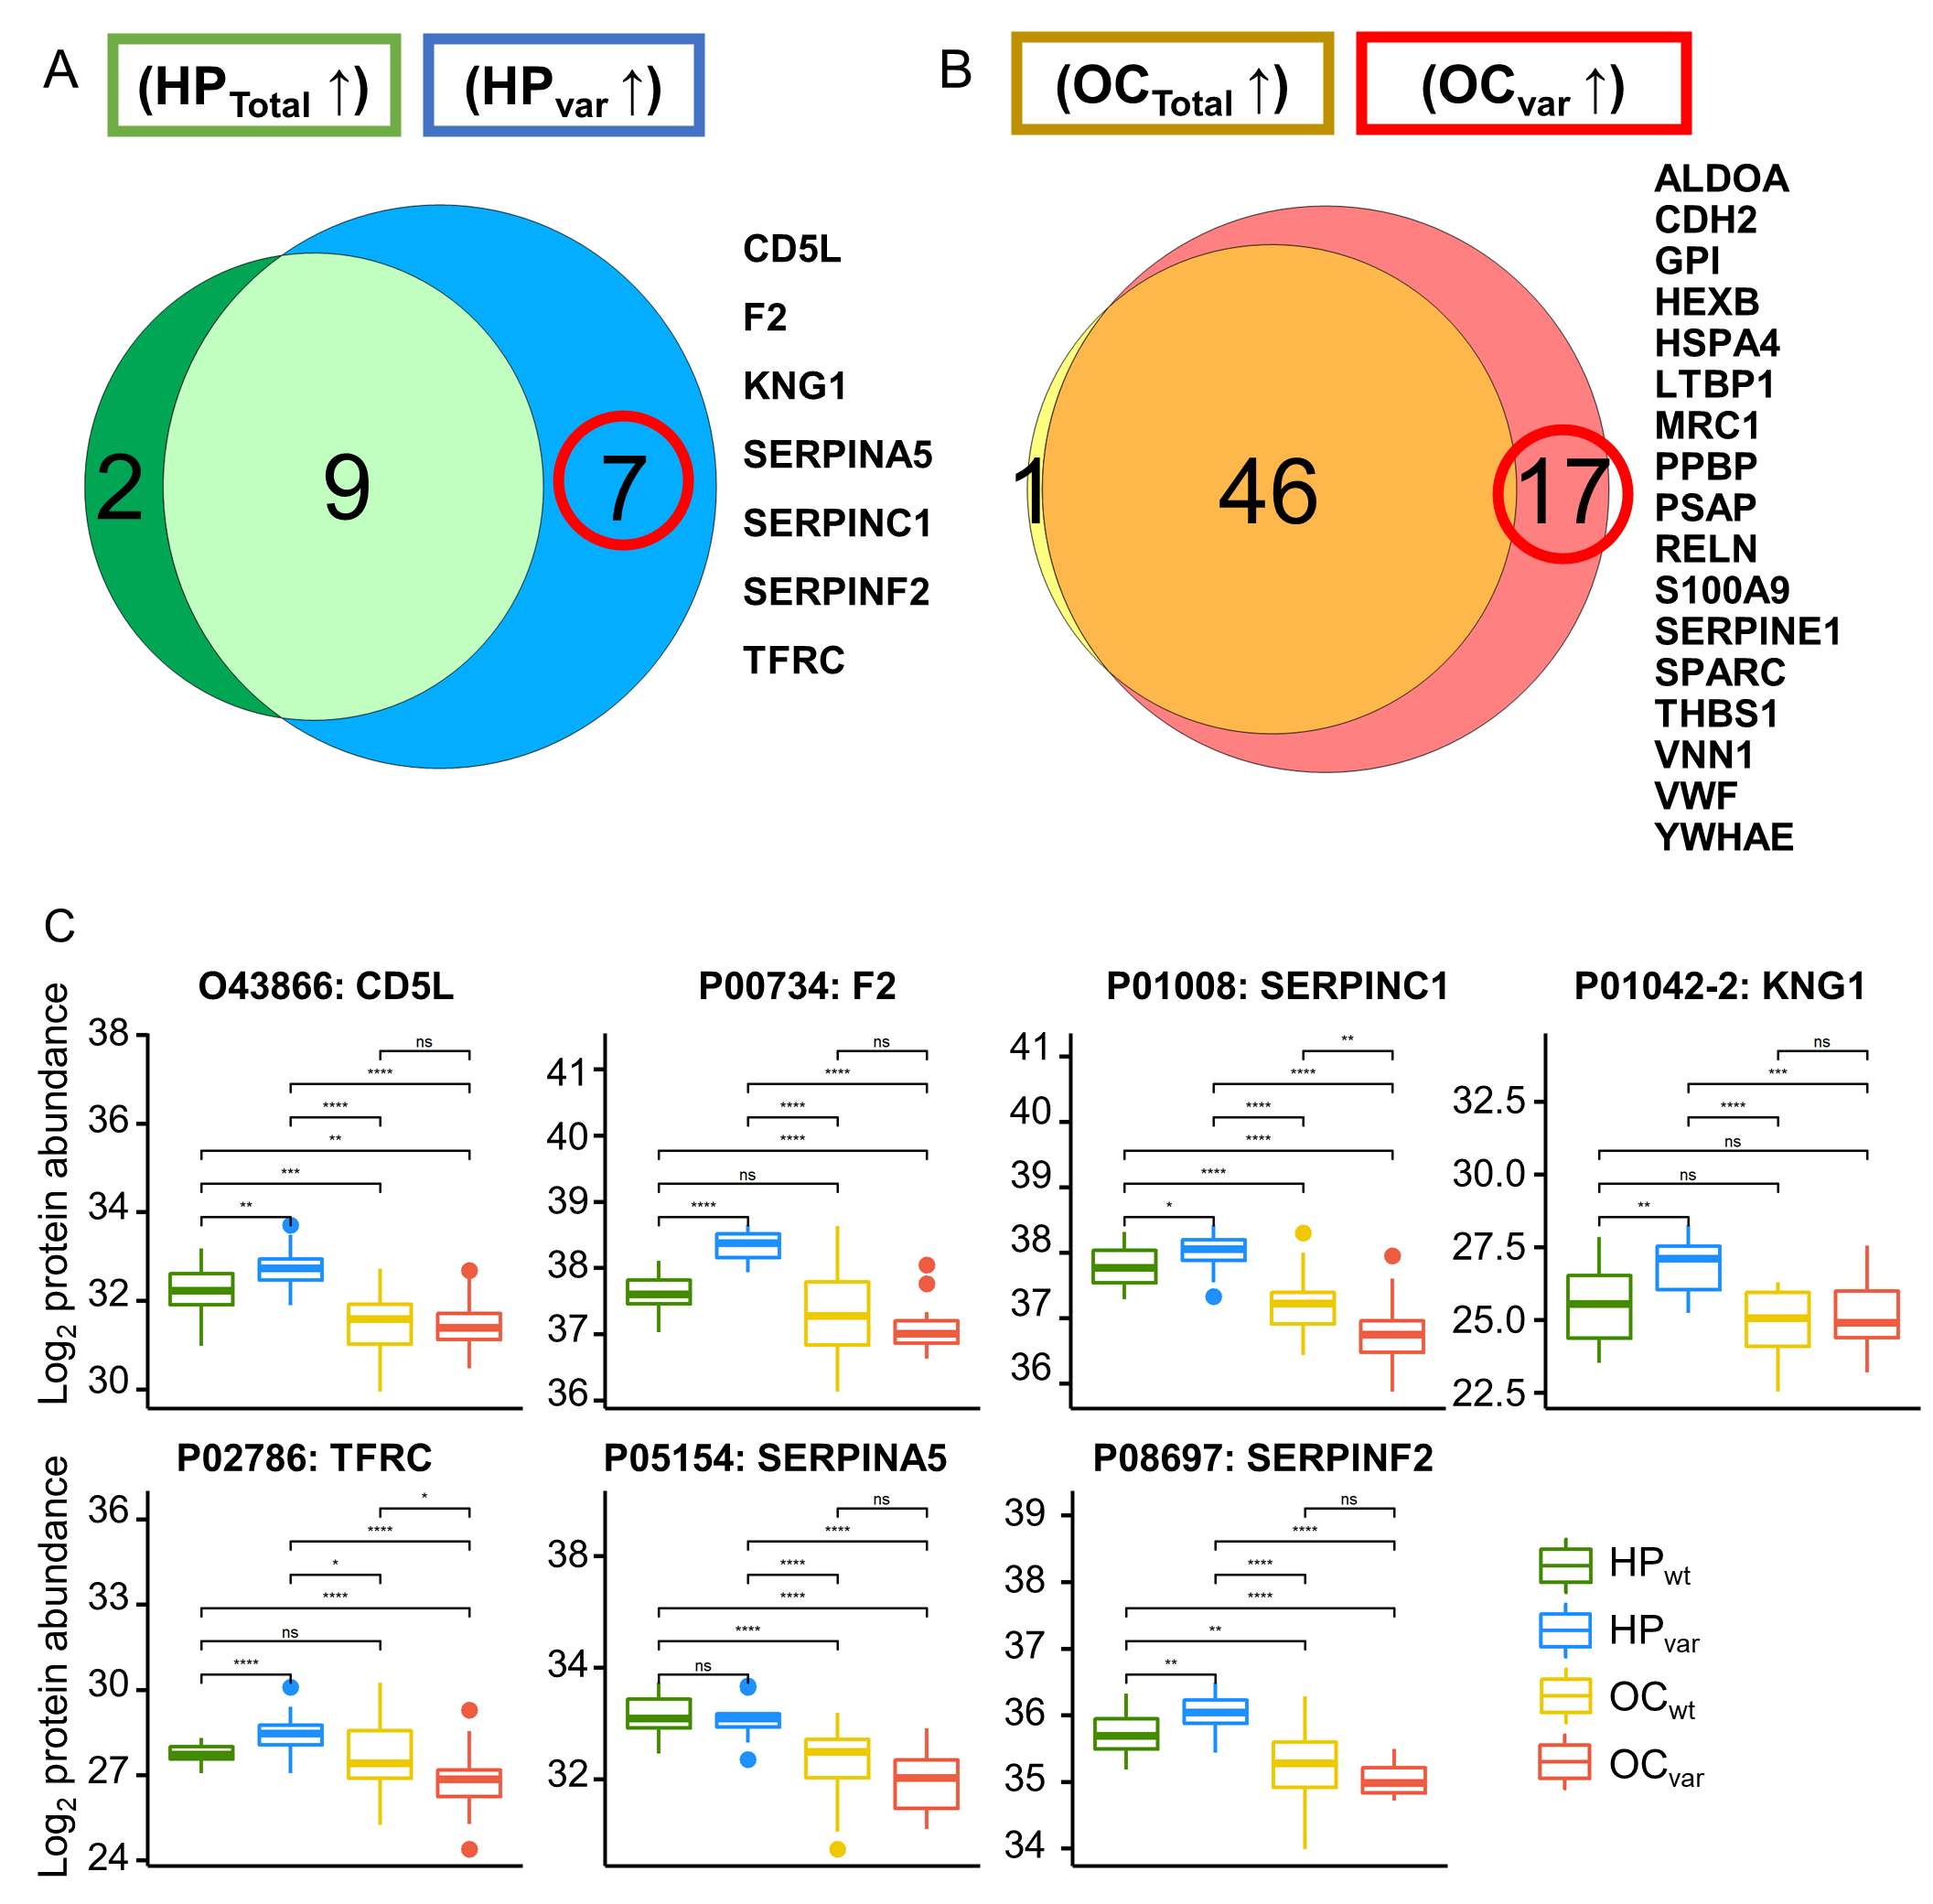
2.5. Scenario II: Differentially Abundant Plasma Proteins between the Healthy Subjects and Ovarian Cancer Patients Harboring BRCA1/2 Variants

To identify novel BRCA1/2 variant-specific markers, we compared the 374 candidate plasma proteins between the HPvar and OCvar subgroups using a nonparametric test and identified 16 proteins as being upregulated in the HPvar group and 63 proteins in the OCvar group using a volcano plot (|log2 fold-change (OCvar/HPvar)| > 1; Bonferroni corrected p-value < 0.05; Figure 4A and Table S4). Using functional gene ontology (GO) analysis, downregulated proteins in the OCvar samples were shown to be highly involved in phosphatidylcholine metabolic process and in the regulation of blood coagulation, while upregulated proteins were found to be related to regulation of endopeptidase activity, antioxidant activity, NADH metabolic processes, the negative regulation of apoptotic signaling pathways, platelet degranulation, and regulated exocytosis in the ClueGo tools (FDR < 0.01; Figure 4B). We subsequently conducted univariate ROC analysis against the OC incidence among the BRCA1/2 carriers (Figure 4C and Table S4) and found that 81 proteins were significant (p < 0.05) and had an AUC value of more than 0.8.

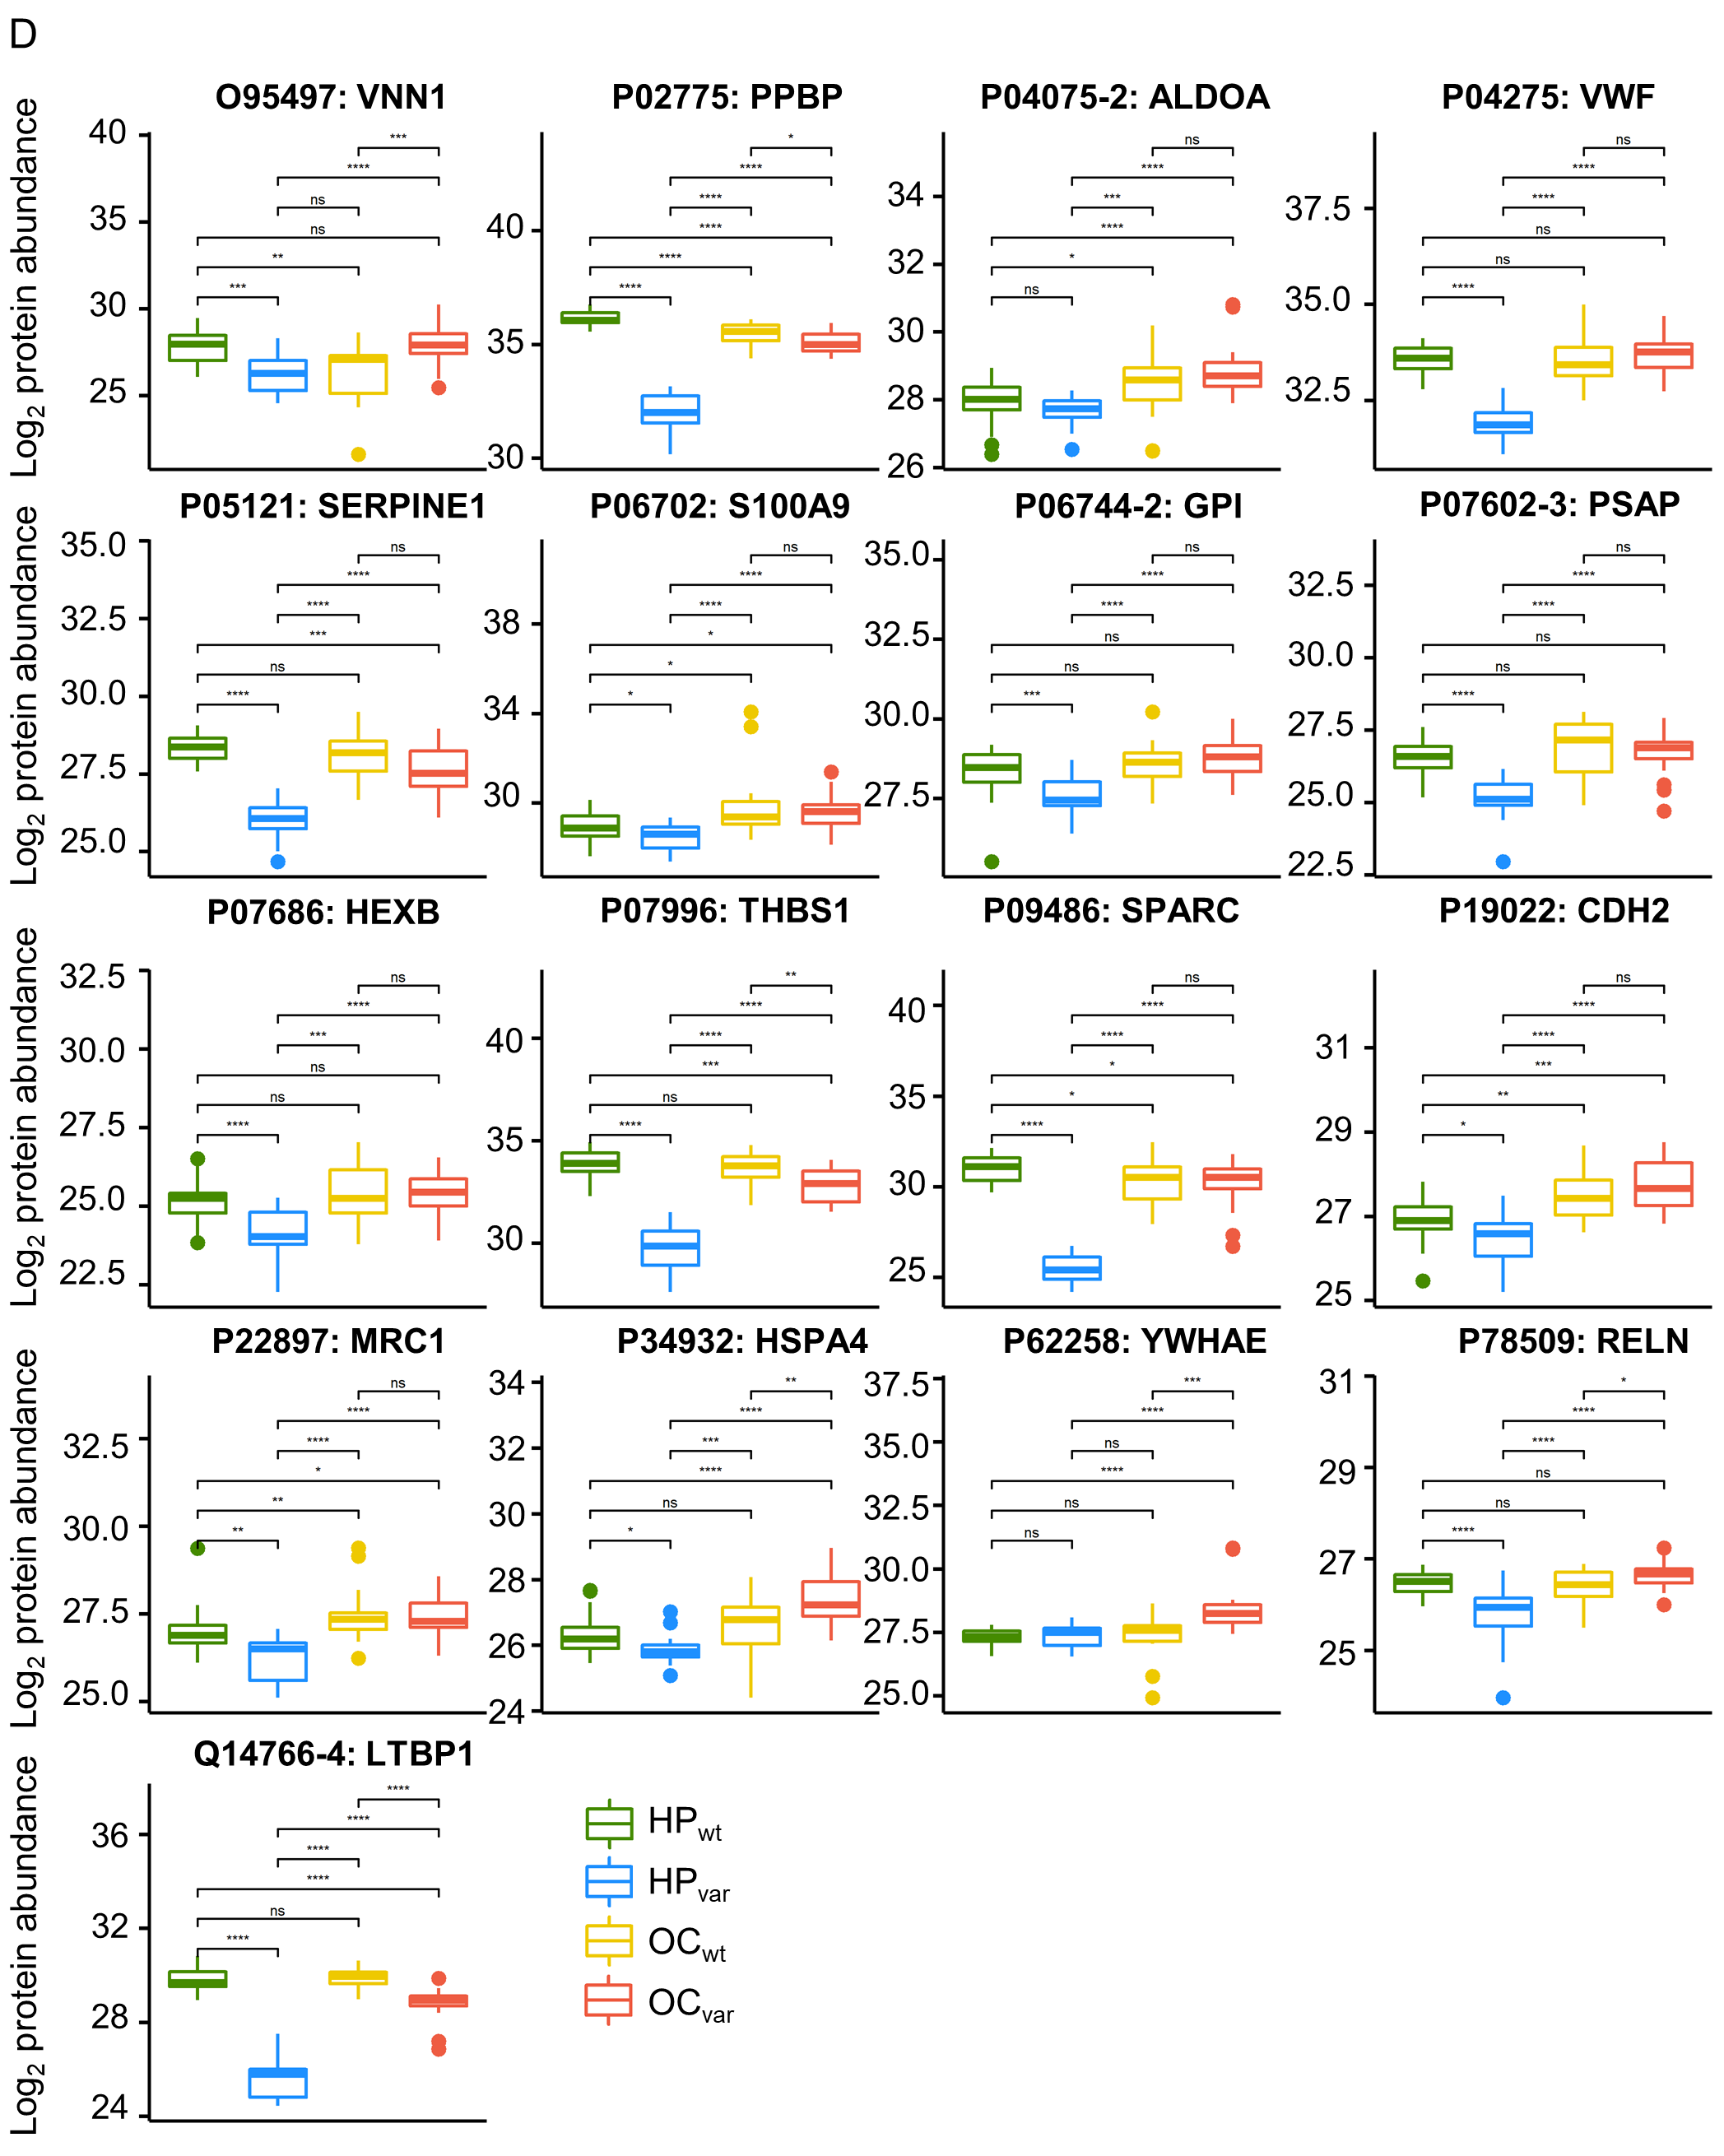
2.6. Significant Plasma Proteins Associated with the BRCA1/2 Carriers

To identify specific markers of hereditary OC related to a BRCA1/2 variant, it was necessary to control for confounding factors. The relative complement of DAP’s set of HPTotal to DAP’s set HPvar and the relative complement of DAP’s set of OCTotal to DAP’s set OCvar were considered mutually exclusive (Figure 5A,B). The seven HPvar up-regulated DAPs are indicated in boxplots for the four groups (Mann–Whitney U Test; Figure 5C). Among these, F2, SERPINC1, and SERPINA5 were found to be related to estrogen procoagulant effects in the Elsevier pathway collection in Enrichr [28]. The association between estrogen and BRCA proteins has been reported previously in breast cancer [29]. Seventeen OCvar up-regulated DAPs are presented in boxplots for the four groups (Mann–Whitney U Test; Figure 5D). Among these candidates, SERPINE1, LTBP1, and THBS1 are involved in TGF-beta receptor signaling, which was reported previously to be regulated by the BRCA gene [30] and to induce “BRCAness” in breast cancer [31]. Moreover, SPARC, SERPINE1, and THBS1 are reported in the Wikipathways 2019 human database to play a role senescence and autophagy in cancer [32].

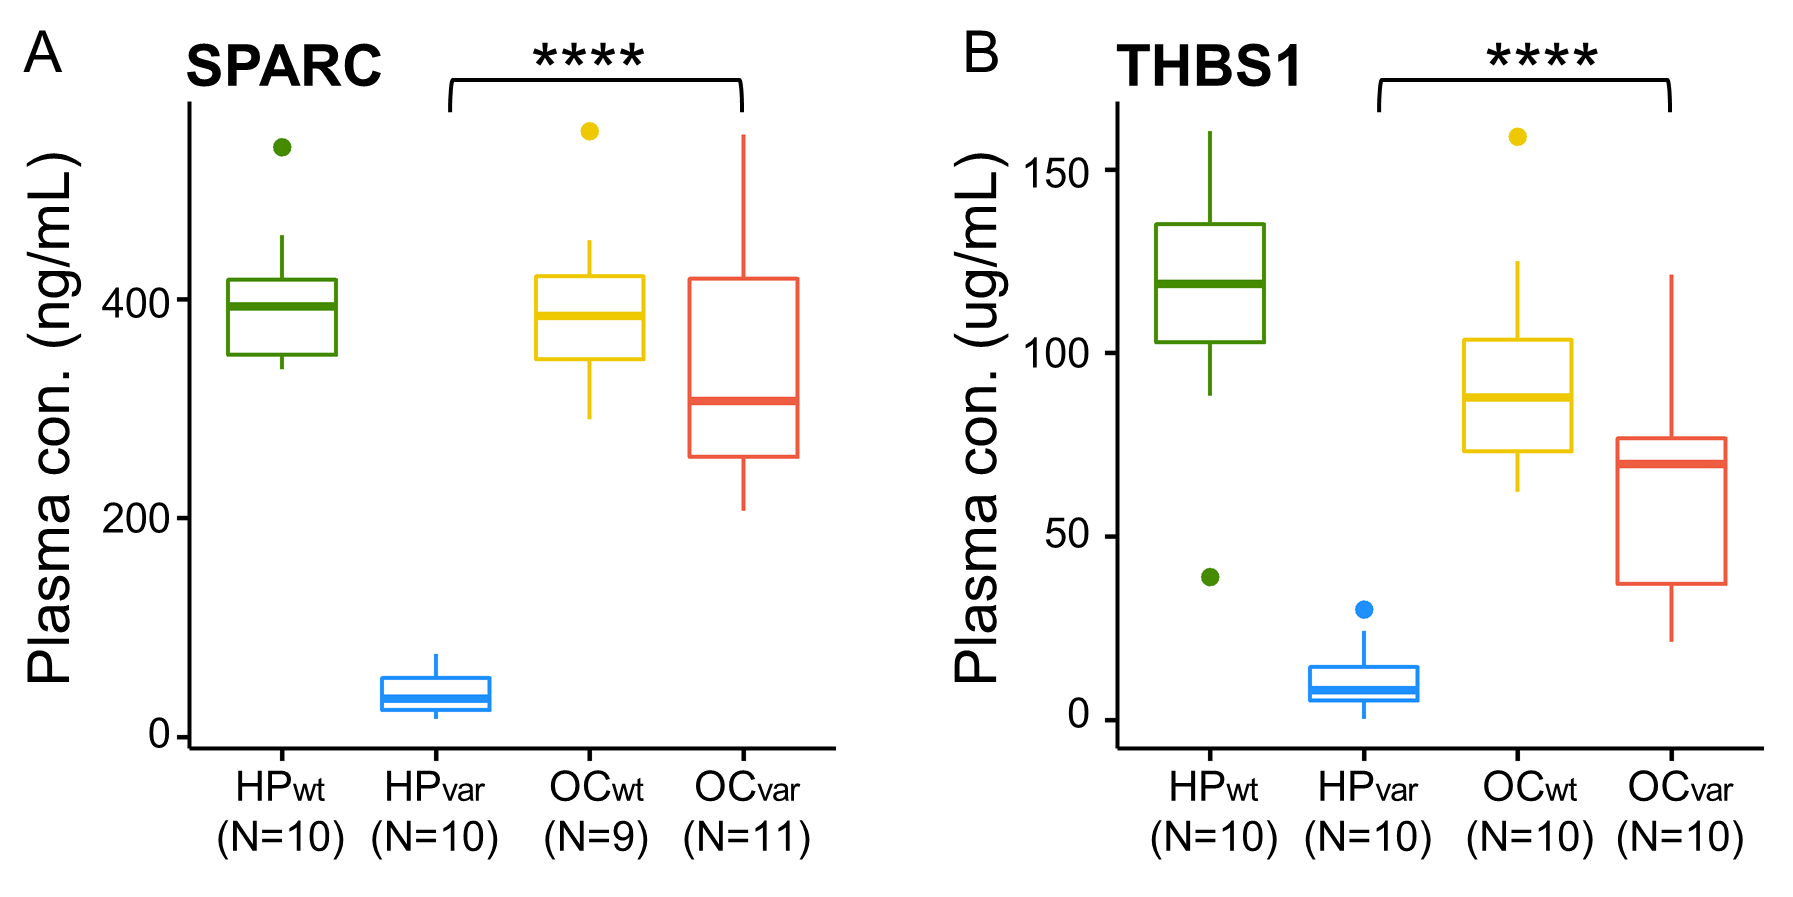
2.7. Validation by ELISA

From among the 24 specific marker candidates of hereditary OC related to a BRCA1/2 variant (Figure 5), we selected six proteins for further validation by ELISA based on their functional associations and performance in the validation set (n = 80). In the assay results, five of these proteins were significantly different between HPvar and OCvar, the exception being SERPINA5 (Figure S2a. Among these factors, the abundance patterns of two proteins, SPARC and THBS1, in the four study groups showed similarity with MS-based quantification (Figure 5D and Figure 6), whereas the other two proteins, SERPINC1, MRC1, seemed to be different in this regard (Figure S2b–d). Interestingly, the AUC values of SPARC and THBS1 were 1.0 and 0.97 in the ROC analysis between HPvar and OCvar. In the case of SPARC, its plasma concentration could be divided into HPvar and OCvar sufficiently, and there was an 8.4-fold difference in the quantitative mean (39.87 vs. 337.35 ng/mL). In the case of THBS1, its plasma concentration in the HPvar subjects (11.29 μg/mL) was significantly lower than that in the OCvar group (65.28 μg/mL), and there was a 5.78-fold difference between the quantitative means. No significant difference in quantification due to the BRCA1 and BRCA2 variants within the HPvar or OCvar groups was observed in the two proteins (p-value > 0.05; Figure S3a–d).

3. Discussion

Using our biomarker discovery workflow system, we initially identified candidate protein biomarkers of a higher hereditary OC risk in BRCA1/2 carriers using LC-MS/MS, and later selected six of these proteins for validation by ELISA. These two methods have advantages and disadvantages [33]. The core advantage of LC-MS/MS is its ability to identify and quantify the abundance of hundreds of plasma proteins with high specificity, but this will include a substantial proportion of false-positive results, even if statistically corrected using the Bonferroni correction [34,35,36,37]. ELISA has the advantage of high sensitivity but would be costly if measuring multiple proteins and is limited by the specificity of the antibodies used. In our current results, four proteins, SERPINC1, CDH2, MRC1, and SERPINA5, had inconsistent results between these methods, but two further proteins, SPARC and THBS1, had consistent findings regardless of the measurement technique, indicating a more robust reliability. Moreover, these two validated protein biomarker candidates for OC have been previously associated with tumorigenic mechanisms. Although the role of SPARC has not yet been fully elucidated, most previous studies have suggested it to be a potential oncogene [38,39]. SPARC has also been associated with tumor cell proliferation and migration, the epithelial-mesenchymal transition, and the promotion of the tumor microenvironment [39,40,41,42]. In addition, a further report has suggested that SPARC may have SPARC-null mice accompany the lack of immune response [38,43]. With regard to THBS1, its plasma levels have been previously associated with OC, whereby a higher concentration is linked to improved survival in these patients [44]. In another study involving patient-derived ovarian carcinoma xenografts, the lower expression of THBS1 in tumor cells was identified as an important factor [45].
We observed some biological aberrations potentially relevant to OC among our study subjects harboring BRCA1/2 variants at the level of the plasma proteome. Through GO analysis, we conducted two statistical tests (HPTotal vs. OCTotal and HPvar vs. OCvar; Figure 3B and Figure 4B) and identified a BRCA1/2 variant-specific OC mechanism, i.e., the negative regulation of an apoptotic signaling pathway [46,47,48]. Prior studies of OC patients have found that antioxidant activity is upregulated and that this is related to first-line anticancer drug treatment [49,50]. In addition, human epithelial ovarian carcinoma cells have been shown to have an activated phosphatidylcholine mechanism [51]. General cancer mechanisms have also been described such as Warburg-effect-related gluconeogenesis [52,53] and neutrophil activation involved in immune responses [54,55,56,57].
In addition, 8–17% of OC are associated with BRCA1/2 variations, whereas 51-54% are associated with breast cancer [58]. Osteoprotegerin, a RANKL inhibitor, has been studied as a predictive biomarker for hereditary breast cancer [16,59]. Among BRCA1/2 carriers, however, reliable methods to predict the risk of OC have been lacking [58]. The locations of variants in BRCA1/2 and their contribution to the risk of developing OC have been identified in many studies [58,60,61]. Risk management strategies in BRCA1/2 variant-positive women mainly involve chemoprevention, RRSO, and periodic surveillance [62,63,64]. Inexpensive oral contraceptives were also recommended and are known to reduce the risk of OC by 40–50% [65,66]. However, they increased the thromboembolic risk as well as the risk of breast cancer development among BRCA1/2 carriers [67,68]. RRSO is another viable approach to OC prevention in BRCA1/2 variant-positive women. This intervention almost completely decreased the risk of cancer but would cause menopause, and the risk of primary peritoneal cancer still remained. NCCN guidelines thus recommend that BRCA1/2 carriers undergo this procedure after childbearing under consultation with an expert (https://www.nccn.org, accessed on 11 May 2021). It must be noted however that RRSO has limitations, that surgical decisions are generally complicated, and that the patients will need subsequent hormone therapy, which has quality of life implications. Post-RRSO cases can also suffer from menopausal symptoms, which may further decrease their quality of life. The recommended age range for RRSO is late 30s to early 40s for BRCA1/2 carriers. Notably however, the number of women undergoing this procedure during the recommended periods has been decreasing because of the higher proportion of women electing to have children in their 30s and 40s [69,70].
A final preventative strategy for OC onset in BRCA1/2 variant-positive women involves a periodic examination protocol consisting of an ultrasound examination and measurement of CA-125 in the blood. This strategy has a high false-positive rate however, and it is fundamentally difficult to block the development of cancer in this way. Two diagnostic methods affect mortality in accordance with a woman’s age. Although it greatly reduced cancer incidence, it was not effective in menopausal women. Our new markers, SPARC and THBS1, could possibly replace CA-125 in periodic testing strategies in these cases. Unlike CA-125, which increases the quantitative value in the blood when cancer occurs, SPARC shows low variation between different genetic backgrounds and is highly expressed upon OC onset. Genetic effects and cancer occurrence can thus be considered at the same time, and the rate of false-positives can be reduced using this biomarker. Hence, screening for plasma SPARC and THBS1 may be a more reliable method of selecting candidates for RRSO and for predicting germline OC occurrence.
We have formulated a decision-tree for healthy women with BRCA1/2 variants, based on our current findings (Figure 7). These women are recommended to first respond to a questionnaire and provide information such as age, family history of cancer, etc., and then undergo gynecologic ultrasonography and proteomic analysis of SPARC and THBS1. If the gynecologic ultrasonogram reveals the presence of ovarian tumors, a full evaluation and clinical management regimen must be implemented using current best-practice guidelines [71]. If the results of the gynecologic ultrasonography show non-specific findings or low levels of SPARC/ THBS1 (maximum value of HPvar, cutoff (ng/mL or μg/mL) = 75.59/30.19), we recommend counseling for the patients including consideration of an RRSO intervention. If the plasma protein levels of SPARC/ THBS1 are high (mean value of OCvar, cut off= 337.35/65.28), we recommend counseling and careful surveillance.
Our study with a plasma proteomic analysis focus had some limitations of note. First, the patient population was homogeneous and small. Each study group (HPwt, HPvar, OCwt, and OCvar) included only 10 participants. However, there were significant differences between the groups in terms of the DAPs that we selected in scenarios I and II, and the sample size was thus sufficient (Tables S3 and S4). Future multicenter studies or the involvement of international consortia such as the Consortium of Investigators of Modifiers of BRCA1/2 (CIMBA) (http://cimba.ccge.medschl.cam.ac.uk/, accessed on 11 May 2021) is warranted to validate our biomarkers and to identify others. In addition, the age range of our healthy participants was 32–42 and that of our OC patients was 57–59 (Table 1). However, our proteomic analyses indicated that the plasma levels of SPARC and THBS1 did not correlate with age (ρ = 0.086; SPARC, ρ = 0.095; THBS1, Spearman correlation coefficient). In addition, the mechanisms underlying OC development include not only germline variants but also somatic variants, a loss of heterozygosity or an allelic deletion, and epigenetic modifications [72]. Other factors can thus contribute to the development of OC independently of germline variants. This should also be a focus of future efforts to identify predictive biomarkers of this cancer. In this study, no differences of abundance of protein markers were noticed between the OC patients with BRCA1 and BRCA2 variants. Our data were supported by previous studies and clinical practices performed in real-world BRCA1/2 target therapies (poly(adenosine diphosphate–ribose) polymerase inhibitors; olaparib and niraparib) and conventional chemotherapies, which are used regardless of BRCA1 or BRCA2 status [73,74,75,76,77].

4. Materials and Methods

4.1. Sample Subjects

All specimens used in this study were obtained with appropriate consent and with the approval of the Institutional Review Board of Seoul St. Mary’s Hospital, the Catholic University of Korea, College of Medicine (IRB number: KC17TESI0690). Plasma samples were obtained preoperatively from 20 OC patients and 20 HPs. A total of 84 plasma samples were obtained for ELISA verification (Table S5). Plasma samples from OC patients were obtained from Seoul St. Mary’s Hospital and the Korean Gynecologic Cancer Bank and from healthy subjects during a medical checkup at Seoul St. Mary’s Hospital. All samples were snap-frozen in liquid nitrogen and stored at −80 °C until analysis.

4.2. Sample Preparation

Plasma samples were prepared sequentially through steps of high abundant plasma protein depletion and trypsin/Lys-C digestion. Initially, fourteen high concentration plasma proteins were depleted through a Human 14 Multiple Affinity Removal (100 × 4.6 mm; MARS14, Agilent, CA, USA) column mounted on an HPLC system (Shimadzu LC20AT HPLC system, Shimadzu LTD, JP). Depleted proteins were digested into peptides using the amicon-adapted enhanced FASP method [78] and salt was removed by the C18 desalting cartridge (Sep-Pak C18 1 cc, Waters, MA, USA). For details, refer to previously published papers [79,80].

4.3. Nano-LC-ESI-MS/MS Analysis

Peptide separation was performed using the Dionex UltiMate 3000 RSLCnano system (Thermo Fisher Scientific, Waltham, MA, USA). The dried samples were reconstituted with 25 μL of 0.1% formic acid, and 5 μL were injected into a C18 Pepmap trap column (20 mm × 100 μm i.d., 5 μm, 100 Å; Thermo Fisher Scientific) and separated by an Acclaim™ Pepmap 100 C18 column (500 mm × 75 μm i.d., 3 μm, 100 Å; Thermo Fisher Scientific) over 200 min (350 nl/min) using a 0–48% acetonitrile gradient in 0.1% formic acid and 5% DMSO for 150 min at 50°C. The LC was coupled to a Q Exactive mass spectrometer (Thermo Fisher Scientific) with a nano-ESI source. Mass spectra were acquired in a data-dependent mode with an automatic switch between a full scan with 20 data-dependent MS/MS scans. The target value for the full scan MS spectra was 3,000,000 with a maximum injection time of 100 ms and a resolution of 70,000 at m/z 400. The ion target value for MS/MS was set to 1,000,000 with a maximum injection time of 50 ms and a resolution of 17,500 at m/z 400. Dynamic exclusion of repeated peptides was applied for 20 s. All MS data have been deposited in the Proteomics Identificiations Database (PRIDE) archive [81] under PXD023508.

4.4. Database Searching and Label-Free Quantitation

The acquired MS/MS spectra were retrieved using the SequestHT on Proteome discoverer (version 2.2, Thermo Fisher Scientific) against the SwissProt human protein sequence database (May 2017). Briefly, precursor mass tolerance was set to ± 10 ppm and MS/MS tolerance was set at 0.02 Da. The search parameters were set as default including cysteine carbamidomethylation as a fixed modification and N-terminal acetylation and methionine oxidation as variable modifications with 2 miscleavages. The false discovery rates were set at 1% for the peptides in each analysis using “Percolator” [82]. From the SEQUEST search output, peptide filters that included peptide confidence, peptide rank, score versus charge state, and search engine rank were set at the default values for the proteome discoverer. Label-free quantitation was performed using the peak intensity for the unique and razor peptides of each protein and excluded peptides including methionine oxidation.

4.5. Normalization of Raw LC-ESI-MS/MS Data

The raw protein abundances of the selected six normalizing proteins, C2, C6, CFH, CFI, LCP1, and SERPINA7, in each sample were divided by the corresponding median value of all samples. The geometric mean of the six ratios of the sample was then used as the normalization scaling factor (NSF) for that sample. The details of this method are also provided in previous studies [83,84].

4.6. ELISA

For each target protein detection, plasma samples were diluted to the same level as the sample diluent provided in the ELISA kit. The following kits were used for each protein: SERPINA5 (MBS938556, MyBioSoure, San Diego, CA, USA), SERPINC1 (DSPC10, R&D Systems, Minneapolis, MN, USA), CDH2 (DY1388-05, R&D Systems), MRC1 (MBS2019261, MyBioSoure), SPARC (DSP00, R&D Systems), THBS1 (MBS701627, MyBioSoure). The ELISA procedures were performed in each case in accordance with the manufacturer’s instructions with no modifications.

4.7. Statistical Analyses

We used two types of Venn diagram drawing tool, jvenn [85] and Venn Diagram Plotter [86] Data were also analyzed using RStudio (version 1.1.456, Boston, MA, USA) including R (version 3.6.0, Vienna, Austria). The statistical R software packages used included ggplot2 for drawing histograms and volcano plots, ggpubr for drawing boxplots, stats for applying the Mann–Whitney test, pcamethods for the PCA analysis, and WMWssp for minimal sample size calculation for the Mann–Whitney U test.

4.8. Pathway Analysis

ClueGo (version 2.5.1) [87] was used to analyze differentially abundant proteins between OCTotal and HPTotal and between OCvar and HPvar study participants. This software was plugged into the Cytoscape (version 3.6.1) [88]. Searches were conducted for GO biological processes only. To group GO terms, the kappa score was set at 0.4 and the number of overlapping genes to combine groups was set at 50%.

5. Conclusions

Effective follow-up monitoring for OC occurrence in BRCA1/2 variant carriers at high risk can be conducted through plasma biomarker-based diagnostic tests.

Supplementary Materials

The following data are available online at https://www.mdpi.com/article/10.3390/cancers13102300/s1. Figure S1. (a) Boxplots of normalized plasma protein abundances determined from duplicate LC-MS/MS runs of the 40 clinical samples (10 ovarian cancer (OC) patients and 10 healthy participants (HP) with or without BRCA1/2 variants). (b) Scatter plot of the normalized log2 abundance and log2 immunoassay concentrations of 238 identified plasma proteins (Pearson correlation coefficient (ρ): 0.7 and p-value: 9.9 × 10⁻⁵). Figure S2. Boxplots of plasma protein concentrations determined by ELISA analysis (ng/mL) of SERPINA5 (a), SERPINC1 (b), CDH2 (c), and MRC1 (d) in the four study groups (HPwt, HPvar, OCwt, and OCvar); * p < 0.05, **** p < 0.0001. Figure S3. Boxplots of plasma protein concentrations determined by ELISA analysis of SPARC (ng/mL) in HPvar (a) and OCvar (b) and THBS1 (μg/mL) in HPvar (c) and OCvar (d) according to BRCA1 and BRCA2 variants; ns: not significant. Table S1. Number of identified proteins and their raw abundance levels determined from duplicate LC-MS/MS runs with the 40 clinical samples. Table S2. Normalized abundance levels of 374 proteins determined from 80 LC-MS/MS runs. Table S3. Differentially abundant proteins between the healthy subjects and ovarian cancer patients. Table S4. Differentially abundant proteins between healthy subjects and ovarian cancer patients all carrying BRCA1/2 variants. Table S5. A total of 80 plasma samples obtained for six ELISA verification tests. Supplementary Methods.

Author Contributions

Conceptualization, Y.J.C. and K.K.; methodology, J.Y. (Jiyoung Yu), J.Y. (Jeonghum Yeom), K.K. and H.-S.A.; validation, J.Y.H., S.L., S.Y.H. and Y.J.; formal analysis, H.-S.A.; investigation, Y.J.C. and H.-S.A.; resources, Y.J.C.; data curation, J.Y. (Jeonghum Yeom), Y.J.C. and H.-S.A.; writing—original draft preparation, H.-S.A., Y.J.C. and K.K.; writing—review and editing, Y.J.C. and K.K.; visualization, H.-S.A.; supervision, Y.J.C.; project administration, Y.J.C.; funding acquisition, Y.J.C. and K.K. All authors have read and agreed to the published version of the manuscript.

Funding

This research was supported by a grant from the National Research Foundation (NRF) funded by the Korean Ministry of Science & ICT (2018M3A9E8021512) and the Korean government (MSIT) (NRF-2019M3E5D3073369).

Institutional Review Board Statement

The study was conducted according to the guidelines of the Declaration of Helsinki, and approved by the Institutional Review Board of Seoul St. Mary’s Hospital, the Catholic University of Korea, College of Medicine (IRB number: KC17TESI0690 approved on 1 May 2014).

Informed Consent Statement

Informed consent was obtained from all subjects involved in the study.

Data Availability Statement

The data that support the findings of this study are available from the corresponding author upon reasonable request.

Acknowledgments

The authors gratefully acknowledge the participation of all patients and investigators involved in this trial.

Conflicts of Interest

The authors declare no conflict of interest.

Abbreviations

OCovarian cancer
CA125cancer antigen 125
RRSOrisk-reducing bilateral salpingo-oophorectomy
RANKreceptor activator of nuclear factor kappa-B
RANKLreceptor activator of nuclear factor kappa-B ligand
LC-MSliquid chromatography-mass spectrometry
ELISAenzyme-linked immunosorbent assay
HPhealthy participant
SDstandard deviation
LC-MS/MSliquid chromatography-tandem mass spectrometry
DAPdifferential abundant protein
FDRfalse discovery rate
ROCreceiver operating characteristic
AUCarea under curve
GOgene ontology
ESI-LC-MS/MSelectrospray ionization liquid chromatography–tandem mass spectrometry
MARS14multiple Affinity Removal Column Human 14
ABCammonium bicarbonate

References

  1. Torre, L.A.; Trabert, B.; DeSantis, C.E.; Miller, K.D.; Samimi, G.; Runowicz, C.D.; Gaudet, M.M.; Jemal, A.; Siegel, R.L. Ovarian cancer statistics, 2018. CA Cancer J. Clin. 2018, 68, 284–296. [Google Scholar] [CrossRef]
  2. Pinsky, P.F.; Yu, K.; Kramer, B.S.; Black, A.; Buys, S.S.; Partridge, E.; Gohagan, J.; Berg, C.D.; Prorok, P.C. Extended mortality results for ovarian cancer screening in the PLCO trial with median 15years follow-up. Gynecol. Oncol. 2016, 143, 270–275. [Google Scholar] [CrossRef] [PubMed] [Green Version]
  3. Jacobs, I.J.; Menon, U.; Ryan, A.; Gentry-Maharaj, A.; Burnell, M.; Kalsi, J.K.; Amso, N.N.; Apostolidou, S.; Benjamin, E.; Cruickshank, D.; et al. Ovarian cancer screening and mortality in the UK Collaborative Trial of Ovarian Cancer Screening (UKCTOCS): A randomised controlled trial. Lancet 2016, 387, 945–956. [Google Scholar] [CrossRef] [Green Version]
  4. Grossman, D.C.; Curry, S.J.; Owens, D.K.; Barry, M.J.; Davidson, K.W.; Doubeni, C.A.; Epling, J.W., Jr.; Kemper, A.R.; Krist, A.H.; Kurth, A.E.; et al. Screening for Ovarian Cancer: US Preventive Services Task Force Recommendation Statement. JAMA 2018, 319, 588–594. [Google Scholar] [CrossRef] [PubMed] [Green Version]
  5. Norquist, B.M.; Harrell, M.I.; Brady, M.F.; Walsh, T.; Lee, M.K.; Gulsuner, S.; Bernards, S.S.; Casadei, S.; Yi, Q.; Burger, R.A.; et al. Inherited Mutations in Women With Ovarian Carcinoma. JAMA Oncol. 2016, 2, 482–490. [Google Scholar] [CrossRef] [PubMed]
  6. Alsop, K.; Fereday, S.; Meldrum, C.; deFazio, A.; Emmanuel, C.; George, J.; Dobrovic, A.; Birrer, M.J.; Webb, P.M.; Stewart, C.; et al. BRCA mutation frequency and patterns of treatment response in BRCA mutation-positive women with ovarian cancer: A report from the Australian Ovarian Cancer Study Group. J. Clin. Oncol. 2012, 30, 2654–2663. [Google Scholar] [CrossRef] [Green Version]
  7. Ramus, S.J.; Song, H.; Dicks, E.; Tyrer, J.P.; Rosenthal, A.N.; Intermaggio, M.P.; Fraser, L.; Gentry-Maharaj, A.; Hayward, J.; Philpott, S.; et al. Germline Mutations in the BRIP1, BARD1, PALB2, and NBN Genes in Women With Ovarian Cancer. J. Natl. Cancer Inst. 2015, 107, djv214. [Google Scholar] [CrossRef] [PubMed]
  8. Song, H.; Dicks, E.; Ramus, S.J.; Tyrer, J.P.; Intermaggio, M.P.; Hayward, J.; Edlund, C.K.; Conti, D.; Harrington, P.; Fraser, L.; et al. Contribution of Germline Mutations in the RAD51B, RAD51C, and RAD51D Genes to Ovarian Cancer in the Population. J. Clin. Oncol. 2015, 33, 2901–2907. [Google Scholar] [CrossRef] [Green Version]
  9. Meeuwissen, P.A.; Seynaeve, C.; Brekelmans, C.T.; Meijers-Heijboer, H.J.; Klijn, J.G.; Burger, C.W. Outcome of surveillance and prophylactic salpingo-oophorectomy in asymptomatic women at high risk for ovarian cancer. Gynecol. Oncol. 2005, 97, 476–482. [Google Scholar] [CrossRef]
  10. Finch, A.P.; Lubinski, J.; Moller, P.; Singer, C.F.; Karlan, B.; Senter, L.; Rosen, B.; Maehle, L.; Ghadirian, P.; Cybulski, C.; et al. Impact of oophorectomy on cancer incidence and mortality in women with a BRCA1 or BRCA2 mutation. J. Clin. Oncol. 2014, 32, 1547–1553. [Google Scholar] [CrossRef] [Green Version]
  11. Walker, J.L.; Powell, C.B.; Chen, L.M.; Carter, J.; Bae Jump, V.L.; Parker, L.P.; Borowsky, M.E.; Gibb, R.K. Society of Gynecologic Oncology recommendations for the prevention of ovarian cancer. Cancer 2015, 121, 2108–2120. [Google Scholar] [CrossRef] [PubMed]
  12. Daly, M.B.; Pilarski, R.; Berry, M.; Buys, S.S.; Farmer, M.; Friedman, S.; Garber, J.E.; Kauff, N.D.; Khan, S.; Klein, C.; et al. NCCN Guidelines Insights: Genetic/Familial High-Risk Assessment: Breast and Ovarian, Version 2.2017. J. Natl. Compr. Cancer Netw. 2017, 15, 9–20. [Google Scholar] [CrossRef]
  13. Domchek, S.M.; Friebel, T.M.; Singer, C.F.; Evans, D.G.; Lynch, H.T.; Isaacs, C.; Garber, J.E.; Neuhausen, S.L.; Matloff, E.; Eeles, R.; et al. Association of risk-reducing surgery in BRCA1 or BRCA2 mutation carriers with cancer risk and mortality. JAMA 2010, 304, 967–975. [Google Scholar] [CrossRef] [PubMed] [Green Version]
  14. Michelsen, T.M.; Pripp, A.H.; Tonstad, S.; Trope, C.G.; Dorum, A. Metabolic syndrome after risk-reducing salpingo-oophorectomy in women at high risk for hereditary breast ovarian cancer: A controlled observational study. Eur. J. Cancer 2009, 45, 82–89. [Google Scholar] [CrossRef] [Green Version]
  15. Kotsopoulos, J.; Huzarski, T.; Gronwald, J.; Singer, C.F.; Moller, P.; Lynch, H.T.; Armel, S.; Karlan, B.; Foulkes, W.D.; Neuhausen, S.L.; et al. Bilateral Oophorectomy and Breast Cancer Risk in BRCA1 and BRCA2 Mutation Carriers. J. Natl. Cancer Inst. 2017, 109, djw177. [Google Scholar] [CrossRef] [PubMed] [Green Version]
  16. Oden, L.; Akbari, M.; Zaman, T.; Singer, C.F.; Sun, P.; Narod, S.A.; Salmena, L.; Kotsopoulos, J. Plasma osteoprotegerin and breast cancer risk in BRCA1 and BRCA2 mutation carriers. Oncotarget 2016, 7, 86687–86694. [Google Scholar] [CrossRef] [PubMed] [Green Version]
  17. Nolan, E.; Vaillant, F.; Branstetter, D.; Pal, B.; Giner, G.; Whitehead, L.; Lok, S.W.; Mann, G.B.; Kathleen Cuningham Foundation Consortium for Research into Familial Breast Cancer (kConFab); Rohrbach, K.; et al. RANK ligand as a potential target for breast cancer prevention in BRCA1-mutation carriers. Nat. Med. 2016, 22, 933–939. [Google Scholar] [CrossRef]
  18. Cheng, Y.; Liu, C.; Zhang, N.; Wang, S.; Zhang, Z. Proteomics analysis for finding serum markers of ovarian cancer. Biomed. Res. Int. 2014, 2014, 179040. [Google Scholar] [CrossRef] [Green Version]
  19. Dufresne, J.; Bowden, P.; Thavarajah, T.; Florentinus-Mefailoski, A.; Chen, Z.Z.; Tucholska, M.; Norzin, T.; Ho, M.T.; Phan, M.; Mohamed, N.; et al. The plasma peptides of breast versus ovarian cancer. Clin. Proteom. 2019, 16, 43. [Google Scholar] [CrossRef] [Green Version]
  20. Lu, X.; Li, Y.; Xia, B.; Bai, Y.; Zhang, K.; Zhang, X.; Xie, H.; Sun, F.; Hou, Y.; Li, K. Selection of small plasma peptides for the auxiliary diagnosis and prognosis of epithelial ovarian cancer by using UPLC/MS-based nontargeted and targeted analyses. Int. J. Cancer 2019, 144, 2033–2042. [Google Scholar] [CrossRef] [PubMed]
  21. Gschwantler-Kaulich, D.; Weingartshofer, S.; Rappaport-Furhauser, C.; Zeillinger, R.; Pils, D.; Muhr, D.; Braicu, E.I.; Kastner, M.T.; Tan, Y.Y.; Semmler, L.; et al. Correction: Diagnostic markers for the detection of ovarian cancer in BRCA1 mutation carriers. PLoS ONE 2018, 13, e0196142. [Google Scholar] [CrossRef] [Green Version]
  22. Dieters-Castator, D.Z.; Rambau, P.F.; Kelemen, L.E.; Siegers, G.M.; Lajoie, G.A.; Postovit, L.M.; Kobel, M. Proteomics-Derived Biomarker Panel Improves Diagnostic Precision to Classify Endometrioid and High-grade Serous Ovarian Carcinoma. Clin. Cancer Res. 2019, 25, 4309–4319. [Google Scholar] [CrossRef] [Green Version]
  23. Zhang, B.; Barekati, Z.; Kohler, C.; Radpour, R.; Asadollahi, R.; Holzgreve, W.; Zhong, X.Y. Proteomics and biomarkers for ovarian cancer diagnosis. Ann. Clin. Lab. Sci. 2010, 40, 218–225. [Google Scholar] [CrossRef]
  24. Ma, W.; Chen, L.S.; Ozbek, U.; Han, S.W.; Lin, C.; Paulovich, A.G.; Zhong, H.; Wang, P. Integrative Proteo-genomic Analysis to Construct CNA-protein Regulatory Map in Breast and Ovarian Tumors. Mol. Cell. Proteom. 2019, 18, S66–S81. [Google Scholar] [CrossRef] [PubMed] [Green Version]
  25. Worzfeld, T.; Finkernagel, F.; Reinartz, S.; Konzer, A.; Adhikary, T.; Nist, A.; Stiewe, T.; Wagner, U.; Looso, M.; Graumann, J.; et al. Proteotranscriptomics Reveal Signaling Networks in the Ovarian Cancer Microenvironment. Mol. Cell. Proteom. 2018, 17, 270–289. [Google Scholar] [CrossRef] [Green Version]
  26. Zhang, H.; Liu, T.; Zhang, Z.; Payne, S.H.; Zhang, B.; McDermott, J.E.; Zhou, J.Y.; Petyuk, V.A.; Chen, L.; Ray, D.; et al. Integrated Proteogenomic Characterization of Human High-Grade Serous Ovarian Cancer. Cell 2016, 166, 755–765. [Google Scholar] [CrossRef] [Green Version]
  27. Nanjappa, V.; Thomas, J.K.; Marimuthu, A.; Muthusamy, B.; Radhakrishnan, A.; Sharma, R.; Ahmad Khan, A.; Balakrishnan, L.; Sahasrabuddhe, N.A.; Kumar, S.; et al. Plasma Proteome Database as a resource for proteomics research: 2014 update. Nucleic Acids Res. 2014, 42, D959–D965. [Google Scholar] [CrossRef] [PubMed] [Green Version]
  28. Kuleshov, M.V.; Jones, M.R.; Rouillard, A.D.; Fernandez, N.F.; Duan, Q.; Wang, Z.; Koplev, S.; Jenkins, S.L.; Jagodnik, K.M.; Lachmann, A.; et al. Enrichr: A comprehensive gene set enrichment analysis web server 2016 update. Nucleic Acids Res. 2016, 44, W90–W97. [Google Scholar] [CrossRef] [Green Version]
  29. Wang, L.; Di, L.J. BRCA1 and estrogen/estrogen receptor in breast cancer: Where they interact? Int. J. Biol. Sci. 2014, 10, 566–575. [Google Scholar] [CrossRef] [PubMed] [Green Version]
  30. Li, D.; Kang, N.; Ji, J.; Zhan, Q. BRCA1 regulates transforming growth factor-beta (TGF-beta1) signaling through Gadd45a by enhancing the protein stability of Smad4. Mol. Oncol. 2015, 9, 1655–1666. [Google Scholar] [CrossRef] [PubMed] [Green Version]
  31. Liu, L.; Zhou, W.; Cheng, C.T.; Ren, X.; Somlo, G.; Fong, M.Y.; Chin, A.R.; Li, H.; Yu, Y.; Xu, Y.; et al. TGFbeta induces “BRCAness” and sensitivity to PARP inhibition in breast cancer by regulating DNA-repair genes. Mol. Cancer Res. 2014, 12, 1597–1609. [Google Scholar] [CrossRef] [Green Version]
  32. Kutmon, M.; Riutta, A.; Nunes, N.; Hanspers, K.; Willighagen, E.L.; Bohler, A.; Melius, J.; Waagmeester, A.; Sinha, S.R.; Miller, R.; et al. WikiPathways: Capturing the full diversity of pathway knowledge. Nucleic Acids Res. 2016, 44, D488–D494. [Google Scholar] [CrossRef]
  33. Picotti, P.; Aebersold, R. Selected reaction monitoring-based proteomics: Workflows, potential, pitfalls and future directions. Nat. Methods 2012, 9, 555–566. [Google Scholar] [CrossRef]
  34. Crutchfield, C.A.; Thomas, S.N.; Sokoll, L.J.; Chan, D.W. Advances in mass spectrometry-based clinical biomarker discovery. Clin. Proteom. 2016, 13, 1. [Google Scholar] [CrossRef] [Green Version]
  35. Kennedy, J.J.; Abbatiello, S.E.; Kim, K.; Yan, P.; Whiteaker, J.R.; Lin, C.; Kim, J.S.; Zhang, Y.; Wang, X.; Ivey, R.G.; et al. Demonstrating the feasibility of large-scale development of standardized assays to quantify human proteins. Nat. Methods 2014, 11, 149–155. [Google Scholar] [CrossRef]
  36. Keshishian, H.; Burgess, M.W.; Gillette, M.A.; Mertins, P.; Clauser, K.R.; Mani, D.R.; Kuhn, E.W.; Farrell, L.A.; Gerszten, R.E.; Carr, S.A. Multiplexed, Quantitative Workflow for Sensitive Biomarker Discovery in Plasma Yields Novel Candidates for Early Myocardial Injury. Mol. Cell. Proteom. 2015, 14, 2375–2393. [Google Scholar] [CrossRef] [PubMed] [Green Version]
  37. Parker, C.E.; Borchers, C.H. Mass spectrometry based biomarker discovery, verification, and validation--quality assurance and control of protein biomarker assays. Mol. Oncol. 2014, 8, 840–858. [Google Scholar] [CrossRef] [PubMed]
  38. Yan, J.; Zhang, J.; Zhang, X.; Li, X.; Li, L.; Li, Z.; Chen, R.; Zhang, L.; Wu, J.; Wang, X.; et al. SPARC is down-regulated by DNA methylation and functions as a tumor suppressor in T-cell lymphoma. Exp. Cell Res. 2018, 364, 125–132. [Google Scholar] [CrossRef] [PubMed]
  39. Feng, J.; Tang, L. SPARC in Tumor Pathophysiology and as a Potential Therapeutic Target. Curr. Pharm. Des. 2014, 20, 6182–6190. [Google Scholar] [CrossRef] [PubMed]
  40. Chang, C.H.; Yen, M.C.; Liao, S.H.; Hsu, Y.L.; Lai, C.S.; Chang, K.P.; Hsu, Y.L. Secreted Protein Acidic and Rich in Cysteine (SPARC) Enhances Cell Proliferation, Migration, and Epithelial Mesenchymal Transition, and SPARC Expression is Associated with Tumor Grade in Head and Neck Cancer. Int. J. Mol. Sci. 2017, 18, 1556. [Google Scholar] [CrossRef] [Green Version]
  41. Clark, C.J.; Sage, E.H. A prototypic matricellular protein in the tumor microenvironment—Where there’s SPARC, there’s fire. J. Cell. Biochem. 2008, 104, 721–732. [Google Scholar] [CrossRef] [PubMed]
  42. Xu, J.; Yang, S.; Gu, X.; Shen, H.; Wang, L.; Xu, W.; Fang, L.; Mao, Y.; Xu, L.; Chen, Y.; et al. SPARC correlates with unfavorable outcome and promotes tumor growth in lung squamous cell carcinoma. Exp. Mol. Pathol. 2019, 110, 104276. [Google Scholar] [CrossRef]
  43. Rempel, S.A.; Hawley, R.C.; Gutierrez, J.A.; Mouzon, E.; Bobbitt, K.R.; Lemke, N.; Schultz, C.R.; Schultz, L.R.; Golembieski, W.; Koblinski, J.; et al. Splenic and immune alterations of the Sparc-null mouse accompany a lack of immune response. Genes Immun. 2007, 8, 262–274. [Google Scholar] [CrossRef] [PubMed] [Green Version]
  44. Cymbaluk-Ploska, A.; Chudecka-Glaz, A.; Pius-Sadowska, E.; Machalinski, B.; Menkiszak, J. Thrombospondin-I concentrations behavior in plasma of patients with ovarian cancer. Cancer Biomark. 2017, 20, 31–39. [Google Scholar] [CrossRef] [PubMed]
  45. Pinessi, D.; Ostano, P.; Borsotti, P.; Bello, E.; Guffanti, F.; Bizzaro, F.; Frapolli, R.; Bani, M.R.; Chiorino, G.; Taraboletti, G.; et al. Expression of thrombospondin-1 by tumor cells in patient-derived ovarian carcinoma xenografts. Connect. Tissue Res. 2015, 56, 355–363. [Google Scholar] [CrossRef] [PubMed]
  46. Elledge, S.J.; Amon, A. The BRCA1 suppressor hypothesis: An explanation for the tissue-specific tumor development in BRCA1 patients. Cancer Cell 2002, 1, 129–132. [Google Scholar] [CrossRef] [Green Version]
  47. Levine, D.A.; Federici, M.G.; Reuter, V.E.; Boyd, J. Cell proliferation and apoptosis in BRCA-associated hereditary ovarian cancer. Gynecol. Oncol. 2002, 85, 431–434. [Google Scholar] [CrossRef] [PubMed]
  48. Thangaraju, M.; Kaufmann, S.H.; Couch, F.J. BRCA1 facilitates stress-induced apoptosis in breast and ovarian cancer cell lines. J. Biol. Chem. 2000, 275, 33487–33496. [Google Scholar] [CrossRef] [PubMed] [Green Version]
  49. Drisko, J.A.; Chapman, J.; Hunter, V.J. The use of antioxidants with first-line chemotherapy in two cases of ovarian cancer. J. Am. Coll. Nutr. 2003, 22, 118–123. [Google Scholar] [CrossRef]
  50. Yang, W.; Toffa, S.E.; Lohn, J.W.; Seifalian, A.M.; Winslet, M.C. Malignant ascites increases the antioxidant ability of human ovarian (SKOV-3) and gastric adenocarcinoma (KATO-III) cells. Gynecol. Oncol. 2005, 96, 430–438. [Google Scholar] [CrossRef] [PubMed]
  51. Iorio, E.; Mezzanzanica, D.; Alberti, P.; Spadaro, F.; Ramoni, C.; D‘Ascenzo, S.; Millimaggi, D.; Pavan, A.; Dolo, V.; Canevari, S.; et al. Alterations of choline phospholipid metabolism in ovarian tumor progression. Cancer Res. 2005, 65, 9369–9376. [Google Scholar] [CrossRef] [PubMed] [Green Version]
  52. Caneba, C.A.; Yang, L.; Baddour, J.; Curtis, R.; Win, J.; Hartig, S.; Marini, J.; Nagrath, D. Nitric oxide is a positive regulator of the Warburg effect in ovarian cancer cells. Cell Death Dis. 2014, 5, e1302. [Google Scholar] [CrossRef]
  53. Han, C.Y.; Patten, D.A.; Richardson, R.B.; Harper, M.E.; Tsang, B.K. Tumor metabolism regulating chemosensitivity in ovarian cancer. Genes Cancer 2018, 9, 155–175. [Google Scholar] [CrossRef] [PubMed] [Green Version]
  54. Baci, D.; Bosi, A.; Gallazzi, M.; Rizzi, M.; Noonan, D.M.; Poggi, A.; Bruno, A.; Mortara, L. The Ovarian Cancer Tumor Immune Microenvironment (TIME) as Target for Therapy: A Focus on Innate Immunity Cells as Therapeutic Effectors. Int. J. Mol. Sci. 2020, 21, 3125. [Google Scholar] [CrossRef] [PubMed]
  55. Oberg, H.H.; Wesch, D.; Kalyan, S.; Kabelitz, D. Regulatory Interactions Between Neutrophils, Tumor Cells and T Cells. Front. Immunol. 2019, 10, 1690. [Google Scholar] [CrossRef] [Green Version]
  56. Singel, K.L.; Emmons, T.R.; Khan, A.N.H.; Mayor, P.C.; Shen, S.; Wong, J.T.; Morrell, K.; Eng, K.H.; Mark, J.; Bankert, R.B.; et al. Mature neutrophils suppress T cell immunity in ovarian cancer microenvironment. JCI Insight 2019, 4. [Google Scholar] [CrossRef] [PubMed] [Green Version]
  57. Singel, K.L.; Segal, B.H. Neutrophils in the tumor microenvironment: Trying to heal the wound that cannot heal. Immunol. Rev. 2016, 273, 329–343. [Google Scholar] [CrossRef] [PubMed] [Green Version]
  58. Rebbeck, T.R.; Mitra, N.; Wan, F.; Sinilnikova, O.M.; Healey, S.; McGuffog, L.; Mazoyer, S.; Chenevix-Trench, G.; Easton, D.F.; Antoniou, A.C.; et al. Association of type and location of BRCA1 and BRCA2 mutations with risk of breast and ovarian cancer. JAMA 2015, 313, 1347–1361. [Google Scholar] [CrossRef] [Green Version]
  59. Widschwendter, M.; Burnell, M.; Fraser, L.; Rosenthal, A.N.; Philpott, S.; Reisel, D.; Dubeau, L.; Cline, M.; Pan, Y.; Yi, P.C.; et al. Osteoprotegerin (OPG), The Endogenous Inhibitor of Receptor Activator of NF-kappaB Ligand (RANKL), is Dysregulated in BRCA Mutation Carriers. EBioMedicine 2015, 2, 1331–1339. [Google Scholar] [CrossRef] [Green Version]
  60. Kuchenbaecker, K.B.; Hopper, J.L.; Barnes, D.R.; Phillips, K.A.; Mooij, T.M.; Roos-Blom, M.J.; Jervis, S.; van Leeuwen, F.E.; Milne, R.L.; Andrieu, N.; et al. Risks of Breast, Ovarian, and Contralateral Breast Cancer for BRCA1 and BRCA2 Mutation Carriers. JAMA 2017, 317, 2402–2416. [Google Scholar] [CrossRef] [Green Version]
  61. Bolton, K.L.; Chenevix-Trench, G.; Goh, C.; Sadetzki, S.; Ramus, S.J.; Karlan, B.Y.; Lambrechts, D.; Despierre, E.; Barrowdale, D.; McGuffog, L.; et al. Association between BRCA1 and BRCA2 mutations and survival in women with invasive epithelial ovarian cancer. JAMA 2012, 307, 382–390. [Google Scholar] [CrossRef] [Green Version]
  62. Hartmann, L.C.; Lindor, N.M. The Role of Risk-Reducing Surgery in Hereditary Breast and Ovarian Cancer. N. Engl. J. Med. 2016, 374, 454–468. [Google Scholar] [CrossRef]
  63. Pruthi, S.; Gostout, B.S.; Lindor, N.M. Identification and Management of Women With BRCA Mutations or Hereditary Predisposition for Breast and Ovarian Cancer. Mayo Clin. Proc. 2010, 85, 1111–1120. [Google Scholar] [CrossRef] [Green Version]
  64. Manchanda, R.; Lieberman, S.; Gaba, F.; Lahad, A.; Levy-Lahad, E. Population Screening for Inherited Predisposition to Breast and Ovarian Cancer. Annu. Rev. Genom. Hum. Genet. 2020, 21, 373–412. [Google Scholar] [CrossRef] [PubMed]
  65. Narod, S.A.; Risch, H.; Moslehi, R.; Dorum, A.; Neuhausen, S.; Olsson, H.; Provencher, D.; Radice, P.; Evans, G.; Bishop, S.; et al. Oral contraceptives and the risk of hereditary ovarian cancer. Hereditary Ovarian Cancer Clinical Study Group. N. Engl. J. Med. 1998, 339, 424–428. [Google Scholar] [CrossRef]
  66. McLaughlin, J.R.; Risch, H.A.; Lubinski, J.; Moller, P.; Ghadirian, P.; Lynch, H.; Karlan, B.; Fishman, D.; Rosen, B.; Neuhausen, S.L.; et al. Reproductive risk factors for ovarian cancer in carriers of BRCA1 or BRCA2 mutations: A case-control study. Lancet Oncol. 2007, 8, 26–34. [Google Scholar] [CrossRef]
  67. Milne, R.L.; Knight, J.A.; John, E.M.; Dite, G.S.; Balbuena, R.; Ziogas, A.; Andrulis, I.L.; West, D.W.; Li, F.P.; Southey, M.C.; et al. Oral contraceptive use and risk of early-onset breast cancer in carriers and noncarriers of BRCA1 and BRCA2 mutations. Cancer Epidemiol. Biomark. Prev. 2005, 14, 350–356. [Google Scholar] [CrossRef] [Green Version]
  68. Haile, R.W.; Thomas, D.C.; McGuire, V.; Felberg, A.; John, E.M.; Milne, R.L.; Hopper, J.L.; Jenkins, M.A.; Levine, A.J.; Daly, M.M.; et al. BRCA1 and BRCA2 mutation carriers, oral contraceptive use, and breast cancer before age 50. Cancer Epidemiol. Biomark. Prev. 2006, 15, 1863–1870. [Google Scholar] [CrossRef] [Green Version]
  69. Sheen, J.J.; Wright, J.D.; Goffman, D.; Kern-Goldberger, A.R.; Booker, W.; Siddiq, Z.; D’Alton, M.E.; Friedman, A.M. Maternal age and risk for adverse outcomes. Am. J. Obstet. Gynecol. 2018, 219, 390.e1–390.e15. [Google Scholar] [CrossRef]
  70. Claramonte Nieto, M.; Meler Barrabes, E.; Garcia Martinez, S.; Gutierrez Prat, M.; Serra Zantop, B. Impact of aging on obstetric outcomes: Defining advanced maternal age in Barcelona. BMC Pregnancy Childbirth 2019, 19, 342. [Google Scholar] [CrossRef] [PubMed]
  71. Berek, J.S. Berek & Novak’s Gynecology, 16th ed.; Wolters Kluwer Health: Alphen aan den Rijn, The Netherlands, 2019. [Google Scholar]
  72. Chan, K.Y.; Ozcelik, H.; Cheung, A.N.; Ngan, H.Y.; Khoo, U.S. Epigenetic factors controlling the BRCA1 and BRCA2 genes in sporadic ovarian cancer. Cancer Res. 2002, 62, 4151–4156. [Google Scholar]
  73. Spriggs, D.R.; Longo, D.L. Progress in BRCA-Mutated Ovarian Cancer. N. Engl. J. Med. 2018, 379, 2567–2568. [Google Scholar] [CrossRef]
  74. Moore, K.; Colombo, N.; Scambia, G.; Kim, B.G.; Oaknin, A.; Friedlander, M.; Lisyanskaya, A.; Floquet, A.; Leary, A.; Sonke, G.S.; et al. Maintenance Olaparib in Patients with Newly Diagnosed Advanced Ovarian Cancer. N. Engl. J. Med. 2018, 379, 2495–2505. [Google Scholar] [CrossRef] [PubMed]
  75. Mittica, G.; Ghisoni, E.; Giannone, G.; Genta, S.; Aglietta, M.; Sapino, A.; Valabrega, G. PARP Inhibitors in Ovarian Cancer. Recent Pat. Anticancer Drug Discov. 2018, 13, 392–410. [Google Scholar] [CrossRef] [PubMed]
  76. Kaufman, B.; Shapira-Frommer, R.; Schmutzler, R.K.; Audeh, M.W.; Friedlander, M.; Balmana, J.; Mitchell, G.; Fried, G.; Stemmer, S.M.; Hubert, A.; et al. Olaparib monotherapy in patients with advanced cancer and a germline BRCA1/2 mutation. J. Clin. Oncol. 2015, 33, 244–250. [Google Scholar] [CrossRef]
  77. Han, E.; Yoo, J.; Chae, H.; Lee, S.; Kim, D.H.; Kim, K.J.; Kim, Y.; Kim, M. Detection of BRCA1/2 large genomic rearrangement including BRCA1 promoter-region deletions using next-generation sequencing. Clin. Chim Acta 2020, 505, 49–54. [Google Scholar] [CrossRef] [PubMed]
  78. Pellerin, D.; Gagnon, H.; Dubé, J.; Corbin, F. Amicon-adapted enhanced FASP: An in-solution digestion-based alternative sample preparation method to FASP. F1000 Research 2015, 4, 140. [Google Scholar] [CrossRef]
  79. Kim, E.Y.; Ahn, H.S.; Lee, M.Y.; Yu, J.; Yeom, J.; Jeong, H.; Min, H.; Lee, H.J.; Kim, K.; Ahn, Y.M. An Exploratory Pilot Study with Plasma Protein Signatures Associated with Response of Patients with Depression to Antidepressant Treatment for 10 Weeks. Biomedicines 2020, 8, 455. [Google Scholar] [CrossRef]
  80. Ahn, H.S.; Yeom, J.; Yu, J.; Kwon, Y.I.; Kim, J.H.; Kim, K. Convergence of Plasma Metabolomics and Proteomics Analysis to Discover Signatures of High-Grade Serous Ovarian Cancer. Cancers 2020, 12, 3447. [Google Scholar] [CrossRef]
  81. PMID: 30395289. Available online: https://pubmed.ncbi.nlm.nih.gov/30395289/ (accessed on 11 May 2021).
  82. Kall, L.; Canterbury, J.D.; Weston, J.; Noble, W.S.; MacCoss, M.J. Semi-supervised learning for peptide identification from shotgun proteomics datasets. Nat. Methods 2007, 4, 923–925. [Google Scholar] [CrossRef]
  83. Ahn, H.S.; Sohn, T.S.; Kim, M.J.; Cho, B.K.; Kim, S.M.; Kim, S.T.; Yi, E.C.; Lee, C. SEPROGADIC—Serum protein-based gastric cancer prediction model for prognosis and selection of proper adjuvant therapy. Sci. Rep. 2018, 8, 16892. [Google Scholar] [CrossRef] [PubMed]
  84. Ahn, H.S.; Kim, J.H.; Jeong, H.; Yu, J.; Yeom, J.; Song, S.H.; Kim, S.S.; Kim, I.J.; Kim, K. Differential Urinary Proteome Analysis for Predicting Prognosis in Type 2 Diabetes Patients with and without Renal Dysfunction. Int. J. Mol. Sci. 2020, 21, 4236. [Google Scholar] [CrossRef] [PubMed]
  85. Bardou, P.; Mariette, J.; Escudie, F.; Djemiel, C.; Klopp, C. jvenn: An interactive Venn diagram viewer. BMC Bioinform. 2014, 15, 293. [Google Scholar] [CrossRef] [PubMed] [Green Version]
  86. Venn Diagram Plotter. Available online: https://omics.pnl.gov/software/venn-diagram-plotter (accessed on 11 May 2021).
  87. Bindea, G.; Mlecnik, B.; Hackl, H.; Charoentong, P.; Tosolini, M.; Kirilovsky, A.; Fridman, W.H.; Pages, F.; Trajanoski, Z.; Galon, J. ClueGO: A Cytoscape plug-in to decipher functionally grouped gene ontology and pathway annotation networks. Bioinformatics 2009, 25, 1091–1093. [Google Scholar] [CrossRef] [Green Version]
  88. Shannon, P.; Markiel, A.; Ozier, O.; Baliga, N.S.; Wang, J.T.; Ramage, D.; Amin, N.; Schwikowski, B.; Ideker, T. Cytoscape: A software environment for integrated models of biomolecular interaction networks. Genome Res. 2003, 13, 2498–2504. [Google Scholar] [CrossRef] [PubMed]
Figure 1. Flow diagram for plasma protein LC-MS/MS-based OC biomarker candidate identification and ELISA-based marker validation. (A) Multistage workflow for the identification, quantification, data analysis, and validation steps. Plasma samples from the four study groups (HPwt, HPvar, OCwt, and OCvar) were analyzed by LC-MS/MS after peptide digestion, and the results were quantified and verified by ELISA. (B) An initial panel of 1505 proteins was obtained from the initial screening, 380 proteins of which were confirmed by quantification, comprising 374 candidate targets and 6 normalization factors. The Mann–Whitney U test was then used to compare the HPTotal vs. OCTotal and the HPvar vs. OCvar groups. In each comparison, we identified proteins with a significant absolute fold-change >2 and Bonferroni-corrected p-values < 0.05. We thereby obtained 24 BRCA1/2-specific proteins, and six proteins were subjected to ELISA validation.
Cancers 13 02300 g001
Figure 2. Venn diagram and principal component analysis plot of the identified proteins in the clinical samples. (A) Venn diagram of the number of identified proteins in the four study groups (HPwt, HPvar, OCwt, and OCvar; n = 10 each). (B) Principal component analysis of the plasma proteome using the 40 clinical samples (duplicated runs).
Cancers 13 02300 g002
Figure 3. Comparative analysis of the OCTotal and HPTotal groups using volcano plots, gene ontology (GO) functional annotation, and AUC histograms. (A) Volcano plots displaying the mean difference in plasma proteome abundance between the healthy subjects and OC patients (n = 20 for each). The indicated p-values were calculated using a Mann–Whitney U test. Blue circles denote 11 plasma proteins that showed a significant decrease in the HP samples (Log2 fold-change < ‒1 and Bonferroni-corrected p-values < 0.05). Red circles indicate 47 plasma proteins that displayed significant increases in the OC patients (Log2 fold-change > 1 and Bonferroni-corrected p-values < 0.05). Gray circles highlight the plasma proteins that did not show statistically significant differences. (B) GO analysis of differentially abundant proteins (DAPs). A functional GO network is shown displaying the grouping of biological process terms enriched for HP up-regulated proteins (blue circles) and OC up-regulated proteins (red circles). (C) Histogram of AUC values determined from univariate ROC analysis of 58 significant proteins highlighted by volcano analysis.
Cancers 13 02300 g003
Figure 4. Comparative analysis of the OCvar and HPvar groups using volcano plots, gene ontology (GO) functional annotation and AUC histograms. (A) Volcano plots of the candidate proteins in the HPvar and OCvar subjects (n = 10 each). Blue circles denote 16 proteins showing a significant increase in the HPvar subjects (Log2 fold-change < ‒1 and Bonferroni corrected p-value < 0.05). Red circles highlight 63 proteins which had significant increases in the OCvar patients (Log2 fold-change > 1 and Bonferroni corrected p-value < 0.05). Gray circles indicate plasma proteins with no statistically significant differences. (B) Functional GO network displaying groupings of biological process terms enriched in the HPvar up-regulated proteins (blue circles) and OCvar up-regulated proteins (red circles). (C) Histogram of AUC values from the univariate ROC analysis of 81 significant proteins identified by volcano analysis.
Cancers 13 02300 g004
Figure 5. Venn diagrams and boxplots of the significant BRCA1/2 variant-specific proteins identified in this study. (A) Venn analysis of two HP-upregulated DAPs between HPTotal vs. OCTotal and HPvar vs. OCvar. (B) Venn analysis of two OC-upregulated DAPs between OCTotal vs. HPTotal and OCvar vs. HPvar. (C) Boxplots of seven BRCA1/2 variant-specific HP-upregulated proteins in the four study groups (HPwt, HPvar OCwt, and OCvar). (D) Boxplots of the 17 BRCA1/2 alteration specific OC-upregulated proteins in the four study groups; * p < 0.05, ** p < 0.01, *** p < 0.001, **** p < 0.0001, n.s., not significant.
Cancers 13 02300 g005aCancers 13 02300 g005b
Figure 6. Plasma concentrations of (A) SPARC and (B) THBS1 in the four groups (HPwt, HPvar, OCwt, and OCvar) determined by ELISA; **** p < 0.0001.
Cancers 13 02300 g006
Figure 7. Suggested clinical management approach for healthy women harboring BRCA1/2 variants that confer a high risk of OC. Step-by-step tree-based guidelines are indicated.
Cancers 13 02300 g007
Table 1. Demographics and disease characteristics of the study subjects used for nano-LC-ESI-MS/MS analysis.
CharacteristicsHealthy Subjects (HPTotal)Ovarian Cancer Patients (OCTotal)
HPwt
(N = 10)
HPvar
(N = 10)
p-ValueOCwt
(N = 10)
OCvar
(N = 10)
p-Value
Age (mean ± SD)42 ± 10.432 ± 14.50.11659 ± 6.757 ± 9.10.622
Concurrent cancer 1.0 0.032
Yes (n)00 05
No (n)1010 105
Family history <0.001 1.0
Yes (n)010 01
No (n)100 109
OC stage 1.0
IINANA 10
IIINANA 89
IVNANA 11
BRCA variant 1.0 0.650
BRCA1NA5 NA3
BRCA2NA5 NA7
Ovarian histopathology 1.0
High-grade serous carcinomaNANA 1010
Preoperative CA125 level (mean ± SD)NANA 3167 ± 5910.91662 ± 1793.70.451
Preoperative platelet level (mean + SD)NANA 323 ± 157.9308 ± 215.30.855
NA: not applicable, SD: standard deviation. All results are reported as a mean (SD) or percentage (%), with p-values appropriately calculated using the Mann–Whitney U test or Fisher’s exact test.
Publisher’s Note: MDPI stays neutral with regard to jurisdictional claims in published maps and institutional affiliations.

