Article

Rare Tumor-Normal Matched Whole Exome Sequencing Identifies Novel Genomic Pathogenic Germline and Somatic Aberrations

1
Department of Health Sciences, Center for Applied Genetics and Genomic Medicine, University of Arizona, Tucson, AZ 85721, USA
2
Arizona Research Labs, University of Arizona Genetics Core, University of Arizona, Tucson, AZ 85721, USA
3
Department of Medicine, Division of Hematology and Oncology, University of Arizona Cancer Center, University of Arizona, Tucson, AZ 85724, USA
4
Department of Medicine—Hematology/Oncology, University of Texas Health San Antonio, Mays Cancer Center, San Antonio, TX 78229, USA
*
Authors to whom correspondence should be addressed.
Cancers 2020, 12(6), 1618; https://doi.org/10.3390/cancers12061618
Submission received: 12 May 2020 / Revised: 5 June 2020 / Accepted: 9 June 2020 / Published: 18 June 2020

Abstract

:
Whole exome sequencing (WES) of matched tumor-normal pairs in rare tumors has the potential to identify genome-wide mutations and copy number alterations (CNAs). We evaluated 27 rare cancer patients with tumor-normal matching by WES and tumor-only next generation sequencing (NGS) as a comparator. Our goal was to: 1) identify known and novel variants and CNAs in rare cancers with comparison to common cancers; 2) examine differences between germline and somatic variants and how that functionally impacts rare tumors; 3) detect and characterize alleles in biologically relevant genes-pathways that may be of clinical importance but not represented in classical cancer genes. We identified 3343 germline single nucleotide variants (SNVs) and small indel variants—1670 in oncogenes and 1673 in tumor suppressor genes—generating an average of 124 germline variants/case. The number of somatic SNVs and small indels detected in all cases was 523:306 in oncogenes and 217 in tumor suppressor genes. Of the germline variants, six were identified to be pathogenic or likely pathogenic. In the 27 analyzed rare cancer cases, CNAs are variable depending on tumor type, germline pathogenic variants are more common. Cell fate pathway mutations (e.g., Hippo, Notch, Wnt) dominate pathogenesis and double hit (mutation + CNV) represent ~18% cases.

Graphical Abstract

1. Introduction

Genomic analysis of tumors has dramatically reshaped cancer treatment through the identification of genetic variants that provide diagnostic and prognostic information and that aid in therapeutic selection [1]. Patients with rare cancers generally present with advanced disease and for most there is no standard of care therapy. This results in poor 5-year survival rates compared with the more common cancers [2]. While rare tumors are individually infrequent, combined together they comprise nearly 25% of all cancer cases [3]. In the U.S. rare tumors are defined as those that are less than 15 per 100,000 cases. Here we follow however the stricter guidelines of the European tumor classification group (RARECARE) of less than 6 per 100,000 per year [4]. The low frequency of these cases presents unique challenges in pathological classification, presentation and progression of disease and by extension, therapeutic options for clinical management.
Research to identify causes or to develop strategies for prevention or early detection are also difficult. Despite these challenges, rare tumors offer the opportunity to identify novel targets and signaling pathways [5]. A recent precision medicine study focused on molecular characterization of rare cancers identified actionable variants over 92% of the time, with 52% receiving a matched therapy [3]. Most patients receiving these therapies achieved stable disease, with a smaller number achieving partial or complete remission. Additionally, a high percentage of rare tumors are known to harbor pathogenic germline variants, for example, 29% of pheochromocytomas, 14.1% of pancreatic ductal adenocarcinomas, and 12.5% of soft tissue sarcomas [6,7,8,9,10]. However, the majority of cancer cases undergoing genetic analysis are sequenced via tumor-only gene panels (e.g., Caris Life Sciences, Foundation Medicine) that fail to identify genes outside of their search space, generate poor detection of copy number alterations (CNAs), and are often unable to distinguish if a variant is in the germline or of somatic origin [11].
In this study, we performed tumor and matched germline whole exome sequencing (WES) of rare tumors from 27 patients that were evaluated at our Early Phase Therapeutics Program. Each patient also had a biopsy sample tested using a clinically available tumor-only assay from a commercial vendor for comparison. Our aim was to further characterize and compare both differences and commonalities of rare and common cancers, to better inform prognosis, selection of potential therapeutic pathways and design trials for rare cancer patients.

2. Results

2.1. Somatic and Pathogenic Germline Variants Detected in the Rare Tumor Cohort

Twenty-seven rare cancer cases (mean age: 46.0 years, range: 2–82 years; 17 males, 10 females) were evaluated with whole exome sequencing (WES) for tumor and germline. There were 23 different rare cancer types represented in our survey, all of which met the criteria of a rare cancer (Figure 1).
Using the WES data, we detected a total of 3343 germline single nucleotide variants (SNVs) and small indel variants. Of these, 1670 were found in oncogenes and 1673 were in tumor suppressor genes, generating an average of 124 germline variants per case (Table S1). This likely includes many benign polymorphisms as a maximum population frequency of 5% was used in the filtering criteria for germline variants (see Methods). The number of somatic SNVs and small indels detected in all cases totaled 523, with 306 in oncogenes and 217 in tumor suppressor genes (Table S2). Classification of oncogenic genes (OG) and tumor suppressor genes (TSG) was defined by the Oncogene Database (http://ongene.bioinfo-minzhao.org/) and the Tumor Suppressor Gene Database (https://bioinfo.uth.edu/TSGene/). All 694 oncogenes and 1016 tumor suppressor genes (129 genes were classified as both OGs and TSGs) are listed (Table S3). Variants were then further categorized as either a passenger mutation or a functional driver mutation using the Cancer Genome Interpreter tool (https://www.cancergenomeinterpreter.org/home). Of the variants deemed to be driver mutations, there were a total of 72 germline variants (2.67/case, 48 in TSGs/24 in OGs) and 22 somatic variants (0.81/case, 14 in TSGs/8 in OGs) (Table 1). From germline variants found to be in cancer predisposition genes, six (all heterozygous) were identified to be pathogenic or likely pathogenic by the more stringent ACMG guidelines: BRCA2-Q2859Kfs (gray zone lymphoma), SDHA-R75* (spindle cell breast cancer), SDHC-A3Rfs (gastrointestinal stromal tumor), RUNX1-M151L (glioblastoma), FANCC-c.456+4A>T splice site/exon skipping (anaplastic astrocytoma), and MUTYH-G396D (alveolar soft part sarcoma) (Table 2).
Among the 27 rare tumor patient cases included in our study, there were a total of 27 actionable somatic variants. Eight of the 27 patients in which we identified a variant of clinical significance had multiple actionable variants. One of the three tumors without an actionable variant—Merkel Cell Carcinoma (MCC), stained positive for Merkel cell polyoma virus and therefore was expected to have a very low tumor mutation burden [18]. Interestingly the SPEN-Q3621* nonsense variant that was identified in this tumor likely truncates the protein product (a hormone inducible transcriptional repressor), resulting in loss of a portion of a domain that is necessary for interactions with other nuclear co-repressors. While SPEN mutations are reported in 8% (8/97) of MCC samples in COSMIC, this variant is not functionally characterized and its effect on protein function is unknown.
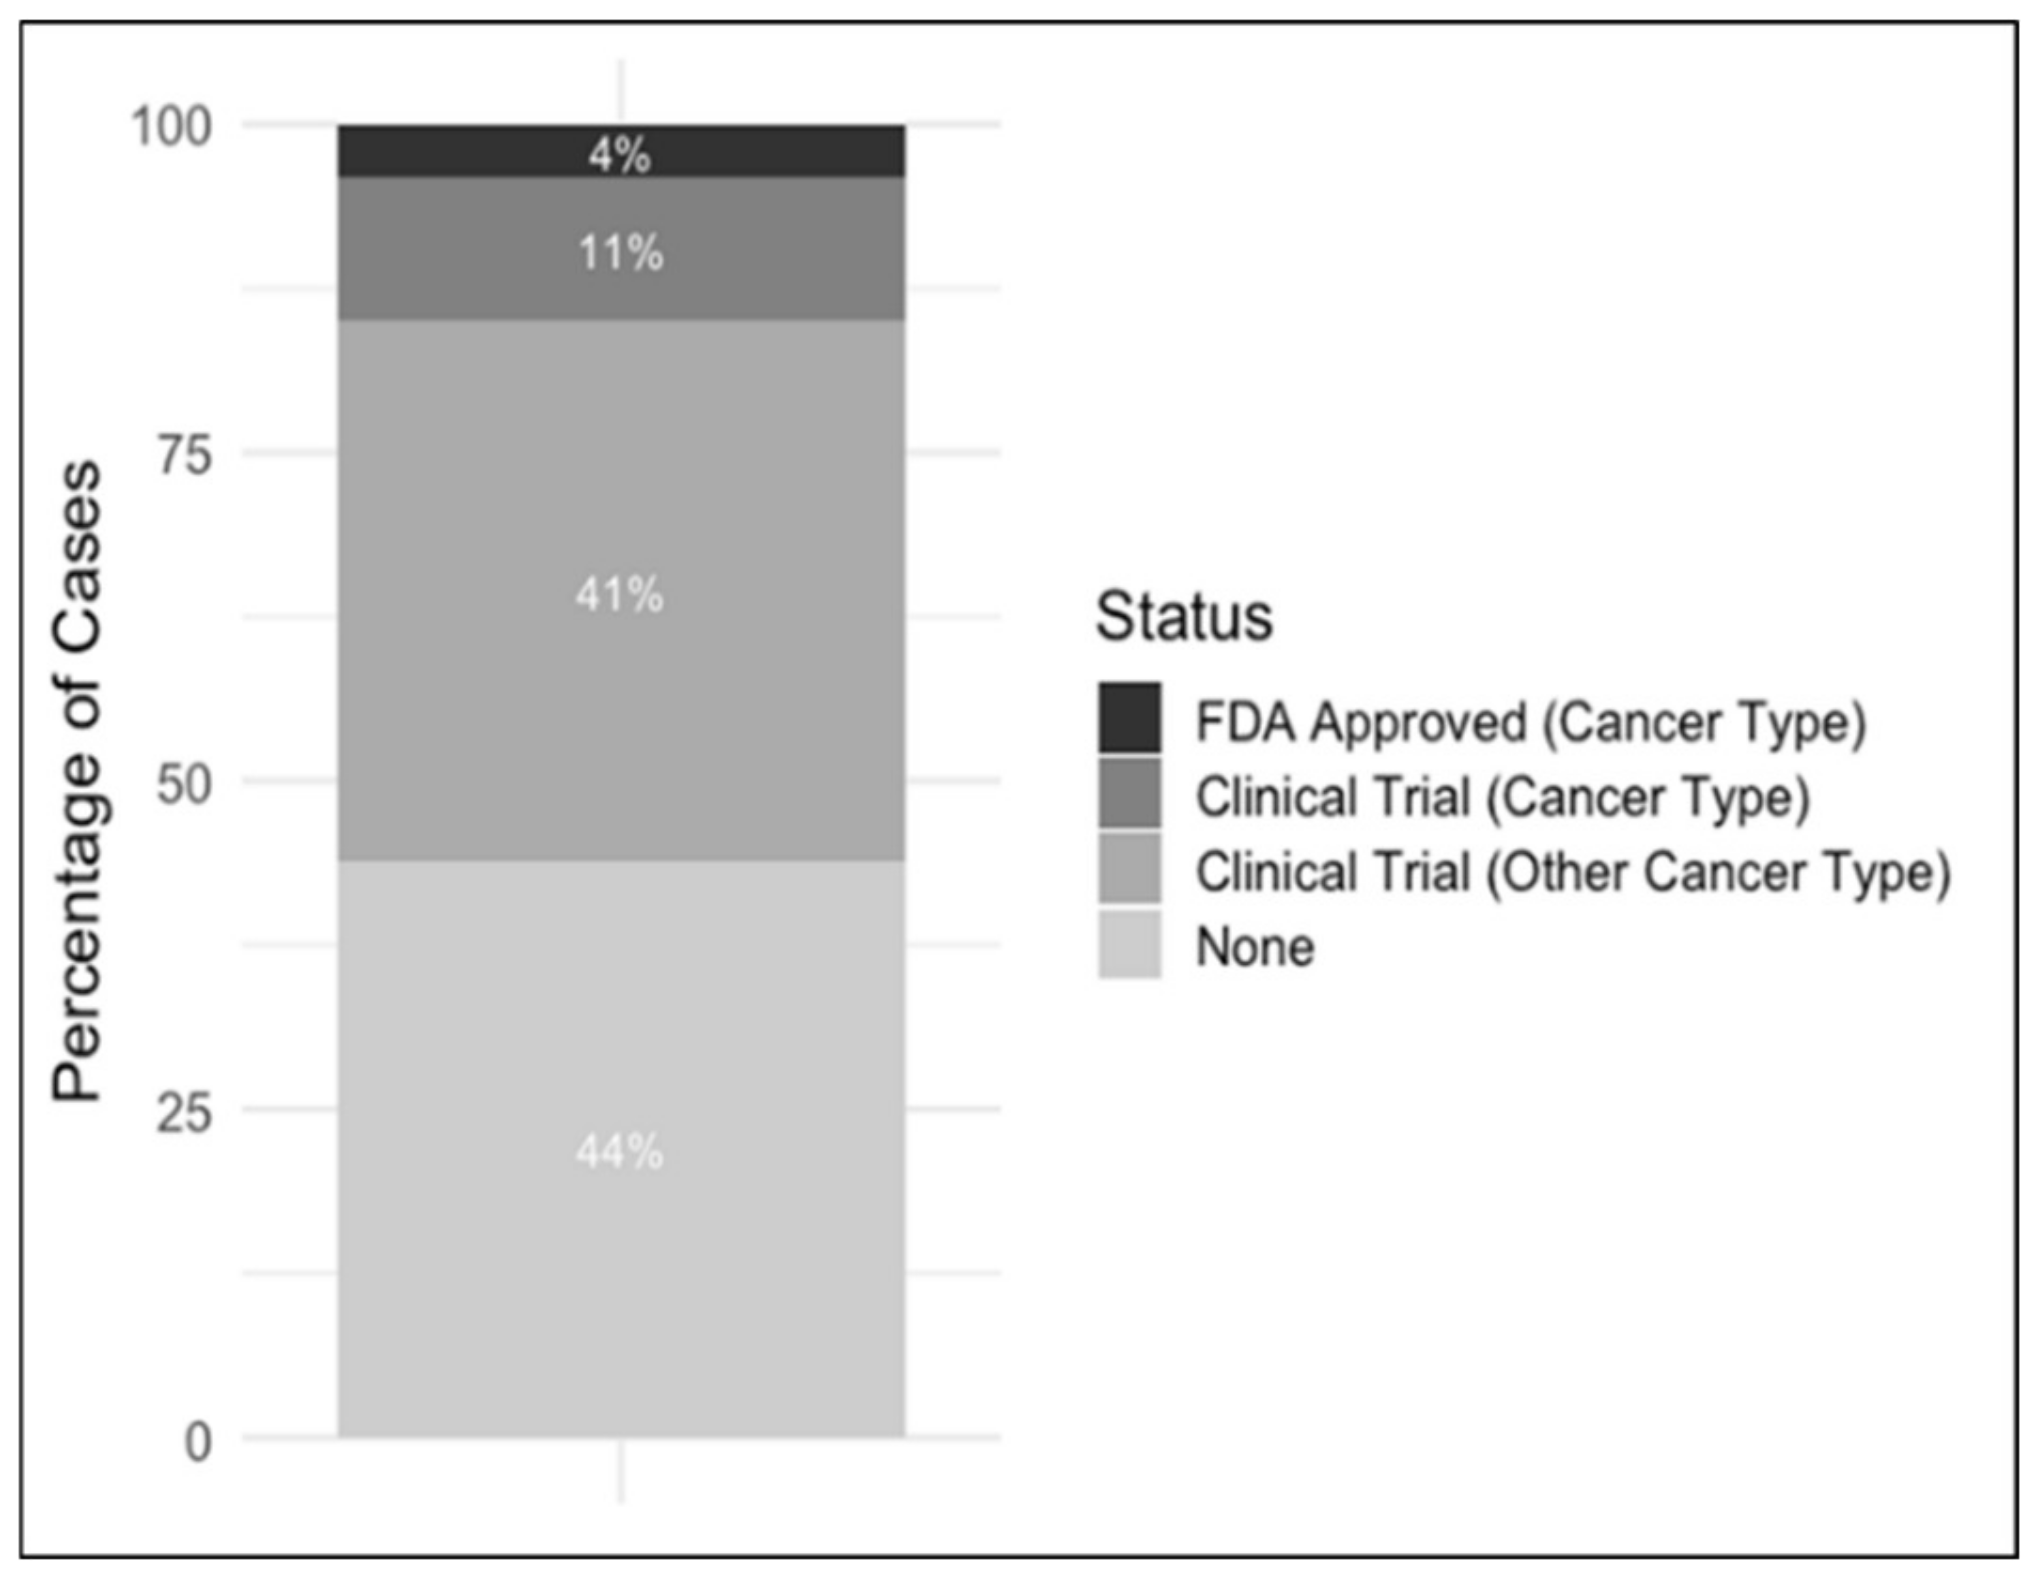
Actionable variants found in the patient cohort were classified in the four categories: FDA-approved for rare cancer type, FDA-approved for different cancer type, clinical trial for rare cancer type, clinical trial for different cancer type. All reported variants were deemed to be somatic.
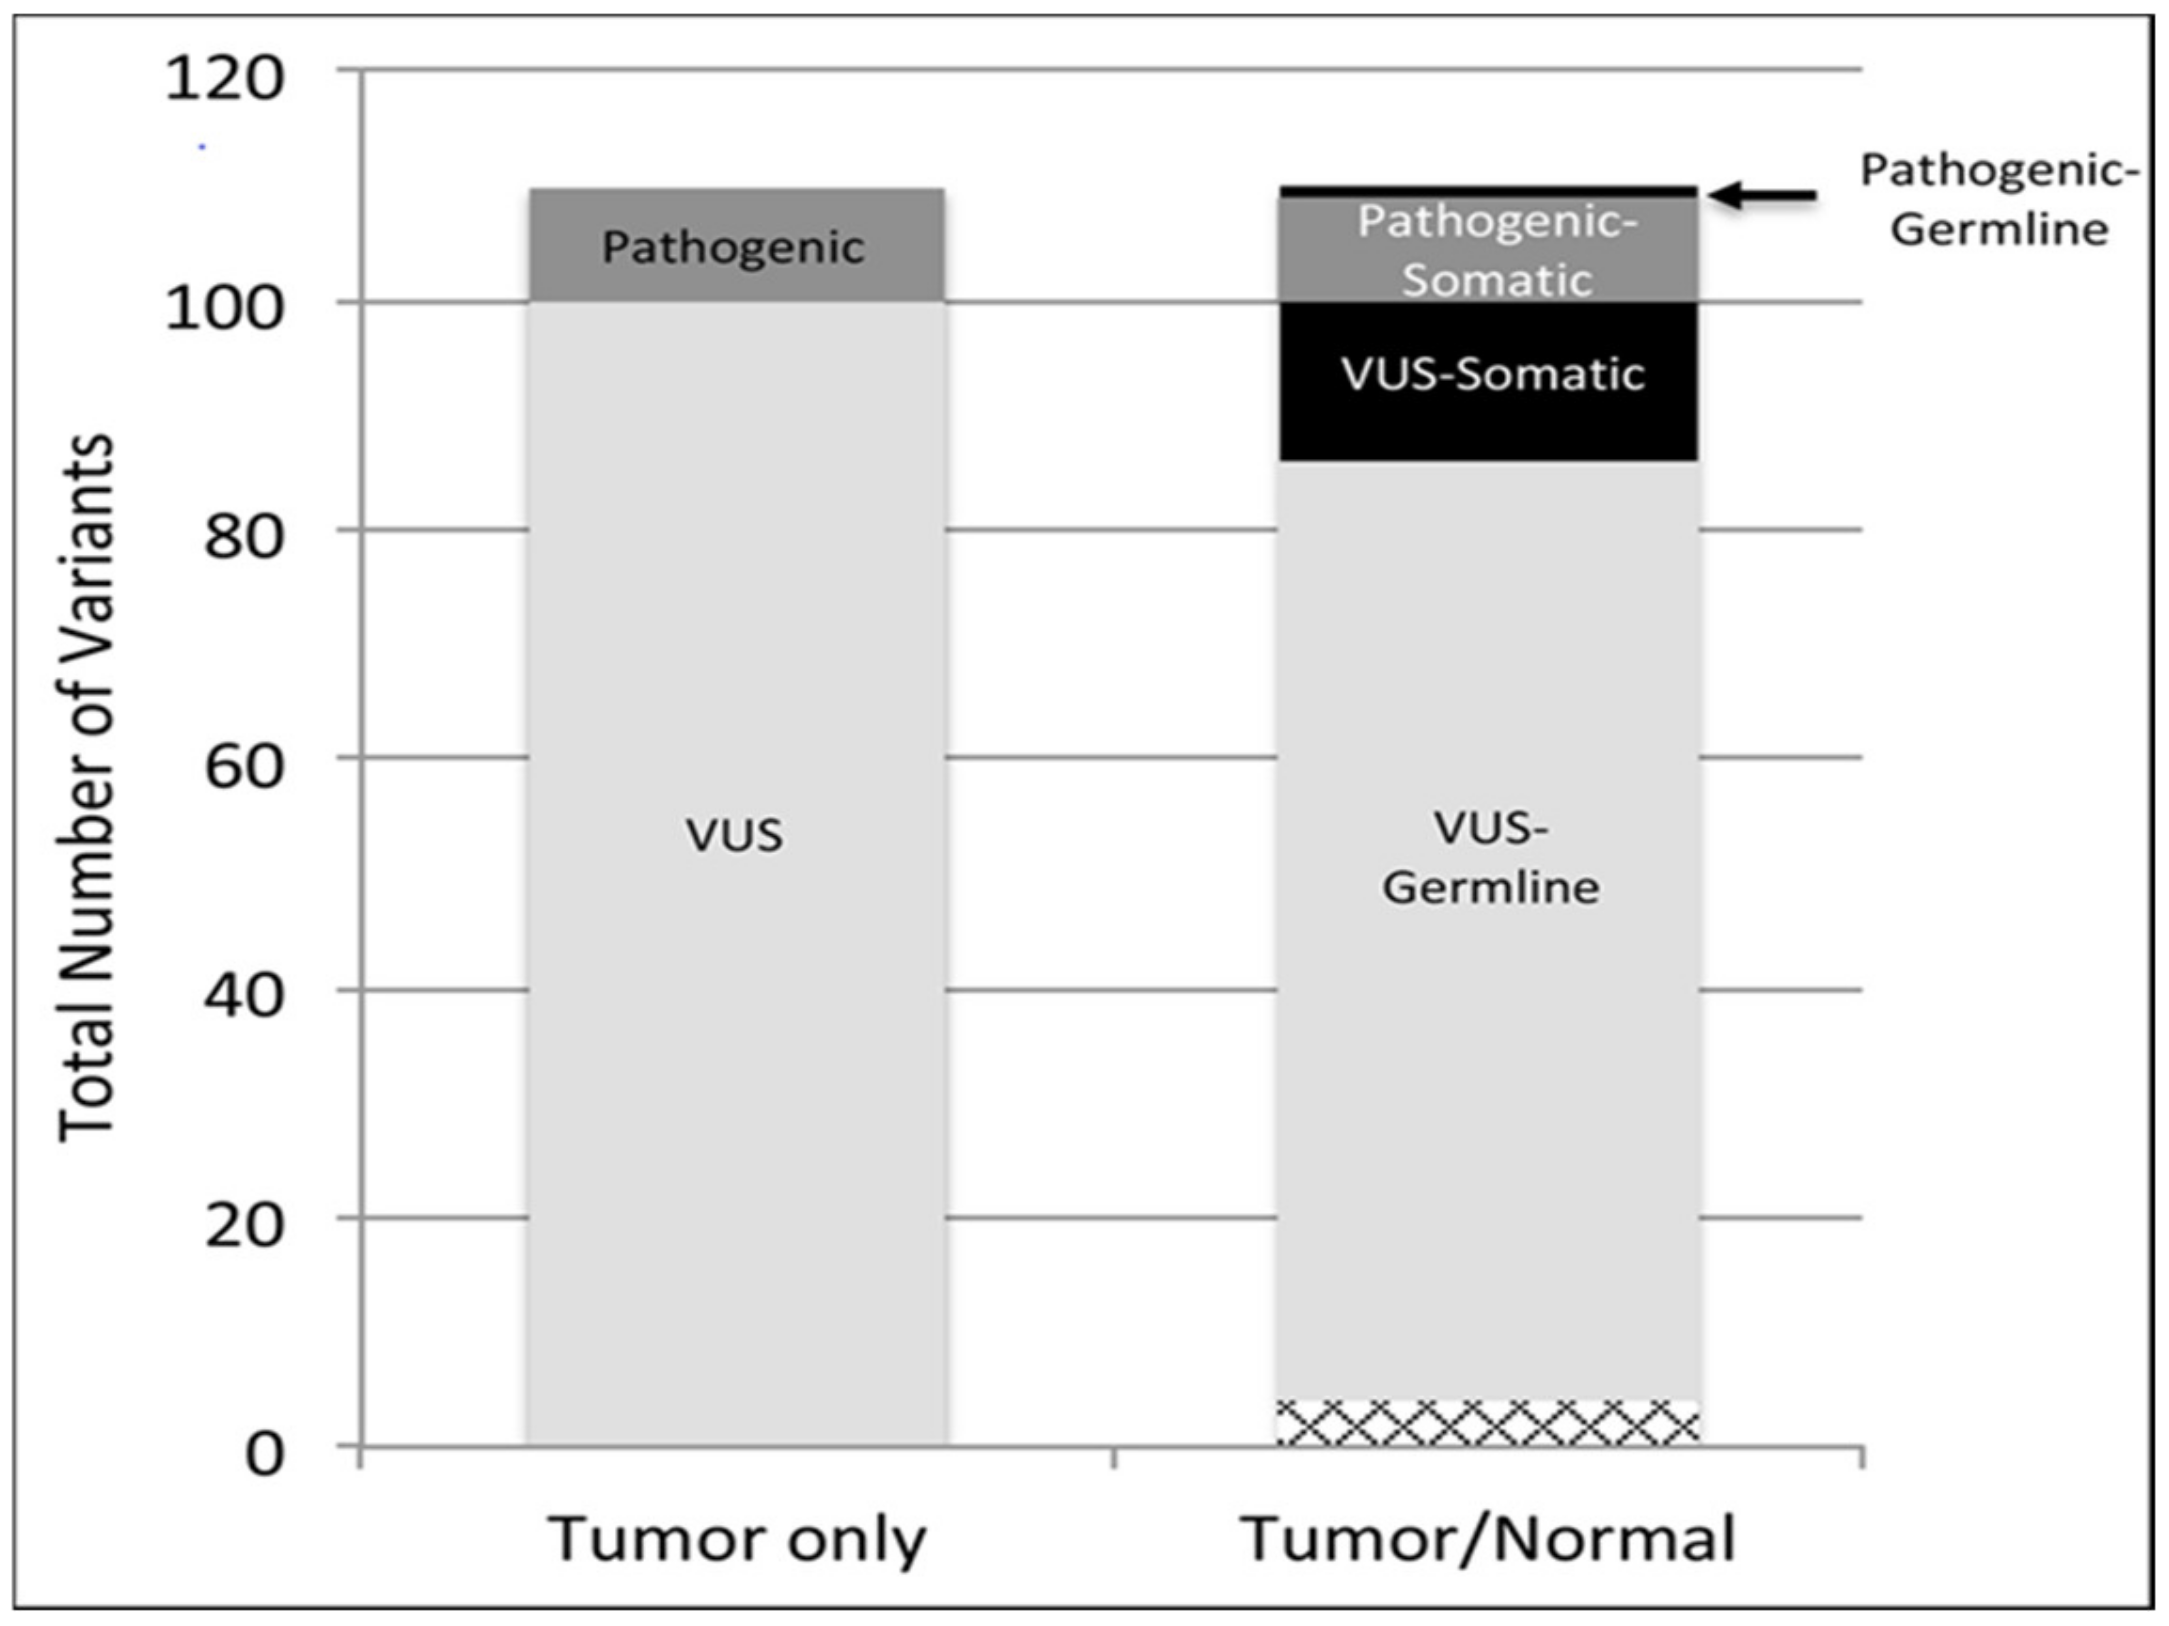
Unsurprisingly, for the majority of rare tumor patients in our study, available FDA approved medications and/or clinical trials were not available for use in the patient’s tumor type. In fact, only one patient had a variant with an FDA approved therapy, and three had a variant with a clinical trial for their tumor type (Figure 2). This is illustrative of the vastly different treatments available for rare vs. common tumor types. Interestingly, 18 patients were able to gain access to targeted therapies, though this was often in an off-label capacity. When comparing our WES tumor/germline with tumor only analysis, there was general concordance in the classification of known pathogenic variants and VUS. However, while most of the pathogenic/likely pathogenic variants where found to be somatic using both assays, the vast majority (~80%) of the clinically reported VUS turn out to be inherited when using the tumor/germline analysis (Figure 3). This was evident in our patients who also underwent tumor only NGS with a 592-gene panel assay (Caris Life Sciences, Phoenix, AZ, USA).
Additionally, our tumor/germline approach identified a single pathogenic variant that turned out to be germline in origin. This frameshift variant (A3fs) in the C subunit of the succinate dehydrogenase (SDH) gene was found in a patient with gastrointestinal stromal tumor (GIST). This variant occurs early in the gene and is predicted to lead to nonsense mediated decay (loss of function), which generates oncometabolites that dysregulate epigenetic repression [19]. The patient was treated with olaparib (off-label) and after 2 months of therapy showed a 13.8% reduction in tumor size. As of the writing of this manuscript, the patient continues to take olaparib and has maintained stable disease for the past 7 months. Indeed, loss or markedly reduced SDHB expression has associated with familial cancer predisposition syndromes with affected individuals at increased risk for developing paragangliomas, pheochromocytomas (rare forms of adrenal tumors) and GISTs [20].

2.2. Germline Pathogenic Variants Are More Common in Rare Cancers

The percentage of cases harboring an inherited pathogenic variant appears to differ between rare vs. common (i.e., lung, breast, colon, rectal, and prostate) cancers (Table 3). Among our rare cancer cases, 22% had a pathogenic or likely pathogenic germline variant, consistent with previously published cases [14]. In contrast, common cancers taken from 3451 combined cases in TCGA, showed 7.9% of variants as germline pathogenic or likely pathogenic [14,21]. This increased rate of inherited pathogenic variants in rare cancer was found to be statistically significant using the Fisher exact test (p = 0.01800). Given the small sample size of our rare tumor cohort, we analyzed other rare tumors in these same databases to confirm the higher frequency of germline variants. There is a consistent yet slight increase in the overall percentage of germline variants detected in rare tumors in our cohort when compared to the other rare tumor cohorts (Table 4). Of note is the large variance in total percentage of pathogenic/likely pathogenic called germline variants stemming from a lack of consistency in methodology regarding pathogenic/likely pathogenic filtering criteria. This absence of a classification standard continues to be a confounding problem, creating issues in cross-study comparisons as well as general clinical variant reporting.

2.3. Copy Number Alterations Are Variable and Depend on the Rare Tumor Type

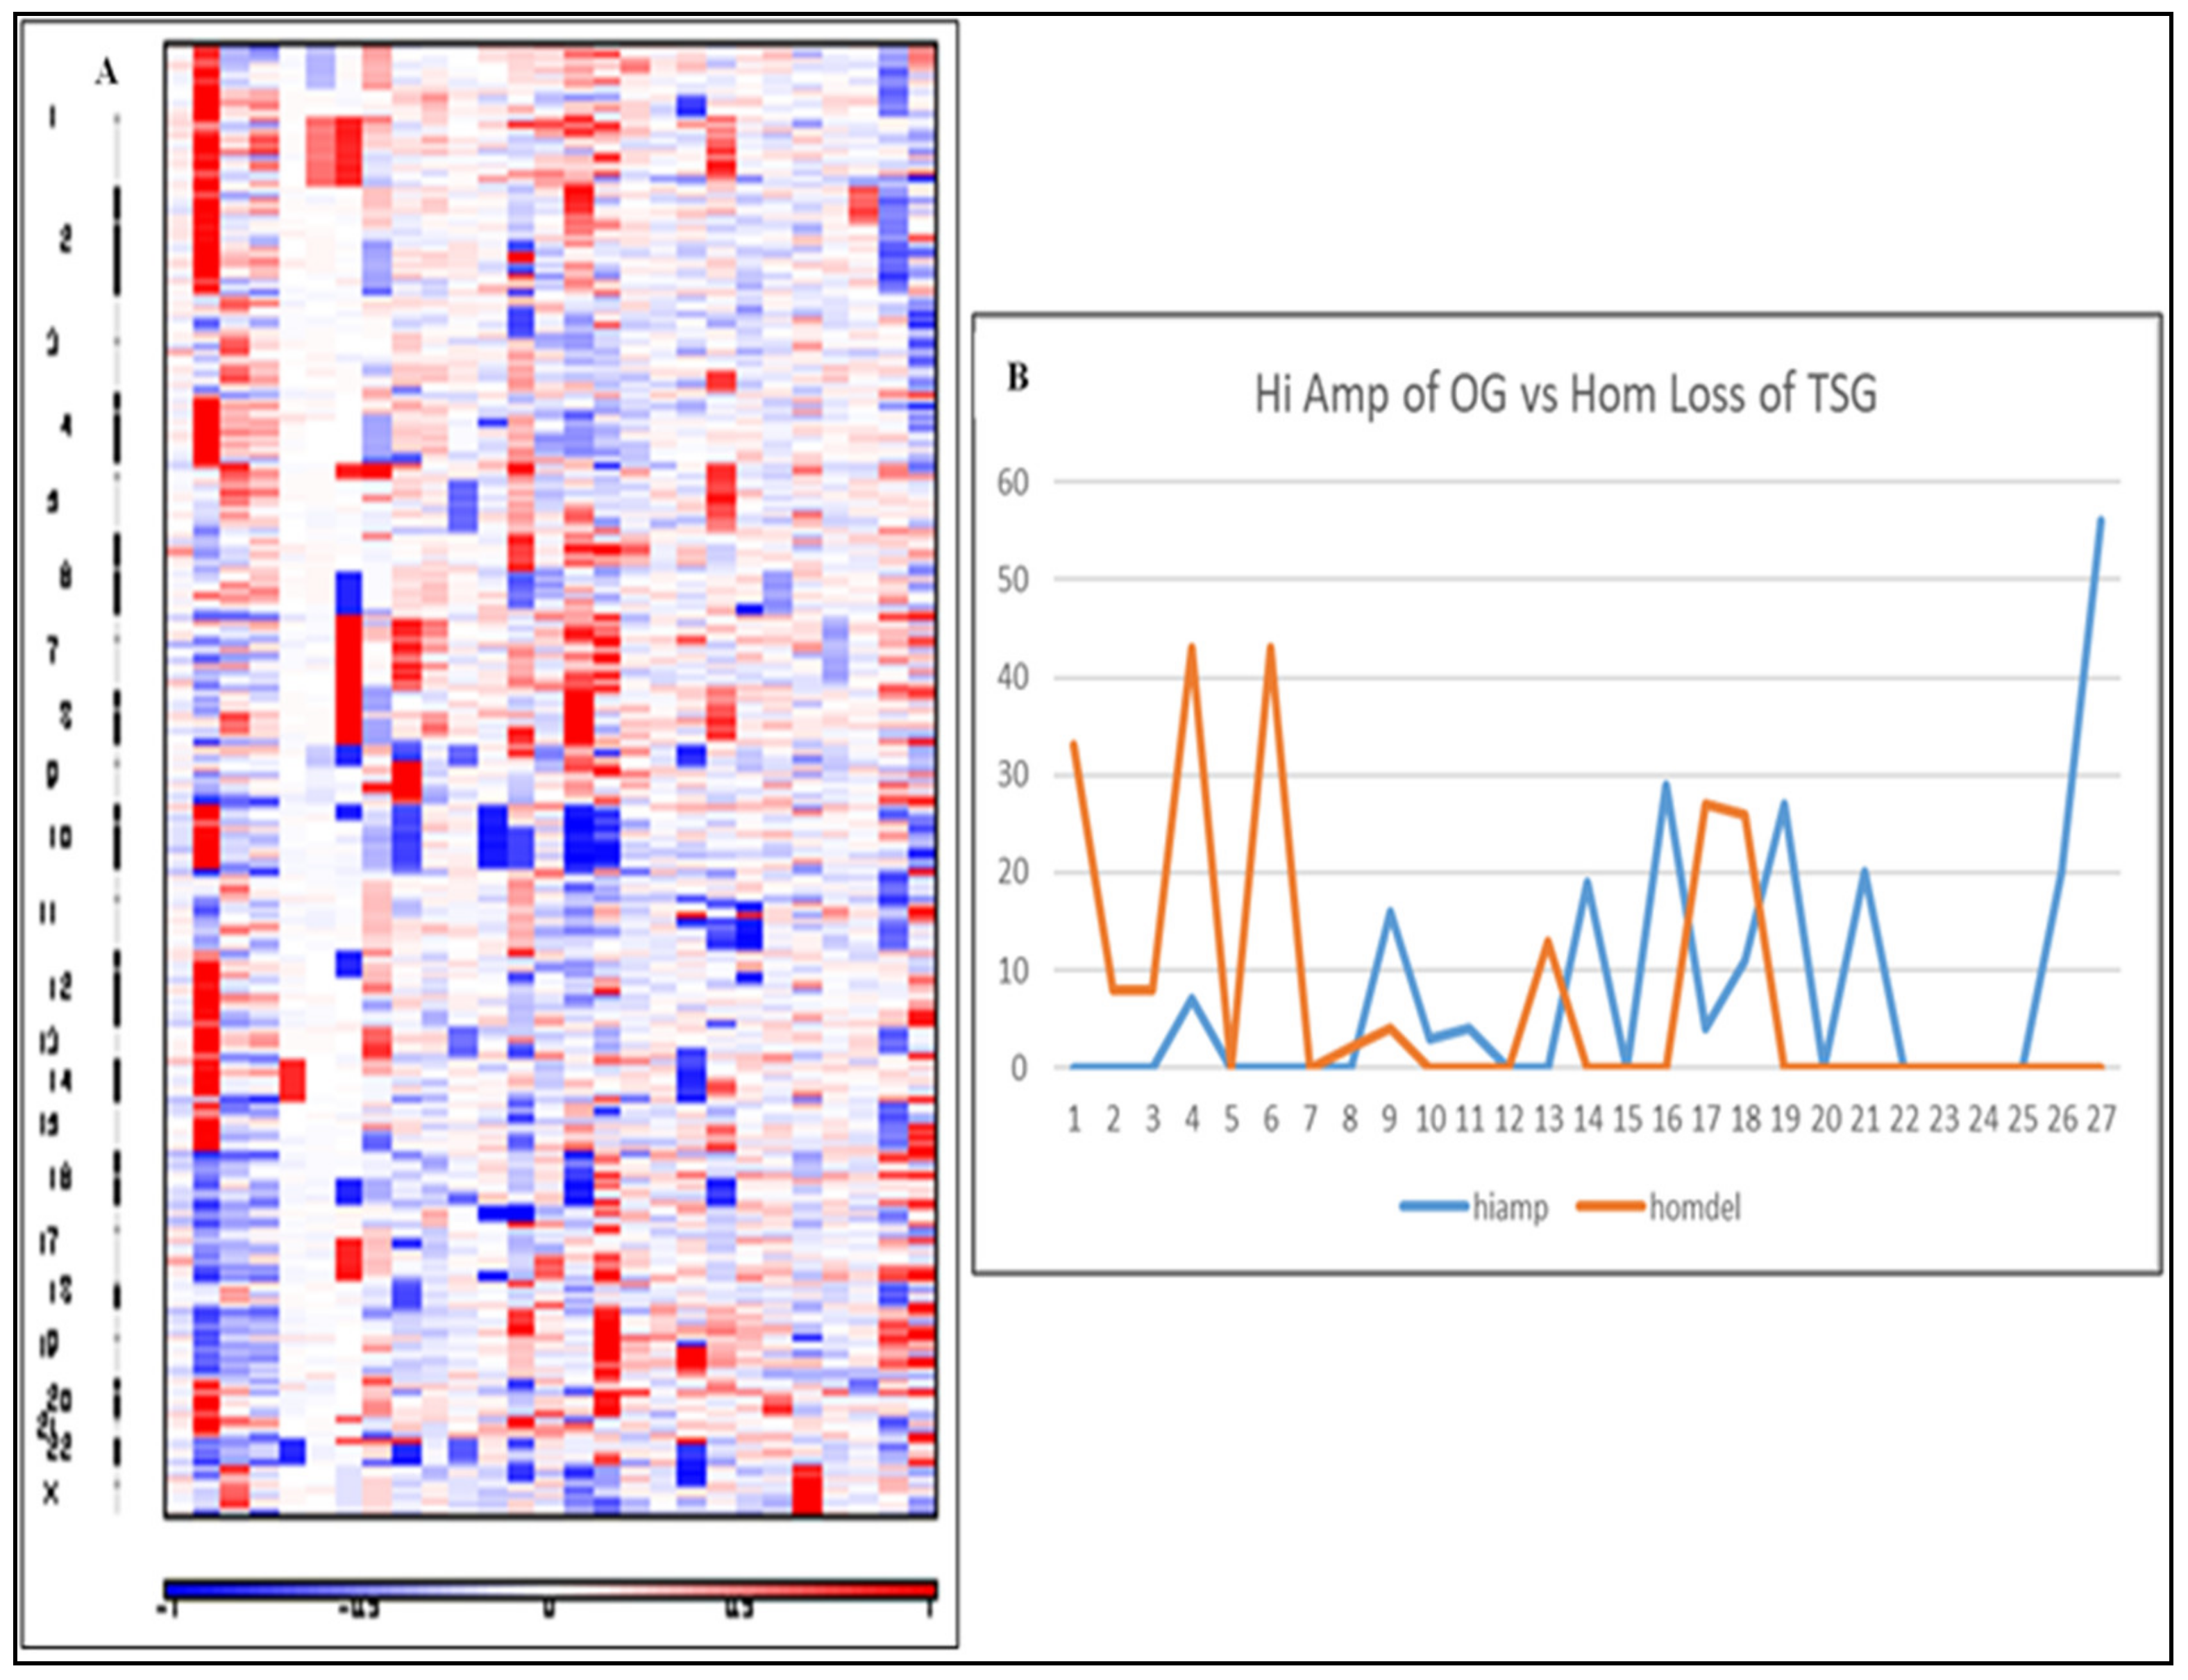
Copy number analysis (CNA) performed using Sequenza [22] on all WES cases and analyzed using the GISTIC2 pipeline [23], produced a heatmap of the overall amplification and deletion scores across all chromosomes to compare cases (Figure 4A). These results were later compared to TCGA GISTIC gene-level CNA files downloaded from the cBioPortal [24]. GISTIC distinguishes two levels of amplification: a low-level gain (“amp”) and a high-level amp (“hiamp”) that is often a focal copy number increase; likewise, it outputs two levels of deletion, a shallow loss (“del”) that may be a heterozygous deletion and a deep deletion (“homdel”) that is likely to be a homozygous loss of the gene. As shown the total number of amplified oncogenes and deletions of tumor suppressor genes in our cohort was widely variable from case to case (Table S4). Nine of the 27 cases contained at least one amplification of an oncogenic gene or loss of a TSG. Of the cases containing amplification of oncogenic genes (~50% cases), the average was eight oncogenes/case (min 3, max 56). When comparing to loss of TSG, only about a third of cases showed a loss with an average of 20.7 tumor suppressor losses/case (min 2, max 43). Interestingly, there appears to be a negative correlation between the presence of a high-level amplification in an OG vs. a deep deletion of a TSG (Figure 4B). There was negative association between having an increase in the number of “high-amp” of OG with an increase in the number of “homdel” TSGs.
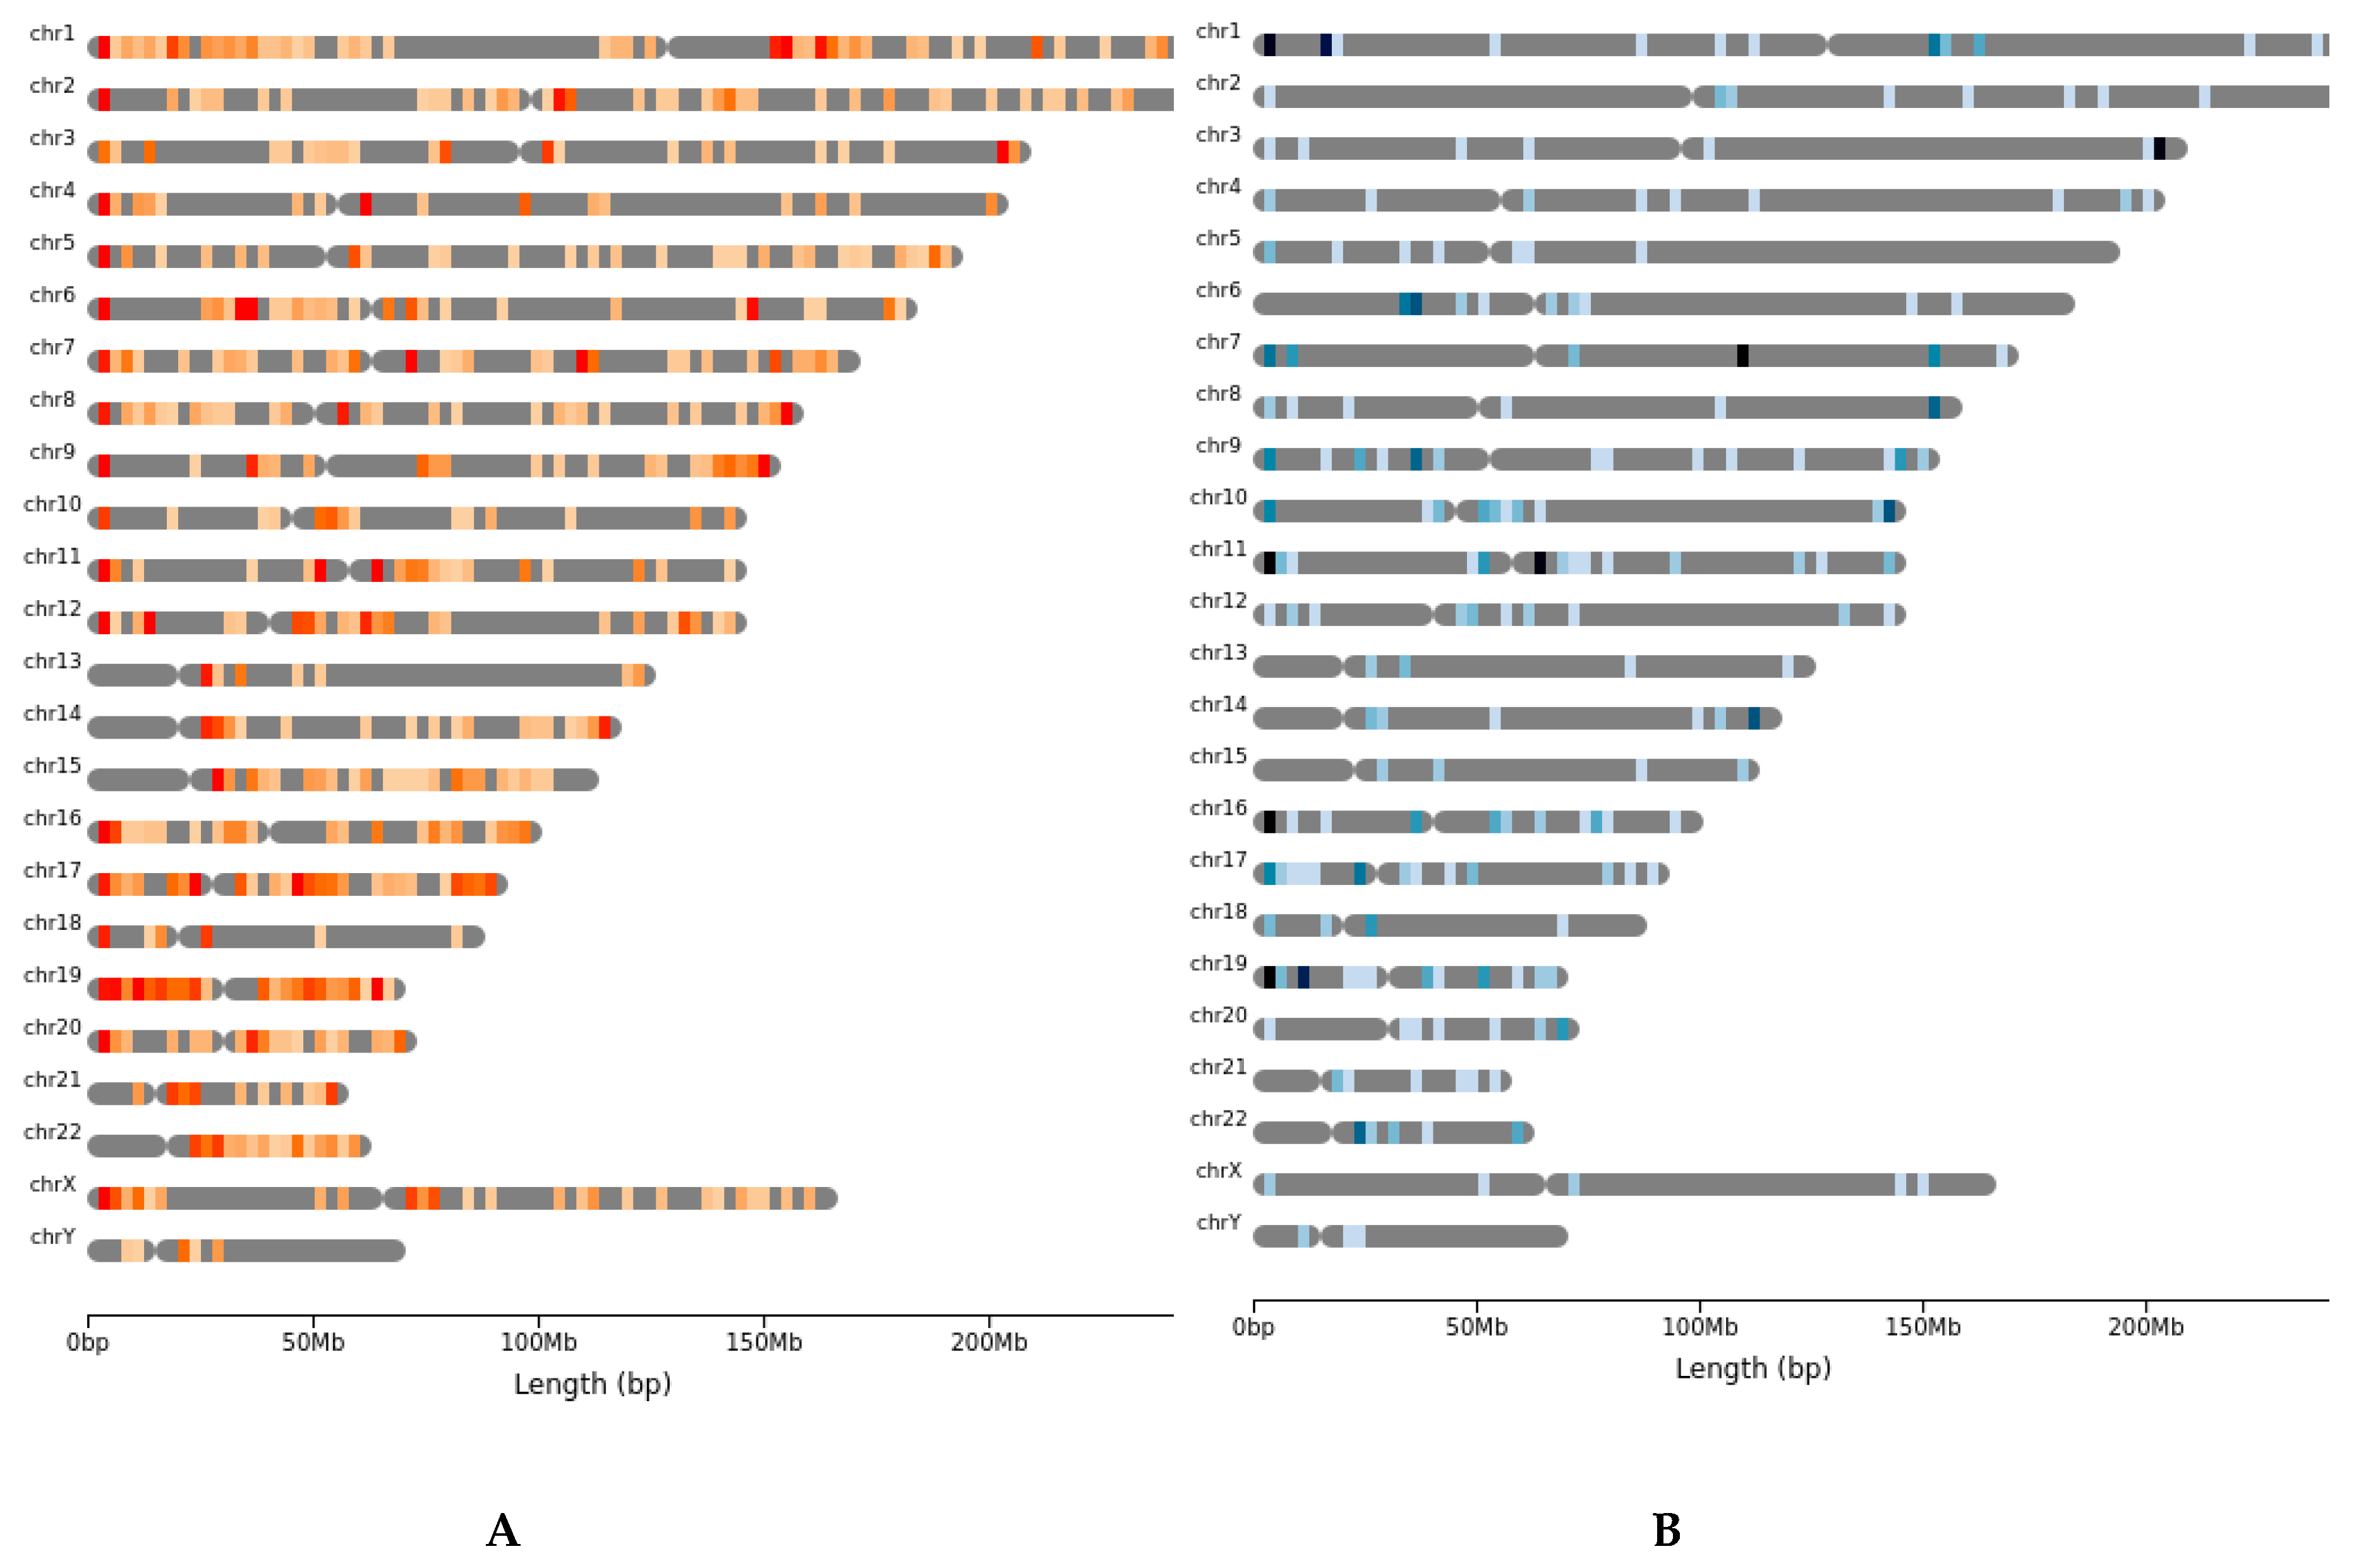
When mapping the locations of all CNVs on to each chromosome, we find that there appears to be several protected regions as well as hot spots incurring gains and losses of copies at a much greater frequency. While all chromosomes showed some level of amplification, there is a greater frequency of amplification events clustering near the tips of both the p and q arms (Figure 5A). There was a similar clustering of loss of copy at the tips of each chromosome, albeit at a lower total count (Figure 5B). While there was a higher total count of amplifications overall, there were several consistencies between the mapped gains and losses. No gains or losses were detected on the short arms (p) of chromosomes 13, 14, 15, 22, and in both cases the full chromosome 19 appears to undergo the most amplifications and losses. Many of the usual hot spots seen in other analysis also appear to be affected in rare tumors [25,26,27].
We used the TCGA containing 3149 common and 2120 rare cancers showed amplifications are more prevalent than deletions: rare (2.25-fold) and common cancers (3-fold) (Figure S1A). Common cancers have an overall greater number of amplifications (2.8-fold) and deletions (2.2-fold) than rare cancers. When this analysis is limited only to per sample amplifications of oncogenes and deletions of tumor suppressor genes, the same trend is seen (Figure S1B,C). Whether these differences could be attributed to a specific cancer type, we graphed the total number of amplifications and deletions per sample for all protein coding genes across all of the rare and common cancer types individually (Figure S2A).

2.4. Cell Fate Pathways and TP53 Mutations Dominate Pathogenesis in Rare Cancers

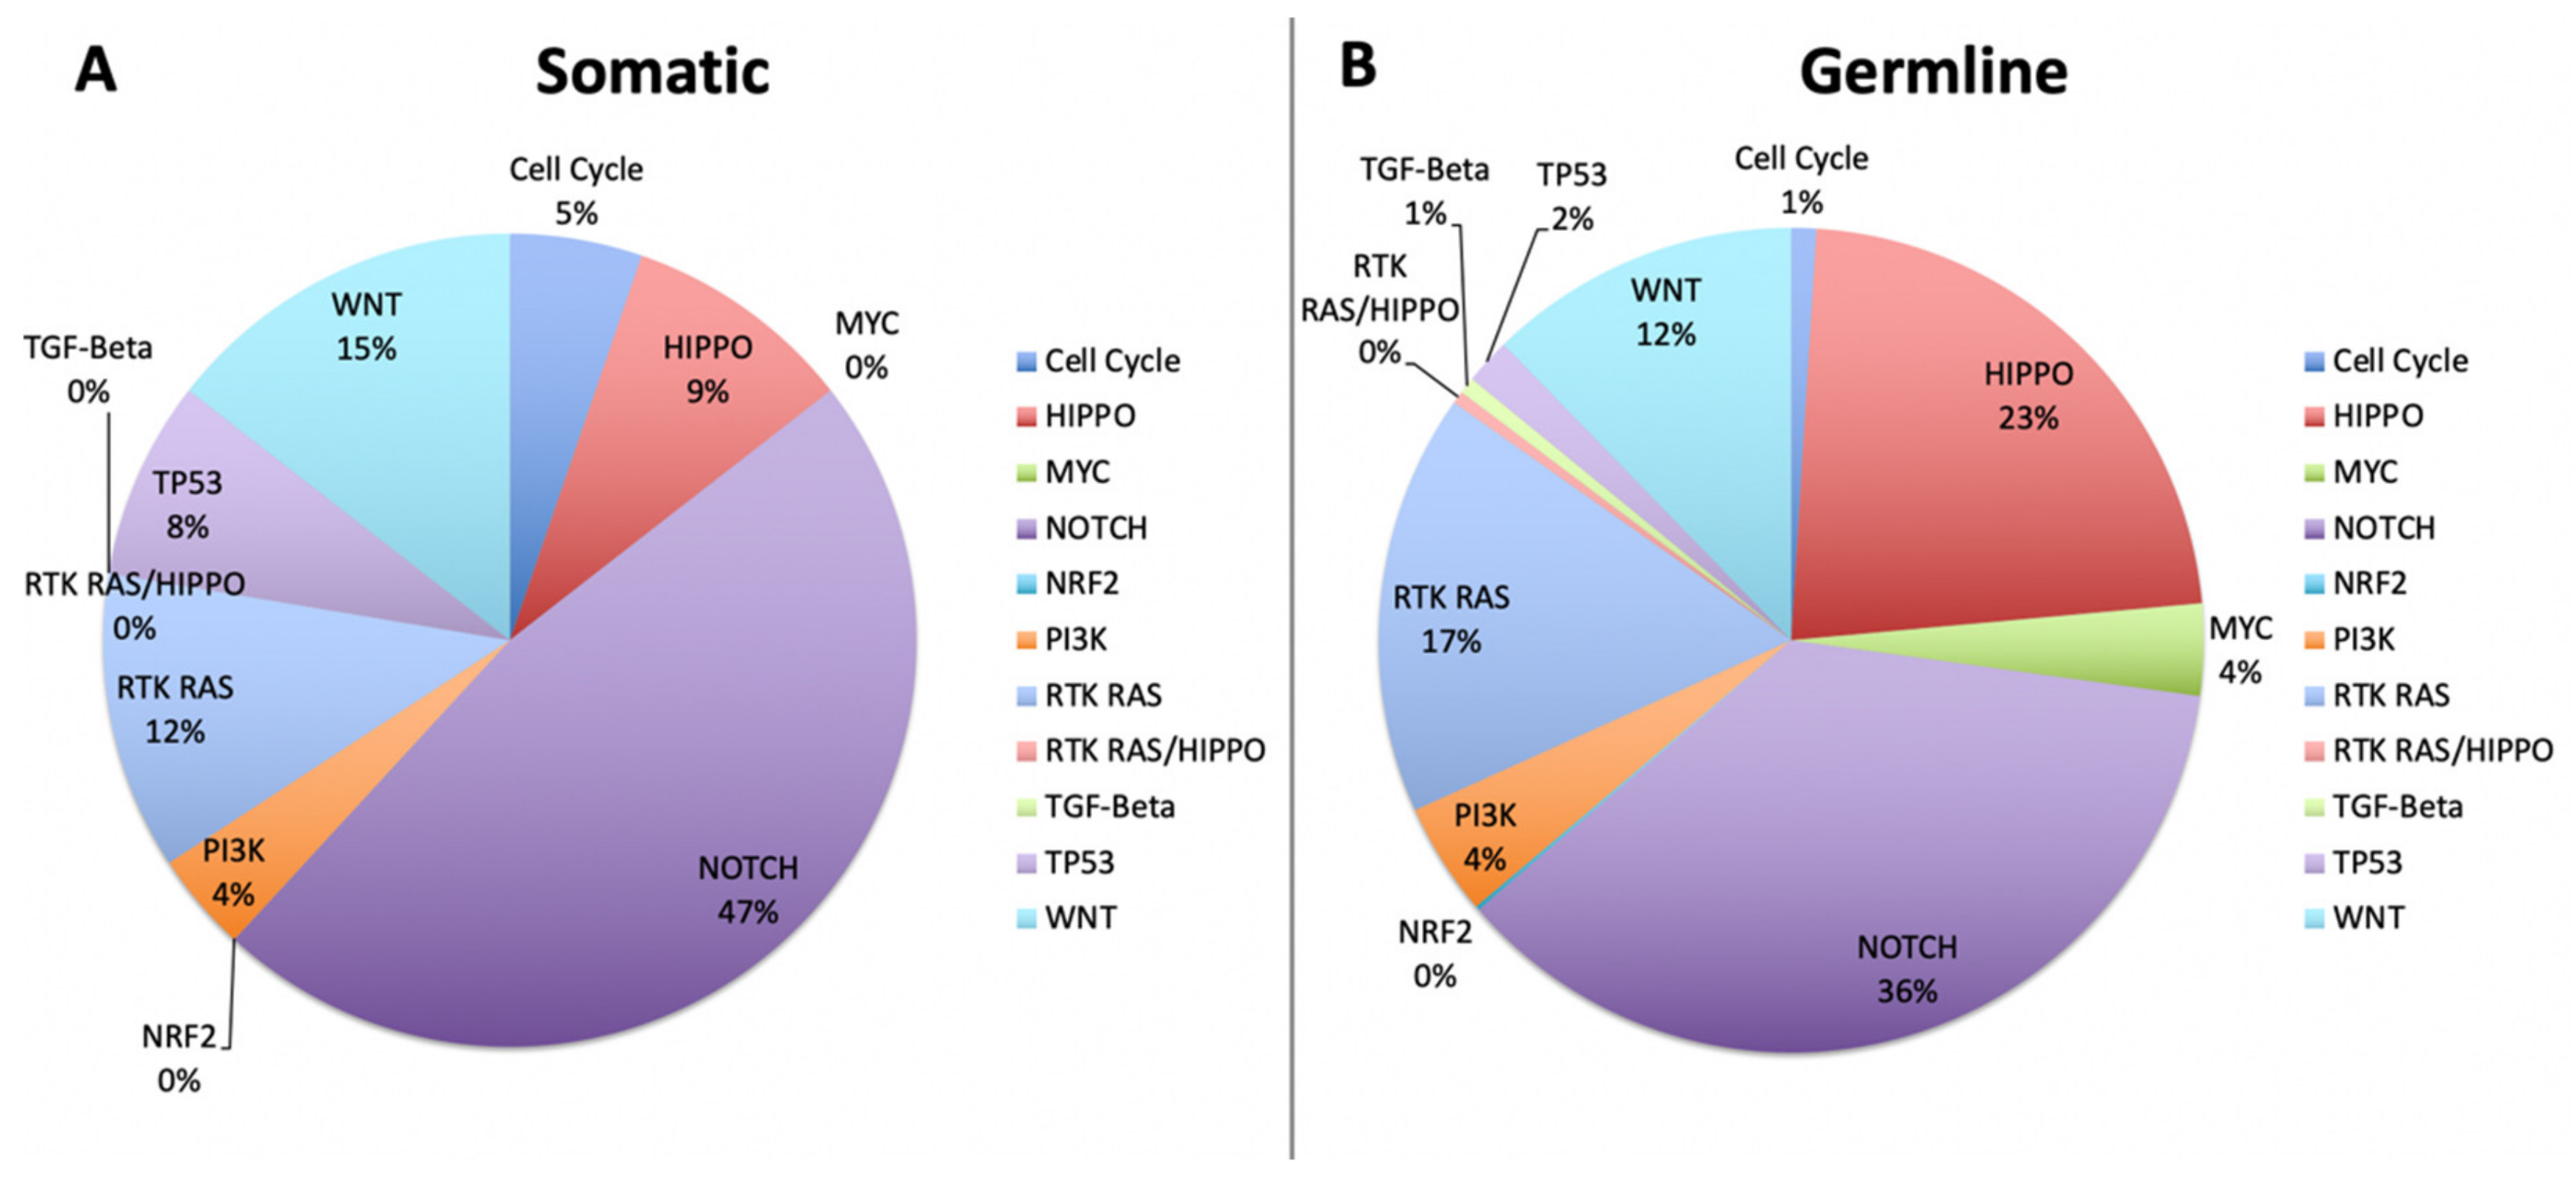
To determine the alteration frequencies of pathways known to be involved in cancer, we mapped all variants to genes in 11 canonical signaling pathways [28]. Figure 6 shows the percentages of both somatic and germline variants detected in our rare tumor cohort. The largest difference between somatic and germline variants is seen in the increase of germline variants in the Hippo pathway (9% somatic vs. 23% germline), involved in cell proliferation and differentiation. The Hippo pathway consists of 12 tumor suppressor genes and three oncogenic genes that determines cell fate (CF) and is known to be disrupted at low frequencies in several common cancers, most notably CNS and gastrointestinal tumors [28]. Outside of the increase in Hippo signaling, disruption of the germline variants largely matched the somatic variants with both groups showing Notch signaling, another CF determinant, as the most frequently hit with 36% and 47% respectively. Interestingly, all 27 cases had germline variants detected in the RTK-RAS pathway key to cell survival (CS) (101 total variants), Hippo (138) and Notch pathways (238), and 24 of 27 cases showed a variant in the WNT pathway (75 total) which, excluding the RTK-RAS pathway, are all largely comprised of TSGs. When looking at somatic variants, 20 cases had at least one variant in the Notch pathway (36 total), while eight cases had a variant in the WNT pathway (11 total), both CF determinants.
When the analysis was limited to only variants predicted to be driver mutations, we saw 22% of germline variants in the WNT signaling pathway and 13% in the Hippo pathway, with no somatic driver variants detected (Figure 7). All other pathways in the driver mutation analysis were relatively consistent across germline and somatic except for TP53, which saw an increase of 17% to 28% from germline to driver. The number total of cases showing a predicted germline driver mutation was limited to 23, with (n = 5) cases each showing variants in WNT, Notch (n = 4) cases and each in RTK-RAS and TP53 (n = 3) in Hippo. No other pathway showed a germline driver mutation in more than 1 case. Of the somatic variants, the predicted drivers clustered around the Notch and p53 pathways with four and five respectively, with one case showing a double hit in TP53. We also saw three cases with a somatic driver in the RTK-RAS pathway, one of which also had a double hit.

2.5. Double Hit Analysis Shows Driver Oncogenes Correlate to CNAs

Finally, we investigated if any variants classified as drivers had also undergone any additional copy number variation. This analysis identified 5 total cases (18.5%) experiencing a double hit (Table S5). Of the eight total driver mutations found in oncogenes, four underwent amplification. The most severe of these likely to have a functional effect was found in the anaplastic astrocytoma case, which saw both a driver mutation (rs149840192, p.A289V) and an amplification of at least five extra copies of the EGFR. This was of particular interest as both amplifications and mutations in EGFR have been shown to be drivers in many cancer types and may confer efficacy of treatment with tyrosine kinase inhibitors [29,30]. With respect to TSG double hits we identified only one case, metastatic chondrosarcoma, that contained both a driver mutation and a CNA. This was a stop gain variant that also showed a heterozygous loss of copy in TP53.

3. Discussion

Deep genomic profiling of rare tumors is critical to understand the molecular architecture of each specific cancer type to attain clear and actionable therapies due to difficulties in early diagnosis and limited or no standard of care therapies [31]. Tumor-only NGS fails to provide a complete picture since germline sequencing is absent which can generate false positive biomarkers, that may lead to targeting of a variant unrelated to cancer development [32] and/or not be present on the panel. Our findings that rare tumors have an increased rate of germline pathogenic variants compared to common tumors (Table 4) driven by genetic predisposition(s) as opposed to environmental or hormonal factors, increase the lifetime risk for developing cancer. This may help explain the wide tissue distribution affected by rare cancers (Figure 1). While demonstrated in a relatively small initial sample size, this finding warrants further investigation with tumor/germline sequencing of more rare tumor cases. Such studies may have implications for cancer risk assessment and potential genetic counseling of patients and family members in the setting of rare tumor diagnoses [33].
For example, in a patient with glioblastoma, tumor-normal match pair WES identified a germline variant RUNX1-M151L deemed likely pathogenic (ACMG guidelines [34]) but not reported with tumor-only NGS (Caris Life Sciences) as it was not included in their panel. RUNX1 has been described as an activator of gene expression and a positive driver of the GBM mesenchymal aggressive phenotype [35]. Over-expression of RUNX1 in U87 GBM cells inhibited tumor growth by extensive down-regulation of target genes and deregulation of key developmental pathways [36]. Given the aggressive phenotype of our patient, we can surmise that the RUNX1-M151L variant has a partial or complete loss of function. In addition, there are important implications for family members who wish to evaluate their risk, and given knowledge of germline predisposition may opt for enhanced cancer screening and prevention strategies [37,38].
Our cohort of rare tumors affected 18 different tissues of the body (Figure 1), with only one case affecting the tissues typical of common cancers (one case of spindle cell breast cancer—chosen for comparison (i.e., lung, colon, breast or prostate)). We identified IDH1 and PIK3CA gene variants which occurred at the same site. The IDH1 variant occurred at amino acid 132 in the IDH1 gene in two sarcoma cases; chondrosarcoma R132C and pleiomorphic sarcoma R132G substitution respectively. The pleomorphic sarcoma with a concurrent IDH1 R132G mutation and a SUFU splice site mutation may indicate that the Hedgehog (Hh) pathway is operant in these cells independent of SHH ligand expression [39] since SUFU is a negative regulator of Hh signaling [40]. Further, a frameshift mutation in SUFU was found in our metastatic mucoepidermoid sarcoma patient indicative of active Hh signaling amenable for therapeutic intervention. The mutant IDH1 makes it a highly promising candidate for the IDH1 small molecule inhibitor ivosidenib [41] approved for AML. The PIK3CA variant occurred at amino acid E542K in two rare salivary gland tumors, myoepithelioma and mucoepidermoid tumor. A concurrent HRAS mutation identified in salivary mucoepidermoid tumor patient will most likely not respond to a PI3KCA inhibitor, however, the myoepithelioma patient could benefit from off-label therapy. There were nine genes in our cases that occurred in more than a single rare cancer case of which TP53 is the most prevalent occurring in seven cases. TP53 is the most common gene to carry pathogenic variants in common cancers with an average of 44.4%. In addition, we found two relatively common cancer genes in more than one rare cancer case: ARID1A (occurred in two cases and twice in one case) and CDKN2A (occurred in two cases). ARID1A and CDKN2A are also on the top 20 cancer gene list in breast, colon, and lung cancers, and are found in an average of 7.4% and 4.2% cases, respectively, across all four common cancer types. Both ARID1A and CDKN2A mutations are context dependent tumor suppressor genes that may be targetable in a synthetic lethal pair such as with a EGLN (prolyl hydroxylase) inhibitor (targeting HIF1α) or MTAP deletions with a PRMT5 (arginine N-methyltransferase 5) inhibitor dependent tumors respectively [42]. To look for additional commonality across cases we performed a GO enrichment analysis which showed 32 significant GO term associations (Table S6).
Further, we found six genes—FOXL2, TNFAIP3, CHD1L, HRAS, KIT, CTCF—that occurred in 12 cases that are not on the top 20 list of any of the four common cancers used for comparison. These genes are found in <5% of breast, colon, prostate, or lung cancer cases. FOXL2 mutations was found in Granulosa cell ovarian cancer case, ~5% of ovarian cancer, which functions as a DNA binding forkhead transcription factor required for granulosa cell differentiation. The Cys134Trp mutation in FOXL2 is associated increased cell cycling and downregulation of genes associated with apoptosis [43]. The tumor suppressor-oncogene pair TNFAIP3 [44] and CHD1L [45] both have a frameshift deletion respectively is found in our gray zone lymphoma patient. Both play pro-oncogenic roles in cancer: TNFAIP3 is a ubiquitin-editing enzyme that binds and inhibits E3 ubiquitin ligase RNF168 responsible for regulating histone H2A turnover key to proper DNA repair, while CHD1L is a DNA helicase possessing chromatin remodeling functions important for early embryonic development and promotes cell proliferation and anti-apoptosis. The GIST patient also has a tumor suppressor-oncogene pair, CTCF [46] and KIT [47] both with a non-frameshift deletion respectively. CTCF is a 11-ZF DNA binding protein known as the master weaver of the genome as it functions in the regulation of chromatin structure and function. It is a haplo-insufficient tumor suppressor gene with of loss of function leading loss of epigenetic silencing and anti-apoptosis [46]. Oncogenic KIT mutations (e.g., non-frameshift deletions) are well established in GIST. We are the first to document a concurrent loss of CTCF and a KIT activating mutation in GIST, however, in SDH-deficient GIST, CTCF may be epigenetically silenced [48].
Copy number alterations (CNAs) play a role in cancer type (e.g., breast, colorectal) [26], tumor progression, overall prognosis, and response to therapy [27]. Rare cancers individually have a generally low level of amplifications, on par with colorectal and prostate cancers, with the dramatic exception of sarcomas and uterine carcinomas (384/case and 541/case respectively), which show amplifications at an equal or higher level than lung and breast cancers (343/case and 385/case respectively) (Figure S1A). Deletion frequencies were generally lower in the rare tumor cohort with the exception of sarcomas, which showed a number of per-sample deletions (133/case) that was higher than any other rare tumor types and higher than all common cancers save prostate (180/case) (Figure S1B,C).
Analysis restricted to amplifications of oncogenes and loss of tumor suppressor genes showed the same patterns in both rare and common cancers (Figure S2A). Sarcomas and uterine carcinomas showed a significantly elevated frequency of amplifications of oncogenes when compared to all other rare cancer types (Figure S2B). Further, sarcomas showed an increased frequency of deletions of tumor suppressor genes (Figure S2C). This has significant implications as previous studies have shown a correlation between CNA burden and immunotherapy response rates, particularly in lung squamous cell carcinoma and certain breast cancer subtypes [49]. Moreover, there have been recent reports showing that immunotherapies are well tolerated in advanced sarcoma and many patients are seeing clinical benefit [50]. Taken together, the continued characterization of CNA burden in rare tumors offers potential for better informed clinical management as well as a general prognostic indicator.
This study is limited by the relatively small sample size and by methodology that only targets the protein-coding regions of the genome. This limitation did not allow us to assess many important questions concerning the overall stability of some genomic regions compared to others in rare cancer, any impacts of epigenetic regulation, etc. In addition, there are difficulties in comparing rare and common cancers from different data sets. Despite these limitations our study suggests that tumor-germline matched analysis may have particular advantages in the case of rare tumors.

4. Materials and Methods

4.1. Patients with Rare Cancers

This study involved a consecutive group of rare tumor patients referred to the Early Phase Therapeutics Program regarding molecular profiling-based basket and umbrella clinical trials and/or off-label therapies. All patients (n = 27, see Graphical Abstract) were evaluated at the University of Arizona Cancer Center Clinic and consented to an IRB approved protocol. All procedures performed, including buccal samples for germline DNA, involving human participants were done in accordance with the ethical standards of the University of Arizona Institutional Review Board (IRB#1505875499; Precision Medicine and Genomic Analysis Protocol for Oncology). Tumor biopsies for all patients were evaluated by University of Arizona Genetics Core (UAGC, Tucson, AZ, USA), where WES was performed. Paraffin blocks from the same tumor samples (without matched normal) were sent to Caris Life Sciences for NGS on a 592-gene panel (Caris MI/X platform).

4.2. Tumor and Germline Whole Exome and Gene Panel Sequencing

Tumor genomic DNA was isolated from paraffin tissue blocks using the ReliaPrep FFPE gDNA Miniprep system (Promega, Madison, WI, USA). Matching germline DNA was isolated from buccal swabs. DNA was quantified using the Qubit quantitation system with standard curve as per the supplier protocol (Thermo Fisher, Waltham, MA, USA) and all samples were further tested for quality using the Fragment Analyzer (Advanced Analytical, Ames, IA, USA) following the manufacturer-recommended protocols. The estimated fraction of tumor cells in the selected tissue ranged from 10% to 90%. Whole exome sequencing (WES) was performed by array capture of 60 Mb of exome target sequence using the SureSelectXT Human All Exon V6 enrichment (Agilent, Santa Clara, CA, USA) or a Nextera kit (Illumina, San Diego, CA, USA). All exome library builds were followed by paired-end sequencing (2 × 100 bp reads) on an Illumina HiSeq 2500 or NextSeq 550.

4.3. Sequence Analysis

The mean coverage over the exon target regions was 154-fold for the tumor sample and 99-fold for the normal sample. Sequences were aligned to the human genome using standard methods [51], followed by variant calling comparing the tumor/germline samples using MuTect2 (GATK v.3.7, [52]) and freebayes (v0.9.7, [53]). BAM/VCF files generated for this study have been submitted to the database of Genotypes and Phenotypes (dbGaP) under the project ID (pending - submitted to local IRB and NCI, April 2020). Results from variant calling were then filtered using the “vcffilter” function found in the C++ library tool vcflib (https://github.com/vcflib/vcflib#vcflib). For MuTect2 results, variants were filtered based on the MuTect2-assigned filter flag, quality score, and read depth (FILTER = PASS, QUAL > 20 and DP > 20). For freebayes results, tumor and germline variants were separated into individual vcf files using “vcfsamplediff” function in vcflib. For freebayes somatic results, variants were filtered based on the quality score, read depth, and somatic score fields (QUAL > 20, DP > 20 and SSC > 50). For freebayes germline results, variants were filtered based on quality score and read depth (QUAL > 20 and DP > 20). The filtered variants were annotated using ANNOVAR release version “2018Apr16” [54]. The following databases were used for annotation: RefSeq, dbsnp build 150, ExAC v0.3, and gnomAD exomes v2.1.1. Using ANNOVAR’s “annotate_variantion.pl” script, the annotated variants were further filtered based on the gnomAD annotation using a score threshold of 0.05, leaving only variants with a population frequency <5% remaining.

4.4. Pathway and Double Hit Analysis

Using vcftools, the remaining variants were restricted to either known oncosignaling genes for pathway analysis [28] or known oncogenes [55] and tumor suppressor genes [56] for the double hit analysis. Mutations in these gene sets were assessed for driver status using the Cancer Genome Interpreter (CGI) [57].

4.5. Copy Number Alteration Analysis

Somatic copy number alterations (CNAs) were identified using Sequenza v2.1.2 [22] for R (v3.5.1). CNAs were matched to chromosomal bands and gene locations using a custom R script using the packages GenomicRanges v1.36.0 [58], annotatr v1.10.0 [59], org.Hs.eg.db v3.8.2 [60], and biomaRt v2.40.0 [61]. Amplified and deleted regions were checked for overlap with identified driver mutations to add to the double-hit analysis. Heat maps showing the frequency of amplifications/deletions in 2.5 Mbp windows along the chromosomes were generated using the R package chromoMap v0.2 [62]. Sequenza results files were then used as input to GISTIC 2.0 for comparison with gene-level results from The Cancer Genome Atlas (TCGA, National Institutes of Health, Bethesda, MD, USA). Parameters used for GISTIC 2.0 were based on those reported for the TCGA project except where they had to be modified to reflect the greater noisiness of our WES-derived segment calls as compared to the array-based data used by the TCGA. Gene identifiers from NCBI were assigned by GISTIC using the included hg19 reference file. Counts of protein-coding genes were then compiled for the entire gene set, as well as for lists of oncogenes [55] and tumor suppressor genes [56].

5. Conclusions

WES of tumor-normal allows for better CNV analysis in addition to identifying germline pathogenic mutations. In addition, WES of rare tumors provides information that is outside the current search space of gene panels but may ultimately provide clinically useful data to be used now or in the future. Although there is currently a relative shortage of tumor-specific FDA approved therapies and clinical trials for rare tumor patients, as novel targeted therapies become more readily available, specification of somatic vs. germline mutations and CNA in newly linked cancer genes will be critical in determining the best possible treatment options. This is especially important given the possibility of positive treatment outcomes for rare tumors with targeted and immune checkpoint therapies. Taken together, our study highlights the urgent need for exploration of tumorigenesis pathways in rare tumors and the subsequent need for development of specific clinical trials to determine optimal treatment strategies. As shown in our study, rare tumor patients may disproportionately benefit from both tumor-germline and WES approaches to potentially allow for better treatment options via future tumor genome-guided discoveries and therapies.

Supplementary Materials

The following are available online at https://www.mdpi.com/2072-6694/12/6/1618/s1, Figure S1: CNA gene counts from TCGA rare and common cancer cohorts; Figure S2: CNA gene counts from TCGA rare and common cancer cohorts, broken down by cancer type; Table S1: 1670 were found in oncogenes and 1673 were in tumor suppressor genes, generating an average of 124 germline variants per case; Table S2: The number of somatic SNVs and small indels detected in all cases totaled 523, with 306 in oncogenes and 217 in tumor suppressor genes; Table S3: Classification of oncogenic genes (OG) and tumor suppressor genes (TSG) was defined by the Oncogene; Table S4: Total number of amplified oncogenes and deletions of tumor suppressor genes in the cohort rare cancer cases; Table S5: Drivers genes with additional copy number variation—Double Hits; Table S6: GO Enrichment analysis.

Author Contributions

D.M., M.H. and R.S. conceptualized, supervised and provided resources for the entirety of the study. D.M., H.M.B. and P.C. identified, obtained consent and treated patients with rare cancers. B.P. reviewed patient charts, collected molecular profiling data for NGS and annotated the data. R.S., L.J. and B.L. conducted WES and analysis. R.S., B.P., L.J., H.M.B., P.C., B.L., M.H. and D.M. contributed to writing, reviewing and editing the manuscript. All authors have read and agreed to the published version of the manuscript.

Funding

We wish to acknowledge the 2P30 CA023074 supplement of the Cancer Center Support Grant from the NCI/NIH to the University of Arizona Cancer Center.

Acknowledgments

We thank Crystal Placencia for collecting buccal swabs from patients and Brian Mannakee for suggesting the use of Sequenza and for comments on the manuscript. The results published here are in part based upon data generated by the TCGA Research. We thank Yi Zheng, MD for a tumor specimen from a pediatric patient. Network: https://www.cancer.gov/tcga.

Conflicts of Interest

D.M. is in the speaker’s bureau for Caris Life Sciences and GuardantHealth. None of the other authors have any conflict of interest or financial disclosures to report.

Abbreviations

ACC Adrenocortical carcinoma
CHOL Cholangiocarcinoma
GBM Glioblastoma multiforme
LGG Brain Lower Grade Glioma
MESO Mesothelioma
PCPG Pheochromocytoma and Paraganglioma
SARC Sarcoma
TGCT Testicular Germ Cell Tumors
THYM Thymoma
UCS Uterine carcinoma
UVM Uveal melanoma
BRCA Breast invasive carcinoma
COAD Colon adenocarcinoma
LUAD Lung adenocarcinoma
LUSC Lung squamous cell carcinoma
PRAD Prostate adenocarcinoma
READ Rectum adenocarcinoma
ACMG American College of Medical Genetics

References

  1. Dienstmann, R.; Rodon, J.; Barretina, J.; Tabernero, J. Genomic medicine frontier in human solid tumors: Prospects and challenges. J. Clin. Oncol. 2013, 31, 1874–1884. [Google Scholar] [CrossRef] [PubMed]
  2. Bradford, D.; Reilly, K.M.; Widemann, B.C.; Sandler, A.; Kummar, S. Developing therapies for rare tumors: Opportunities, challenges and progress. Exp. Opin. Orphan Drugs 2015, 4, 93–103. [Google Scholar] [CrossRef]
  3. Kato, S.; Kurasaki, K.; Ikeda, S.; Kurzrock, R. Rare tumor clinic: The university of california san diego moores cancer center experience with a precision therapy approach. Oncologist 2018, 23, 171–178. [Google Scholar] [CrossRef] [PubMed] [Green Version]
  4. Gatta, G.; van der Zwan, J.M.; Casali, P.G.; Siesling, S.; Dei Tos, A.P.; Kunkler, I.; Otter, R.; Licitra, L.; Mallone, S.; Tavilla, A.; et al. Rare cancers are not so rare: The rare cancer burden in Europe. Eur. J. Cancer 2011, 47, 2493–2511. [Google Scholar] [CrossRef] [PubMed]
  5. Tap, W.D.; Wainberg, Z.A.; Anthony, S.P.; Ibrahim, P.N.; Zhang, C.; Healey, J.H.; Chmielowski, B.; Staddon, A.P.; Cohn, A.L.; Shapiro, G.I.; et al. Structure-guided blockade of csf1r kinase in tenosynovial giant-cell tumor. N. Engl. J. Med. 2015, 373, 428–437. [Google Scholar] [CrossRef] [PubMed] [Green Version]
  6. Ballinger, M.L.; Goode, D.L.; Ray-Coquard, I.; James, P.A.; Mitchell, G.; Niedermayr, E.; Puri, A.; Schiffman, J.D.; Dite, G.S.; Cipponi, A.; et al. Monogenic and polygenic determinants of sarcoma risk: An international genetic study. Lancet Oncol. 2016, 17, 1261–1271. [Google Scholar] [CrossRef]
  7. Fishbein, L.; Nathanson, K.L. Pheochromocytoma and paraganglioma: Understanding the complexities of the genetic background. Cancer Genet. 2012, 205, 1–11. [Google Scholar] [CrossRef] [Green Version]
  8. Huang, K.L.; Mashl, R.J.; Wu, Y.; Ritter, D.I.; Wang, J.; Oh, C.; Paczkowska, M.; Reynolds, S.; Wyczalkowski, M.A.; Oak, N.; et al. Pathogenic germline variants in 10,389 adult cancers. Cell 2018. [Google Scholar] [CrossRef] [Green Version]
  9. Solomon, S.; Das, S.; Brand, R.; Whitcomb, D.C. Inherited pancreatic cancer syndromes. Cancer J. 2012, 18, 485–491. [Google Scholar] [CrossRef] [Green Version]
  10. Urbini, M.; Nannini, M.; Astolfi, A.; Indio, V.; Vicennati, V.; De Luca, M.; Tarantino, G.; Corso, F.; Saponara, M.; Gatto, L.; et al. Whole exome sequencing uncovers germline variants of cancer-related genes in sporadic pheochromocytoma. Int. J. Genom. 2018. [Google Scholar] [CrossRef] [Green Version]
  11. Larson, K.; Kannaiyan, R.; Pandey, R.; Chen, Y.; Babiker, H.M.; Mahadevan, D. A Comparative Analysis of Tumors and Plasma Circulating Tumor DNA in 145 Advanced Cancer Patients Annotated by 3 Core Cellular Processes. Cancers 2020, 12, 701. [Google Scholar] [CrossRef] [PubMed] [Green Version]
  12. National Cancer Registration and Analysis Service. Available online: http://www.ncin.org (accessed on 6 April 2020).
  13. Seifert, G.; Brocheriou, C.; Cardesa, A.; Everson, J.W. WHO international classification of tumours. Tentative histological classification of salivary gland tumours. Pathol. Res. Pract. 1990, 186, 555–581. [Google Scholar] [CrossRef]
  14. Duggan, M.A.; Anderson, W.F.; Altekruse, S.; Penberthy, L.; Sherman, M.E. The surveillance, epidemiology, and end results (SEER) program and pathology: Toward strengthening the critical relationship. Am. J. Surg. Pathol. 2016, 40, e94–e102. [Google Scholar] [CrossRef] [PubMed]
  15. Ibrahim, R.M.; Steenstrup Jensen, S.; Juel, J. Clear cell sarcoma—A review. J. Orthop. 2018, 15, 963–966. [Google Scholar] [CrossRef] [PubMed] [Green Version]
  16. Moten, A.S.; Jayarajan, S.N.; Willis, A.I. Spindle cell carcinoma of the breast: A comprehensive analysis. Am. J. Surg. 2016, 211, 716–721. [Google Scholar] [CrossRef] [PubMed]
  17. Søreide, K.; Sandvik, O.M.; Søreide, J.A.; Giljaca, V.; Jureckova, A.; Bulusu, V.R. Global epidemiology of gastrointestinal stromal tumours (gist): A systematic review of population-based cohort studies. Cancer Epidemiol. 2016, 40, 39–46. [Google Scholar] [CrossRef] [Green Version]
  18. Starrett, G.J.; Marcelus, C.; Cantalupo, P.G.; Katz, J.P.; Cheng, J.; Akagi, K.; Thakuria, M.; Rabinowits, G.; Wang, L.C.; Symer, D.E.; et al. Merkel cell polyomavirus exhibits dominant control of the tumor genome and transcriptome in virus-associated Merkel cell carcinoma. mBio 2017. [Google Scholar] [CrossRef] [Green Version]
  19. Collins, R.R.J.; Patel, K.; Putnam, W.C.; Kapur, P.; Rakheja, D. Oncometabolites: A New Paradigm for Oncology, Metabolism, and the Clinical Laboratory. Clin. Chem. 2017, 63, 1812–1820. [Google Scholar] [CrossRef] [Green Version]
  20. Postow, M.A.; Robson, M.E. Inherited gastrointestinal stromal tumor syndromes: Mutations, clinical features, and therapeutic implications. Clin. Sarcoma Res. 2012, 2, 16. [Google Scholar] [CrossRef] [Green Version]
  21. Bertelsen, B.; Tuxen, I.V.; Yde, C.W.; Gabrielaite, M.; Torp, M.H.; Kinalis, S.; Oestrup, O.; Rohrberg, K.; Spangaard, I.; Santoni-Rugiu, E.; et al. High frequency of pathogenic germline variants within homologous recombination repair in patients with advanced cancer. NPJ Genom. Med. 2019, 4, 13. [Google Scholar] [CrossRef]
  22. Favero, F.; Joshi, T.; Marquard, A.M.; Birkbak, N.J.; Krzystanek, M.; Li, Q.; Szallasi, Z.; Eklund, A.C. Sequenza: Allele-specific copy number and mutation profiles from tumor sequencing data. Ann. Oncol. 2015, 26, 64–70. [Google Scholar] [CrossRef] [PubMed]
  23. Mermel, C.H.; Schumacher, S.E.; Hill, B.; Meyerson, M.L.; Beroukhim, R.; Getz, G. GISTIC2.0 facilitates sensitive and confident localization of the targets of focal somatic copy-number alteration in human cancers. Genome Biol. 2011, 12. [Google Scholar] [CrossRef] [PubMed] [Green Version]
  24. Cerami, E.; Gao, J.; Dogrusoz, U.; Gross, B.E.; Sumer, S.O.; Aksoy, B.A.; Jacobsen, A.; Byrne, C.J.; Heuer, M.L.; Larsson, E.; et al. The cBio Cancer Genomics Portal: An Open Platform for Exploring Multidimensional Cancer Genomics Data. Cancer Discov. 2012, 2, 401. [Google Scholar] [CrossRef] [PubMed] [Green Version]
  25. Zack, T.I.; Schumacher, S.E.; Carter, S.L.; Cherniack, A.D.; Saksena, G.; Tabak, B.; Lawrence, M.S.; Zhang, C.-Z.; Wala, J.; Mermel, C.H.; et al. Pan-cancer patterns of somatic copy number alteration. Nat. Genet. 2013, 45, 1134–1140. [Google Scholar] [CrossRef] [Green Version]
  26. Hieronymus, H.; Murali, R.; Tin, A.; Yadav, K.; Abida, W.; Moller, H.; Berney, D.; Scher, H.; Carver, B.; Scardino, P.; et al. Tumor copy number alteration burden is a pan-cancer prognostic factor associated with recurrence and death. eLife 2018, 7, e37294. [Google Scholar] [CrossRef]
  27. Shlien, A.; Malkin, D. Copy number variations and cancer. Genome Med. 2009, 1, 62. [Google Scholar] [CrossRef] [Green Version]
  28. Sanchez-Vega, F.; Mina, M.; Armenia, J.; Chatila, W.K.; Luna, A.; La, K.C.; Dimitradoy, S.; Liu, D.L.; Kantheti, H.S.; Saghafinia, S.; et al. Oncogenic Signaling Pathways in The Cancer Genome Atlas. Cell 2018, 173, 321–337. [Google Scholar] [CrossRef] [Green Version]
  29. Yewale, C.; Baradia, D.; Vhora, I.; Patil, S.; Misra, A. Epidermal growth factor receptor targeting in cancer: A review of trends and strategies. Biomaterials 2013, 34, 8690–8707. [Google Scholar] [CrossRef]
  30. Charpidou, A.; Blatza, D.; Anagnostou, V.; Syrigos, K.N. EGFR mutations in non-small cell lung cancer-clinical implications. In Vivo 2008, 22, 529–536. [Google Scholar]
  31. Groisberg, R.; Hong, D.S.; Roszik, J.; Janku, F.; Tsimberidou, A.M.; Javle, M.; Meric-Bernstam, F.; Subbiah, V. Clinical next-generation sequencing for precision oncology in rare cancers. Mol. Cancer Ther. 2018, 17, 1595–1601. [Google Scholar] [CrossRef] [Green Version]
  32. Jones, S.; Anagnostou, V.; Lytle, K.; Parpart-Li, S.; Nesselbush, M.; Riley, D.R.; Shukla, M.; Chesnick, B.; Kadan, M.; Papp, E.; et al. Personalized genomic analyses for cancer mutation discovery and interpretation. Sci. Transl. Med. 2015, 7, 283ra253. [Google Scholar] [CrossRef] [PubMed] [Green Version]
  33. Rahman, N. Realizing the promise of cancer predisposition genes. Nature 2014, 505, 302–308. [Google Scholar] [CrossRef] [PubMed] [Green Version]
  34. Richards, S.; Aziz, N.; Bale, S.; Bick, D.; Das, S.; Gastier-Foster, J.; Grody, W.W.; Hegde, M.; Lyon, E.; Spector, E.; et al. Standards and guidelines for the interpretation of sequence variants: A joint consensus recommendation of the american college of medical genetics and genomics and the association for molecular pathology. Genet. Med. 2015, 17, 405–424. [Google Scholar] [CrossRef] [PubMed]
  35. Carro, M.S.; Lim, W.K.; Alvarez, M.J.; Bollo, R.J.; Zhao, X.; Snyder, E.Y.; Sulman, E.P.; Anne, S.L.; Doetsch, F.; Colman, H.; et al. The transcriptional network for mesenchymal transformation of brain tumours. Nature 2010, 463, 318–325. [Google Scholar] [CrossRef]
  36. Bogoch, Y.; Friedlander-Malik, G.; Lupu, L.; Bondar, E.; Zohar, N.; Langier, S.; Ram, Z.; Nachmany, I.; Klausner, J.M.; Pencovich, N. Augmented expression of runx1 deregulates the global gene expression of u87 glioblastoma multiforme cells and inhibits tumor growth in mice. Tumour Biol. 2017. [Google Scholar] [CrossRef] [Green Version]
  37. Zhang, J.; Walsh, M.F.; Wu, G.; Edmonson, M.N.; Gruber, T.A.; Easton, J.; Hedges, D.; Ma, X.; Zhou, X.; Yergeau, D.A.; et al. Germline mutations in predisposition genes in pediatric cancer. N. Engl. J. Med. 2015, 373, 2336–2346. [Google Scholar] [CrossRef] [Green Version]
  38. Cheng, H.; Powers, J.; Schaffer, K.; Sartor, O. Practical methods for integrating genetic testing into clinical practice for advanced prostate cancer. Am. Soc. Clin. Oncol. Educ. Book 2018, 38, 372–381. [Google Scholar] [CrossRef]
  39. Abiria, S.A.; Williams, T.V.; Munden, A.L.; Grover, V.K.; Wallace, A.; Lundberg, C.J.; Valadez, J.G.; Cooper, M.K. Expression of Hedgehog ligand and signal transduction components in mutually distinct isocitrate dehydrogenase mutant glioma cells supports a role for paracrine signaling. J. Neurooncol. 2014, 119, 243–251. [Google Scholar] [CrossRef] [Green Version]
  40. Infante, P.; Faedda, R.; Bernardi, F.; Bufalieri, F.; Lospinoso Severini, L.; Alfonsi, R.; Mazzà, D.; Siler, M.; Coni, S.; Po, A.; et al. Itch/beta-arrestin2-dependent non-proteolytic ubiquitylation of sufu controls hedgehog signalling and medulloblastoma tumorigenesis. Nat. Commun. 2018, 9, 976. [Google Scholar] [CrossRef]
  41. Hinsch, A.; Brolund, M.; Hube-Magg, C.; Kluth, M.; Simon, R.; Möller-Koop, C.; Sauter, G.; Steurer, S.; Luebke, A.; Angerer, A.; et al. Immunohistochemically detected idh1(r132h) mutation is rare and mostly heterogeneous in prostate cancer. World J. Urol. 2018, 36, 877–882. [Google Scholar] [CrossRef]
  42. Huang, A.; Garraway, L.A.; Ashworth, A.; Weber, B. Synthetic lethality as an engine for cancer drug target discovery. Nat. Rev. Drug Discov. 2020, 19, 23–38. [Google Scholar] [CrossRef] [PubMed]
  43. Shah, S.P.; Köbel, M.; Senz, J.; Morin, R.D.; Clarke, B.A.; Wiegand, K.C.; Leung, G.; Zayed, A.; Mehl, E.; Kalloger, S.E.; et al. Mutation of FOXL2 in granulosa-cell tumors of the ovary. N. Engl. J. Med. 2009, 360, 2719–2729. [Google Scholar] [CrossRef] [PubMed]
  44. Ghadban, T.; Schmidt-Yang, M.; Uzunoglu, F.G.; Perez, D.R.; El Gammal, A.T.; Miro, J.T.; Wellner, U.; Pantel, K.; Izbicki, J.R.; Vashist, Y.K. Evaluation of the germline single nucleotide polymorphism rs583522 in the tnfaip3 gene as a prognostic marker in esophageal cancer. Cancer Genet. 2015, 208, 595–601. [Google Scholar] [CrossRef]
  45. Liu, C.; Fu, X.; Zhong, Z.; Zhang, J.; Mou, H.; Wu, Q.; Sheng, T.; Huang, B.; Zou, Y. CHD1L Expression Increases Tumor Progression and Acts as a Predictive Biomarker for Poor Prognosis in Pancreatic Cancer. Dig. Dis. Sci. 2017, 62, 2376–2385. [Google Scholar] [CrossRef] [PubMed]
  46. Marshall, A.D.; Bailey, C.G.; Champ, K.; Vellozzi, M.; O’Young, P.; Metierre, C.; Feng, Y.; Thoeng, A.; Richards, A.M.; Schmitz, U.; et al. CTCF genetic alterations in endometrial carcinoma are pro-tumorigenic. Oncogene 2017, 36, 4100–4110. [Google Scholar] [CrossRef] [PubMed] [Green Version]
  47. Wu, C.E.; Tzen, C.Y.; Wang, S.Y.; Yeh, C.N. Clinical Diagnosis of Gastrointestinal Stromal Tumor (GIST): From the Molecular Genetic Point of View. Cancers 2019, 16, 11. [Google Scholar] [CrossRef] [Green Version]
  48. Flavahan, W.A.; Drier, Y.; Johnstone, S.E.; Hemming, M.L.; Tarjan, D.R.; Hegazi, E.; Shareef, S.J.; Javed, N.M.; Raut, C.P.; Eschle, B.K.; et al. Altered chromosomal topology drives oncogenic programs in SDH-deficient GISTs. Nature 2019, 575, 229–233. [Google Scholar] [CrossRef]
  49. Ock, C.-Y.; Hwang, J.-E.; Keam, B.; Kim, S.-B.; Shim, J.-J.; Jang, H.-J.; Park, S.; Sohn, B.H.; Cha, M.; Ajani, J.A.; et al. Genomic landscape associated with potential response to anti-CTLA-4 treatment in cancers. Nat. Commun. 2017, 8, 1050. [Google Scholar] [CrossRef]
  50. Davis, L.E.; Nicholls, L.A.; Babiker, H.M.; Liau, J.; Mahadevan, D. PD-1 Inhibition Achieves a Complete Metabolic Response in a Patient with Malignant Peripheral Nerve Sheath Tumor. Cancer Immunol. Res. 2019, 7, 1396–1400. [Google Scholar] [CrossRef]
  51. McKenna, A.; Hanna, M.; Banks, E.; Sivachenko, A.; Cibulskis, K.; Kernytsky, A.; Garimella, K.; Altshuler, D.; Gabriel, S.; Daly, M.; et al. The genome analysis toolkit: A mapreduce framework for analyzing next-generation DNA sequencing data. Genome Res. 2010, 20, 1297–1303. [Google Scholar] [CrossRef] [Green Version]
  52. Cibulskis, K.; Lawrence, M.S.; Carter, S.L.; Sivachenko, A.; Jaffe, D.; Sougnez, C.; Gabriel, S.; Meyerson, M.; Lander, E.S.; Getz, G. Sensitive detection of somatic point mutations in impure and heterogeneous cancer samples. Nat. Biotechnol. 2013, 31, 213–219. [Google Scholar] [CrossRef] [PubMed]
  53. Garrison, E.; Marth, G. Haplotype-based variant detection from short-read sequencing. arXiv 2012, arXiv:1207.3907. [Google Scholar]
  54. Wang, K.; Li, M.; Hakonarson, H. ANNOVAR: Functional annotation of genetic variants from next-generation sequencing data. Nucleic Acids Res. 2010, 38, e164. [Google Scholar] [CrossRef] [PubMed]
  55. Liu, Y.; Sun, J.; Zhao, M. ONGene, a literature-based database for human oncogenes. J. Genet. Genom. 2017, 44, 119–121. [Google Scholar] [CrossRef] [PubMed]
  56. TSGene 2.0. Available online: https://bioinfo.uth.edu/TSGene/ (accessed on 20 November 2019).
  57. Tamborero, D.; Rubio-Perez, C.; Deu-Pons, J.; Schroeder, M.P.; Vivancos, A.; Rovira, A.; Tusquets, I.; Albanell, J.; Rodon, J.; Tabernero, J.; et al. Cancer Genome Interpreter annotates the biological and clinical relevance of tumor alterations. Genome Med. 2018, 10, 25. [Google Scholar] [CrossRef] [PubMed]
  58. Lawrence, M.; Huber, W.; Pagès, H.; Aboyoun, P.; Carlson, M.; Gentleman, R.; Morgan, M.T.; Carey, V.J. Software for Computing and Annotating Genomic Ranges. PLoS Comput. Biol. 2013. [Google Scholar] [CrossRef]
  59. Cavalcante, R.G.; Sartor, M.A. annotatr: Genomic regions in context. Bioinformatics 2017, 33, 2381–2383. [Google Scholar] [CrossRef]
  60. Carlson, M. org.Hs.eg.db: Genome Wide Annotation for Human. R Package Version 3.8.2. 2019. Available online: https://bioconductor.org/packages/release/data/annotation/html/org.Hs.eg.db.html (accessed on 24 May 2019).
  61. Durinck, S.; Spellman, P.T.; Birney, E.; Huber, W. Mapping identifiers for the integration of genomic datasets with the R/Bioconductor package biomaRt. Nat. Protoc. 2009, 4, 1184–1191. [Google Scholar] [CrossRef] [Green Version]
  62. Anand, L. chromoMap: Interactive Visualization and Mapping of Chromosomes. R Package Version 0.2. 2019. Available online: https://CRAN.R-project.org/package=chromoMap (accessed on 9 September 2019).
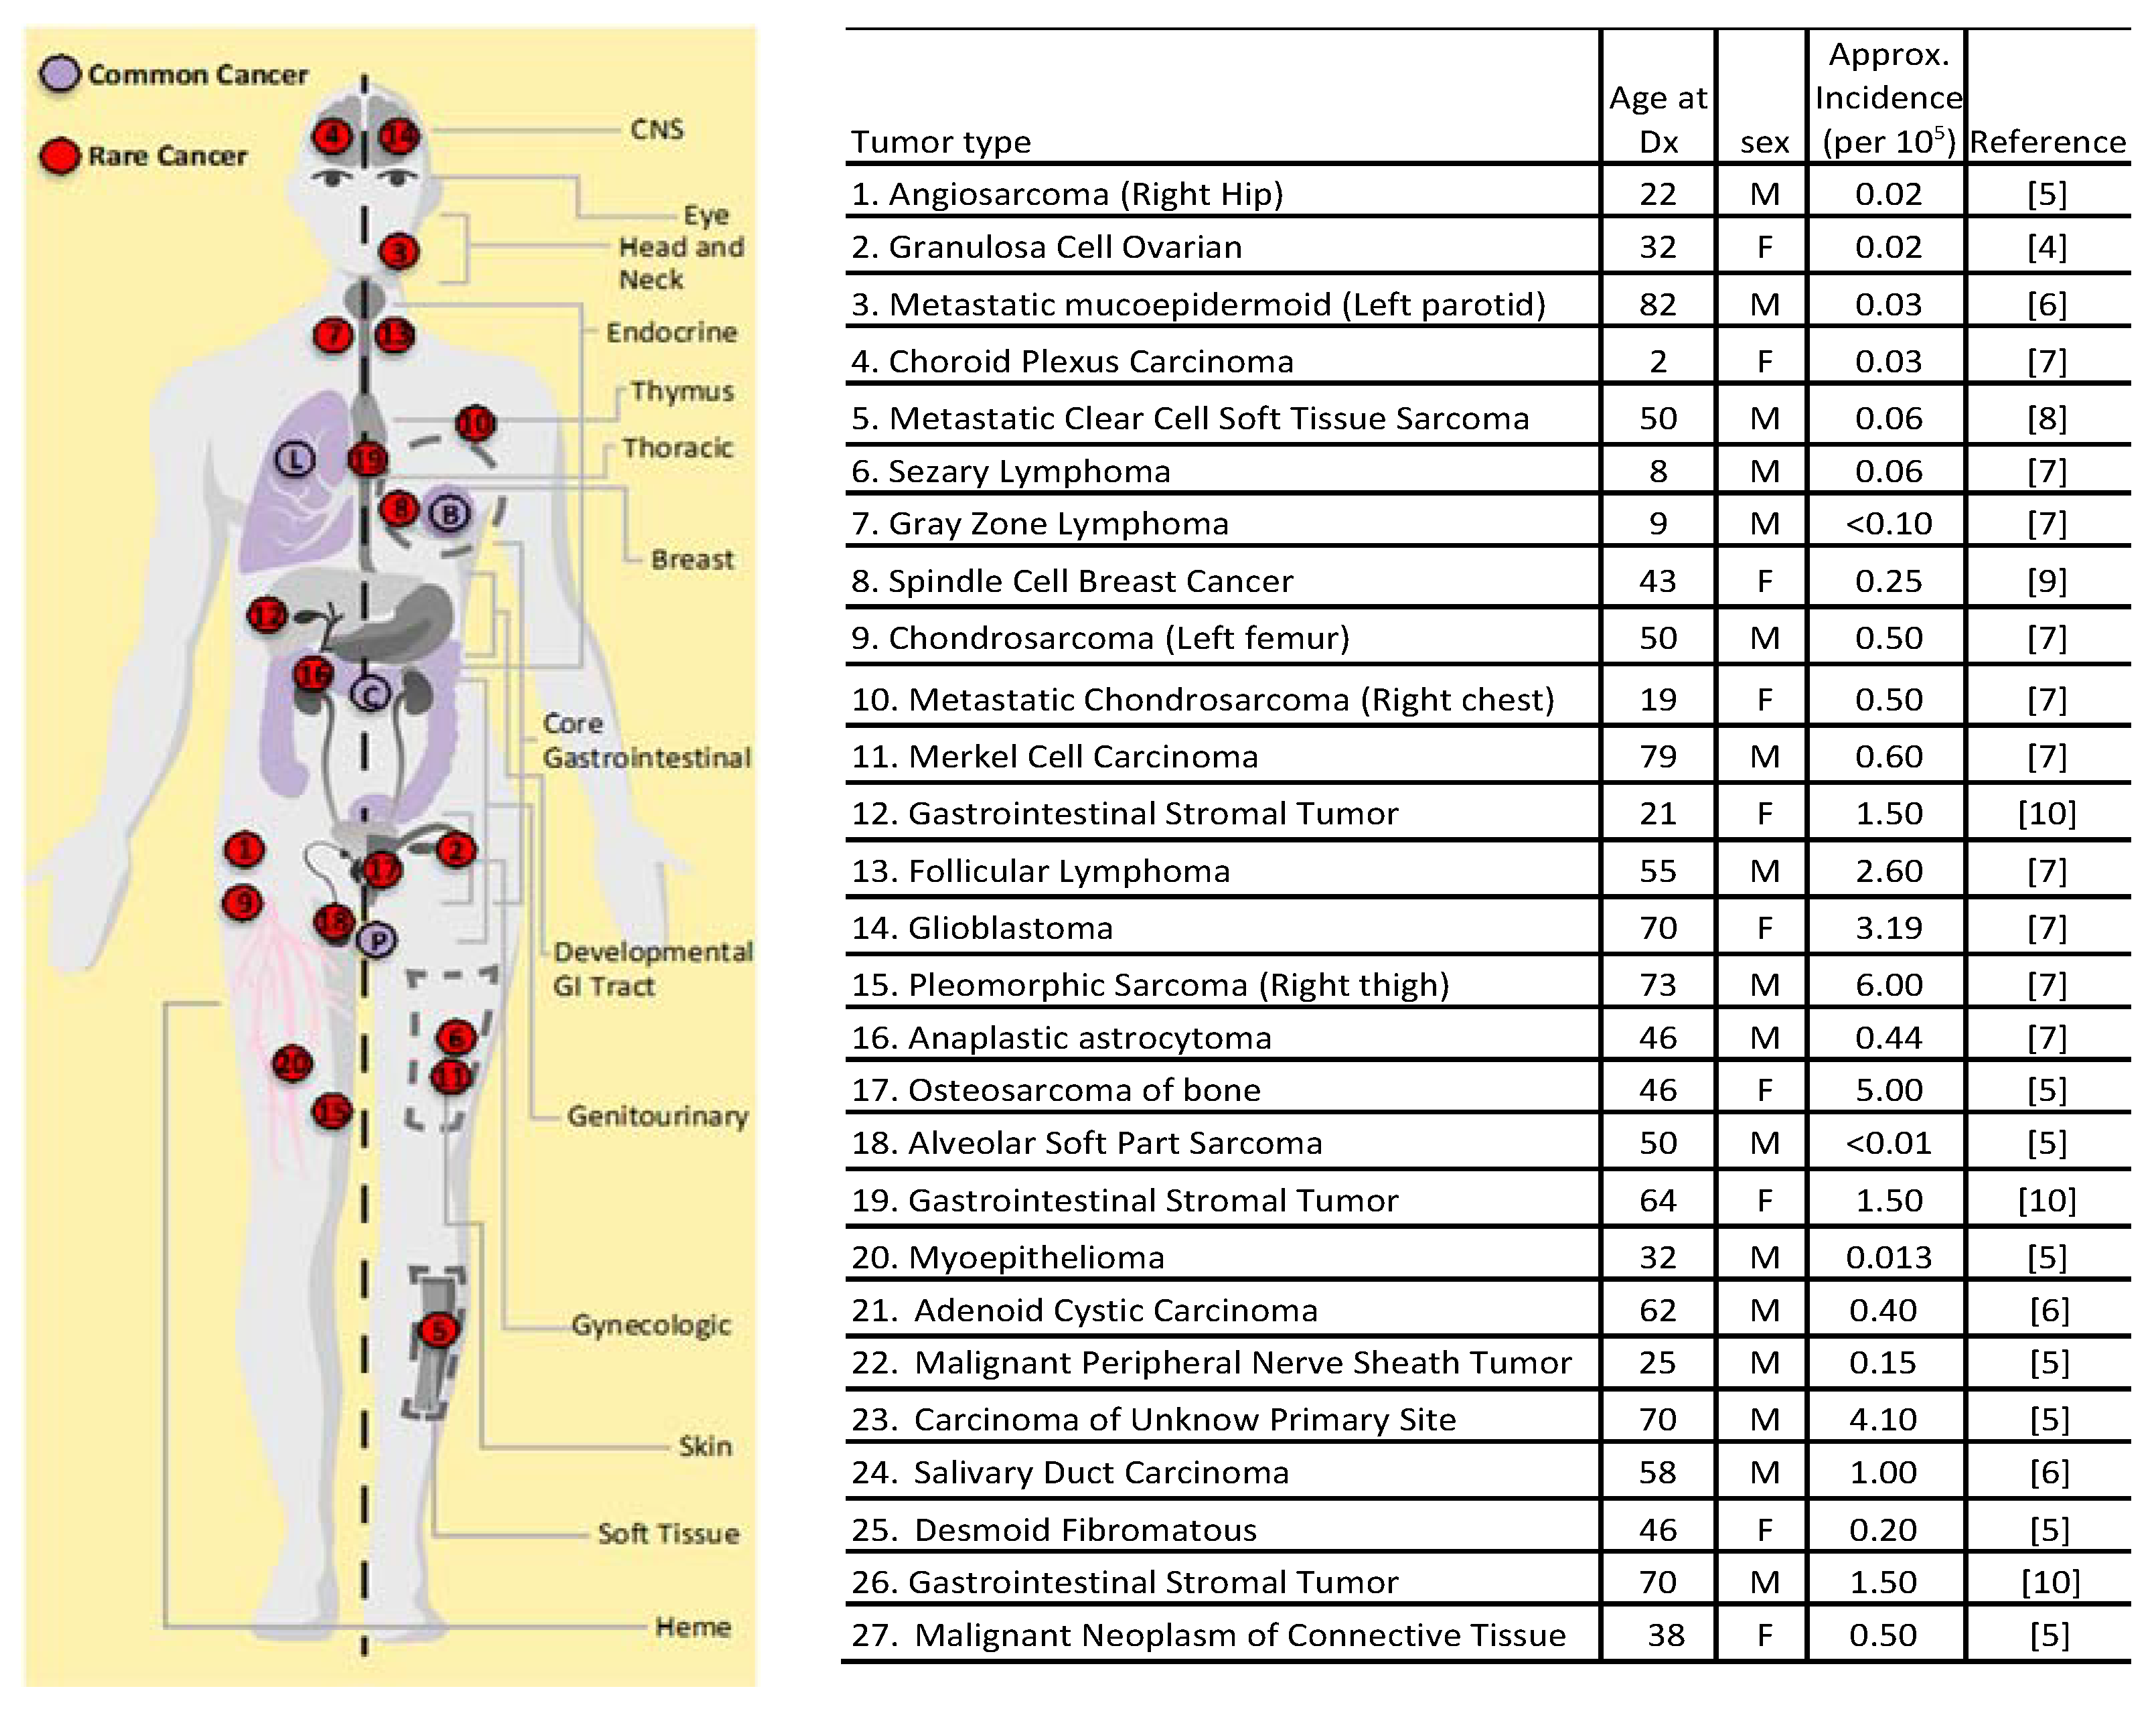
Figure 1. Approximate locations of rare tumors. Rare tumor types as numbered in Table 1 are shown in red dots with age at diagnosis, gender and incidence. Tumors of the blood or lymph are shown in one location labeled ‘heme’, while tumors of skin are shown in dashed box labeled ‘skin’ and tumors of soft tissue are shown in dashed filled box labeled ‘soft tissue’ (on left leg). Common cancer types used for comparisons are shown in lavender: Lung (L), Breast (B), Colon (C), and Prostate (P). Gray zone lymphoma (#7)—lymph node; GIST (#12)—Stomach; 13 Follicular lymphoma (#13)—lymph node; Primary mediastinal lymphoma (#19)—between the 2 lungs in the mediastinum [4,12,13,14,15,16,17].
Cancers 12 01618 g001
Figure 2. Percentage of cases with actionable variants.
Cancers 12 01618 g002
Figure 3. Variants classified as pathogenic or variant of uncertain significance (VUS) in tumor only versus tumor-germline sequence analysis in the seven cases for which both datasets were available (case # 1, 2, 3, 5, 11, 12, and 15 in Table 1). In the latter case, variants could be further classified as somatic or germline in origin. Cases of missing variants are shown at the bottom (hatched box).
Cancers 12 01618 g003
Figure 4. Copy number alteration (CNA) analysis of the 27 rare-cancer cases using GISTIC2 with input from Sequenza. (A). Heat map showing amplified (red) and deleted (blue) regions along the chromosomes. Cases are aligned on the x-axis and chromosomes on the y-axis. (B). Frequency of highly amplified oncogenes (blue) and tumor suppressor genes with putative homozygous deletions (orange) in each case.
Cancers 12 01618 g004
Figure 5. CNA from Sequenza, plotted using the chromoMap package, for the 27 rare cancer cases. (A) Heat map showing frequency of amplified regions along the chromosomes. (B) Heat map of deleted regions along the chromosomes.
Cancers 12 01618 g005
Figure 6. The percentages of both somatic and germline variants detected in the rare tumor cohort. The largest difference between somatic and germline variants is seen in the increase of germline variants in the Hippo pathway (9% somatic vs. 23% germline).
Cancers 12 01618 g006
Figure 7. Analysis limited to only variants predicted to be driver mutations, 22% of germline variants are in the WNT signaling pathway and 13% in the Hippo pathway, with no somatic driver variants detected.
Cancers 12 01618 g007
Table 1. Filtered germline and somatic driver mutations.
Germline TSG Drivers
CaseRefAltGeneExonicFunc.refGeneavsnp150gnomAD Freq.Polyphen2PhyloP
4GAMAD1L1nonsyn. SNVrs1219089820.0036Prob. Damaging5.785
7CGIGF2Rnonsyn. SNVrs81918440.0102Prob. Damaging4.24
7C-BRCA2frameshift deletionrs80359718N/AN/AN/A
13GANUP98nonsyn. SNVrs617513380.0014Prob. Damaging6.327
13TCTET2nonsyn. SNVrs1443862910.0055Prob. Damaging6.829
2CTEPHA2nonsyn. SNVrs341925490.0123Benign0.073
12TGGTGAAGAACATTCAGGCAA-BARD1inframe deletionrs289975750.024N/AN/A
5CTEPHA2nonsyn. SNVrs341925490.0123Benign0.073
5GAIGF2Rnonsyn. SNVrs81917530.0023Prob. Damaging3.63
1CTEXT2nonsyn. SNVrs1384952220.0006Prob. Damaging7.813
14GAAXIN2nonsyn. SNVrs1382878570.0012Poss. Damaging7.551
15GCLZTS1nonsyn. SNVrs1487751560.001Prob. Damaging2.853
15GAPTCH1nonsyn. SNVrs1389112750.0007Poss. Damaging7.645
11GAARID2nonsyn. SNVrs2000402220.0001Prob. Damaging9.317
10CADLC1nonsyn. SNV.N/AProb. Damaging2.753
3TGGTGAAGAACATTCAGGCAA-BARD1inframe deletionrs289975750.024N/AN/A
3CTCTNND1nonsyn. SNVrs1998130200.0003Prob. Damaging2.101
8GASTARD13nonsyn. SNVrs1448018040.0008Prob. Damaging9.889
8CTSDHAstopgainrs7817649206.37E-05N/A2.131
8-AGGFBXW7inframe insertionrs5419794580.0014N/AN/A
8CTATMnonsyn. SNVrs289049190.0014Poss. Damaging3.491
16ACNOTCH2nonsyn. SNVrs1472237700.0032Poss. Damaging8.947
16CTATMnonsyn. SNVrs560098890.0004Prob. Damaging3.766
17GACHEK2nonsyn. SNVrs730881690N/AProb. Damaging8.668
18CTEPHA2nonsyn. SNVrs341925490.0123Benign0.073
18-GCGGGTCEBPAinframe insertionrs7624593250.0416N/AN/A
20GABRCA2nonsyn. SNVrs41293503N/AProb. Damaging3.408
20CGKMT2Cnonsyn. SNVrs1381191450.0065Prob. Damaging6.729
20CTATRnonsyn. SNV.N/APoss. Damaging6.179
21TCDICER1nonsyn. SNVrs747510783N/AProb. Damaging7.502
21TCATMnonsyn. SNV.N/APoss. Damaging6.589
21AGMSH2nonsyn. SNVrs773177076N/AProb. Damaging9.147
25TCTET2nonsyn. SNVrs1443862910.0055Prob. Damaging6.829
25TCNUP98nonsyn. SNVrs2010110750.0005Prob. Damaging4.516
22AGLZTS1nonsyn. SNVrs1491406370.0031Prob. Damaging7.441
22CTLATS1nonsyn. SNVrs1485063160.0002Benign5.885
23GTPPP2R5Cnonsyn. SNVrs1479425790.0003Prob. Damaging9.014
24AGSDHBnonsyn. SNVrs771004483N/APoss. Damaging8.563
24CTEPHA2nonsyn. SNVrs1397871630.0003Prob. Damaging1.668
24CTGPC3nonsyn. SNVrs115397890.003Benign2.917
24AGSDHDnonsyn. SNVrs112140770.0048Prob. Damaging2.521
26CTSMARCA4nonsyn. SNVrs763471007N/AProb. Damaging7.813
26GATSC1nonsyn. SNVrs878853968N/AProb. Damaging8.039
27CTEPHA2nonsyn. SNVrs341925490.0123Benign0.073
27-GCGGGTCEBPAinframe insertionrs7624593250.0416N/AN/A
19TAMCCnonsyn. SNVrs173138920.0076Prob. Damaging4.64
19CTEPHA2nonsyn. SNVrs341925490.0123Benign0.073
13GATXNIPnonsyn. SNVrs781868836N/AN/A4.673
Germline Oncogene Drivers
CaseRefAltGeneExonicFunc.refGeneavsnp150gnomAD Freq.Polyphen2PhyloP
13GANUP98nonsyn. SNVrs617513380.0014Prob. Damaging6.327
13CTCSF1Rnonsyn. SNVrs1384325360.003Poss. Damaging3.03
2CTEPHA2nonsyn. SNVrs341925490.0123Benign0.073
12TGGTGAAGAACATTCAGGCAA-BARD1inframe deletionrs289975750.024N/AN/A
5CTEPHA2nonsyn. SNVrs341925490.0123Benign0.073
1GCMUC4nonsyn. SNVrs3693264020.0001Poss. Damaging−1.2
14CTMETnonsyn. SNVrs345894760.0025Benign3.567
15GAPTCH1nonsyn. SNVrs1389112750.0007Poss. Damaging7.645
9GANSD2nonsyn. SNVrs758343111N/APoss. Damaging3.202
10T-CHD1Lstopgainrs781989601N/AN/AN/A
3TGGTGAAGAACATTCAGGCAA-BARD1inframe deletionrs289975750.024N/AN/A
3GGAGCTCCATCC-TRIOinframe deletionrs1403088520.0076N/AN/A
18TGPDGFRAnonsyn. SNVrs1486543870.0004Poss. Damaging6.111
18CTEPHA2nonsyn. SNVrs341925490.0123Benign0.073
18CTMYCnonsyn. SNVrs2004314780.0002Prob. Damaging4.735
25GCMUC4nonsyn. SNVrs3693264020.0001Poss. Damaging−1.2
25TCNUP98nonsyn. SNVrs2010110750.0005Prob. Damaging4.516
24GAFIP1L1nonsyn. SNVrs777738679N/AProb. Damaging7.569
24CTEPHA2nonsyn. SNVrs1397871630.0003Prob. Damaging1.668
26GCMUC4nonsyn. SNVrs3693264020.0001Poss. Damaging−1.2
27CTEPHA2nonsyn. SNVrs341925490.0123Benign0.073
19TAMCCnonsyn. SNVrs173138920.0076Prob. Damaging4.64
19GCMUC4nonsyn. SNVrs3693264020.0001Poss. Damaging-1.2
19CTEPHA2nonsyn. SNVrs341925490.0123Benign0.073
Somatic TSG Drivers
CaseRefAltGeneExonicFunc.refGeneavsnp150gnomAD Freq.Polyphen2PhyloP
4GATP53nonsyn. SNVrs876659802N/AProb. damaging10.003
13C-ARID1Aframeshift deletion.N/AN/AN/A
13GACREBBPstopgain.N/AN/A6.795
2GCFOXL2nonsyn. SNVrs1057519865N/AProb. damaging2.22
12CTKMT2Cnonsyn. SNVrs1458337959.55E-05Prob. damaging4.525
1A-RB1frameshift deletion.N/AN/AN/A
14GATP53nonsyn. SNVrs587780070N/AProb. damaging10.003
14ATTP53nonsyn. SNVrs1057519982N/AProb. damaging9.325
15GACDKN2Astopgainrs121913388N/ABenign1.26
15GCIDH1nonsyn. SNV rs121913499N/APoss. damaging7.103
9GAIDH1nonsyn. SNVrs121913499N/ABenign7.103
10CATP53stopgainrs201744589N/AN/A−0.746
19-TSETD2frameshift insertion.N/AN/AN/A
19AAG-CTCFinframe deletion.N/AN/AN/A
7TCATCTCA-TNFAIP3frameshift deletion.N/AN/AN/A
Somatic Oncogene Drivers
CaseRefAltGeneExonicFunc.refGeneavsnp150gnomAD Freq.Polyphen2PhyloP
7GGAG-CHD1Lframeshift deletionrs782573713N/AN/AN/A
2GCMUC4nonsyn. SNVrs3693264020.0001Poss. damaging−1.2
15GCIDH1nonsyn. SNVrs121913499N/APoss. damaging7.103
9GAIDH1nonsyn. SNVrs121913499N/ABenign7.103
3GTHRASnonsyn. SNVrs28933406N/ABenign9.821
3GAPIK3CAnonsyn. SNVrs121913273N/AProb. damaging9.602
16CTEGFRnonsyn. SNVrs149840192N/AProb. damaging7.882
20GAPIK3CAnonsyn. SNVrs121913273N/AProb. damaging9.602
19AGTGGA-KITinframe deletionrs869025568N/AN/AN/A
Table 2. ACMG classified pathogenic/likely pathogenic variants detected.
Case IDCancer TypeGeneMutation TypeCoding ChangeProtein ChangegnomAD
Freq
Polyphen2PhyloPACMG Classification
7Gray Zone LymphomaBRCA2FrameshiftNM_000059.3:
c.8575delC
NP_000050.2:
p.Gln2859Lysfs
N/AN/AN/APathogenic
8Breast Cancer, Spindle CellSDHANonsenseNM_004168.3:
c.223C>T
NP_004159.2:
p.Arg75Ter
6.47E-05N/A2.131Pathogenic
12GISTSDHCFrameshiftNM_003001.3:
c.6delT
NP_002992.1:
p.Ala3Argfs
N/AN/AN/APathogenic
14GlioblastomaRUNX1MissenseNM_001754.4:
c.451A>T
NP_001745.2:
p.Met151Leu
N/AN/AN/ALikely Pathogenic
16Glioma (Anaplastic Astrocytoma)FANCCSplice Region
(Exon Skipping)
NM_000136.2:
c.456+4A>T
N/A0.0001N/AN/APathogenic
18Aveolar Soft Part SarcomaMUTYHMissenseNM_001128425.1:
c.1187G>A
NP_001121897.1:
p.Gly396Asp
0.0032Prob.
damaging
4.511Pathogenic
Table 3. Inherited pathogenic variants in common and rare cancers.
Cancer Case SetTotal CasesPathogenic/Likely Pathogenic Germline VariantNo Pathogenic Germline Variant
Rare Cancer (UAGC)276 (22.2%)21 (77.8%)
Common Cancer (Total)3451274 (7.9%)3177 (92.1%)
Fisher Exact Test p-value, UAGC vs. Total Common: 0.01800
Common CancersTotal CasesPathogenic/Likely Pathogenic Germline VariantNo Pathogenic Germline Variant
CRC [21]14127114
Breast [21]851669
Prostate [21]26323
NSCLC [21]33429
SCLC [21]11011
COAD (colon) [14]41925394
READ (rectal) [14]1456139
BRCA (breast) [14]1076106970
PRAD (prostate) [14]49827471
LUAD (lung adeno) [14]51833485
LUSC (lung squamous) [14]49927472
Common - Total34512743177
Table 4. Pathogenic/Likely Pathogenic Germline Variants detected across studies.
Rare CancersTotal CasesPathogenic/Likely Pathogenic Germline VariantNo Pathogenic Germline Variant
UAGC Rare Cancer276 (22.2%)21 (77.8%)
Huang et al. [14] Rare Cancer1955163 (8.3%)1792 (91.7%)
Bertelsen et al. [21] Rare Cancer12222 (18.0%)100 (82.0%)
[14] + [21] Rare Cancer2077185 (8.9%)1892 (91.1%)
Fisher Exact Test p-value, UAGC vs. [14] + [21]: 0.03035
Huang et al. [14] Rare Cancers:Total CasesPathogenic/Likely Pathogenic Germline VariantNo Pathogenic Germline Variant
Adrenocortical Carcinoma92488
Cholangiocarcinoma45144
Glioblastoma Multiforme39323370
Brain Lower Grade Glioma51531484
Mesothelioma82775
Pheochromocytoma and Paraganglioma17941138
Sarcoma25532223
Thymoma1236117
Uterine Carcinosarcoma57255
Uveal Melanoma80476
Testicular Germ Cell Tumors13412122
Sum19551631792
Bertelsen et al. [21] Rare Cancers:Total CasesPathogenic/Likely Pathogenic Germline VariantNo Pathogenic Germline Variant
Bile Duct Cancer47839
Sarcoma14311
Neuroendocrine Cancer13112
Malignant Mesothelioma1275
Adrenocortical Cancer808
Thymoma817
Adenoid Cystic Carcinoma514
Myoepithelial Carcinoma404
Glioblastoma404
Anogenital Cancer303
Vulvovaginal Cancer211
Germ Cell Cancer202
Sum12222100