DSCAM-AS1-Driven Proliferation of Breast Cancer Cells Involves Regulation of Alternative Exon Splicing and 3′-End Usage

 , ,
, ,  , , ,
, , , 
 and
and 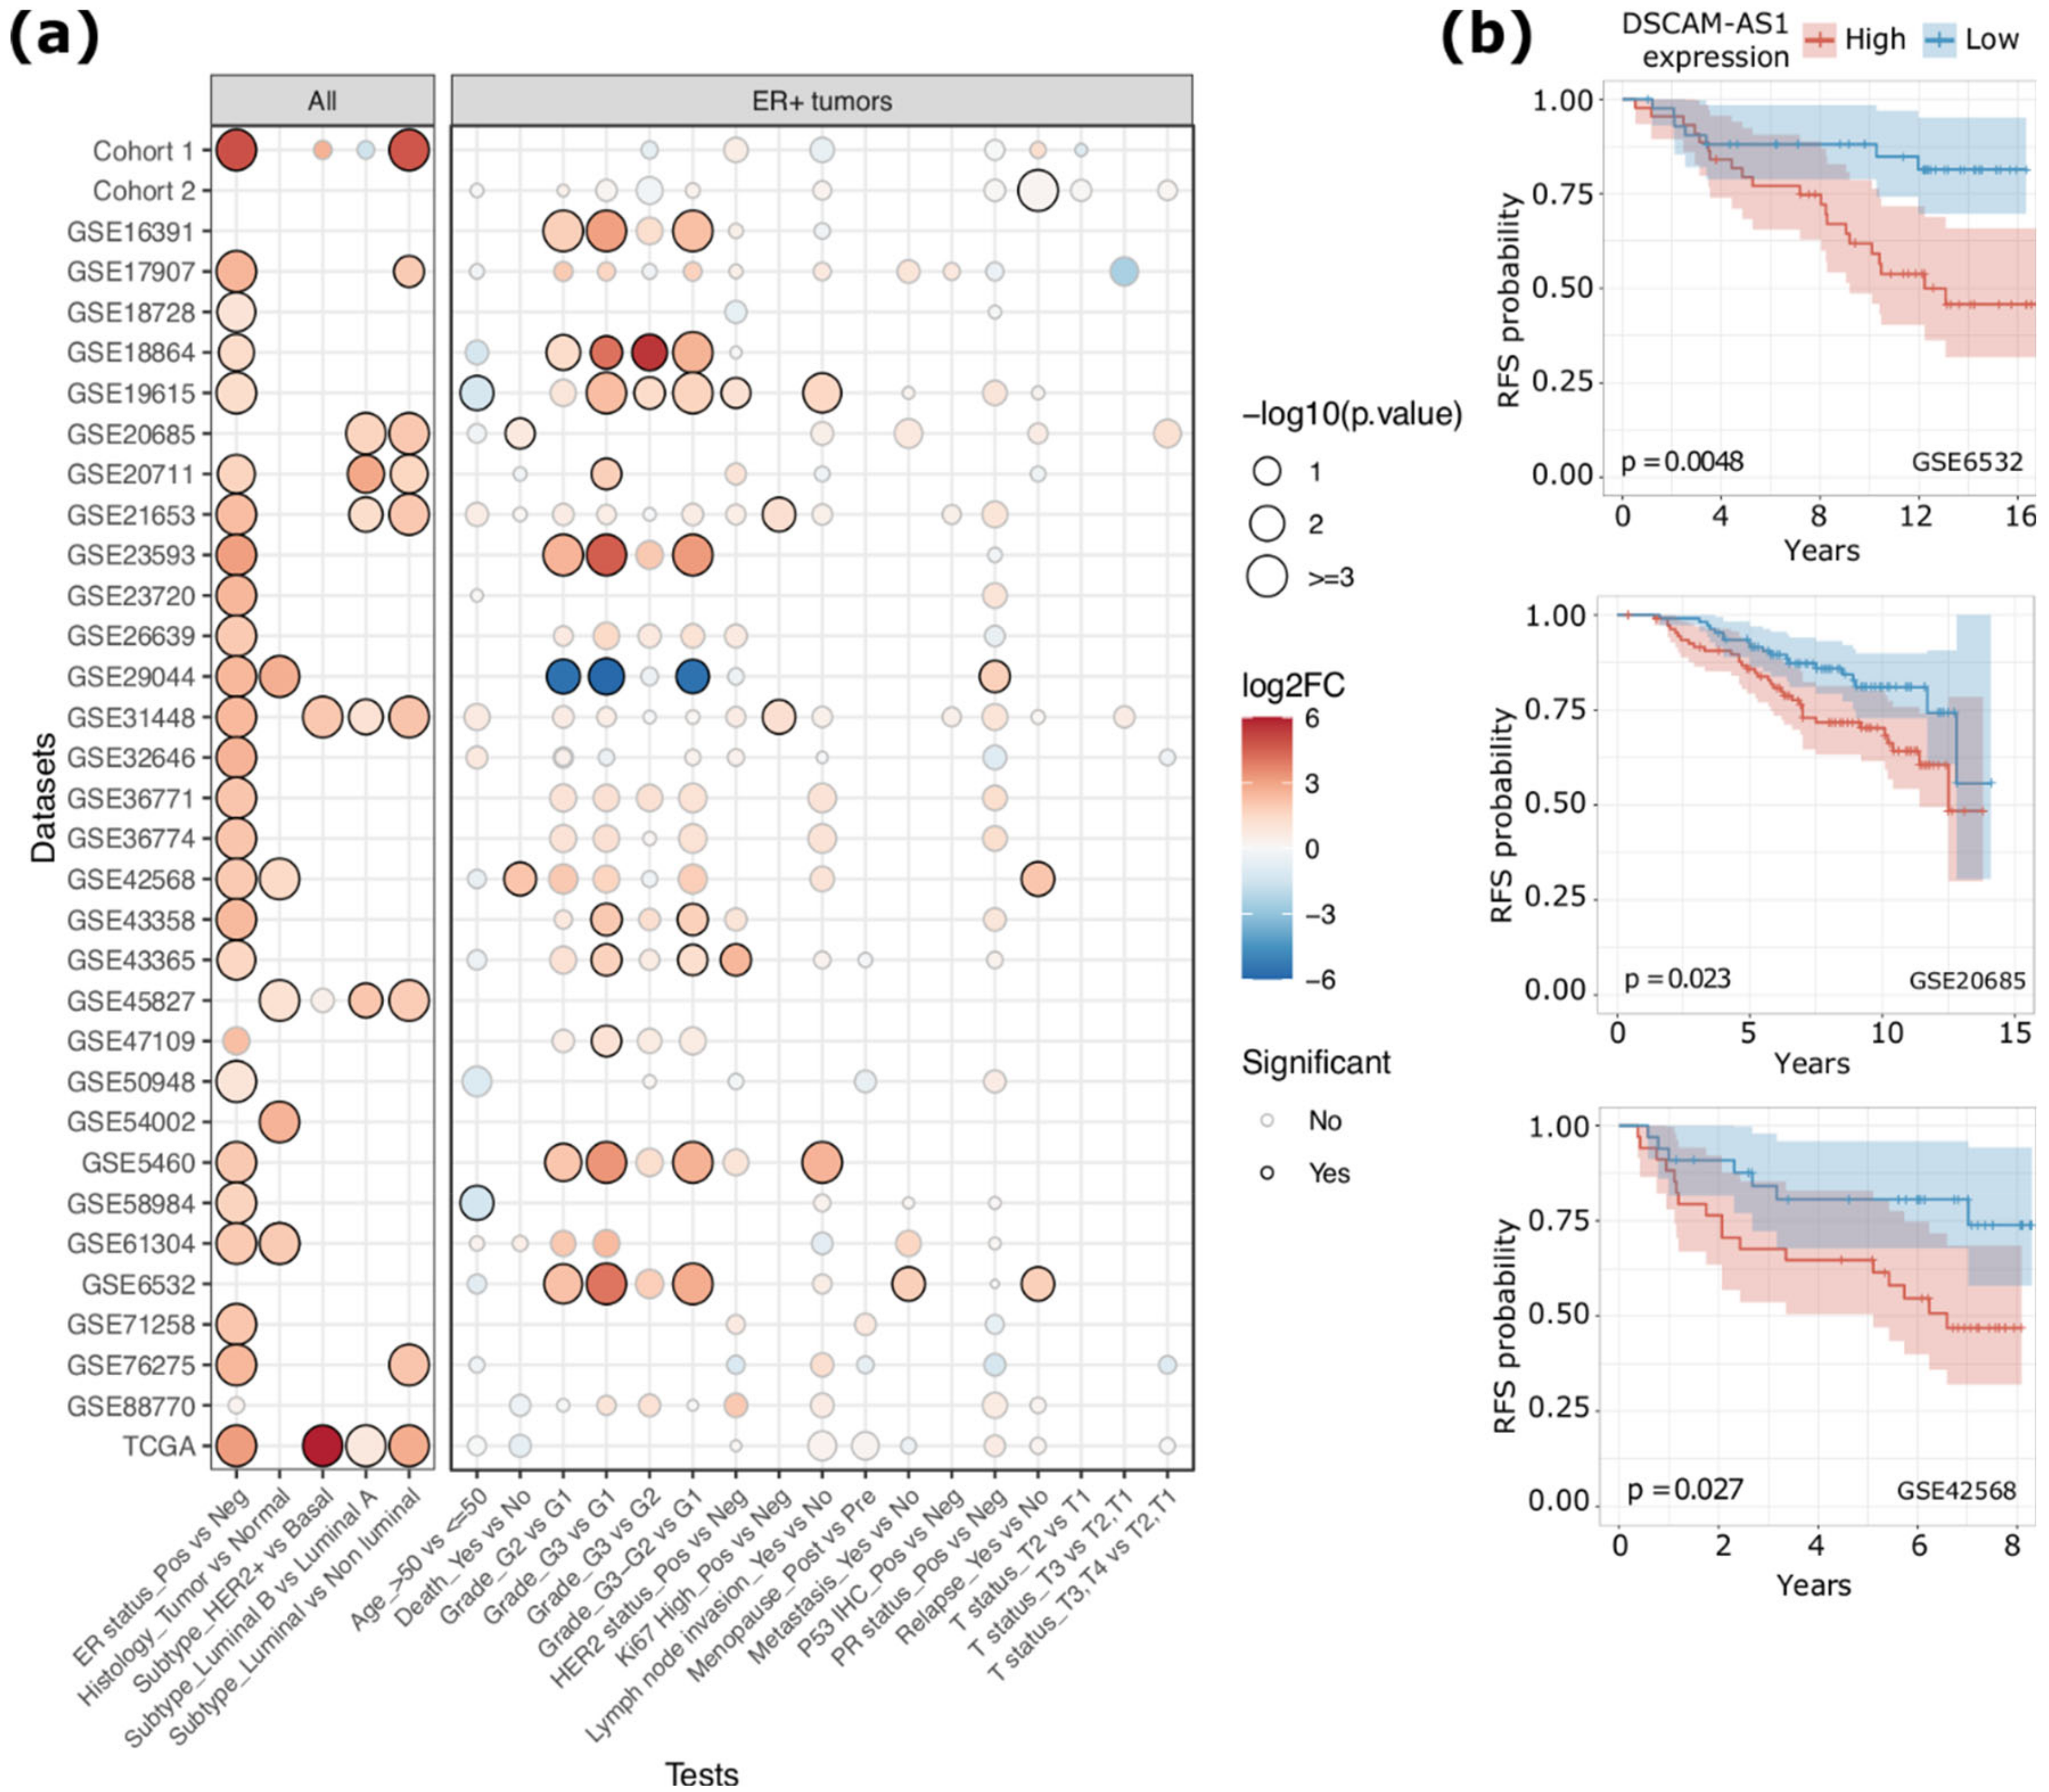
Abstract
1. Introduction
2. Results
2.1. DSCAM-AS1 is Overexpressed in More Aggressive ERα-Positive BCs
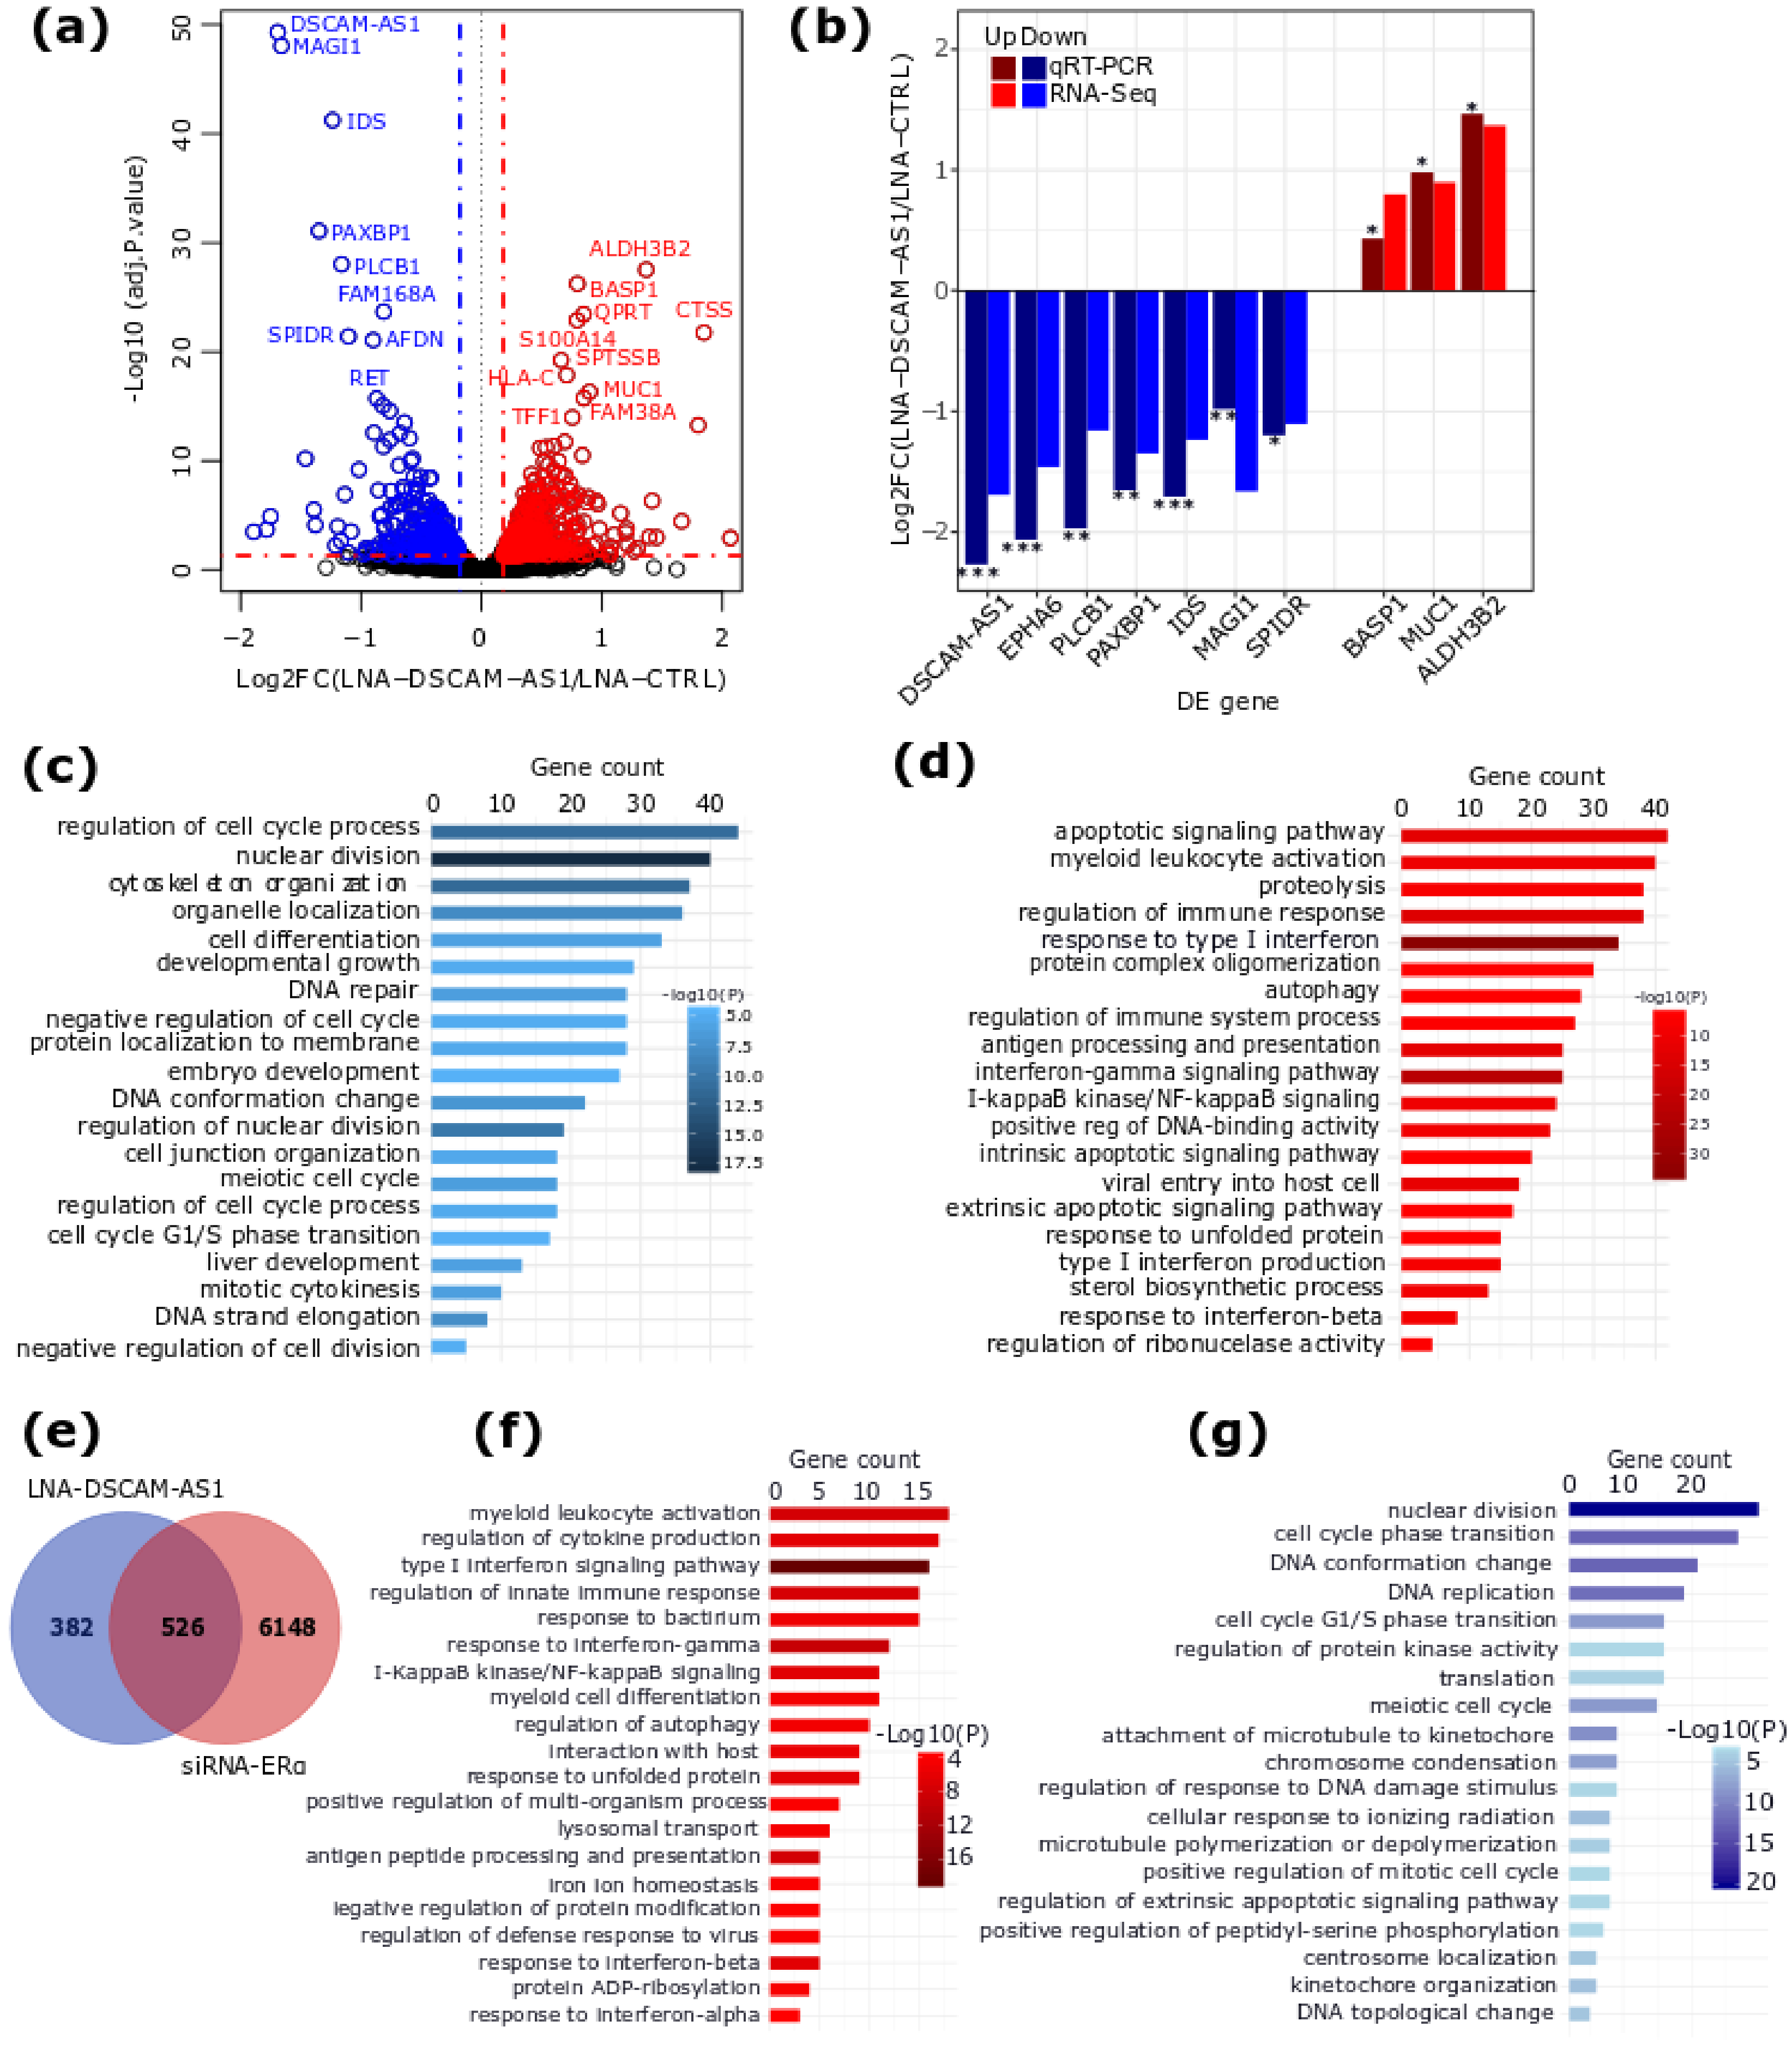
2.2. DSCAM-AS1 Knockdown Induces a Downregulation of Cell Cycle-Related Genes in BC Cells
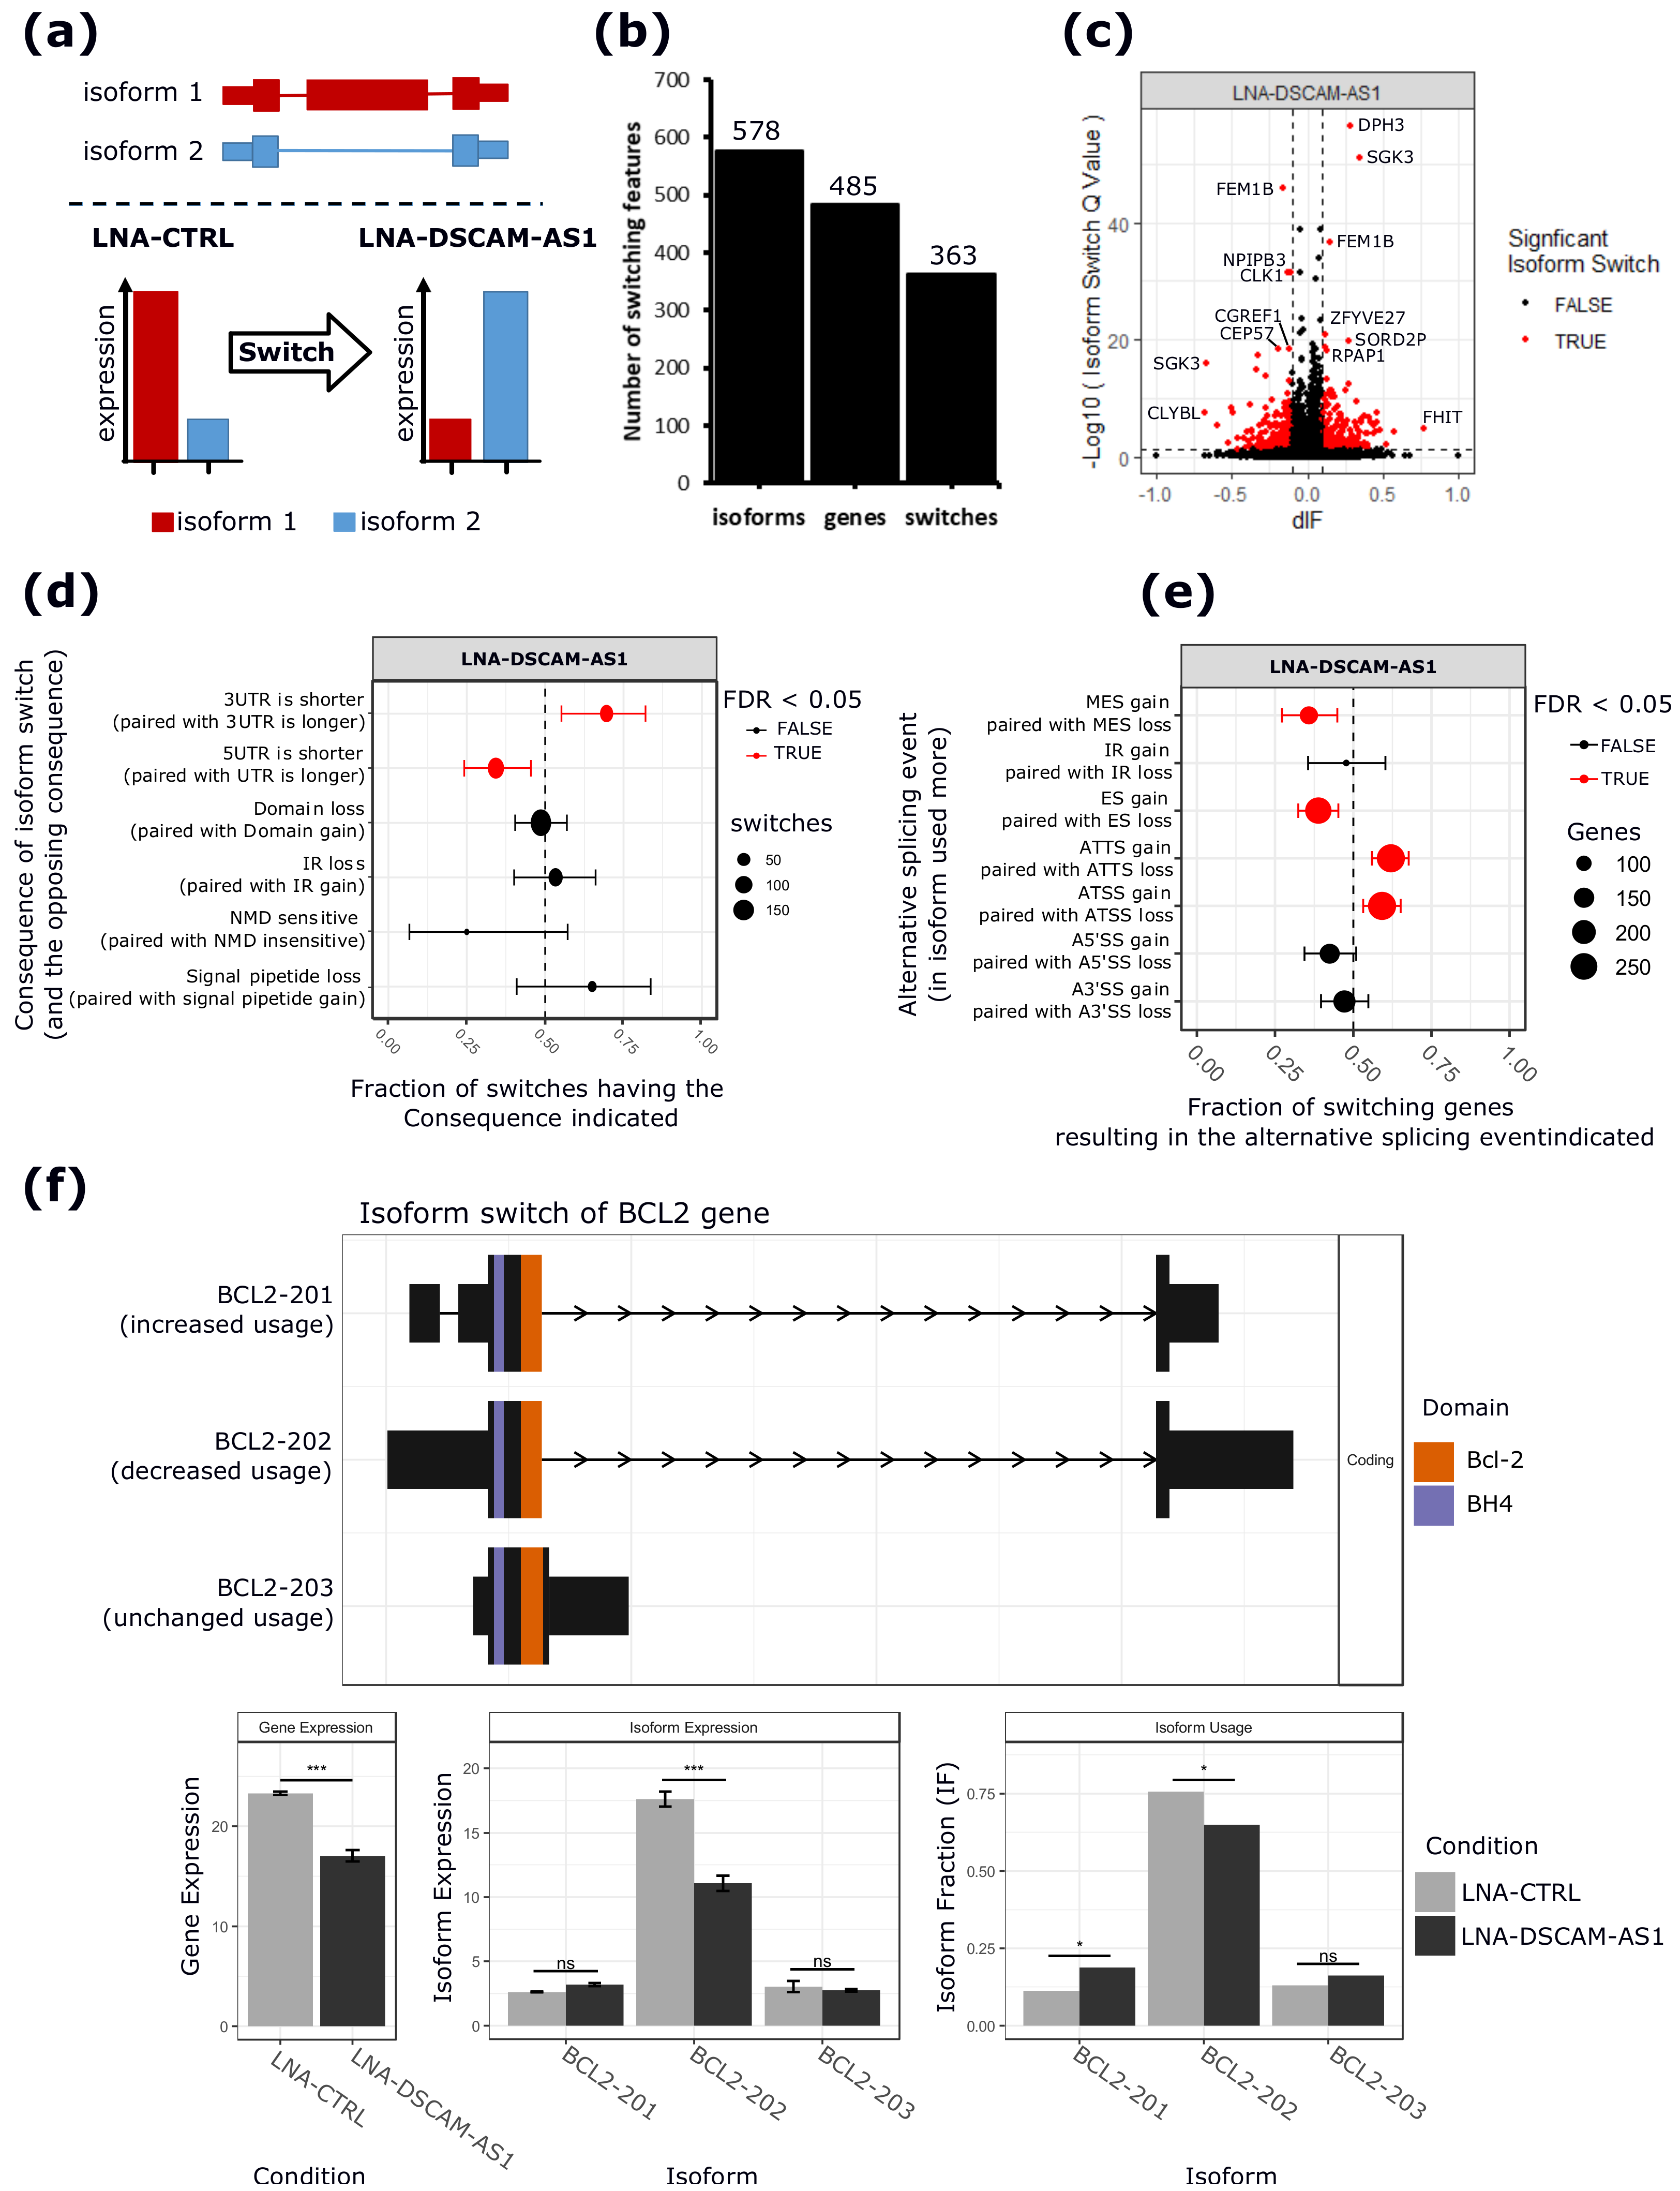
2.3. DSCAM-AS1 Physically Interacts with hnRNPL to Regulate AS in MCF-7 Cells
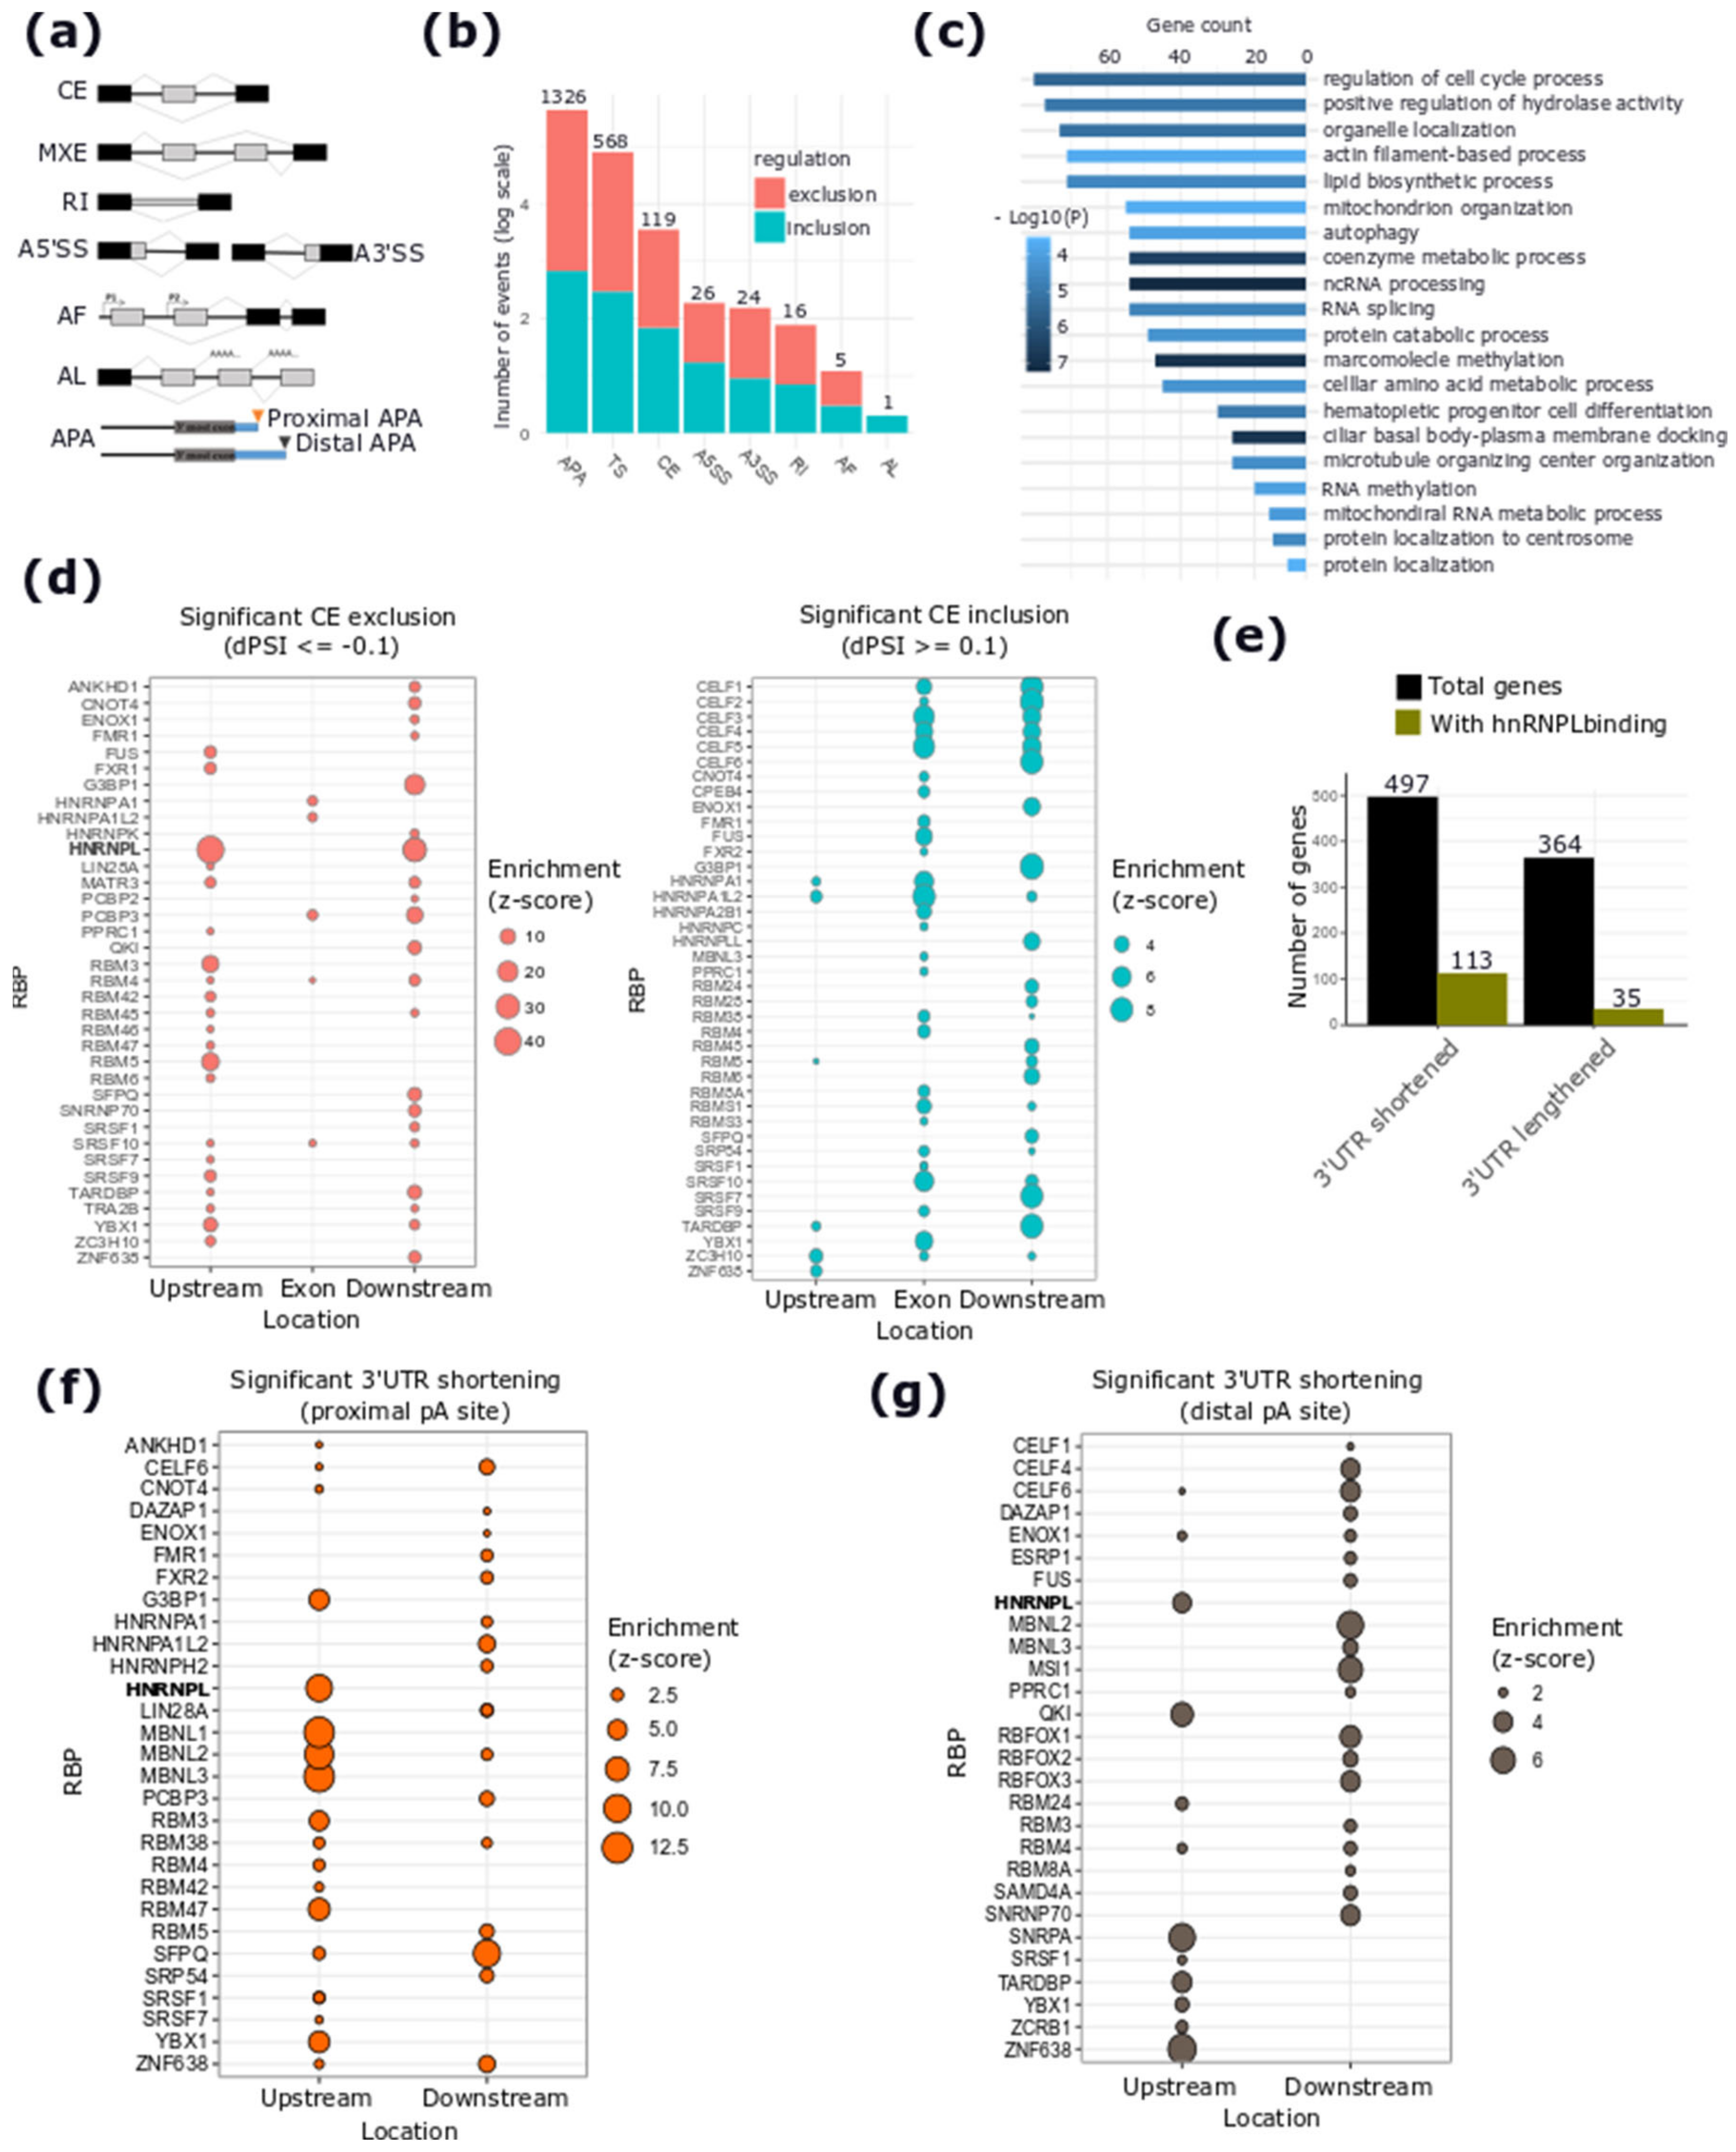
2.4. hnRNPL-Binding Motif is Enriched Around Sites of AS Events Regulated by DSCAM-AS1 Silencing
3. Discussion
4. Materials and Methods
4.1. Experimental Part
4.1.1. Cell Culture and LNA GapmeR™ Transfection
4.1.2. RNA Isolation and Quantitative Real Time PCR (qRT-PCR) Analysis
4.1.3. Quantification of DSCAM-AS1 Expression in Primary Tumor Tissue Samples
4.1.4. Cross-Linking and Immunoprecipitation (CLIP) of hnRNPL
4.1.5. Cell Proliferation Assay by Crystal-Violet Staining
4.1.6. Western Blot
4.2. Analysis of DSCAM-AS1 Expression with Respect to Different Clinical Data
4.3. RNA Sequencing Libraries Preparation and Data Analysis
4.4. Differential Expression Analysis
4.5. Gene Ontology Enrichment Analysis
4.6. Isoform Switching Analysis
4.7. Differential Alternative Splicing Analysis
4.8. RBP-Binding Motif Enrichment Analysis
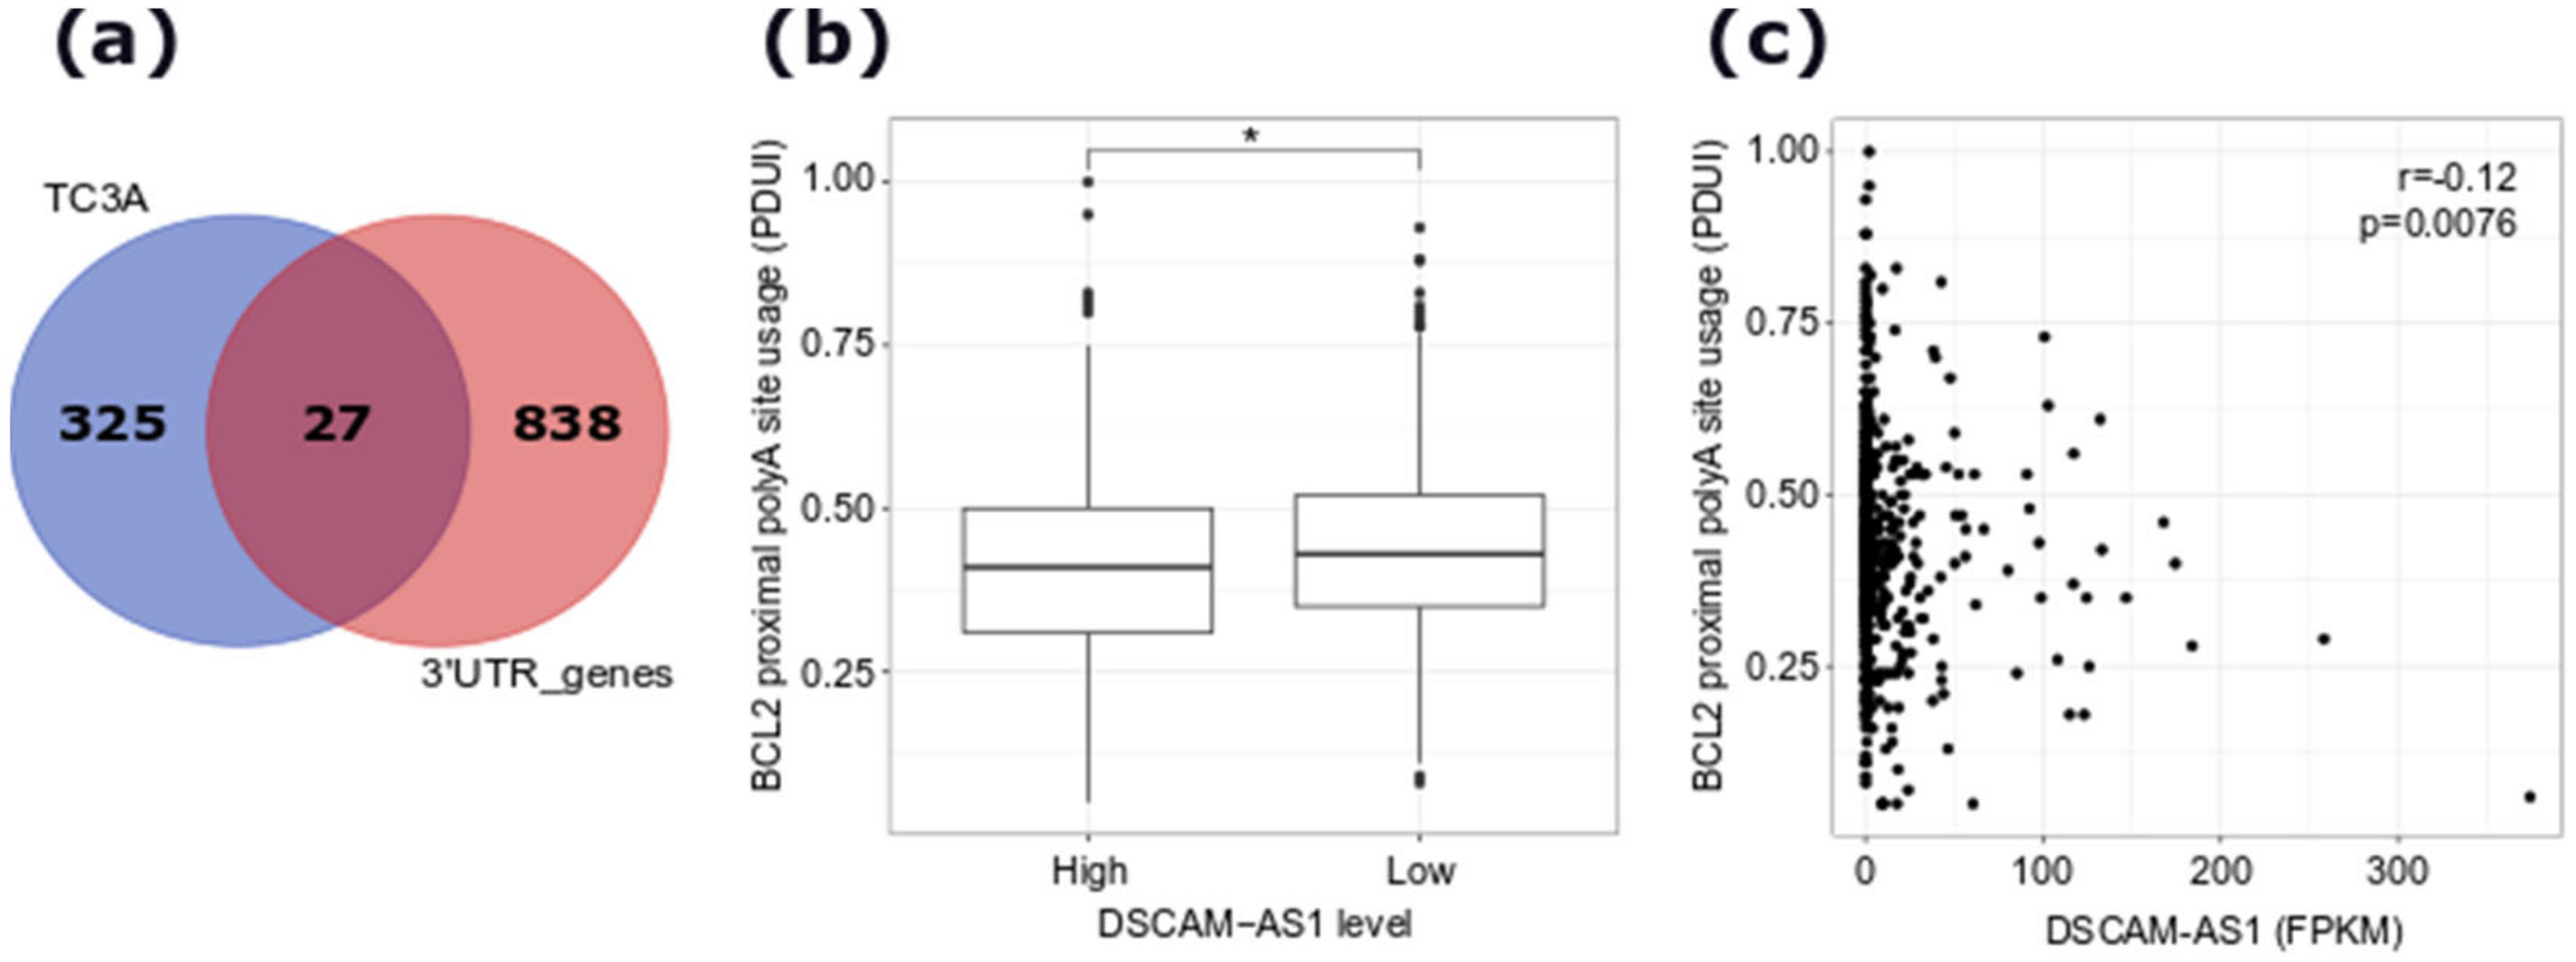
4.9. Analysis of Alternative 3′UTR Usage in TCGA Data
4.10. Overlap with Public hnRNPL RNA-Binding Experiments
5. Conclusions
Supplementary Materials
Author Contributions
Funding
Acknowledgments
Conflicts of Interest
References
- Slack, F.J.; Chinnaiyan, A.M. The role of non-coding RNAs in oncology. Cell 2019, 179, 1033–1055. [Google Scholar] [CrossRef] [PubMed]
- Carlevaro-Fita, J.; PCAWG Drivers and Functional Interpretation Group; Lanzós, A.; Feuerbach, L.; Hong, C.; Mas-Ponte, D.; Pedersen, J.S.; Johnson, R.; PCAWG Consortium. Cancer LncRNA census reveals evidence for deep functional conservation of long noncoding RNAs in tumorigenesis. Commun. Biol. 2020, 3, 56. [Google Scholar] [CrossRef] [PubMed]
- Sahu, A.; Singhal, U.; Chinnaiyan, A.M. Long noncoding RNAs in cancer: From function to translation. Trends Cancer 2015, 1, 93–109. [Google Scholar] [CrossRef] [PubMed]
- Van Grembergen, O.; Bizet, M.; De Bony, E.J.; Calonne, E.; Putmans, P.; Brohée, S.; Olsen, C.; Guo, M.; Bontempi, G.; Sotiriou, C.; et al. Portraying breast cancers with long noncoding RNAs. Sci. Adv. 2016, 2, e1600220. [Google Scholar] [CrossRef]
- Siegel, R.L.; Miller, K.D.; Jemal, A. Cancer statistics, 2020. CA Cancer J. Clin. 2020, 70, 7–30. [Google Scholar] [CrossRef] [PubMed]
- Rani, A.; Stebbing, J.; Giamas, G.; Murphy, J. Endocrine resistance in hormone receptor positive breast cancer-from mechanism to therapy. Front. Endocrinol. 2019, 10, 245. [Google Scholar] [CrossRef]
- Mathias, C.; Zambalde, E.P.; Rask, P.; Gradia, D.F.; De Oliveira, J.C. Long non-coding RNAs differential expression in breast cancer subtypes: What do we know? Clin. Genet. 2019, 95, 558–568. [Google Scholar] [CrossRef]
- Liu, D.; Rudland, P.S.; Sibson, D.R.; Barraclough, R. Identification of mRNAs differentially-expressed between benign and malignant breast tumour cells. Br. J. Cancer 2002, 87, 423–431. [Google Scholar] [CrossRef][Green Version]
- Miano, V.; Ferrero, G.; Reineri, S.; Caizzi, L.; Annaratone, L.; Ricci, L.; Cutrupi, S.; Castellano, I.; Cordero, F.; De Bortoli, M.; et al. Luminal long non-coding RNAs regulated by estrogen receptor alpha in a ligand-independent manner show functional roles in breast cancer. Oncotarget 2015, 7, 3201–3216. [Google Scholar] [CrossRef]
- Niknafs, Y.S.; Han, S.; Ma, T.; Speers, C.; Zhang, C.; Wilder-Romans, K.; Iyer, M.K.; Pitchiaya, S.; Malik, R.; Hosono, Y.; et al. The lncRNA landscape of breast cancer reveals a role for DSCAM-AS1 in breast cancer progression. Nat. Commun. 2016, 7, 12791. [Google Scholar] [CrossRef]
- Sun, W.; Li, A.-Q.; Zhou, P.; Jiang, Y.-Z.; Jin, X.; Liu, Y.-R.; Guo, Y.-J.; Yang, W.-T.; Shao, Z.-M.; Xu, X.-E.; et al. DSCAM-AS1 regulates the G/S cell cycle transition and is an independent prognostic factor of poor survival in luminal breast cancer patients treated with endocrine therapy. Cancer Med. 2018, 7, 6137–6146. [Google Scholar] [CrossRef] [PubMed]
- Vu, T.N.; Pramana, S.; Calza, S.; Suo, C.; Lee, D.; Pawitan, Y. Comprehensive landscape of subtype-specific coding and non-coding RNA transcripts in breast cancer. Oncotarget 2016, 7, 68851–68863. [Google Scholar] [CrossRef] [PubMed]
- Miano, V.; Ferrero, G.; Rosti, V.; Manitta, E.; Elhasnaoui, J.; Basile, G.; De Bortoli, M. Luminal lncRNAs regulation by ERα-controlled enhancers in a ligand-independent manner in breast cancer cells. Int. J. Mol. Sci. 2018, 19, 593. [Google Scholar] [CrossRef]
- Rossbach, O.; Hung, L.-H.; Khrameeva, E.E.; Schreiner, S.; König, J.; Curk, T.; Zupan, B.; Ule, J.; Gelfand, M.; Bindereif, A.; et al. Crosslinking-immunoprecipitation (iCLIP) analysis reveals global regulatory roles of hnRNP L. RNA Biol. 2014, 11, 146–155. [Google Scholar] [CrossRef] [PubMed]
- Fei, T.; Chen, Y.; Xiao, T.; Li, W.; Cato, L.; Zhang, P.; Cotter, M.B.; Bowden, M.; Lis, R.T.; Zhao, S.G.; et al. Genome-wide CRISPR screen identifies HNRNPL as a prostate cancer dependency regulating RNA splicing. Proc. Natl. Acad. Sci. USA 2017, 114, E5207–E5215. [Google Scholar] [CrossRef] [PubMed]
- Kishor, A.; Ge, Z.; Hogg, J.R. HnRNP L-dependent protection of normal mRNAs from NMD subverts quality control in B cell lymphoma. EMBO J. 2019, 38, 38. [Google Scholar] [CrossRef]
- Jia, R.; Zhang, S.; Liu, M.; Zhang, Y.; Liu, Y.; Fan, M.; Guo, J. HnRNP L is important for the expression of oncogene SRSF3 and oncogenic potential of oral squamous cell carcinoma cells. Sci. Rep. 2016, 6, 35976. [Google Scholar] [CrossRef]
- Gaudreau, M.-C.; Grapton, D.; Helness, A.; Vadnais, C.; Fraszczak, J.; Shooshtarizadeh, P.; Wilhelm, B.; Robert, F.; Heyd, F.; Möröy, T.; et al. Heterogeneous Nuclear Ribonucleoprotein L is required for the survival and functional integrity of murine hematopoietic stem cells. Sci. Rep. 2016, 6, 27379. [Google Scholar] [CrossRef]
- Barash, Y.; Calarco, J.A.; Gao, W.; Pan, Q.; Wang, X.; Shai, O.; Blencowe, B.J.; Frey, B.J. Deciphering the splicing code. Nature 2010, 465, 53–59. [Google Scholar] [CrossRef]
- Reyes, A.; Huber, W. Alternative start and termination sites of transcription drive most transcript isoform differences across human tissues. Nucleic Acids Res. 2017, 46, 582–592. [Google Scholar] [CrossRef]
- Eswaran, J.; Horvath, A.; Godbole, S.; Reddy, S.D.; Mudvari, P.; Ohshiro, K.; Cyanam, D.; Nair, S.; Fuqua, S.A.W.; Polyak, K.; et al. RNA sequencing of cancer reveals novel splicing alterations. Sci. Rep. 2013, 3, 3. [Google Scholar] [CrossRef] [PubMed]
- Matlin, A.J.; Clark, F.; Smith, C.W. Understanding alternative splicing: Towards a cellular code. Nat. Rev. Mol. Cell Biol. 2005, 6, 386–398. [Google Scholar] [CrossRef] [PubMed]
- Wiesner, T.; Lee, W.; Obenauf, A.C.; Ran, L.; Murali, R.; Zhang, Q.F.; Wong, E.W.P.; Hu, W.; Scott, S.N.; Shah, R.; et al. Alternative transcription initiation leads to expression of a novel ALK isoform in cancer. Nature 2015, 526, 453–457. [Google Scholar] [CrossRef] [PubMed]
- Davuluri, R.V.; Suzuki, Y.; Sugano, S.; Plass, C.; Huang, T.H.-M. The functional consequences of alternative promoter use in mammalian genomes. Trends Genet. 2008, 24, 167–177. [Google Scholar] [CrossRef]
- Rajan, P.; Elliott, D.; Robson, C.N.; Leung, H.Y. Alternative splicing and biological heterogeneity in prostate cancer. Nat. Rev. Urol. 2009, 6, 454–460. [Google Scholar] [CrossRef]
- Sveen, A.; Kilpinen, S.; Ruusulehto, A.; A Lothe, R.; I Skotheim, R. Aberrant RNA splicing in cancer; expression changes and driver mutations of splicing factor genes. Oncogene 2015, 35, 2413–2427. [Google Scholar] [CrossRef]
- Vitting-Seerup, K.; Sandelin, A. IsoformSwitchAnalyzeR: Analysis of changes in genome-wide patterns of alternative splicing and its functional consequences. Bioinformatics 2019, 35, 4469–4471. [Google Scholar] [CrossRef]
- Sterne-Weiler, T.; Weatheritt, R.; Best, A.; Ha, K.C.H.; Blencowe, B.J. Whippet: An efficient method for the detection and quantification of alternative splicing reveals extensive transcriptomic complexity. bioRxiv 2017, 158519. [Google Scholar] [CrossRef]
- Hui, J.; Hung, L.-H.; Heiner, M.; Schreiner, S.; Neumüller, N.; Reither, G.; Haas, S.; Bindereif, A. Intronic CA-repeat and CA-rich elements: A new class of regulators of mammalian alternative splicing. EMBO J. 2005, 24, 1988–1998. [Google Scholar] [CrossRef]
- Ma, Y.; Bu, D.; Long, J.; Chai, W.; Dong, J. LncRNA DSCAM-AS1 acts as a sponge of miR-137 to enhance Tamoxifen resistance in breast cancer. J. Cell. Physiol. 2018, 234, 2880–2894. [Google Scholar] [CrossRef]
- Hong, S.P.; Chan, T.E.; Lombardo, Y.; Corleone, G.; Rotmensz, N.; Bravaccini, S.; Rocca, A.; Pruneri, G.; McEwen, K.; Coombes, R.C.; et al. Single-cell transcriptomics reveals multi-step adaptations to endocrine therapy. Nat. Commun. 2019, 10, 3814–3840. [Google Scholar] [CrossRef] [PubMed]
- Perissi, V.; Menini, N.; Cottone, E.; Capello, D.; Sacco, M.; Montaldo, F.; De Bortoli, M. AP-2 transcription factors in the regulation of ERBB2 gene transcription by oestrogen. Oncogene 2000, 19, 280–288. [Google Scholar] [CrossRef] [PubMed][Green Version]
- Hagedorn, P.H.; Persson, R.; Funder, E.D.; Albæk, N.; Diemer, S.L.; Hansen, D.J.; Møller, M.R.; Papargyri, N.; Christiansen, H.; Hansen, B.R.; et al. Locked nucleic acid: Modality, diversity, and drug discovery. Drug Discov. Today 2018, 23, 101–114. [Google Scholar] [CrossRef] [PubMed]
- Caizzi, L.; Ferrero, G.; Cutrupi, S.; Cordero, F.; Ballare, C.; Miano, V.; Reineri, S.; Ricci, L.; Friard, O.; Testori, A.; et al. Genome-wide activity of unliganded estrogen receptor-α in breast cancer cells. Proc. Natl. Acad. Sci. USA 2014, 111, 4892–4897. [Google Scholar] [CrossRef]
- Xu, S.; Kong, D.; Chen, Q.; Ping, Y.; Pang, D. Oncogenic long noncoding RNA landscape in breast cancer. Mol. Cancer 2017, 16, 129. [Google Scholar] [CrossRef]
- Xu, J.; Chen, Y.; Olopade, O.I. MYC and breast cancer. Genes Cancer 2010, 1, 629–640. [Google Scholar] [CrossRef]
- Stine, Z.E.; McGaughey, D.; Bessling, S.L.; Li, S.; McCallion, A.S. Steroid hormone modulation of RET through two estrogen responsive enhancers in breast cancer. Hum. Mol. Genet. 2011, 20, 3746–3756. [Google Scholar] [CrossRef]
- An, X.; Xu, F.; Luo, R.; Zheng, Q.; Lu, J.; Yang, Y.; Qin, T.; Yuan, Z.; Shi, Y.-X.; Jiang, W.-Q.; et al. The prognostic significance of topoisomerase II alpha protein in early stage luminal breast cancer. BMC Cancer 2018, 18, 331. [Google Scholar] [CrossRef]
- Burd, C.; Dreyfuss, G. RNA binding specificity of hnRNP A1: Significance of hnRNP A1 high-affinity binding sites in pre-mRNA splicing. EMBO J. 1994, 13, 1197–1204. [Google Scholar] [CrossRef]
- Kim, J.H.; Hahm, B.; Kim, Y.K.; Choi, M.; Jang, S.K. Protein-protein interaction among hnRNPs shuttling between nucleus and cytoplasm. J. Mol. Biol. 2000, 298, 395–405. [Google Scholar] [CrossRef]
- Batra, R.; Charizanis, K.; Manchanda, M.; Mohan, A.; Li, M.; Finn, D.J.; Goodwin, M.; Zhang, C.; Sobczak, K.; Thornton, C.A.; et al. Loss of MBNL leads to disruption of developmentally regulated alternative polyadenylation in RNA-mediated disease. Mol. Cell 2014, 56, 311–322. [Google Scholar] [CrossRef] [PubMed]
- Aulas, A.; Caron, G.; Gkogkas, C.G.; Mohamed, N.-V.; Destroismaisons, L.; Sonenberg, N.; Leclerc, N.; Parker, A.; Velde, C.V. G3BP1 promotes stress-induced RNA granule interactions to preserve polyadenylated mRNA. J. Cell Biol. 2015, 209, 73–84. [Google Scholar] [CrossRef] [PubMed]
- Bottini, S.; Hamouda-Tekaya, N.; Mategot, R.; Zaragosi, L.-E.; Audebert, S.; Pisano, S.; Grandjean, V.; Mauduit, C.; Benahmed, M.; Barbry, P.; et al. Post-transcriptional gene silencing mediated by microRNAs is controlled by nucleoplasmic Sfpq. Nat. Commun. 2017, 8, 1189. [Google Scholar] [CrossRef] [PubMed]
- Vanharanta, S.; Marney, C.; Shu, W.; Valiente, M.; Zou, Y.; Mele, A.; Darnell, R.B.; Massagué, J. Loss of the multifunctional RNA-binding protein RBM47 as a source of selectable metastatic traits in breast cancer. eLife 2014, 3, 3. [Google Scholar] [CrossRef]
- Gruber, A.J.; Zavolan, M. Alternative cleavage and polyadenylation in health and disease. Nat. Rev. Genet. 2019, 20, 599–614. [Google Scholar] [CrossRef]
- Xue, Z.; Warren, R.L.; Gibb, E.A.; Macmillan, D.; Wong, J.; Chiu, R.; Hammond, S.A.; Yang, C.; Nip, K.M.; Ennis, C.A.; et al. Recurrent tumor-specific regulation of alternative polyadenylation of cancer-related genes. BMC Genom. 2018, 19, 536. [Google Scholar] [CrossRef]
- Mayr, C.; Bartel, B. Widespread shortening of 3′UTRs by Alternative cleavage and Polyadenylation activates oncogenes in cancer cells. Cell 2009, 138, 673–684. [Google Scholar] [CrossRef]
- Park, H.J.; Ji, P.; Kim, S.; Xia, Z.; Rodriguez, B.; Li, L.; Su, J.; Chen, K.; Masamha, C.P.; Baillat, D.; et al. 3′ UTR shortening represses tumor-suppressor genes in trans by disrupting ceRNA crosstalk. Nat. Genet. 2018, 50, 783–789. [Google Scholar] [CrossRef]
- Wang, X.; Li, M.; Yin, Y.; Li, L.; Tao, Y.; Chen, D.; Li, J.; Han, H.; Hou, Z.; Zhang, B.; et al. Profiling of alternative polyadenylation sites in luminal B breast cancer using the SAPAS method. Int. J. Mol. Med. 2014, 35, 39–50. [Google Scholar] [CrossRef]
- Lim, M.-H.; Lee, D.-H.; Jung, S.E.; Youn, D.-Y.; Park, C.S.; Lee, J.-H. Effect of Modulation of hnRNP L Levels on the Decay of bcl-2 mRNA in MCF-7 Cells. Korean J. Physiol. Pharmacol. 2010, 14, 15–20. [Google Scholar] [CrossRef]
- Kurosaki, T.; Popp, M.W.; Maquat, L.E. Quality and quantity control of gene expression by nonsense-mediated mRNA decay. Nat. Rev. Mol. Cell Biol. 2019, 20, 406–420. [Google Scholar] [CrossRef] [PubMed]
- Malka, Y.; Steiman-Shimony, A.; Rosenthal, E.; Argaman, L.; Cohen-Daniel, L.; Arbib, E.; Margalit, H.; Kaplan, T.; Berger, M. Post-transcriptional 3′-UTR cleavage of mRNA transcripts generates thousands of stable uncapped autonomous RNA fragments. Nat. Commun. 2017, 8, 2029. [Google Scholar] [CrossRef] [PubMed]
- Huang, J.; Zhang, A.; Ho, T.-T.; Zhang, Z.; Zhou, N.; Ding, X.; Zhang, X.; Xu, M.; Mo, Y.-Y. Linc-RoR promotes c-Myc expression through hnRNP I and AUF1. Nucleic Acids Res. 2015, 44, 3059–3069. [Google Scholar] [CrossRef] [PubMed]
- Shankarling, G.; Cole, B.S.; Mallory, M.J.; Lynch, K.W. Transcriptome-wide RNA interaction profiling reveals physical and functional targets of hnRNP L in human T cells. Mol. Cell. Biol. 2013, 34, 71–83. [Google Scholar] [CrossRef]
- Dumas, J.; Gargano, M.A.; Dancik, G.M. shinyGEO: A web-based application for analyzing gene expression omnibus datasets. Bioinformatics 2016, 32, 3679–3681. [Google Scholar] [CrossRef]
- Grossman, R.L.; Heath, A.P.; Ferretti, V.; Varmus, H.E.; Lowy, U.R.; Kibbe, W.A.; Staudt, L.M. Toward a shared vision for cancer genomic data. N. Engl. J. Med. 2016, 375, 1109–1112. [Google Scholar] [CrossRef]
- Gao, J.; Aksoy, B.A.; Dogrusoz, U.; Dresdner, G.; Gross, B.; Sumer, S.O.; Sun, Y.; Skanderup, A.J.; Sinha, R.; Larsson, E.; et al. Integrative analysis of complex cancer genomics and clinical profiles using the cBioPortal. Sci. Signal. 2013, 6, l1. [Google Scholar] [CrossRef]
- Dobin, A.; Davis, C.A.; Schlesinger, F.; Drenkow, J.; Zaleski, C.; Jha, S.; Batut, P.; Chaisson, M.; Gingeras, T.R. STAR: Ultrafast universal RNA-seq aligner. Bioinformatics 2012, 29, 15–21. [Google Scholar] [CrossRef]
- Li, B.; Dewey, C.N. RSEM: Accurate transcript quantification from RNA-Seq data with or without a reference genome. BMC Bioinform. 2011, 12, 323. [Google Scholar] [CrossRef]
- Love, M.I.; Huber, W.; Anders, S. Moderated estimation of fold change and dispersion for RNA-seq data with DESeq2. Genome Biol. 2014, 15, 002832. [Google Scholar] [CrossRef]
- Soneson, C.; I Love, M.; Robinson, M.D. Differential analyses for RNA-seq: Transcript-level estimates improve gene-level inferences. F1000Research 2015, 4, 1521. [Google Scholar] [CrossRef] [PubMed]
- Wilkinson, L. ggplot2: Elegant graphics for data analysis by WICKHAM, H. Biometrics 2011, 67, 678–679. [Google Scholar] [CrossRef]
- Zhou, Y.; Zhou, B.; Pache, L.; Chang, M.; Khodabakhshi, A.H.; Tanaseichuk, O.; Benner, C.; Chanda, S. Metascape provides a biologist-oriented resource for the analysis of systems-level datasets. Nat. Commun. 2019, 10, 1523. [Google Scholar] [CrossRef] [PubMed]
- Armenteros, J.J.A.; Tsirigos, K.; Sønderby, C.K.; Petersen, T.N.; Winther, O.; Brunak, S.; Von Heijne, G.; Nielsen, H. SignalP 5.0 improves signal peptide predictions using deep neural networks. Nat. Biotechnol. 2019, 37, 420–423. [Google Scholar] [CrossRef]
- Kang, Y.-J.; Yang, D.-C.; Kong, L.; Hou, M.; Meng, Y.-Q.; Wei, L.; Gao, G. CPC2: A fast and accurate coding potential calculator based on sequence intrinsic features. Nucleic Acids Res. 2017, 45, W12–W16. [Google Scholar] [CrossRef] [PubMed]
- El-Gebali, S.; Mistry, J.; Bateman, A.; Eddy, S.R.; Luciani, A.; Potter, S.; Qureshi, M.; Richardson, L.J.; A Salazar, G.; Smart, A.; et al. The Pfam protein families database in 2019. Nucleic Acids Res. 2019, 47, D427–D432. [Google Scholar] [CrossRef]
- Ray, D.; Ha, K.C.; Nie, K.; Zheng, H.; Hughes, T.R.; Morris, Q. RNAcompete methodology and application to determine sequence preferences of unconventional RNA-binding proteins. Methods 2016, 3–15. [Google Scholar] [CrossRef]
- Sebestyén, E.; Singh, B.; Miñana, B.; Pagès, A.; Mateo, F.; Pujana, M.A.; Valcárcel, J.; Eyras, E. Large-scale analysis of genome and transcriptome alterations in multiple tumors unveils novel cancer-relevant splicing networks. Genome Res. 2016, 26, 732–744. [Google Scholar] [CrossRef]
- Grant, C.E.; Bailey, T.L.; Noble, W.S. FIMO: Scanning for occurrences of a given motif. Bioinformatics 2011, 27, 1017–1018. [Google Scholar] [CrossRef] [PubMed]
- Feng, X.; Li, L.; Wagner, E.J.; Li, W. TC3A: The cancer 3′ UTR atlas. Nucleic Acids Res. 2018, 46, D1027–D1030. [Google Scholar] [CrossRef]
- Blin, K.; Dieterich, C.; Wurmus, R.; Rajewsky, N.; Landthaler, M.; Akalin, A. DoRiNA 2.0—Upgrading the doRiNA database of RNA interactions in post-transcriptional regulation. Nucleic Acids Res. 2014, 43, D160–D167. [Google Scholar] [CrossRef] [PubMed]
- Quinlan, A.R.; Hall, I.M. BEDTools: A flexible suite of utilities for comparing genomic features. Bioinformatics 2010, 26, 841–842. [Google Scholar] [CrossRef] [PubMed]
- Coscujuela Tarrero, L.; Ferrero, G.; Miano, V.; De Intinis, C.; Ricci, L.; Arigoni, M.; Riccardo, F.; Annaratone, L.; Castellano, I.; Calogero, R.A.; et al. Luminal breast cancer-specific circular RNAs uncovered by a novel tool for data analysis. Oncotarget 2018, 9, 14580–14596. [Google Scholar] [CrossRef] [PubMed]


© 2020 by the authors. Licensee MDPI, Basel, Switzerland. This article is an open access article distributed under the terms and conditions of the Creative Commons Attribution (CC BY) license (http://creativecommons.org/licenses/by/4.0/).
Share and Cite
Elhasnaoui, J.; Miano, V.; Ferrero, G.; Doria, E.; Leon, A.E.; Fabricio, A.S.C.; Annaratone, L.; Castellano, I.; Sapino, A.; De Bortoli, M. DSCAM-AS1-Driven Proliferation of Breast Cancer Cells Involves Regulation of Alternative Exon Splicing and 3′-End Usage. Cancers 2020, 12, 1453. https://doi.org/10.3390/cancers12061453
Elhasnaoui J, Miano V, Ferrero G, Doria E, Leon AE, Fabricio ASC, Annaratone L, Castellano I, Sapino A, De Bortoli M. DSCAM-AS1-Driven Proliferation of Breast Cancer Cells Involves Regulation of Alternative Exon Splicing and 3′-End Usage. Cancers. 2020; 12(6):1453. https://doi.org/10.3390/cancers12061453
Chicago/Turabian StyleElhasnaoui, Jamal, Valentina Miano, Giulio Ferrero, Elena Doria, Antonette E. Leon, Aline S. C. Fabricio, Laura Annaratone, Isabella Castellano, Anna Sapino, and Michele De Bortoli. 2020. "DSCAM-AS1-Driven Proliferation of Breast Cancer Cells Involves Regulation of Alternative Exon Splicing and 3′-End Usage" Cancers 12, no. 6: 1453. https://doi.org/10.3390/cancers12061453
APA StyleElhasnaoui, J., Miano, V., Ferrero, G., Doria, E., Leon, A. E., Fabricio, A. S. C., Annaratone, L., Castellano, I., Sapino, A., & De Bortoli, M. (2020). DSCAM-AS1-Driven Proliferation of Breast Cancer Cells Involves Regulation of Alternative Exon Splicing and 3′-End Usage. Cancers, 12(6), 1453. https://doi.org/10.3390/cancers12061453