Article

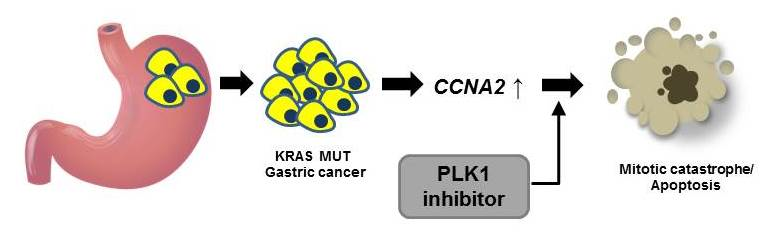
Pharmacogenomic Analysis Reveals CCNA2 as a Predictive Biomarker of Sensitivity to Polo-Like Kinase I Inhibitor in Gastric Cancer

1
Severance Biomedical Research Institute, Yonsei University College of Medicine, Seoul 03722, Korea
2
Brain Korea 21 Plus Project for Medical Science, Yonsei University College of Medicine, Seoul 03722, Korea
3
Department of Medicine, Yonsei University College of Medicine, Seoul 03722, Korea
*
Authors to whom correspondence should be addressed.
Authors share co-first authorship.
Cancers 2020, 12(6), 1418; https://doi.org/10.3390/cancers12061418
Submission received: 19 May 2020 / Accepted: 28 May 2020 / Published: 30 May 2020

Abstract

:
Despite recent innovations and advances in early diagnosis, the prognosis of advanced gastric cancer remains poor due to a limited number of available therapeutics. Here, we employed pharmacogenomic analysis of 37 gastric cancer cell lines and 1345 small-molecule pharmacological compounds to investigate biomarkers predictive of cytotoxicity among gastric cancer cells to the tested drugs. We discovered that expression of CCNA2, encoding cyclin A2, was commonly associated with responses to polo-like kinase 1 (PLK1) inhibitors (BI-2536 and volasertib). We also found that elevated CCNA2 expression is required to confer sensitivity to PLK1 inhibitors through increased mitotic catastrophe and apoptosis. Further, we demonstrated that CCNA2 expression is elevated in KRAS mutant gastric cancer cell lines and primary tumors, resulting in an increased sensitivity to PLK1 inhibitors. Our study suggests that CCNA2 is a novel biomarker predictive of sensitivity to PLK1 inhibitors for the treatment of advanced gastric cancer, particularly cases carrying KRAS mutation.

Graphical Abstract

1. Introduction

Gastric cancer is one of the most common malignant tumors of the gastrointestinal track [1]. Due to complex molecular mechanisms and clinical heterogeneity, clinical outcomes for patients with advanced gastric cancer remain poor, with a 5-year survival of 5–20% and a median overall survival (OS) of 10 months [2].To date, only two targeted therapies, treatment with trastuzumab (HER2 inhibitor) or ramucirumab (VEGFR2 inhibitor), have been approved for the treatment of advanced gastric cancer in patients carrying relevant biomarkers and development of more targeted therapeutic strategies for gastric cancer is needed.
Polo-like kinase 1 (PLK1), a mitotic serine/threonine protein kinase, regulates various cellular events throughout the cell cycle and has been shown to potentially be a new target in cancer treatment [3]. Increased expression of PLK1 has been observed in several types of malignant tumors and has been shown to be correlated with lower survival rates among solid tumor patients [4,5]. Meanwhile, several PLK1 kinase inhibitors have been developed as anticancer drugs and are currently being evaluated in clinical trials [6]: BI-2536, a dihydropteridinone compound and potent ATP-competitive PLK1 inhibitor [7], was found to inhibit cell proliferation in several human cancer cells, including breast, colon, lung, pancreas and prostate cancer [8]. Building on these results, BI-2536 became the first selective PLK1 inhibitor investigated in clinical trials of patients with solid tumors [9] and exhibited an acceptable safety profile in phase I clinical trials. In phase II study, however, BI-2536 showed relatively poor clinical efficacy, with only 4.2% of patients achieving a partial response in treatment of stage IIIB/IV non-small cell lung cancer [10]. Similar clinical data for BI-2536 were observed in another study of advanced solid tumors [11]. In light of these reports, further clinical studies of BI-2536 as a monotherapy have garnered little interest [10,11]. However, identifying a patient selection biomarker may help to overcome the inefficiency associated with BI-2536 monotherapy and assist with identifying patients who may better respond to treatment with PLK1 inhibitors. Indeed, research has shown that KRAS mutant cancer cells are highly sensitive to PLK1 inhibition [12], wherein cancer cells carrying the oncogenic mutation KRAS were sensitive to PLK1 depletion by shRNA or to treatment with PLK1 inhibitors. However, detailed mechanisms of the actions of PLK1 inhibitors on KRAS mutant cancers are largely unknown.
While several drugs targeting KRAS G12C mutant cancer sare under clinical trials [13], the KRASG12C mutation is very rare in gastric cancer: only 3.6% of KRAS mutant gastric cancer patients have the mutation according to combined cohort datasets in the cBioPortal (http://www.cbioportal.org). Therefore, development of alternative therapies will be significant for treatment of KRAS mutant gastric cancers.
In this study, we reviewed toxicity screens of 1345 FDA-approved, small-molecule pharmacological compounds and investigational anticancer compounds against a panel of 37 gastric cancer cell lines. Using elastic net regularization, we generated statistical models that predicted the sensitivity of gastric cancer cells to each of the tested drugs based on mRNA expression features, which allowed us to identify distinct drug–biomarker relationships. By focusing on an observed relationship between PLK1 inhibitors and CCNA2, we discovered that oncogenic KRAS mutation drives CCNA2 upregulation and consequent mitotic catastrophe and apoptosis in the presence of PLK1 inhibitors.

2. Results

2.1. Pharmacogenomic Analysis Highlights Novel Drug–Biomarker Relationships Among Gastric Cancer Cells

We previously screened seven gastric cancer cell lines against 1345 pharmaceutical compounds and selected 63 compounds that induced a greater than 50% decrease in cell viability in at least four of the seven cell lines after 72 h of exposure [14]. In this study, we expanded this to 37 gastric cancer cell lines and to 75 compounds targeting cell proliferation, survival and signal transduction pathways (Figure 1a,b). Cell line-specific responses to each of the 75 drugs were calculated by estimating the mean area under survival curves in duplicate (Figure 1c and Table S1). Using elastic net regularization, we generated statistical models that predicted the sensitivity of gastric cancer cells to each of the tested drugs according to mRNA-based gene expression features. In result, we found 23 biomarkers that predicted sensitivity among gastric cancer cells to nine drugs under bootstrapping (random sampling of cell lines with replacement) and a frequency threshold of 75% (Figure 1d and Figure S1). Intriguingly, CCNA2, encoding cyclin A2, which regulates cell cycle progression during the S phase and in G2/M transition, was commonly associated with responses to PLK1 inhibitors BI-2536 and volasertib (BI-6727) (Figure 1d). The concordant associations with CCNA2 expression (i.e., elevated CCNA2 predicts hypersensitivity) with two structurally distinct PLK1 inhibitors, but not with other drugs, were suggestive a biologically meaningful relationship. Therefore, we decided to further investigate whether CCNA2 may be a functional of differential responses to PLK1 inhibitors in gastric cancer.

2.2. CCNA2 Upregulation is Causally Linked to BI-2536 Induced Cytotoxicity in Gastric Cancer Cells

First, we sought to validate differential expression of cyclin A2 protein in gastric cancer cell lines selected from both sides of the drug response profile for PLK1 inhibitors. Compared to resistant cells, gastric cancer cells sensitive to PLK1 inhibitors showed increased expression of cyclin A2 (Figure 2a). MKN28 (sensitive) and SNU719 (resistant) cells were further evaluated in regards to multi-point dose responses to BI-2536. As expected, MKN28 cells exhibited greater sensitivity to BI-2536 than SNU719 cells (Figure 2b). In MKN28 and other sensitive cancer cell lines (AGS and SNU601), but not in SNU719 cells, BI-2536 elicited PARP1 cleavage, JNK phosphorylation and caspase-3 cleavage, all of which are indicative of apoptosis induction (Figure 2c and Figure S2a). To determine if elevated CCNA2 is required to confer sensitivity to BI-2536 in gastric cancer cell lines, CCNA2 was transiently overexpressed in SNU719 cells and knocked down in MKN28 cells (Figure 2d). MKN28 cells transfected with CCNA2 siRNAs gained resistance to BI-2536, compared to cells transfected with negative control siRNA (siNC) (Figure 2e). Meanwhile, however, SNU719 cells transfected with CCNA2 cDNA exhibited greater sensitivity to BI-2536 than control cells (Figure 2f). To confirm that BI-2536 sensitivity indeed acts in relation to CCNA2 expression, we stably knocked down CCNA2 in MKN28 cells using viral transduction of shRNAs and tested the resultant cell viability. Therein, MKN28 isogenic cells, in which CCNA2 was knocked down by five shRNA clones, showed decreased cyclin A2 expression (Figure 2g) and increased viability against BI-2536 (Figure 2h). Similarly, we also observed the shCCNA2-mediated reversal of cytotoxicity to BI-2536 in AGS and SNU601 (Figure S2b,c). Taken together, we deemed that elevated CCNA2 expression is required to confer sensitivity to PLK1inhibitors in gastric cancer cell lines.

2.3. CCNA2 is Required for BI-2536-Induced Mitotic Catastrophe and Apoptosis

Cyclin A2 regulates cell cycle progression by promoting S phase entry upon forming a complex with CDK2, as well as by facilitating mitosis through cooperation with the cyclin B1-CDK1 complex [15]. In contrast, PLK1 primarily functions in the M phase of the cell cycle [16,17,18,19] and inhibition of PLK1 causes cell cycle arrest at the G2/M-phase, followed by mitotic catastrophe, a type of apoptosis that occurs during mitosis, in cells with higher mitotic index [20,21]. Therefore, we hypothesized that aberrant upregulation of cyclin A2 in gastric cancer cells may elicit synthetic lethal vulnerability to PLK1 inhibition through failed cell cycle progression, particularly at the M phase. To test this, we performed immunocytochemistry using phospho-histone H3 antibody to detect mitotic cells and found that cyclin A2-knockdown cells show lower mitotic index values than control cells (Figure 3a). To investigate whether elevated cyclin A2 induces sensitivity to BI-2536 due to impaired mitotic progression, we assessed changes in cell numbers in each phase of the cell cycle at 24, 48 and 72 h post treatment with BI-2536 and with or without CCNA2 knockdown in MKN28 cells. Control cells showed marked cell cycle arrest at the G2/M-phase at 24 h posttreatment with BI-2536; however, shCCNA2 cells slipped over from the G2/M-arrest and showed accumulation of polyploidy at 48 h and 72 h post BI-2536-treatment in a dose-dependent manner (Figure 3b), indicating that cancer cells characterized by high expression of cyclin A2 undergo less mitotic slippage and more apoptosis in response to BI-2536 treatment than cyclin A2 knockdown cells. We confirmed this through flow cytometricanalysis and subsequent immunoblot analysis of control MKN28 cells, which showed early apoptotic cell populations within 24 h of BI-2536 treatment (Figure S3) and accumulation of apoptotic marker proteins (e.g., 89-kDa cleaved PARP1, JNK phosphorylation and cleaved caspase-3) upon exposure to BI-2536 (Figure 3c). shRNA-mediated knockdown of cyclin A2 significantly reduced apoptotic marker proteins (Figure 3c), cell-fractions under mitotic catastrophe (Figure 3d) and dead cell populations (Figure 3e) induced by BI-2536.These observations indicated that PLK1 inhibition in the context of elevated CCNA2 leads to mitotic catastrophe and apoptosis rather than to cell survival through mitotic slippage. Meanwhile, research has indicated a potential direct regulatory mechanism for cyclin A2 on PLK1 activation and phosphorylation [22]. To investigate if cyclin A2 functions through PLK1 activity, we developedphosphomimetic mutant PLK1 (T210D) and non-phosphorylatable mutant PLK1 (T210A) proteins (Figure S4a,b) and observed their effects on BI-2536 sensitivity. Interestingly, overexpression of neither of these mutant PLK1 proteins nor wild-type PLK1 altered sensitivity to BI-2536 (Figure S4c,d), indicating that CCNA2-induced BI-2536 sensitivity is independent of PLK1 and phospho-PLK1 levels.

2.4. KRAS Driven Upregulation of CCNA2 Confers Sensitivity to PLK1 Inhibitors Among KRAS Mutant Cancers

While it was reported that KRAS mutant cancer cells are highly sensitive to PLK1 inhibitors [12], detailed mechanisms underlying the sensitivity are largely unknown. Here, we hypothesized that oncogenic KRAS would drive aberrant upregulation of CCNA2. To test this, we compared CCNA2 expression levels between wild-type and mutant KRAS or pan-RAS (KRAS, HRAS and NRAS) tumor samples in The Cancer Genome Atlas (TCGA) cohort. CCNA2 expression was significantly higher in pan-RAS and KRAS mutant tumors than wild-type controls (p =1.01 × 10⁻³¹ and 4.27 × 10⁻²⁰ by Wilcoxon test, respectively). KRAS mutant gastric tumor samples (TCGA-STAD) also showed significantly higher expression of CCNA2 (p = 4.76 × 10⁻⁴ by Wilcoxon test) than wild-type gastric tumors (Figure 4a). The 37 gastric cancer cell lines, which includedeight KRAS mutant cell lines (AGS, SNU601, SK4, SNU1, NCC24, SNU668, YCC2 and NCC59) in this study also showed similar results in that KRAS mutant cell lines had higher sensitivity to BI-2536 and volasertib (Figure 4b). To test whether KRAS affects CCNA2 expression or vice versa, KRAS mutant gastric cancer cell lines were transfected with siRNAs targeting KRAS or CCNA2. Therein, the KRAS mutant gastric cancer cell lines (AGS, SK4 and SNU601) showed decreased CCNA2 expression after depletion of mutant KRAS, whereas CCNA2 knockdown did not affect expression of KRAS (Figure 4c). In addition, while depletion of mutant KRAS reversed cytotoxicity to BI-2536 and volasertib (Figure 4d), co-expression of CCNA2 in this context was sufficient to reintroduce sensitivity (Figure 4e), indicating that sensitivity to PLK1 inhibitors in KRAS mutant gastric cancer cells is mediated by CCNA2 upregulation.
Taken together, these data demonstrated that oncogenic KRAS-driven CCNA2 upregulation confers hypersensitivity to PLK1 inhibition through mitotic catastrophe and apoptosis (Figure 4f).

3. Discussion

The cell cycle is tightly regulated by cyclins, cyclin-dependent kinases (CDKs) and various checkpoint kinases [23]. Deregulation of the cell cycle is a hallmark of tumorigenesis [24]. Given its importance in tumorigenesis, several cell cycle inhibitors have emerged as potential therapeutic drugs for the treatment of cancers, both as single and combination therapies with traditional cytotoxic or molecular targeting agents. Currently, the most promising cell cycle inhibitors in anticancer therapeutics are orally bioavailable CDK4/6 inhibitors, which have received regulatory approval in combination with hormonal therapy for treatment of patients with metastatic hormone receptor (HR)-positive, Her2-negative breast cancer [25,26,27,28,29]. Many other compounds designed to interrupt cell cycle progression or checkpoint control have problems in demonstrating sufficient antitumor efficacy. Thus, to facilitate clinical development of this target class, proper patient selection biomarkers are urgently needed.
PLK1 is a serine/threonine kinase that regulates various cellular events during cell cycle progression, including centrosome maturation, DNA checkpoint activation, mitotic entry, spindle assembly and cytokinesis [3]. Because hyper-activation of PLK1 causes overriding checkpoints, which leads to immature cell division, several PLK1 kinase inhibitors have been developed as anticancer drugs and are currently being evaluated in clinical trials [6]. Several challenges limiting the success of these drugs are as follows: First, most PLK1 inhibitors exhibit a narrow therapeutic window, with their therapeutic effects often coupled with normal toxicity. Second, responses to PLK1 inhibitors are inconsistent. Last is the emergence of drug resistance [6]. Discovery of patient selection biomarkers can help overcome this challenge by identifying correct tumor types and by facilitating patient stratification to increase response rates to these drugs. Indeed, some studies have reported that TP53 mutation is a biomarker of sensitivity to PLK1 inhibitors [30,31]. This suggests a compensatory mechanism mediated by p53 that rescues cancer cells from mitotic arrest and subsequent apoptosis caused by PLK1 inhibition. Another potential biomarker predicting sensitivity to PLK1 inhibitors is the oncogenic KRAS mutation. Research has been shown that cancer cells with KRAS mutation are more sensitive to PLK1 inhibitors than KRAS wild-type cancers [32], suggesting that KRAS mutation induces mitotic stress in tumor cells and may underlie tumor sensitivity to anti-mitotic agents.
Cyclin A2 belongs to the highly conserved cyclin family and is expressed in almost all tissues in the human body. It plays critical roles in control of the cell cycle at G1/S and in G2/M transition. Data from the Human Protein Atlas show that CCNA2 is overexpressed in dozens of cancer types, suggesting a potential role in tumorigenesis. In this study, we demonstrated that, compared to cells with basal CCNA2 expression, cancer cells highly expressing CCNA2 are more addicted to PLK1 activity and show increased mitotic index values, leading to G2/M arrest and mitotic catastrophe, followed by apoptosis, in response to PLK1 inhibitors. We observed neither PLK1 nor phospho-PLK1 affects sensitivity to PLK1 inhibitor, suggesting that the increased sensitivity of CCNA2-elevated cancer cells to PLK1 inhibition is not due to direct perturbation of the cyclin A2-PLK1 axis, but rather, likely due to a different mechanism that needs to be further elucidated. One possibility may be that increased cyclin A2 facilitates G2/M transition by activation of the cyclin B1/CDK1 complex [33], resulting in increased mitotic cell populations that more greatly rely on proper spindle assembly checkpoint, wherein PLK1 kinase activity plays an essential role [34].
We also discovered a causal relationship between oncogenic KRAS mutation and CCNA2 upregulation. Our data suggest that aberrations in CCNA2 expression are a consequence of oncogenic KRAS mutation potentially contributing to cell cycle progression, while at the same time, conferring dependence on PLK1 function for productive mitotic progression. Although it is beyond the scope of this manuscript, several mechanistic hypotheses may explain the connections between KRAS mutation, cyclin A2 elevation and PLK1 inhibitor sensitivity: Potentially, upon glutamine (Gln) deprivation, KRAS-driven cancer cells bypass a late G1 Gln-dependent cell cycle checkpoint and enter S-phase, followed by cell cycle arrest due to insufficient nucleotide biosynthesis [35]. Meanwhile, cyclin A2 forms a complex with CDK2 at the S phase of the cell cycle to initiate and progress DNA synthesis. Thus, elevated cyclin A2 in KRAS mutant cancers may reflect anadaptation mechanism from this cell cycle stress at the S phase. Alternatively, as cyclin A2 directly phosphorylates and activates protein kinase B, also known as Akt [36,37], elevated cyclin A2 may contribute to Akt-driven tumorigenesis as well. Either way, as a consequence of CCNA2 upregulation, cancer cells mayface an unavoidable dependence on PLK1 to prevent mitotic catastrophe by disrupted spindle assembly. Thus, we considerthis relationship as a “synthetic lethality.”Accordingly, synthetic lethal approaches targeting cell cycle progression with PLK1 inhibitors may prove to be effective in treating tumors characterized by increased CCNA2 expression.

4. Materials and Methods

4.1. Pharmacological Characterization

This study analyzed data for 37 gastric cancer cell lines treated with 75 small-molecule compounds selected from libraries of FDA-approved small-molecule pharmacological compounds (#L1300, Selleckchem, Houston, TX, USA) and investigational anti-cancer compounds (#L2000, Selleckchem). The pharmacological profiles of 29 of the 37 cell lines have previously been reported [14]. For cell-based drug assay, 5000 cells were seeded onto individual wells of 96-well plates. After 24 h of incubation, half-log 12-serial dilutions of pharmacological compounds in DMSO were added using a BiomekFXp liquid handler (Beckman Coulter, Brea, CA, USA), resulting in final concentrations of 50 μM to 0.5 nM. The cells were then incubated for 72 h and cell viability was measured with CellTiter-Glo assay kits (Promega, Madison, WI, USA). In each cell line, DMSO (0.5%) controls were used for normalization. Finally, we calculated area under the viability curve (AUC) values from 12-point dose–response curves for each pharmacological compound. All gastric cancer cell lines, except SK4 and the Yonsei Cancer Center (YCC)-series cell lines, were purchased from the Korea Cell Line Bank. SK4 cells were kindly provided from Dr. Julie Izzo (MD Anderson Cancer Center, Houston, TX, USA). YCC-series cell lines were obtained from the Song–Dang Institute for Cancer Research (Yonsei University College of Medicine, Seoul, Korea). The cell lines were maintained in RPMI-1640 medium supplemented with 10% fetal bovine serum (Gibco/Thermo Fisher Scientific, Waltham, MA, USA) and 1% penicillin–streptomycin (Invitrogen, Carlsbad, CA, USA) in mycoplasma-free condition. All gastric cancer cell lines have been authenticated using STR profiling within the last three years.

4.2. RNA Sequencing

RNA sequencing (RNA-seq) data for 29 of the 37 gastric cancer cell lines were previously reported [14]. Total RNA from the eight remaining gastric cancer cell lines were extracted with a RNeasy Plus Mini Kit (Qiagen, Hilden, Germany). RNA-seq libraries were then generated with a TruSeq RNA Sample Prep kit v2 (Illumina, San Diego, CA, USA) and sequencing with the HiSeq 2500 platform. The TopHat-Cufflinks pipeline was used to align reads to the reference genome and to calculate normalized values in FPKM (fragments per kilobase of exon per million fragments mapped).

4.3. Pharmacogenomic Analysis

We established elastic net models using a previously described method with some modifications [38]. Briefly, transcriptome and drug response data (n = 75) for the 37 gastric cancer cell lines were used to build the model. To do so, gene expression values were converted into Z-scores. Optimal values of α and λ were determined by 10-fold cross validation from 100 iterations. Bootstrapping (200×) was applied to estimate average weights (β) and selection frequency of features by the model. For drug marker selection, we chose features occurring at a frequency > 75%. Next, we applied different weight cutoffs to individual drugs because their weight spectrumsvaried greatly, which made it difficult to apply a single weight cutoff. The feature selection process was conducted using the GlmnetR package (version 2.0–8) and R (version 3.3.3).

4.4. siRNA Transfection

In each well of 96-well plates, 30 µL of 333 nM siRNA solution was mixed with 10 µL of 2% RNAiMAX (Invitrogen) solution and incubated for 15 min. Subsequently, 7000 cells in 100 µL of growth medium were added to the mixture. Culture medium was replaced 24 h post transfection. siRNA oligonucleotides were custom synthesized (Genolution, Seoul, Korea) with the sequences: 5′-GAUAUACCCUGGAAAGUCUUU-3′ (siCCNA2-1), 5′-GGAUGGUAGUUUUGAGUCAUU-3′ (siCCNA2-2), 5′-CUAUGGACAUGUCAAUUGUUU-3′ (siCCNA2-3), 5′-CGAAUAUGAUCCAACAAUAUU-3′ (siKRAS-1), 5′-GACAAAGUGUGUAAUUAUGUU-3′ (siKRAS-2), 5′-GCAUGGGACAUUUGUGAUUUU-3′ (siNC).

4.5. cDNA Transfection

The Myc-DDK-tagged human CCNA2 plasmid (#RC211148L1) was purchased from OriGene (Rockville, MD, USA). Two million cells were grown in 60-mm dishes for 24 h. On the day of transfection, 5 µg of plasmids and 15 µL of Lipofectamine 2000 (Invitrogen, Carlsbad, CA, USA) were diluted in 500 µL of Opti-MEM and added onto the culture dishes. Twenty-four hourspost transfection, cell lines transfected with either target plasmid or empty vector were trypsinized and re-plated into 96-well plates (8000 cells per well) for drug toxicity assay.

4.6. Immunoblot Analysis

Total cell extracts were prepared by dissolving cells with 1×Laemmli SDS reducing buffer (50 mM Tris-HCL [pH 6.8], 2% SDS and 10% glycerol) and boiled for denaturation. Equal amounts of protein sample were separated on 4-15% Mini-PROTEAN TGXTM Precast Gel (Bio-Rad, Hercules, CA, USA). Anti-Cyclin A2 (#4656S, Cell Signaling, Danvers, MA, USA), anti-β-actin (#sc-47778, Santa Cruz Biotechnology, Dallas, TX, USA), anti-KRAS (#sc-30, Santa Cruz Biotechnology), anti-cleaved PARP (#9541S, Cell Signaling Technology), anti-phospho-JNK (#4668S, Cell Signaling Technology), anti-cleaved Caspase-3 (#9661S, Cell Signaling Technology), anti-PLK1 (#4513S, Cell Signaling Technology), anti-FLAG (DYKDDDDK)(#2368S, Cell Signaling Technology) and anti-GAPDH (#60004-1-Ig, Proteintech Group, Rosemont, IL) antibodies were used as primary antibodies. Peroxidase-AffiniPure Goat Anti-Rabbit IgG (#111-035-144) and Anti-Mouse IgG (#115–035–003, Jackson ImmunoResearch, West Grove, RA, USA) were used as secondary antibodies. Antibody binding was visualized by SuperSignal West Pico/FemtoChemiluminescent Substrate (Thermo Fisher Scientific, Waltham, MA, USA) and X-ray films (AGFA-Gevaert, Mortsel, Belgium).

4.7. The Cancer Genome Atlas Analysis

Gene expression and mutation data for 16 cancer types were downloaded from the Genomic Data Commons data portal (https://portal.gdc.cancer.gov). Gene expression data in FPKM were transformed to log2 scale values and quantile normalization was performed to remove technical biases. Samples bearing any mutations in KRAS, HRAS or NRAS were considered as RAS mutation samples. A two-sided Wilcoxon rank-sum test was used to test the difference in CCNA2 expression levels between RNA-mutant and wild-type samples.

4.8. Flow CytometricAnalysis

For cell cycle analysis using flow cytometry (FACSVerseTM, BD Biosciences, Franklin Lakes, NJ), MKN28 cells were plated at a density of 1 × 10³ cells in 60mm culture dishes and then treated with BI-2536 (200 and 500 nM) for 72 h. Cells were then harvested and fixed in ice-cold 70% ethanol overnight at −20°C. Afterwards, cells were centrifuged at 300× g for 5 min, re-suspended in PBS containing 10 µg/mL of propidium iodide (PI) (P4170, Sigma-Aldrich, St. Louis, MO, USA), 100 µg/mL RNase A and 0.1% (v/v) Triton X-100 and incubated at 37 °C for 10 min. For cell apoptosis assay of MKN28 cells treated with BI-2536 (200 and 500 nM), we used the Annexin V-FITC Apoptosis Kit (#640914, BioLegend, San Diego, CA, USA) according to the manufacturer’s protocol. Briefly, a total of 1 × 10³ cells was seeded in 60mm culture dishes for 24 h and then treated with BI-2536 for 72 h. Adherent and floating cells were then harvested, stained with Annexin V and PI for 15 min at room temperature and subjected to flow cytometry. The data were analyzed with FlowJo software.

4.9. Immunofluorescence Analysis

Cells were washed with ice-cold PBS and fixed with 3.7% paraformaldehyde (PFA) for 10 min, permeabilized with 0.5% Triton X-100 in PBS (PBS-T) for 5 min and incubated with blocking solution (0.1% BSA + 10% goat serum in 0.1% PBS-T) for 30 min. Cells were then incubated with primary antibodies diluted in 0.1% PBS-T for an hour. After incubation with secondary antibodies labeled with Alexa Fluor-488 or Alexa Fluor-568 (Invitrogen), coverslips were mounted on slide glasses using Prolong Gold Antifade mounting solution (Thermo Fisher Scientific) and the slides were allowed to dry at room temperature.

5. Conclusions

We performed pharmacogenomics analysis using a gastric cancer cell line panel and discovered a causal linkage cascade of oncogenic KRAS mutation, aberrant CCNA2 upregulation and hypersensitivity to PLK1 inhibitors. Our findings hold translational implications for the treatment of gastric cancer patients with aberrant upregulation of CCNA2 via synthetic lethal approaches targeting cell cycle progression.

Supplementary Materials

The following are available online at https://www.mdpi.com/2072-6694/12/6/1418/s1, Table S1: List of 75 compounds and their cell line-specific responses, Figure S1: Identified biomarker and drug response relationships by the elastic net regularization method, Figure S2: BI-2536 sensitivity in AGS and SNU601 cells, Figure S3: Apoptosis analysis using Annexin V-FITC/PI dual staining and flow cytometric analysis after BI-2536 (200 nM) treatment for 24 h are presented in scatter plots, Figure S4: BI-2536 sensitivity with wild-type and mutant PLK1 levels.

Author Contributions

Conceptualization, S.B.K. and H.S.K.; experiments and data analysis, Y.L. and C.E.L.; bio-informatics analysis and visualization, S.O. and H.K.; initial screening, J.L.; writing—original draft preparation, Y.L. and S.B.K.; writing—review and editing, S.B.K. and H.S.K.; visualization, Y.L. and S.B.K.; supervision, H.S.K.; funding acquisition, H.S.K. All authors have read and agreed to the published version of the manuscript.

Funding

This study was supported by grants from the Korea Health Technology R & D project through the Korea Health Industry Development Institute (HI14C1324) and the National Research Foundation of Korea (NRF) (2017R1A2B2006777, 2020R1A2C3007792).

Acknowledgments

S.B.K. was supported by the Brain Pool program funded by the Ministry of Science and ICT through the NRF (2019H1D3A2A01050712). H.K was supported by the Global Ph.D. fellowship program funded by the NRF (2019H1A2A1075632).

Conflicts of Interest

The authors have no competing interests related to this work.

References

  1. Bray, F.; Ferlay, J.; Soerjomataram, I.; Siegel, R.L.; Torre, L.A.; Jemal, A. Global cancer statistics 2018: GLOBOCAN estimates of incidence and mortality worldwide for 36 cancers in 185 countries. CA Cancer J. Clin. 2018, 68, 394–424. [Google Scholar] [CrossRef] [PubMed] [Green Version]
  2. Apicella, M.; Corso, S.; Giordano, S. Targeted therapies for gastric cancer: Failures and hopes from clinical trials. Oncotarget 2017, 8, 57654–57669. [Google Scholar] [CrossRef] [PubMed] [Green Version]
  3. Glover, D.M.; Hagan, I.M.; Tavares, A.A. Polo-like kinases: A team that plays throughout mitosis. Genes Dev. 1998, 12, 3777–3787. [Google Scholar] [CrossRef] [PubMed] [Green Version]
  4. Eckerdt, F.; Yuan, J.; Strebhardt, K. Polo-like kinases and oncogenesis. Oncogene 2005, 24, 267–276. [Google Scholar] [CrossRef] [Green Version]
  5. Dietzmann, K.; Kirches, E.; von, B.; Jachau, K.; Mawrin, C. Increased human polo-like kinase-1 expression in gliomas. J. Neurooncol. 2001, 53, 1–11. [Google Scholar] [CrossRef]
  6. Gutteridge, R.E.; Ndiaye, M.A.; Liu, X.; Ahmad, N. Plk1 Inhibitors in Cancer Therapy: From Laboratory to Clinics. Mol. Cancer Ther. 2016, 15, 1427–1435. [Google Scholar] [CrossRef] [Green Version]
  7. Lenart, P.; Petronczki, M.; Steegmaier, M.; Di Fiore, B.; Lipp, J.J.; Hoffmann, M.; Rettig, W.J.; Kraut, N.; Peters, J.M. The small-molecule inhibitor BI 2536 reveals novel insights into mitotic roles of polo-like kinase 1. Curr. Biol. 2007, 17, 304–315. [Google Scholar] [CrossRef] [Green Version]
  8. Steegmaier, M.; Hoffmann, M.; Baum, A.; Lenart, P.; Petronczki, M.; Krssak, M.; Gurtler, U.; Garin-Chesa, P.; Lieb, S.; Quant, J.; et al. BI 2536, a potent and selective inhibitor of polo-like kinase 1, inhibits tumor growth in vivo. Curr. Biol. 2007, 17, 316–322. [Google Scholar] [CrossRef] [Green Version]
  9. Frost, A.; Mross, K.; Steinbild, S.; Hedbom, S.; Unger, C.; Kaiser, R.; Trommeshauser, D.; Munzert, G. Phase i study of the Plk1 inhibitor BI 2536 administered intravenously on three consecutive days in advanced solid tumours. Curr. Oncol. 2012, 19, e28–e35. [Google Scholar] [CrossRef] [Green Version]
  10. Sebastian, M.; Reck, M.; Waller, C.F.; Kortsik, C.; Frickhofen, N.; Schuler, M.; Fritsch, H.; Gaschler-Markefski, B.; Hanft, G.; Munzert, G.; et al. The efficacy and safety of BI 2536, a novel Plk-1 inhibitor, in patients with stage IIIB/IV non-small cell lung cancer who had relapsed after, or failed, chemotherapy: Results from an open-label, randomized phase II clinical trial. J. Thorac. Oncol. 2010, 5, 1060–1067. [Google Scholar] [CrossRef]
  11. Mross, K.; Dittrich, C.; Aulitzky, W.E.; Strumberg, D.; Schutte, J.; Schmid, R.M.; Hollerbach, S.; Merger, M.; Munzert, G.; Fleischer, F.; et al. A randomised phase II trial of the Polo-like kinase inhibitor BI 2536 in chemo-naive patients with unresectable exocrine adenocarcinoma of the pancreas—A study within the Central European Society Anticancer Drug Research (CESAR) collaborative network. Br. J. Cancer 2012, 107, 280–286. [Google Scholar] [CrossRef] [PubMed] [Green Version]
  12. Luo, J.; Emanuele, M.J.; Li, D.; Creighton, C.J.; Schlabach, M.R.; Westbrook, T.F.; Wong, K.K.; Elledge, S.J. A genome-wide RNAi screen identifies multiple synthetic lethal interactions with the Ras oncogene. Cell 2009, 137, 835–848. [Google Scholar] [CrossRef] [PubMed] [Green Version]
  13. Canon, J.; Rex, K.; Saiki, A.Y.; Mohr, C.; Cooke, K.; Bagal, D.; Gaida, K.; Holt, T.; Knutson, C.G.; Koppada, N.; et al. The clinical KRAS(G12C) inhibitor AMG 510 drives anti-tumour immunity. Nature 2019, 575, 217–223. [Google Scholar] [CrossRef] [PubMed]
  14. Lee, J.; Kim, H.; Lee, J.E.; Shin, S.J.; Oh, S.; Kwon, G.; Kim, H.; Choi, Y.Y.; White, M.A.; Paik, S.; et al. Selective Cytotoxicity of the NAMPT Inhibitor FK866 Toward Gastric Cancer Cells With Markers of the Epithelial-Mesenchymal Transition, Due to Loss of NAPRT. Gastroenterology 2018, 155, 799–814 e713. [Google Scholar] [CrossRef]
  15. Pagano, M.; Pepperkok, R.; Verde, F.; Ansorge, W.; Draetta, G. Cyclin A is required at two points in the human cell cycle. EMBO J. 1992, 11, 961–971. [Google Scholar] [CrossRef]
  16. Seong, Y.S.; Kamijo, K.; Lee, J.S.; Fernandez, E.; Kuriyama, R.; Miki, T.; Lee, K.S. A spindle checkpoint arrest and a cytokinesis failure by the dominant-negative polo-box domain of Plk1 in U-2 OS cells. J. Biol. Chem. 2002, 277, 32282–32293. [Google Scholar] [CrossRef] [Green Version]
  17. Arnaud, L.; Pines, J.; Nigg, E.A. GFP tagging reveals human Polo-like kinase 1 at the kinetochore/centromere region of mitotic chromosomes. Chromosoma 1998, 107, 424–429. [Google Scholar] [CrossRef]
  18. Lee, K.S.; Yuan, Y.L.; Kuriyama, R.; Erikson, R.L. Plk is an M-phase-specific protein kinase and interacts with a kinesin-like protein, CHO1/MKLP-1. Mol. Cell Biol. 1995, 15, 7143–7151. [Google Scholar] [CrossRef] [Green Version]
  19. Golsteyn, R.M.; Mundt, K.E.; Fry, A.M.; Nigg, E.A. Cell cycle regulation of the activity and subcellular localization of Plk1, a human protein kinase implicated in mitotic spindle function. J. Cell Biol. 1995, 129, 1617–1628. [Google Scholar] [CrossRef]
  20. Cheng, C.Y.; Liu, C.J.; Huang, Y.C.; Wu, S.H.; Fang, H.W.; Chen, Y.J. BI2536 induces mitotic catastrophe and radiosensitization in human oral cancer cells. Oncotarget 2018, 9, 21231–21243. [Google Scholar] [CrossRef] [Green Version]
  21. Choi, M.; Kim, W.; Cheon, M.G.; Lee, C.W.; Kim, J.E. Polo-like kinase 1 inhibitor BI2536 causes mitotic catastrophe following activation of the spindle assembly checkpoint in non-small cell lung cancer cells. Cancer Lett. 2015, 357, 591–601. [Google Scholar] [CrossRef] [PubMed]
  22. Gheghiani, L.; Loew, D.; Lombard, B.; Mansfeld, J.; Gavet, O. PLK1 Activation in Late G2 Sets Up Commitment to Mitosis. Cell Rep. 2017, 19, 2060–2073. [Google Scholar] [CrossRef] [PubMed]
  23. Suryadinata, R.; Sadowski, M.; Sarcevic, B. Control of cell cycle progression by phosphorylation of cyclin-dependent kinase (CDK) substrates. Biosci. Rep. 2010, 30, 243–255. [Google Scholar] [CrossRef] [PubMed] [Green Version]
  24. Vogelstein, B.; Papadopoulos, N.; Velculescu, V.E.; Zhou, S.; Diaz, L.A., Jr.; Kinzler, K.W. Cancer genome landscapes. Science 2013, 339, 1546–1558. [Google Scholar] [CrossRef]
  25. Sonke, G.S.; Hart, L.L.; Campone, M.; Erdkamp, F.; Janni, W.; Verma, S.; Villanueva, C.; Jakobsen, E.; Alba, E.; Wist, E.; et al. Ribociclib with letrozole vs letrozole alone in elderly patients with hormone receptor-positive, HER2-negative breast cancer in the randomized MONALEESA-2 trial. Breast Cancer Res. Treat. 2018, 167, 659–669. [Google Scholar] [CrossRef] [Green Version]
  26. Kwapisz, D. Cyclin-dependent kinase 4/6 inhibitors in breast cancer: Palbociclib, ribociclib, and abemaciclib. Breast Cancer Res. Treat. 2017, 166, 41–54. [Google Scholar] [CrossRef]
  27. Kim, E.S.; Scott, L.J. Palbociclib: A Review in HR-Positive, HER2-Negative, Advanced or Metastatic Breast Cancer. Target Oncol. 2017, 12, 373–383. [Google Scholar] [CrossRef]
  28. Tripathy, D.; Bardia, A.; Sellers, W.R. Ribociclib (LEE011): Mechanism of Action and Clinical Impact of This Selective Cyclin-Dependent Kinase 4/6 Inhibitor in Various Solid Tumors. Clin. Cancer Res. 2017, 23, 3251–3262. [Google Scholar] [CrossRef] [Green Version]
  29. de Gramont, A.; Herrera, A.; de Gramont, A. Ribociclib for HR-Positive, Advanced Breast Cancer. N. Engl. J. Med. 2017, 376, 288–289. [Google Scholar] [CrossRef]
  30. Wang, X.; Sun, Q. TP53 mutations, expression and interaction networks in human cancers. Oncotarget 2017, 8, 624–643. [Google Scholar] [CrossRef] [Green Version]
  31. Wang, X.; Simon, R. Identification of potential synthetic lethal genes to p53 using a computational biology approach. BMC Med.Genom. 2013, 6, 30. [Google Scholar] [CrossRef] [PubMed] [Green Version]
  32. Wang, J.; Hu, K.; Guo, J.; Cheng, F.; Lv, J.; Jiang, W.; Lu, W.; Liu, J.; Pang, X.; Liu, M. Suppression of KRas-mutant cancer through the combined inhibition of KRAS with PLK1 and ROCK. Nat. Commun. 2016, 7, 11363. [Google Scholar] [CrossRef] [PubMed] [Green Version]
  33. Gong, D.; Ferrell, J.E., Jr. The roles of cyclin A2, B1, and B2 in early and late mitotic events. Mol. Biol. Cell 2010, 21, 3149–3161. [Google Scholar] [CrossRef] [Green Version]
  34. Jia, L.; Li, B.; Yu, H. The Bub1-Plk1 kinase complex promotes spindle checkpoint signalling through Cdc20 phosphorylation. Nat. Commun. 2016, 7, 10818. [Google Scholar] [CrossRef] [Green Version]
  35. Mukhopadhyay, S.; Saqcena, M.; Foster, D.A. Synthetic lethality in KRas-driven cancer cells created by glutamine deprivation. Oncoscience 2015, 2, 807–808. [Google Scholar] [CrossRef] [PubMed]
  36. Gao, Y.; Moten, A.; Lin, H.K. Akt: A new activation mechanism. Cell Res. 2014, 24, 785–786. [Google Scholar] [CrossRef] [PubMed] [Green Version]
  37. Liu, P.; Begley, M.; Michowski, W.; Inuzuka, H.; Ginzberg, M.; Gao, D.; Tsou, P.; Gan, W.; Papa, A.; Kim, B.M.; et al. Cell-cycle-regulated activation of Akt kinase by phosphorylation at its carboxyl terminus. Nature 2014, 508, 541–545. [Google Scholar] [CrossRef] [PubMed]
  38. Kim, H.S.; Mendiratta, S.; Kim, J.; Pecot, C.V.; Larsen, J.E.; Zubovych, I.; Seo, B.Y.; Kim, J.; Eskiocak, B.; Chung, H.; et al. Systematic identification of molecular subtype-selective vulnerabilities in non-small-cell lung cancer. Cell 2013, 155, 552–566. [Google Scholar] [CrossRef] [Green Version]
Figure 1. Pharmacogenomic analysis identifies biomarker–drug response relationships. (a) Flowchart of overall screening strategy; (b) classification of the 75 compounds according to their target pathways; (c) sensitivities (area under the viability curve (AUC)) of the 37 gastric cancer cell lines to 75 compounds are ordered by row. Rank-ordered original AUC values are indicated as a heat map. Heat mapsare colored on a blue (sensitive) to white to red (resistant) gradient scale of original AUC values. Target pathways for each compound are annotated by the same color code as in b; (d) representative biomarker and drug response relationships by elastic net regularization method. The average weights of features are displayed in bar plots and their frequencies are shown in parenthesis.Bar plots on the left are colored in red when the expression level of a biomarker is positively correlated with the resistance of the given drugs and colored in blue when negatively correlated. Heat mapsaredepicted on a blue–white–red gradient scale of median-centered AUC values and expression levels (FPKM) of genes, respectively.
Cancers 12 01418 g001
Figure 2. Elevated CCNA2 is required to confer sensitivity to BI-2536. (a) Expression levels of endogenous cyclin A2 were assessed by immunoblotting whole cell lysates from the indicated “resistant” and “sensitive” gastric cancer cell lines; (b) dose–response curves of cell viability for the indicated gastric cancer cell lines after 72 h of exposure to BI-2536; (c) Induction of apoptotic markers were assessed by immunoblotting. Whole cell lysates were prepared post 72 h of BI-2536 or vehicle (DMSO) treatment with indicated concentrations; (d) ectopic expression of CCNA2 in SNU719 cells and knockdown of CCNA2 in MKN28 cells were demonstrated by immunoblotting; (e) dose–response curves of MKN28 cells expressing non-silencing siRNA (siNC) or siRNA against CCNA2 (siCCNA2); (f) Dose–response curves of SNU719 cells transfected with empty pCMV6 plasmid or CCNA2 cDNA plasmid; (g) immunoblot shows depletion of cyclin A2 in MKN28 cells expressing shRNA clones against CCNA2; (h) relative viability of MKN28 cells at 72 h post BI-2536 (300 nM) treatment; (b,e,f) * p <0.05, ** p < 0.01, *** p <0.001; one-way ANOVA; (h) * p <0.05, ** p< 0.01, *** p <0.001; Wilcoxon rank-sum test.
Cancers 12 01418 g002
Figure 3. Elevated CCNA2 is required for BI-2536-induced mitotic catastrophe and apoptosis. (a) Mitotic cells were visualized by immunostaining using anti-phospho-Histone H3 antibody (red) in MKN28 cell lines expressing shCCNA2 or shCTRL (left). DAPI was counterstained to detect nuclei (blue). Scale bar: 200 µm. Mitotic index (right), calculated by dividing the number of mitotic cells by the total number of cells. * p < 0.05; Student’s t-test; (b) evaluation of cell cycle by propidium iodide (PI) staining and flow cytometer analysis after BI-2536 treatment for the indicated time periods. Percentages of cells in each cell cycle are presented in bar plots; (c) effects of BI-2536 on the expression of apoptotic markers (e.g., cleaved PARP, phospho-JNK and cleaved caspase-3) 72 h post treatment. The amount of β-actin was measured as an internal control; (d) evaluation of mitotic catastrophe by DAPI staining and fluorescence microscopy (Axio Imager M2, ZEISS) at 72 h post BI-2536 (300 nM) treatment (Scale bar, 25µm); (e) apoptosis analysis using Annexin V-FITC/PI dual staining and flow cytometer analysis after BI-2536 (200 nM and 500 nM) treatment for 72 h are presented in both scatter plots (left) and bar plots (right). * p < 0.05; Wilcoxon rank-sum test.
Cancers 12 01418 g003
Figure 4. Oncogenic KRAS driven CCNA2 upregulation confers sensitivity of KRAS mutant cancer to PLK1 inhibitors.(a) Comparison of CCNA2 expression levels between wild-type (WT) and pan-RAS (KRAS, HRAS and NRAS) or mutant KRAS tumor samples (pan-cancer and gastric cancer) in the Cancer Genome Atlas (TCGA) cohort; (b) cumulative distribution fraction plots of drug response (median-centered AUC) in the 37 gastric cancer cell lines show that KRAS mutant cell lines had higher sensitivity to BI-2536 and volasertib. p values were calculated by two-sided Kolmogorov–Smirnov tests (KS-test); (c) evaluation of cyclin A2 and KRAS expression by immunoblotting post knockdown of CCNA2 and KRAS in KRAS mutant gastric cancer cell lines (AGS, SK4 and SNU601). GAPDH was measured as an internal control; (d) relative viability of AGS cells expressing siKRASoligos at 72 h post treatment with BI-2536 (0.16μM) and volasertib (0.16μM). Expression changes of KRAS and cyclin A2 by expression of siKRASoligos were observed by immunoblotting. * p <0.05, ** p <0.01; Student’s t-test; (e) relative viability of AGS cells expressing siKRAS with or without CCNA2 cDNA at 72 h post BI-2536 (0.16μM and 0.5μM) treatment. Expression changes of KRAS and cyclin A2 were assessed by immunoblotting. ** p <0.01, *** p <0.001; two-way ANOVA; (f) Hypothetical model of selective toxicity to PLK1 inhibitor in KRAS mutant cancer.
Cancers 12 01418 g004

