Cabozantinib Inhibits Photodynamic Therapy-Induced Auto- and Paracrine MET Signaling in Heterotypic Pancreatic Microtumors

 ,
,  , , and
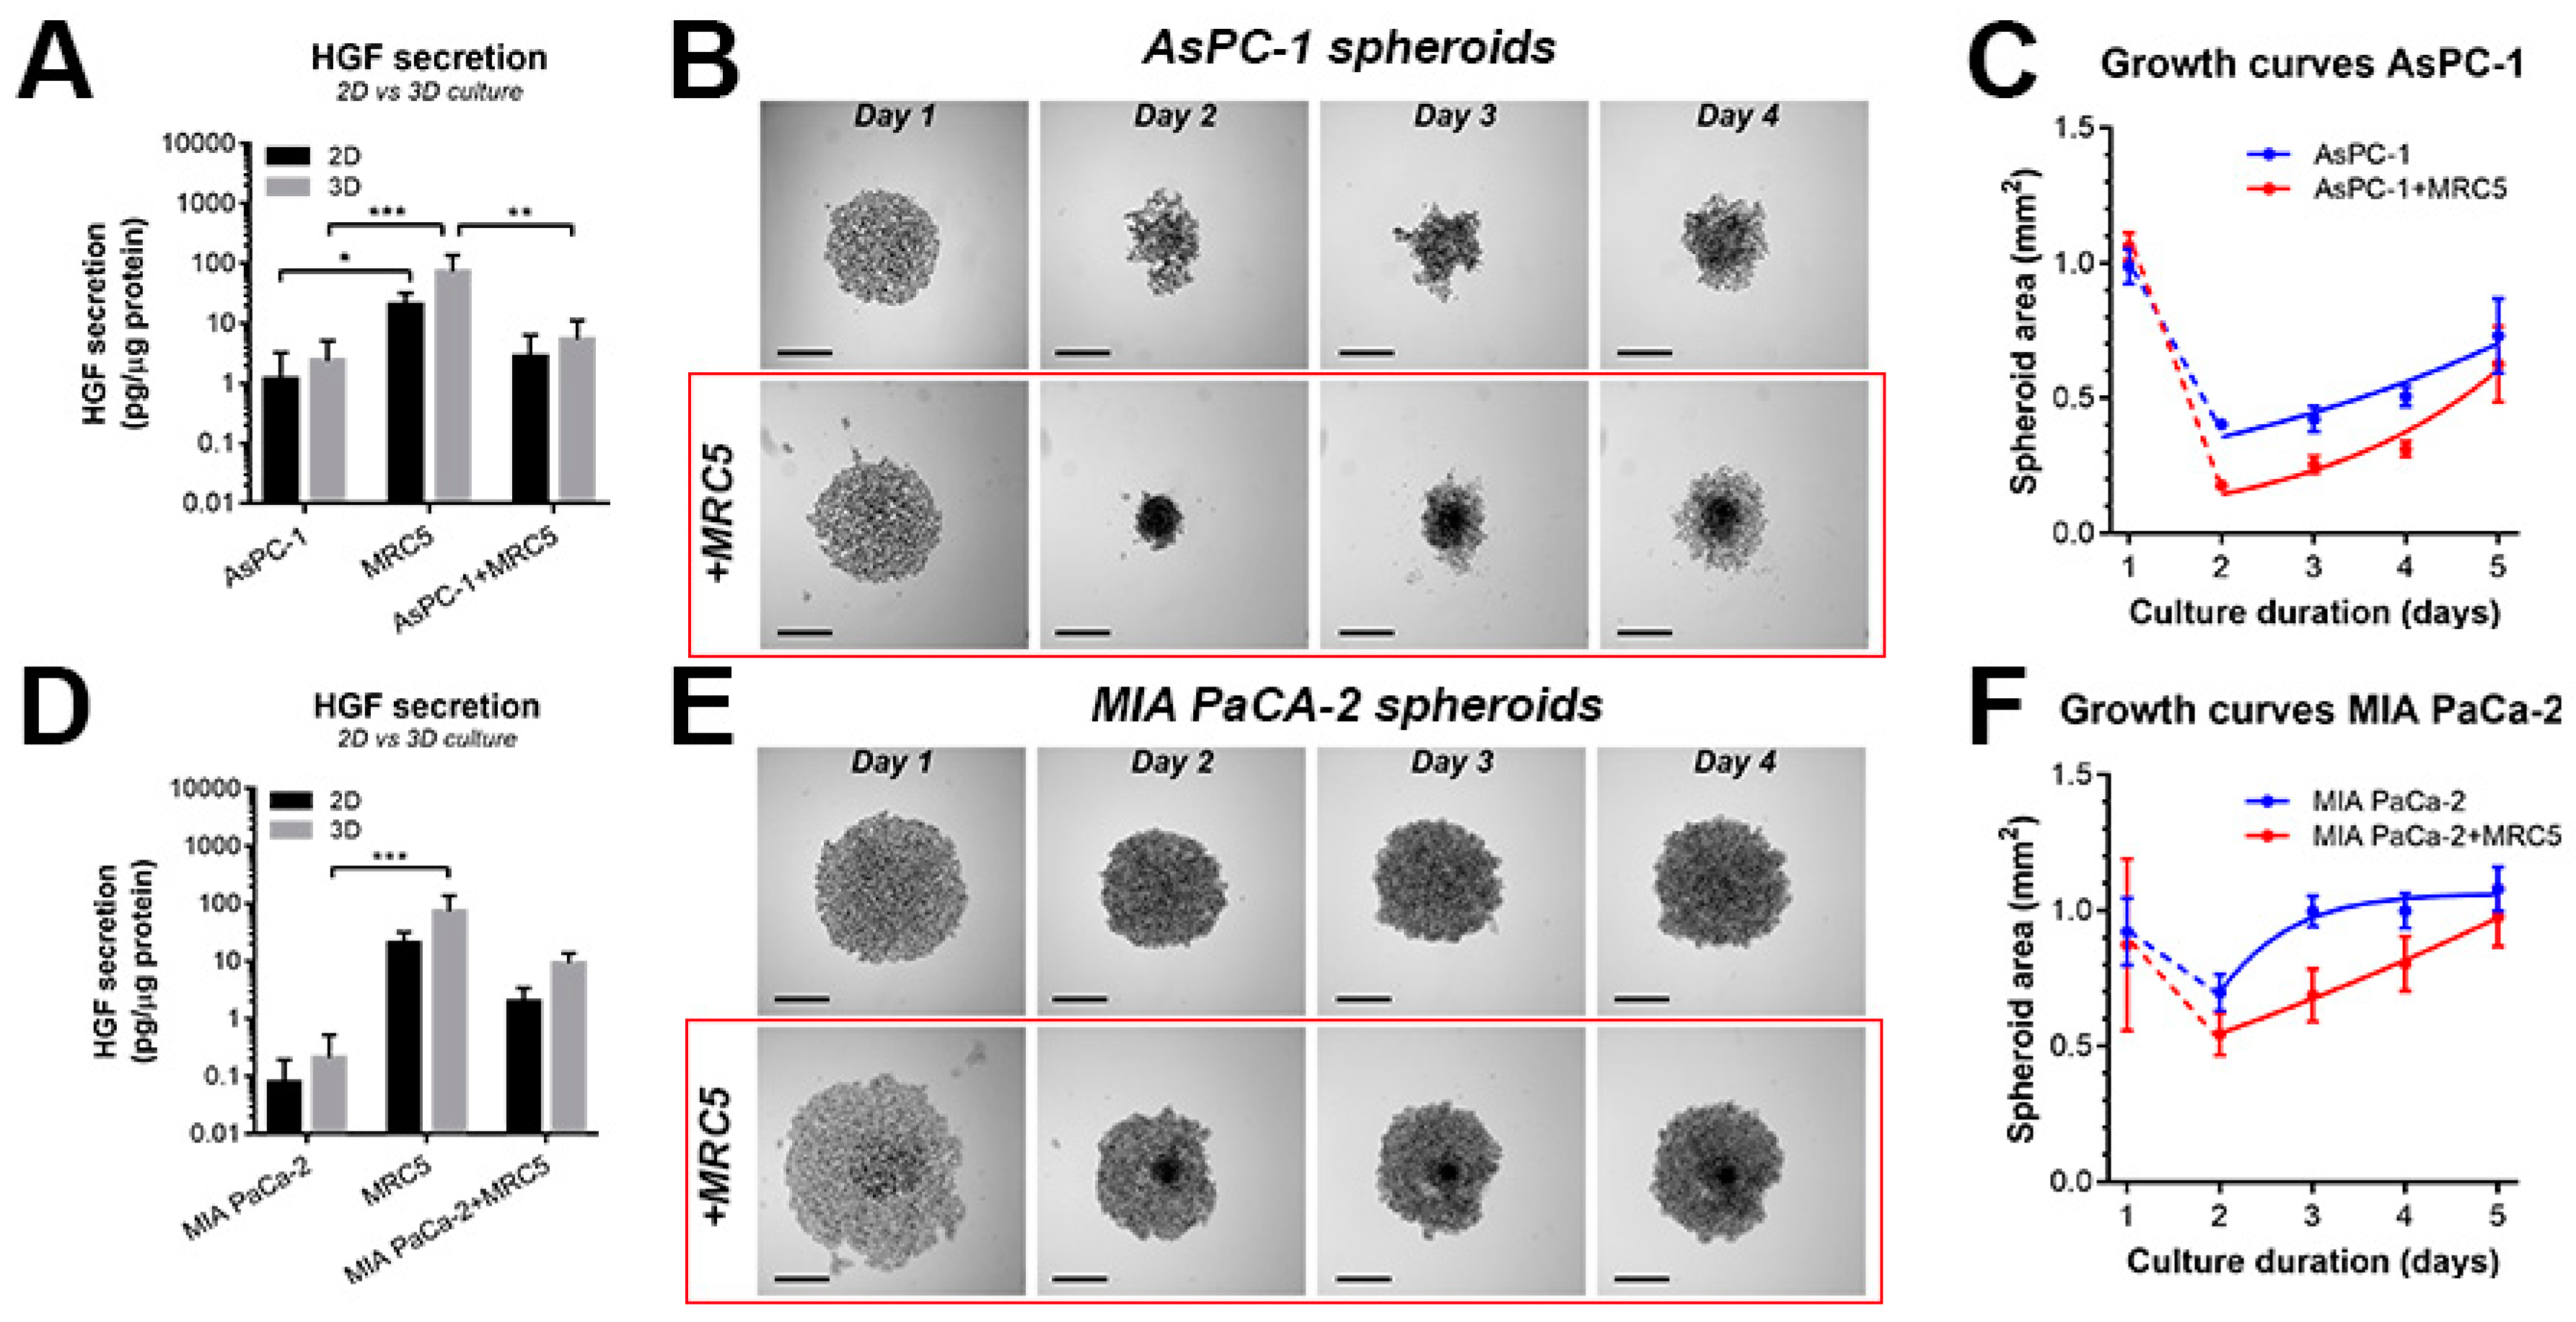
Abstract
1. Introduction
2. Results
2.1. Characterization of Heterotypic Spheroids Comprising PDAC Cells and Fibroblasts
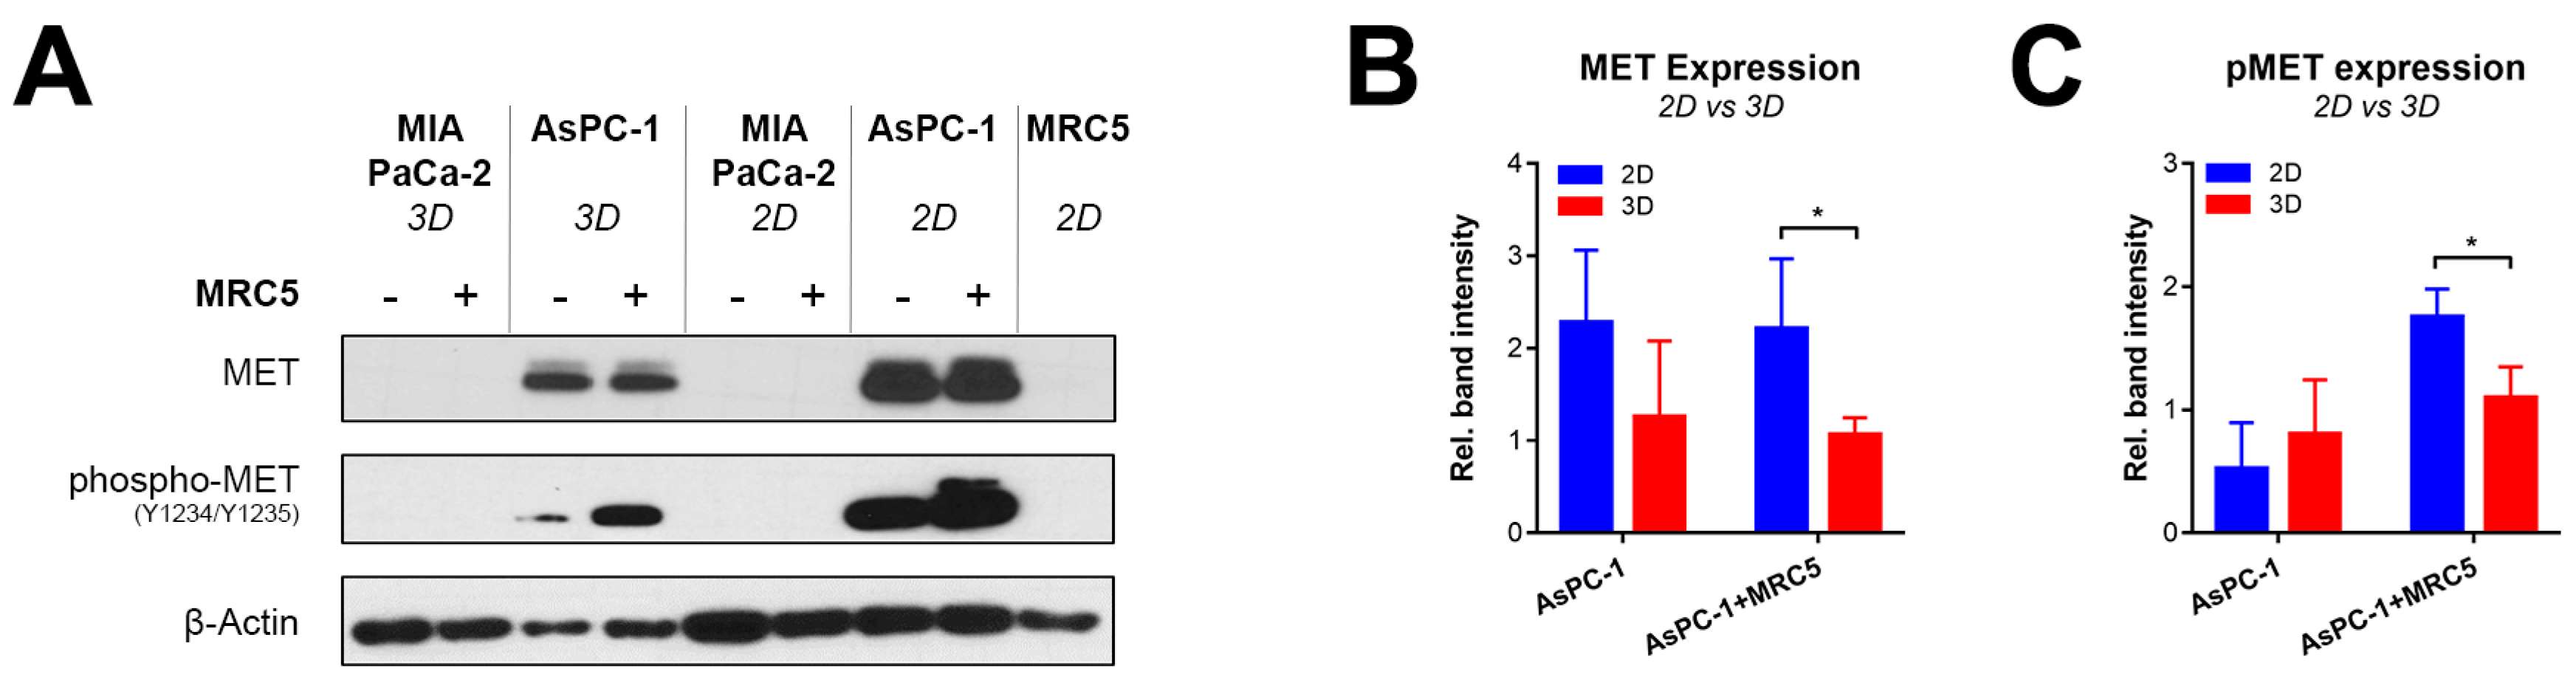
2.2. Recapitulating HGF-MET Signaling in Heterotypic PDAC Spheroids
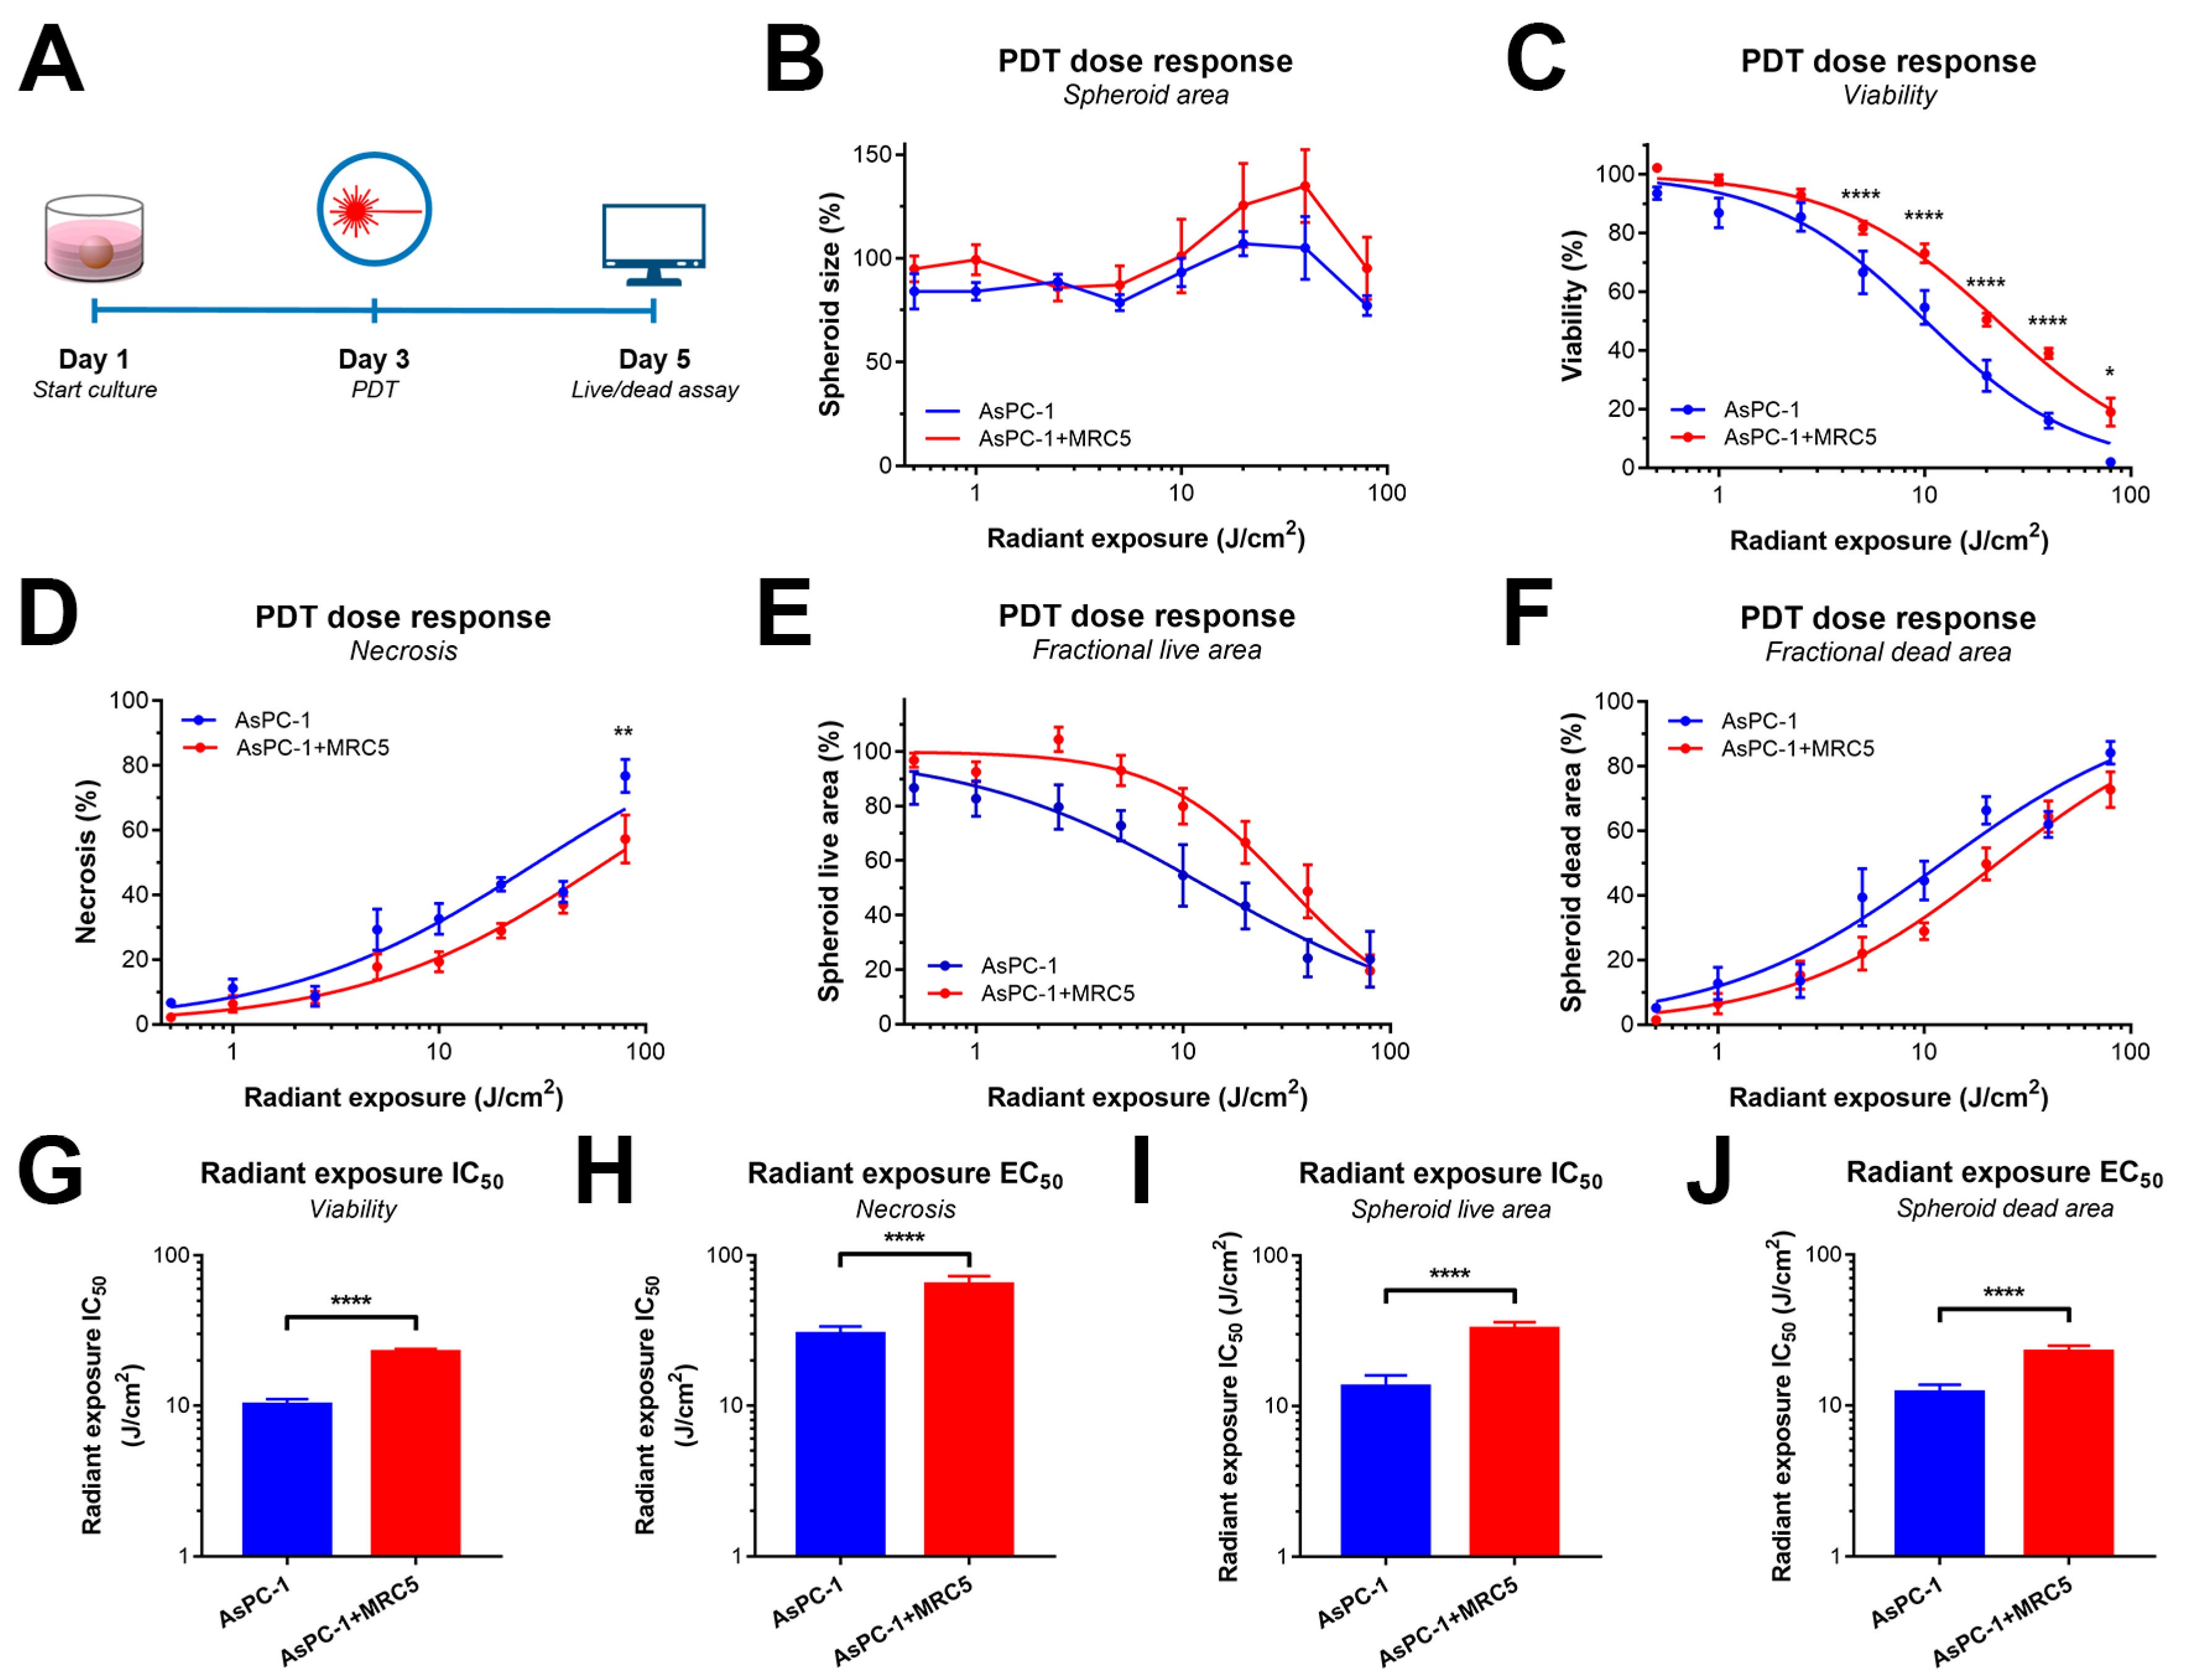
2.3. PDT Efficacy Is Reduced by the Presence of MRC5 Fibroblasts in PDAC Spheroids
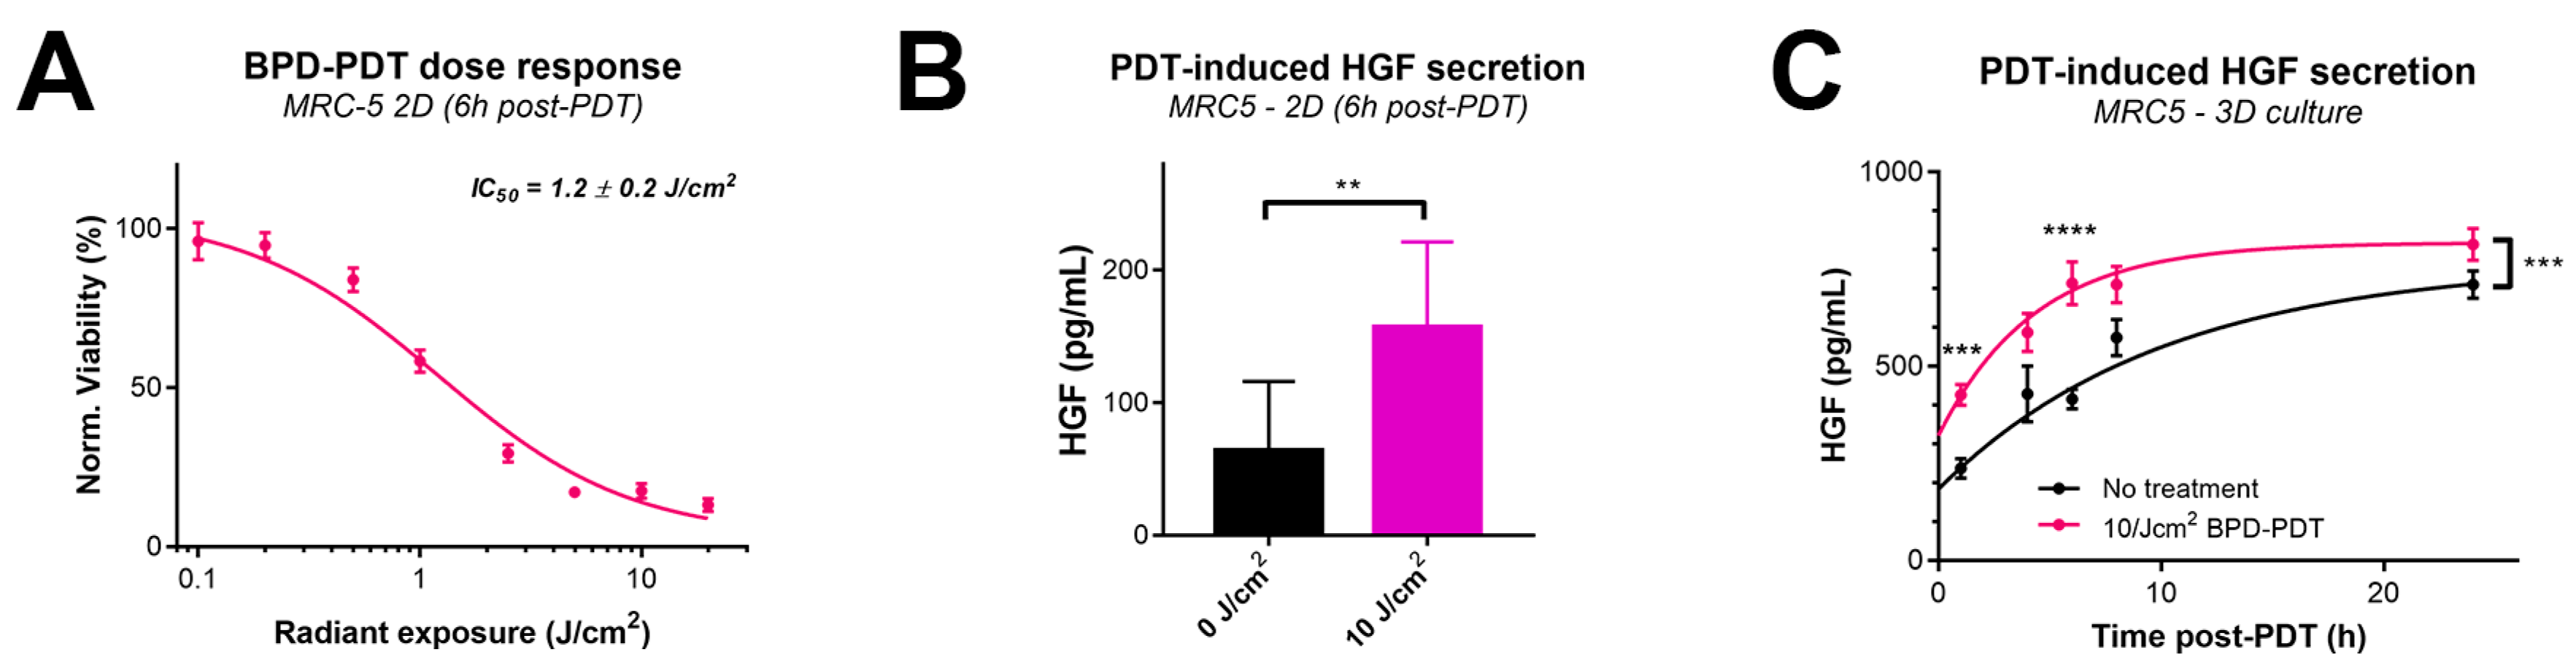
2.4. PDT Drives Paracrine MET Signaling by Inducing HGF Secretion by MRC5 Fibroblasts
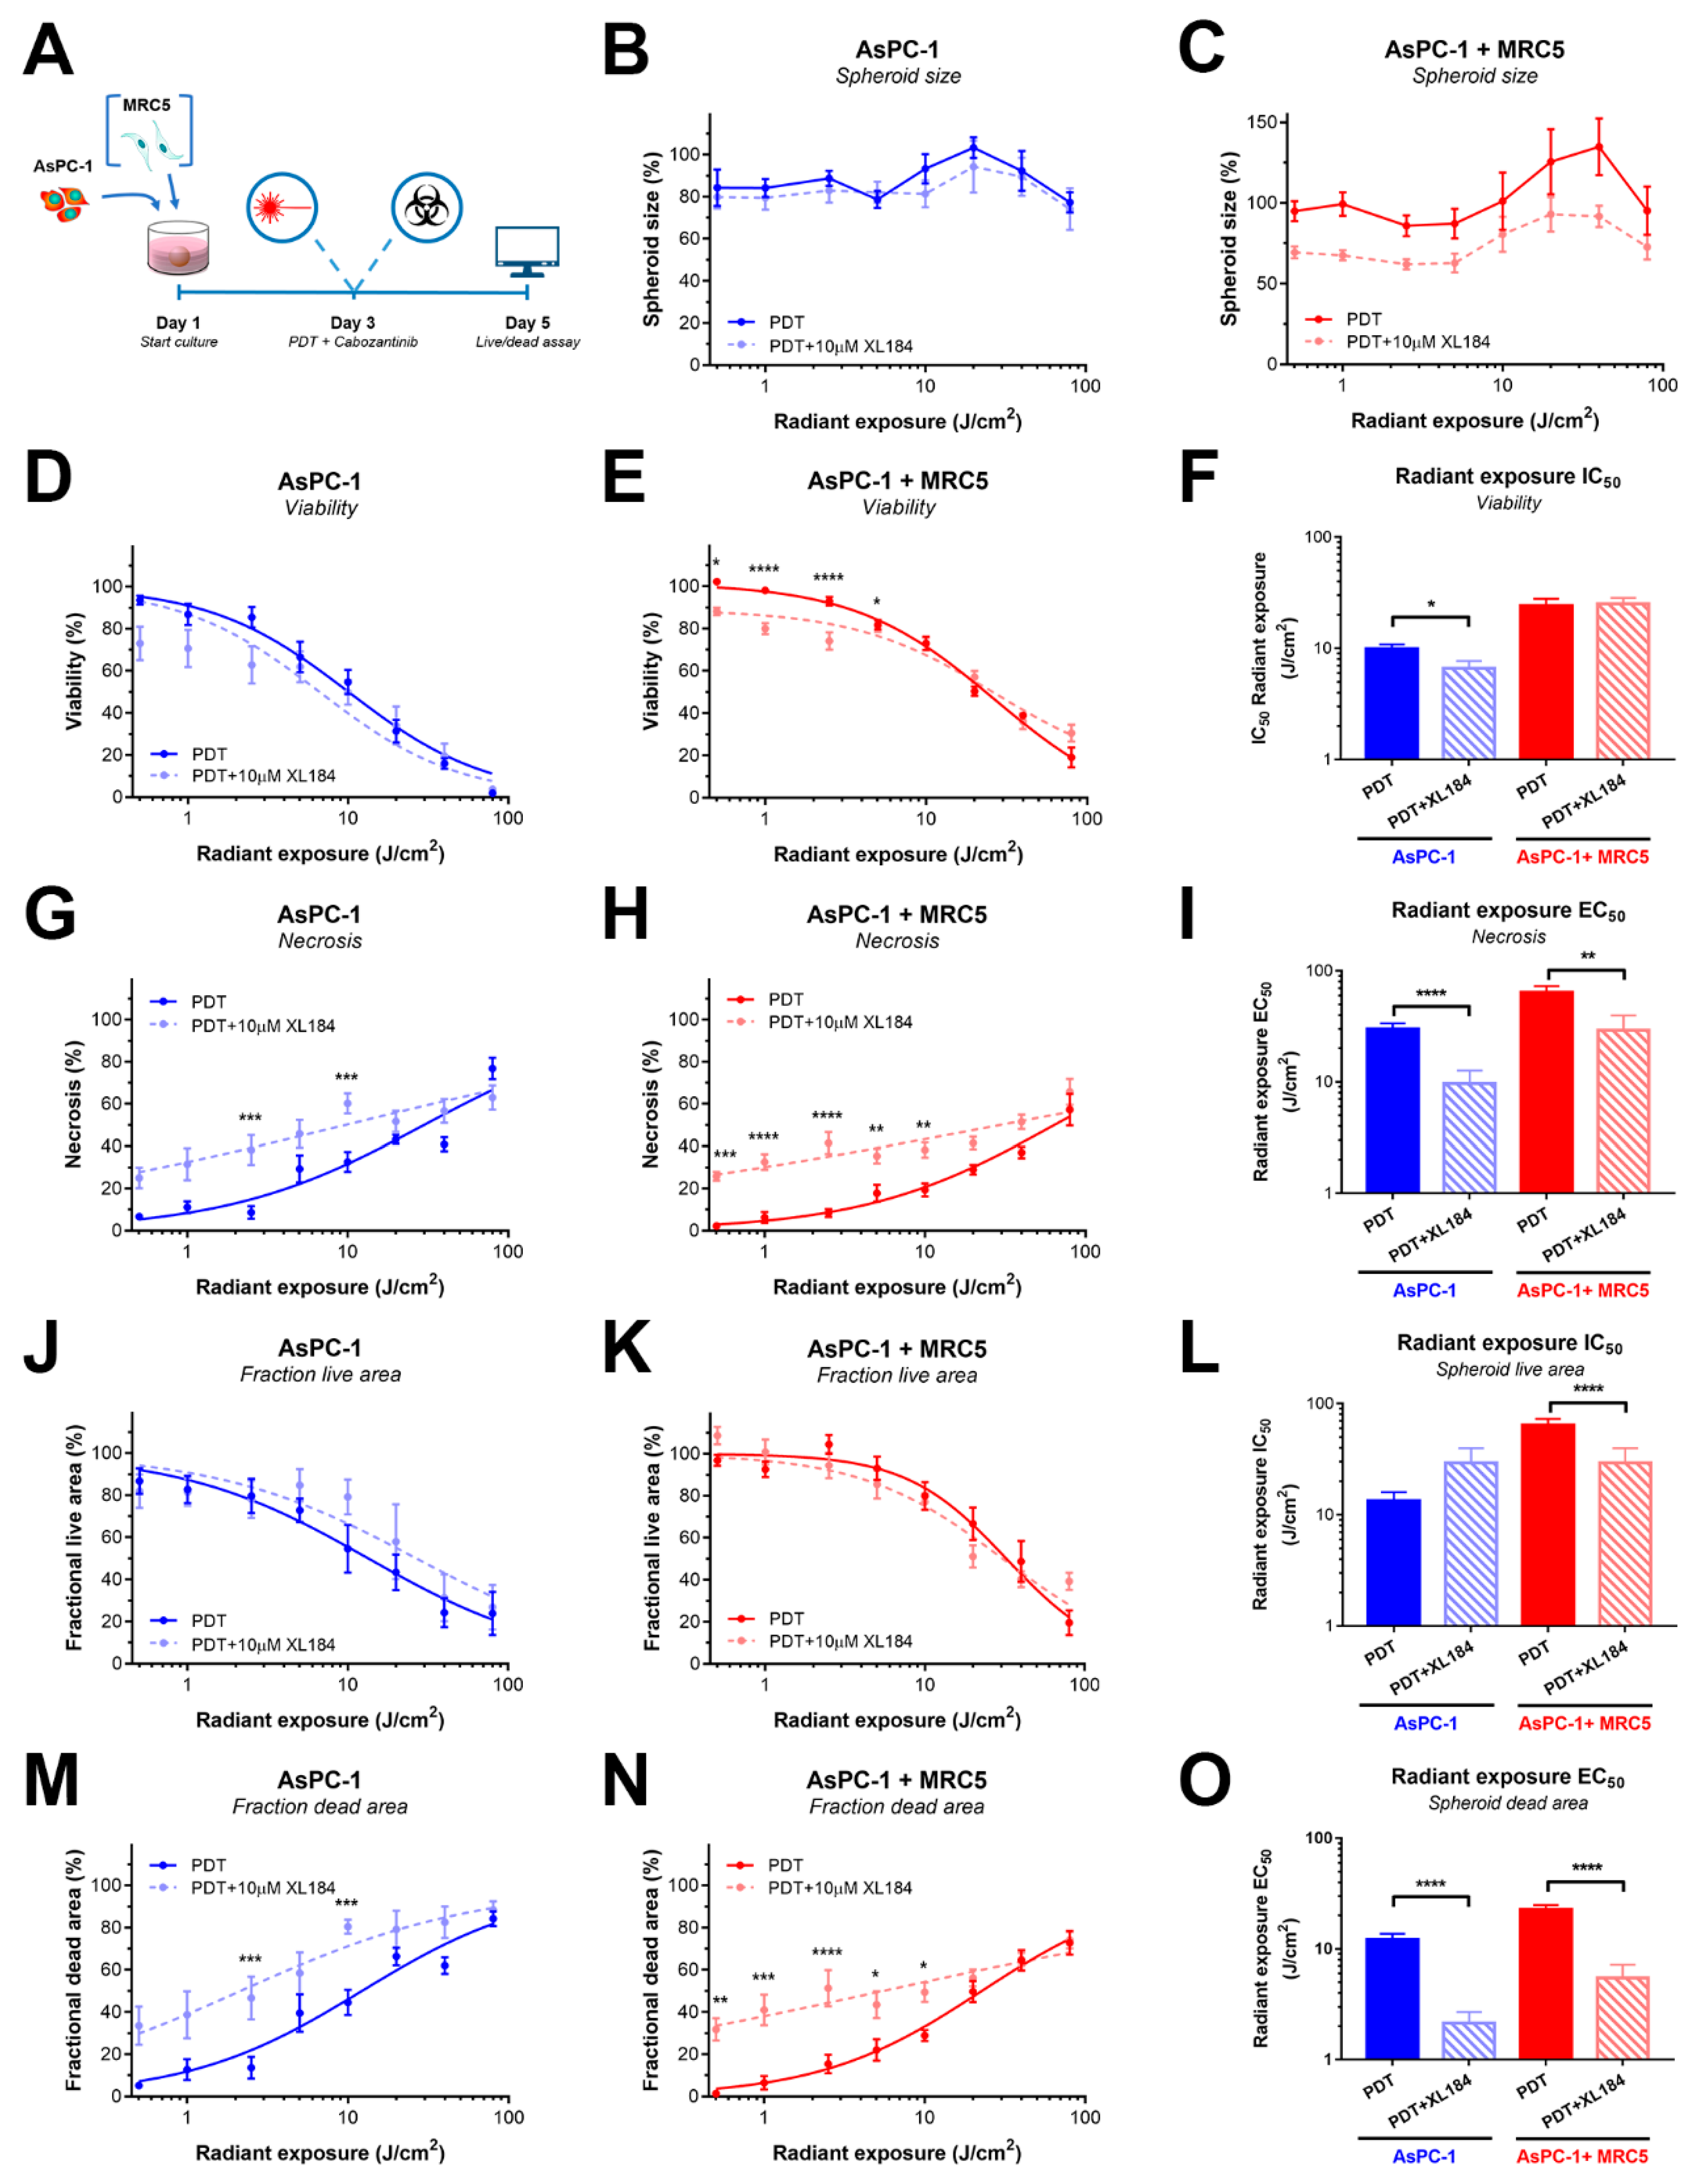
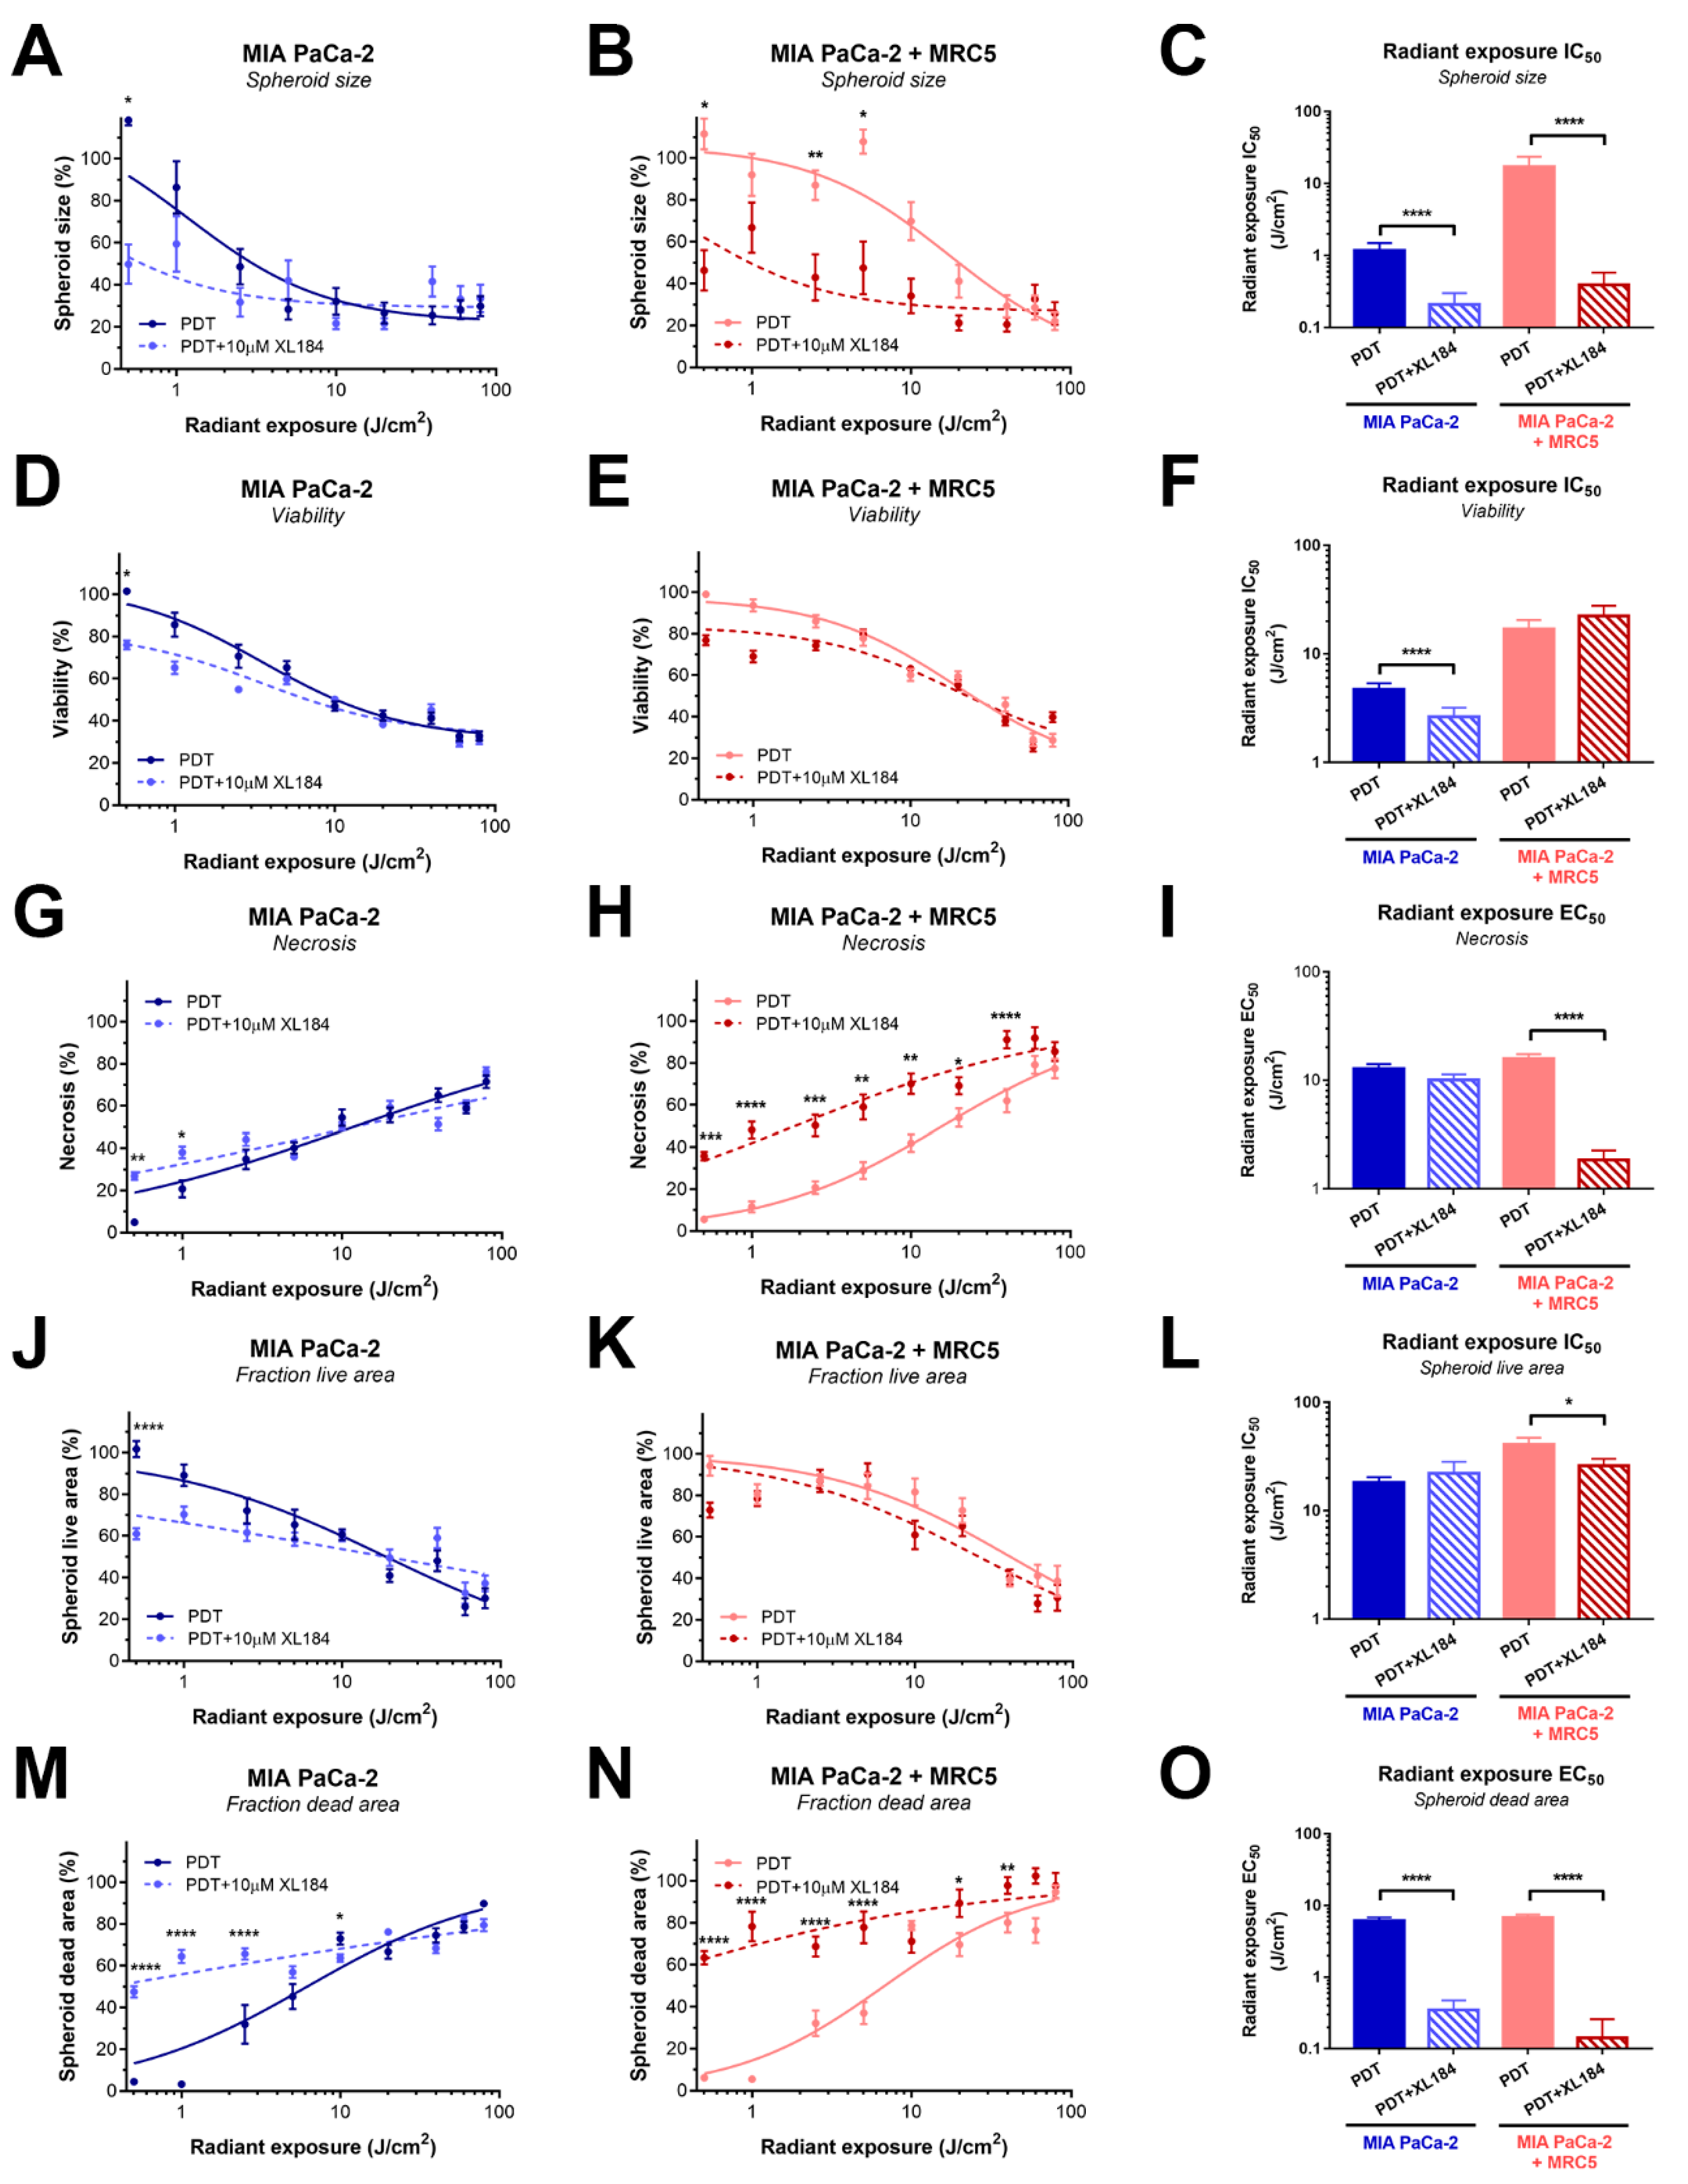
2.5. Inhibiting MET Phosphorylation with Cabozantinib Significantly Improves PDT Efficacy
3. Discussion
4. Materials and Methods
4.1. Cell Culture
4.2. Tracking of Cell Populations in Spheroid Cultures
4.3. Immunoblotting
4.4. Enzyme-Linked Immunosorbent Assay
4.5. Treatments
4.6. Multiparametric Analysis of Treatment Response
4.7. Statistical Analysis
5. Conclusions
Supplementary Materials
Author Contributions
Funding
Conflicts of Interest
References
- Ryan, D.P.; Hong, T.S.; Bardeesy, N. Pancreatic adenocarcinoma. N. Engl. J. Med. 2014, 371, 1039–1049. [Google Scholar] [CrossRef]
- Lee, J.-C.; Kim, J.W.; Ahn, S.; Kim, H.W.; Lee, J.; Kim, Y.H.; Paik, K.-H.; Kim, J.; Hwang, J.-H. Optimal dose reduction of FOLFIRINOX for preserving tumour response in advanced pancreatic cancer: Using cumulative relative dose intensity. Eur. J. Cancer 2017, 76, 125–133. [Google Scholar] [CrossRef] [PubMed]
- Chllamma, M.K.; Cook, N.; Dhani, N.C.; Giby, K.; Dodd, A.; Wang, L.; Hedley, D.W.; Moore, M.J.; Knox, J.J. FOLFIRINOX for advanced pancreatic cancer: The Princess Margaret Cancer Centre experience. Br. J. Cancer 2016, 115, 649–654. [Google Scholar] [CrossRef] [PubMed]
- Faris, J.E.; Blaszkowsky, L.S.; McDermott, S.; Guimaraes, A.R.; Szymonifka, J.; Huynh, M.A.; Ferrone, C.R.; Wargo, J.A.; Allen, J.N.; Dias, L.E.; et al. FOLFIRINOX in Locally Advanced Pancreatic Cancer: The Massachusetts General Hospital Cancer Center Experience. Oncologist 2013, 18, 543–548. [Google Scholar] [CrossRef] [PubMed]
- Von Hoff, D.D.; Ervin, T.; Arena, F.P.; Chiorean, E.G.; Infante, J.; Moore, M.; Seay, T.; Tjulandin, S.A.; Ma, W.W.; Saleh, M.N.; et al. Increased Survival in Pancreatic Cancer with nab-Paclitaxel plus Gemcitabine. N. Engl. J. Med. 2013, 369, 1691–1703. [Google Scholar] [CrossRef] [PubMed]
- Pusceddu, S.; Ghidini, M.; Torchio, M.; Corti, F.; Tomasello, G.; Niger, M.; Prinzi, N.; Nichetti, F.; Coinu, A.; Di Bartolomeo, M.; et al. Comparative Effectiveness of Gemcitabine plus Nab-Paclitaxel and FOLFIRINOX in the First-Line Setting of Metastatic Pancreatic Cancer: A Systematic Review and Meta-Analysis. Cancers 2019, 11, 484. [Google Scholar] [CrossRef]
- Yakes, F.M.; Chen, J.; Tan, J.; Yamaguchi, K.; Shi, Y.; Yu, P.; Qian, F.; Chu, F.; Bentzien, F.; Cancilla, B.; et al. Cabozantinib (XL184), a Novel MET and VEGFR2 Inhibitor, Simultaneously Suppresses Metastasis, Angiogenesis, and Tumor Growth. Mol. Cancer Ther. 2011, 10, 2298–2308. [Google Scholar] [CrossRef]
- Hage, C.; Rausch, V.; Giese, N.; Giese, T.; Schönsiegel, F.; Labsch, S.; Nwaeburu, C.; Mattern, J.; Gladkich, J.; Herr, I. The novel c-Met inhibitor cabozantinib overcomes gemcitabine resistance and stem cell signaling in pancreatic cancer. Cell Death Dis. 2013, 4, e627. [Google Scholar] [CrossRef]
- Li, C.; Wu, J.-J.; Hynes, M.; Dosch, J.; Sarkar, B.; Welling, T.H.; Pasca di Magliano, M.; Simeone, D.M. c-Met is a marker of pancreatic cancer stem cells and therapeutic target. Gastroenterology 2011, 141, 2218–2227.e5. [Google Scholar] [CrossRef]
- Zhen, D.B.; Griffith, K.A.; Ruch, J.M.; Camphausen, K.; Savage, J.E.; Kim, E.J.; Sahai, V.; Simeone, D.M.; Zalupski, M.M. A phase I trial of cabozantinib and gemcitabine in advanced pancreatic cancer. Investig. New Drugs 2016, 34, 733–739. [Google Scholar] [CrossRef]
- Huggett, M.T.; Jermyn, M.; Gillams, A.; Illing, R.; Mosse, S.; Novelli, M.; Kent, E.; Bown, S.G.; Hasan, T.; Pogue, B.W.; et al. Phase I/II study of verteporfin photodynamic therapy in locally advanced pancreatic cancer. Br. J. Cancer 2014, 110, 1698–1704. [Google Scholar] [CrossRef] [PubMed]
- Celli, J.P.; Spring, B.Q.; Rizvi, I.; Evans, C.L.; Samkoe, K.S.; Verma, S.; Pogue, B.W.; Hasan, T. Imaging and photodynamic therapy: Mechanisms, monitoring, and optimization. Chem. Rev. 2010, 110, 2795–2838. [Google Scholar] [CrossRef] [PubMed]
- Broekgaarden, M.; Weijer, R.; van Gulik, T.M.; Hamblin, M.R.; Heger, M. Tumor cell survival pathways activated by photodynamic therapy: A molecular basis for pharmacological inhibition strategies. Cancer Metastasis Rev. 2015, 34, 643–690. [Google Scholar] [CrossRef] [PubMed]
- Castano, A.P.; Mroz, P.; Hamblin, M.R. Photodynamic therapy and anti-tumour immunity. Nat. Rev. Cancer 2006, 6, 535–545. [Google Scholar] [CrossRef]
- Obaid, G.; Broekgaarden, M.; Bulin, A.-L.; Huang, H.-C.; Kuriakose, J.; Liu, J.; Hasan, T. Photonanomedicine: A convergence of photodynamic therapy and nanotechnology. Nanoscale 2016, 8, 12471–12503. [Google Scholar] [CrossRef]
- Celli, J.P.; Solban, N.; Liang, A.; Pereira, S.P.; Hasan, T. Verteporfin-based photodynamic therapy overcomes gemcitabine insensitivity in a panel of pancreatic cancer cell lines. Lasers Surg. Med. 2011, 43, 565–574. [Google Scholar] [CrossRef]
- Rizvi, I.; Celli, J.P.; Evans, C.L.; Abu-Yousif, A.O.; Muzikansky, A.; Pogue, B.W.; Finkelstein, D.; Hasan, T. Synergistic enhancement of carboplatin efficacy with photodynamic therapy in a three-dimensional model for micrometastatic ovarian cancer. Cancer Res. 2010, 70, 9319–9328. [Google Scholar] [CrossRef]
- Broekgaarden, M.; Rizvi, I.; Bulin, A.-L.; Petrovic, L.; Goldschmidt, R.; Celli, J.P.; Hasan, T. Neoadjuvant photodynamic therapy augments immediate and prolonged oxaliplatin efficacy in metastatic pancreatic cancer organoids. Oncotarget 2018, 9, 13009–13022. [Google Scholar] [CrossRef]
- Huang, H.-C.; Mallidi, S.; Liu, J.; Chiang, C.-T.; Mai, Z.; Goldschmidt, R.; Ebrahim-Zadeh, N.; Rizvi, I.; Hasan, T. Photodynamic Therapy Synergizes with Irinotecan to Overcome Compensatory Mechanisms and Improve Treatment Outcomes in Pancreatic Cancer. Cancer Res. 2016, 76, 1066–1077. [Google Scholar] [CrossRef]
- Broekgaarden, M.; Weijer, R.; van Wijk, A.C.; Cox, R.C.; Egmond, M.R.; Hoebe, R.; van Gulik, T.M.; Heger, M. Photodynamic Therapy with Liposomal Zinc Phthalocyanine and Tirapazamine Increases Tumor Cell Death via DNA Damage. J. Biomed. Nanotechnol. 2017, 13, 204–220. [Google Scholar] [CrossRef]
- Weyergang, A.; Selbo, P.K.; Berg, K. Sustained ERK inhibition by EGFR targeting therapies is a predictive factor for synergistic cytotoxicity with PDT as neoadjuvant therapy. Biochim. Biophys. Acta 2013, 1830, 2659–2670. [Google Scholar] [CrossRef] [PubMed]
- Edmonds, C.; Hagan, S.; Gallagher-Colombo, S.M.; Busch, T.M.; Cengel, K.A. Photodynamic therapy activated signaling from epidermal growth factor receptor and STAT3: Targeting survival pathways to increase PDT efficacy in ovarian and lung cancer. Cancer Biol. Ther. 2012, 13, 1463–1470. [Google Scholar] [CrossRef] [PubMed]
- Broekgaarden, M.; Anbil, S.; Bulin, A.-L.; Obaid, G.; Mai, Z.; Baglo, Y.; Rizvi, I.; Hasan, T. Modulation of redox metabolism negates cancer-associated fibroblasts-induced treatment resistance in a heterotypic 3D culture platform of pancreatic cancer. Biomaterials 2019, 222, 119421. [Google Scholar] [CrossRef] [PubMed]
- Spring, B.Q.; Bryan Sears, R.; Zheng, L.Z.; Mai, Z.; Watanabe, R.; Sherwood, M.E.; Schoenfeld, D.A.; Pogue, B.W.; Pereira, S.P.; Villa, E.; et al. A photoactivable multi-inhibitor nanoliposome for tumour control and simultaneous inhibition of treatment escape pathways. Nat. Nanotechnol. 2016, 11, 378–387. [Google Scholar] [CrossRef] [PubMed]
- Matsunaga, T.; Gohda, E.; Takebe, T.; Wu, Y.L.; Iwao, M.; Kataoka, H.; Yamamoto, I. Expression of Hepatocyte Growth Factor Is Up-Regulated through Activation of a cAMP-Mediated Pathway. Exp. Cell Res. 1994, 210, 326–335. [Google Scholar] [CrossRef]
- Celli, J.P.; Rizvi, I.; Blanden, A.R.; Massodi, I.; Glidden, M.D.; Pogue, B.W.; Hasan, T. An imaging-based platform for high-content, quantitative evaluation of therapeutic response in 3D tumour models. Sci. Rep. 2014, 4, 3751. [Google Scholar] [CrossRef]
- Bulin, A.-L.; Broekgaarden, M.; Hasan, T. Comprehensive high-throughput image analysis for therapeutic efficacy of architecturally complex heterotypic organoids. Sci. Rep. 2017, 7, 1–12. [Google Scholar] [CrossRef]
- Celli, J.P.; Rizvi, I.; Evans, C.L.; Abu-Yousif, A.O.; Hasan, T. Quantitative imaging reveals heterogeneous growth dynamics and treatment-dependent residual tumor distributions in a three-dimensional ovarian cancer model. J. Biomed. Opt. 2010, 15, 051603. [Google Scholar] [CrossRef][Green Version]
- Broekgaarden, M.; Weijer, R.; Krekorian, M.; IJssel, B.; Kos, M.; Alles, L.K.; Wijk, A.C.; Bikadi, Z.; Hazai, E.; Gulik, T.M.; et al. Inhibition of hypoxia-inducible factor 1 with acriflavine sensitizes hypoxic tumor cells to photodynamic therapy with zinc phthalocyanine-encapsulating cationic liposomes. Nano Res. 2016, 6, 1639–1662. [Google Scholar] [CrossRef]
- Weijer, R.; Broekgaarden, M.; Krekorian, M.; Alles, L.K.; van Wijk, A.C.; Mackaaij, C.; Verheij, J.; van der Wal, A.C.; van Gulik, T.M.; Storm, G.; et al. Inhibition of hypoxia inducible factor 1 and topoisomerase with acriflavine sensitizes perihilar cholangiocarcinomas to photodynamic therapy. Oncotarget 2016, 7, 3341–3356. [Google Scholar] [CrossRef]
- Broekgaarden, M.; Kos, M.; Jurg, F.A.; van Beek, A.A.; van Gulik, T.M.; Heger, M. Inhibition of NF-κB in Tumor Cells Exacerbates Immune Cell Activation Following Photodynamic Therapy. Int. J. Mol. Sci. 2015, 16, 19960–19977. [Google Scholar] [CrossRef] [PubMed]
- Casas, A.; Di Venosa, G.; Hasan, T. Al Batlle, Mechanisms of resistance to photodynamic therapy. Curr. Med. Chem. 2011, 18, 2486–2515. [Google Scholar] [CrossRef] [PubMed]
- Luna, M.C.; Wong, S.; Gomer, C.J. Photodynamic therapy mediated induction of early response genes. Cancer Res. 1994, 54, 1374–1380. [Google Scholar] [PubMed]
- Gomer, C.J.; Ryter, S.W.; Ferrario, A.; Rucker, N.; Wong, S.; Fisher, A.M. Photodynamic therapy-mediated oxidative stress can induce expression of heat shock proteins. Cancer Res. 1996, 56, 2355–2360. [Google Scholar] [PubMed]
- Kocanova, S.; Buytaert, E.; Matroule, J.-Y.; Piette, J.; Golab, J.; de Witte, P.; Agostinis, P. Induction of heme-oxygenase 1 requires the p38MAPK and PI3K pathways and suppresses apoptotic cell death following hypericin-mediated photodynamic therapy. Apoptosis 2007, 12, 731–741. [Google Scholar] [CrossRef]
- Coupienne, I.; Bontems, S.; Dewaele, M.; Rubio, N.; Habraken, Y.; Fulda, S.; Agostinis, P.; Piette, J. NF-kappaB inhibition improves the sensitivity of human glioblastoma cells to 5-aminolevulinic acid-based photodynamic therapy. Biochem. Pharmacol. 2011, 81, 606–616. [Google Scholar] [CrossRef]
- Montesano, R.; Matsumoto, K.; Nakamura, T.; Orci, L. Identification of a fibroblast-derived epithelial morphogen as hepatocyte growth factor. Cell 1991, 67, 901–908. [Google Scholar]
- Andermarcher, E.; Surani, M.A.; Gherardi, E. Co-expression of the HGF/SF and c-met genes during early mouse embryogenesis precedes reciprocal expression in adjacent tissues during organogenesis. Dev. Genet. 1996, 18, 254–266. [Google Scholar] [CrossRef]
- Gherardi, E.; Birchmeier, W.; Birchmeier, C.; Vande Woude, G. Targeting MET in cancer: Rationale and progress. Nat. Rev. Cancer 2012, 12, 89–103. [Google Scholar] [CrossRef]
- Di Renzo, M.F.; Poulsom, R.; Olivero, M.; Comoglio, P.M.; Lemoine, N.R. Expression of the Met/hepatocyte growth factor receptor in human pancreatic cancer. Cancer Res. 1995, 55, 1129–1138. [Google Scholar]
- Ebert, M.; Yokoyama, M.; Friess, H.; Büchler, M.W.; Korc, M. Coexpression of the c-met proto-oncogene and hepatocyte growth factor in human pancreatic cancer. Cancer Res. 1994, 54, 5775–5778. [Google Scholar] [PubMed]
- Cuneo, K.C.; Morgan, M.A.; Griffith, K.A.; Hawkins, P.G.; Greenson, J.K.; Ben-Josef, E.; Lawrence, T.S.; Zalupski, M.M. Prognostic Value of c-MET Expression in Patients with Pancreatic Cancer Receiving Adjuvant and Neoadjuvant Chemoradiation Therapy. Int. J. Radiat. Oncol. Biol. Phys. 2018, 100, 490–497. [Google Scholar] [CrossRef] [PubMed]
- Abou-Alfa, G.K.; Meyer, T.; Cheng, A.-L.; El-Khoueiry, A.B.; Rimassa, L.; Ryoo, B.-Y.; Cicin, I.; Merle, P.; Chen, Y.; Park, J.-W.; et al. Cabozantinib in Patients with Advanced and Progressing Hepatocellular Carcinoma. N. Engl. J. Med. 2018, 379, 54–63. [Google Scholar] [CrossRef] [PubMed]
- Fisher, C.; Obaid, G.; Niu, C.; Foltz, W.; Goldstein, A.; Hasan, T.; Lilge, L. Liposomal Lapatinib in Combination with Low-Dose Photodynamic Therapy for the Treatment of Glioma. J. Clin. Med. 2019, 8, 2214. [Google Scholar] [CrossRef]
- Sousa, C.M.; Biancur, D.E.; Wang, X.; Halbrook, C.J.; Sherman, M.H.; Zhang, L.; Kremer, D.; Hwang, R.F.; Witkiewicz, A.K.; Ying, H.; et al. Pancreatic stellate cells support tumour metabolism through autophagic alanine secretion. Nature 2016, 536, 479–483. [Google Scholar] [CrossRef] [PubMed]
- Öhlund, D.; Handly-Santana, A.; Biffi, G.; Elyada, E.; Almeida, A.S.; Ponz-Sarvise, M.; Corbo, V.; Oni, T.E.; Hearn, S.A.; Lee, E.J.; et al. Distinct populations of inflammatory fibroblasts and myofibroblasts in pancreatic cancer. J. Exp. Med. 2017, 214, 579–596. [Google Scholar] [CrossRef] [PubMed]
- Tsai, S.; McOlash, L.; Palen, K.; Johnson, B.; Duris, C.; Yang, Q.; Dwinell, M.B.; Hunt, B.; Evans, D.B.; Gershan, J.; et al. Development of primary human pancreatic cancer organoids, matched stromal and immune cells and 3D tumor microenvironment models. BMC Cancer 2018, 18, 335. [Google Scholar] [CrossRef]
- Bulin, A.-L.; Broekgaarden, M.; Simeone, D.; Hasan, T. Low dose photodynamic therapy harmonizes with radiation therapy to induce beneficial effects on pancreatic heterocellular spheroids. Oncotarget 2019, 10, 2625–2643. [Google Scholar] [CrossRef]
- Broekgaarden, M.; Bulin, A.-L.; Frederick, J.; Mai, Z.; Hasan, T. Tracking photodynamic- and chemotherapy-induced redox state perturbations in 3D culture models of pancreatic cancer: A tool for identifying therapy-induced metabolic changes. J. Clin. Med. 2019, 8, 1399. [Google Scholar] [CrossRef]
- Obaid, G.; Bano, S.; Mallidi, S.; Broekgaarden, M.; Kuriakose, J.; Silber, Z.; Bulin, A.-L.; Wang, Y.; Mai, Z.; Jin, W.; et al. Impacting pancreatic cancer therapy in heterotypic in vitro organoids and in vivo tumors with specificity-tuned, NIR-activable photoimmuno-nanoconjugates: Towards conquering desmoplasia? Nano Lett. 2019, 19, 7573–7587. [Google Scholar] [CrossRef]
- Sulpice, E.; Ding, S.; Muscatelli-Groux, B.; Bergé, M.; Han, Z.C.; Plouet, J.; Tobelem, G.; Merkulova-Rainon, T. Cross-talk between the VEGF-A and HGF signalling pathways in endothelial cells. Biol. Cell 2009, 101, 525–539. [Google Scholar] [CrossRef] [PubMed]
- Grüllich, C. Cabozantinib: Multi-kinase Inhibitor of MET, AXL, RET, and VEGFR2. Recent Results Cancer Res. 2018, 211, 67–75. [Google Scholar] [CrossRef] [PubMed]
- Anbil, S.; Pigula, M.; Huang, H.-C.; Mallidi, S.; Broekgaarden, M.; Baglo, Y.; De Silva, P.; Simeone, D.M.; Mino-Kenudson, M.; Maytin, E.V.; et al. Vitamin D receptor activation and photodynamic priming enable durable low-dose chemotherapy. Mol. Cancer Ther. 2020. [Google Scholar] [CrossRef]


© 2020 by the authors. Licensee MDPI, Basel, Switzerland. This article is an open access article distributed under the terms and conditions of the Creative Commons Attribution (CC BY) license (http://creativecommons.org/licenses/by/4.0/).
Share and Cite
Broekgaarden, M.; Alkhateeb, A.; Bano, S.; Bulin, A.-L.; Obaid, G.; Rizvi, I.; Hasan, T. Cabozantinib Inhibits Photodynamic Therapy-Induced Auto- and Paracrine MET Signaling in Heterotypic Pancreatic Microtumors. Cancers 2020, 12, 1401. https://doi.org/10.3390/cancers12061401
Broekgaarden M, Alkhateeb A, Bano S, Bulin A-L, Obaid G, Rizvi I, Hasan T. Cabozantinib Inhibits Photodynamic Therapy-Induced Auto- and Paracrine MET Signaling in Heterotypic Pancreatic Microtumors. Cancers. 2020; 12(6):1401. https://doi.org/10.3390/cancers12061401
Chicago/Turabian StyleBroekgaarden, Mans, Ahmed Alkhateeb, Shazia Bano, Anne-Laure Bulin, Girgis Obaid, Imran Rizvi, and Tayyaba Hasan. 2020. "Cabozantinib Inhibits Photodynamic Therapy-Induced Auto- and Paracrine MET Signaling in Heterotypic Pancreatic Microtumors" Cancers 12, no. 6: 1401. https://doi.org/10.3390/cancers12061401
APA StyleBroekgaarden, M., Alkhateeb, A., Bano, S., Bulin, A.-L., Obaid, G., Rizvi, I., & Hasan, T. (2020). Cabozantinib Inhibits Photodynamic Therapy-Induced Auto- and Paracrine MET Signaling in Heterotypic Pancreatic Microtumors. Cancers, 12(6), 1401. https://doi.org/10.3390/cancers12061401