Article

MicroRNA Response and Toxicity of Potential Pathways in Human Colon Cancer Cells Exposed to Titanium Dioxide Nanoparticles

1
National Engineering Laboratory for Deep Process of Rice and Byproducts, College of Food Science and Engineering, Hunan Province Key Laboratory of Edible Forestry Resources Safety and Processing Utilization, Central South University of Forestry and Technology, Changsha 410004, China
2
Key Laboratory of Biological Nanomaterials and Devices, College of Packaging and Material Engineering, College of Life Sciences and Chemistry, Hunan University of Technology, Zhuzhou 412007, China
3
School of Chemistry and Food Engineering, Changsha University of Science and Technology, Changsha 410114, China
4
Department of Science and Laboratory Technology, Dares Salaam Institute of Technology, Dares Salaam P.O. Box 2958, Tanzania
5
School of Energy Science and Engineering, Central South University, Changsha 410083, China
*
Author to whom correspondence should be addressed.
Cancers 2020, 12(5), 1236; https://doi.org/10.3390/cancers12051236
Submission received: 1 March 2020 / Revised: 22 April 2020 / Accepted: 26 April 2020 / Published: 14 May 2020

Abstract

:
Titanium dioxide nanoparticles (TiO2-NPs) are widely used for biomedical and food applications, the toxicity of TiO2-NPs in vivo and in vitro has been elucidated, but the underlying cytotoxicity of TiO2-NPs against microRNA remains largely unknown. The purpose of this study was to analyze microRNA profiling induced by TiO2-NPs against NCM460 and HCT116 cell lines. Comparative analysis identified 34 and 24 microRNAs were significantly altered in the TiO2-NPs treated cells at concentrations of 3 μg/mL and 30 μg/mL, respectively. Functional classification demonstrated that a large proportion of genes involved in metabolism, human disease, and environmental information process were significantly upregulated by TiO2-NPs. Bioinformatics analysis suggested that microRNA 378 might be an early indicator of cellular response to exogenous stimuli with apoptotic signals. Furthermore, TiO2-NPs significantly altered the expression of microRNA 378b and 378g in HCT116 and NCM460 cell lines at different concentrations from 3 to 6 μg/mL. These concentrations elicit high-sensitivity of stimuli response in colon cancer cells when exposed to the slight doses of TiO2-NPs. Our study indicated that microRNAs 378b and 378g may play an important role in TiO2-NPs-mediated colonic cytotoxicity, which may provide a valuable insight into the molecular mechanisms of potential risks in colitis and colon cancer.

1. Introduction

Nanomaterials have unique physical, chemical, electronic, optical, and catalytic properties, which are widely used in chemical industry, biomedicine, energy, environment, food production, aerospace, and other important fields [1,2,3]. The increasing use of nanomaterials will inevitably lead to an increase in the exposure of nanomaterials in the ground, resulting in negative effects in the application process, and its potential impacts have gradually attracted people’s attention in human health and environmental complications [4,5,6,7]. In humans, drugs may induce toxicity leading to blood vessel division, causing contaminants or harmful microorganisms to enter into the human tissues or organs due to attachment to the nanomaterials, resulting in significant effects [4,6]. Over the past few decades, the field of nanotoxicity has significantly evolved through the booming of nanotechnology to address potential prolonged exposure of nanoparticles to the consumers through medical applications [5,6].
Titanium dioxide nanoparticles (TiO2-NPs) are widely used for biomedical applications, drug research and development design, food additives and packaging materials, and so forth [1,2,4,7,8]. Additionally, TiO2-NPs can enter the human body and induce toxicity into different organs including, liver [7,8,9], kidney [10,11], lung [12], brain [7,9,13], heart [14], ovary and testis [15,16,17]. In relation to this, inflammation is one among of the most important toxic mechanisms following TiO2-NPs exposure. However, in toxicological researches, oral exposure of TiO2-NPs to intestinal tract has not been well studied compared with skin contact or inhalation route due to lack of established global standards for toxicity levels [18].
Most of the TiO2-NPs entering the body are metabolized and absorbed by the intestine and their adverse effects on gastrointestinal tract in humans and animals are rarely concerned. Colon cancer and inflammatory bowel disease (IBD) are the most common occurring diseases worldwide which might be contributed by TiO2-NPs exposure in the intestines. Therefore, there is an urgent need to confirm the safety of TiO2-NPs in human intestines by considering an increasing number of TiO2-NPs exposures.
In recent years, microRNAs have attracted extensive attention in toxicology. MicroRNAs have been shown to play an important role in gene regulation of vertebrate genome [19,20,21]. It is predicted that microRNAs can regulate the expression of one-third of human genes [21,22]. Contrary, it has been found that nanoparticles can significantly alter the expression of microRNAs in cells [23,24,25]. Hence, regulation of microRNAs as a key post-transcriptional regulator has attracted much attention in the molecular mechanism of nanoparticles toxicology [23,24]. Additionally, microRNAs are considered as a "buffer" for impedance gene expression variation [26] and they help to maintain the robustness of biological processes [21,26]. In the face of stimuli caused by environmental changes, the regulation of microRNAs can be used to maintain biological functions, such as reinforcement of transcriptional programs and attenuation of aberrant transcripts in living organisms.
MicroRNAs may play important regulatory roles in gene expression and protein synthesis in biological systems, while TiO2-NPs are mainly digested and absorbed by the gastrointestinal tract. However, entrance of TiO2-NPs into the cells may lead to changes in miRNAs regulation and possibly body damage, these changes are urgently needed to be confirmed. Additionally, studying the damage and mechanism of TiO2-NPs on colon cells is of great significance in the prevention and treatment of colonic inflammation and colon cancer. Therefore, normal human colon cell lines (NCM460) and human colon cancer cells (HCT116) cell lines were used to investigate the effects of TiO2-NPs on microRNAs expression and correlating the expression of microRNAs with target genes in colon cells.

2. Materials and Methods

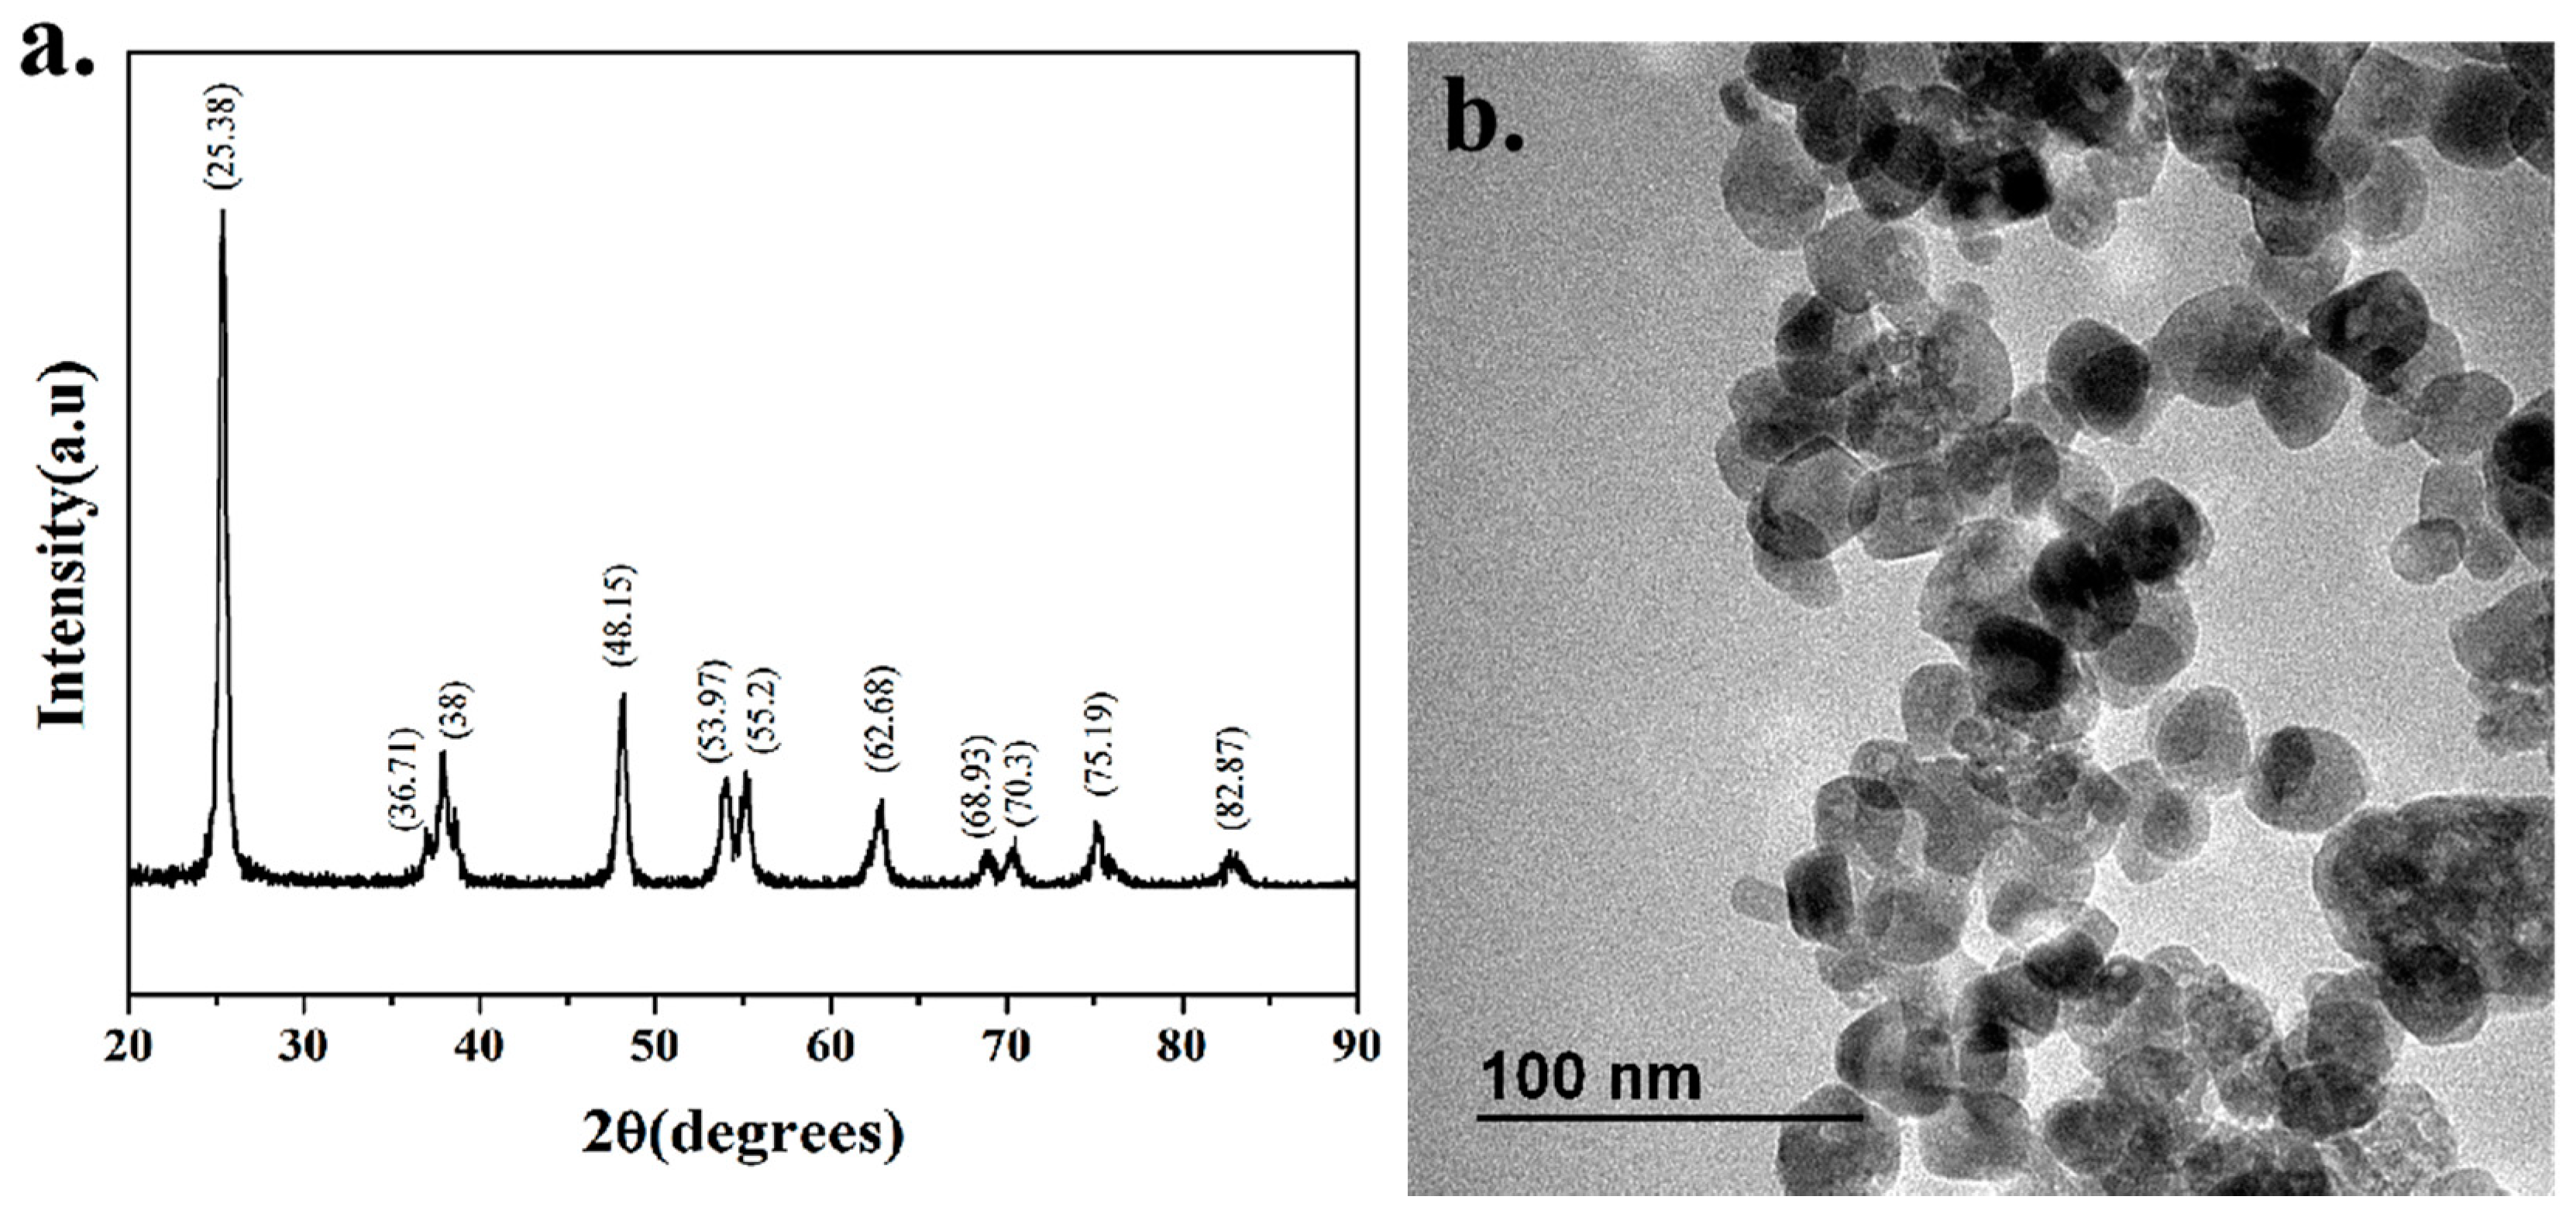
2.1. TiO2 Nanoparticles Characterization

TiO2-NPs of 25nm were applied in a concentration range of 3–60 μg/mL (Deke Daojin, Beijing, China). The morphology of nanoparticles was characterized by transmission electron microscopy (TEM) (JEOL Ltd., Tokyo, Japan) in dry form at Xiamen University, and the crystallized form of nanoparticles was characterized by X-ray diffraction (XRD) (BRUKER AXS GMBH, Karlsruhe, Germany).
For the preparation of TiO2-NPs exposure medium, powdered NPs were suspended in a serum-free 1640 basal medium solution, sonicated for 30 min before each use, and then added to the cell culture medium at test concentrations.

2.2. Cell Culture and Treatment

Human colon cancer cell lines (HCT116) and normal colon cell lines (NCM460) were provided by the College of Food Science and Engineering of the Central South University of Forestry and Technology, Changsha, China. The content of nano-TiO2 in food is supposed to be 5–10g/kg according to the National Standard of the People’s Republic of China Food Safety National Standard GB2760-2011 [27]. Fu et al. reported that Sprague Dawley rats were treated by intratracheal instillation with TiO2-NPs at doses of 0.5, 4, and 32 mg/kg body weight, micro-TiO2 with 32 mg/kg body weight and 0.9% NaCl, respectively [28]. In other related studies, it was found that TiO2-NPs (5, 15, or 30 μg/mL) significantly inhibited the viability of rat Sertoli cells in a concentration-dependent manner [29]. Moreover, we found that 3 and 6 ug/mL TiO2-NPs concentration can promote cell proliferation in our pre-experimental research. Based on the above considerations, we selected the concentration gradients as follows: 3, 6, 30, and 60 μg/mL. The cells were cultured in RPMI-1640 medium (Invitrogen Gibco, New York, USA) which contains fetal bovine serum (FBS), 1% Penicillin-Streptomycin. The cells were maintained in petri dish 10 cm in diameter at 37 °C and 5% CO2. The RPMI-1640 medium was replaced every second day, and cells were passaged when adherence rate was approximately 85 % by washing with D-Hanks Buffered Saline Solution for three times, then with 0.25% Trypsin-EDTA Solution [30]. Microscopically, when cells became round and dispersed, new medium was added to terminate the activity of trypsin, and trypsin was removed by centrifugation. The cells were suspended in fresh medium and subcultured in HCT116 and NCM460 cell lines, TiO2-NPs exposures were performed for 24 h. The two types of cell lines were exposed to 0, 3, 6, 15, 30, and 60 μg/mL TiO2-NPs to screen for cell viability.

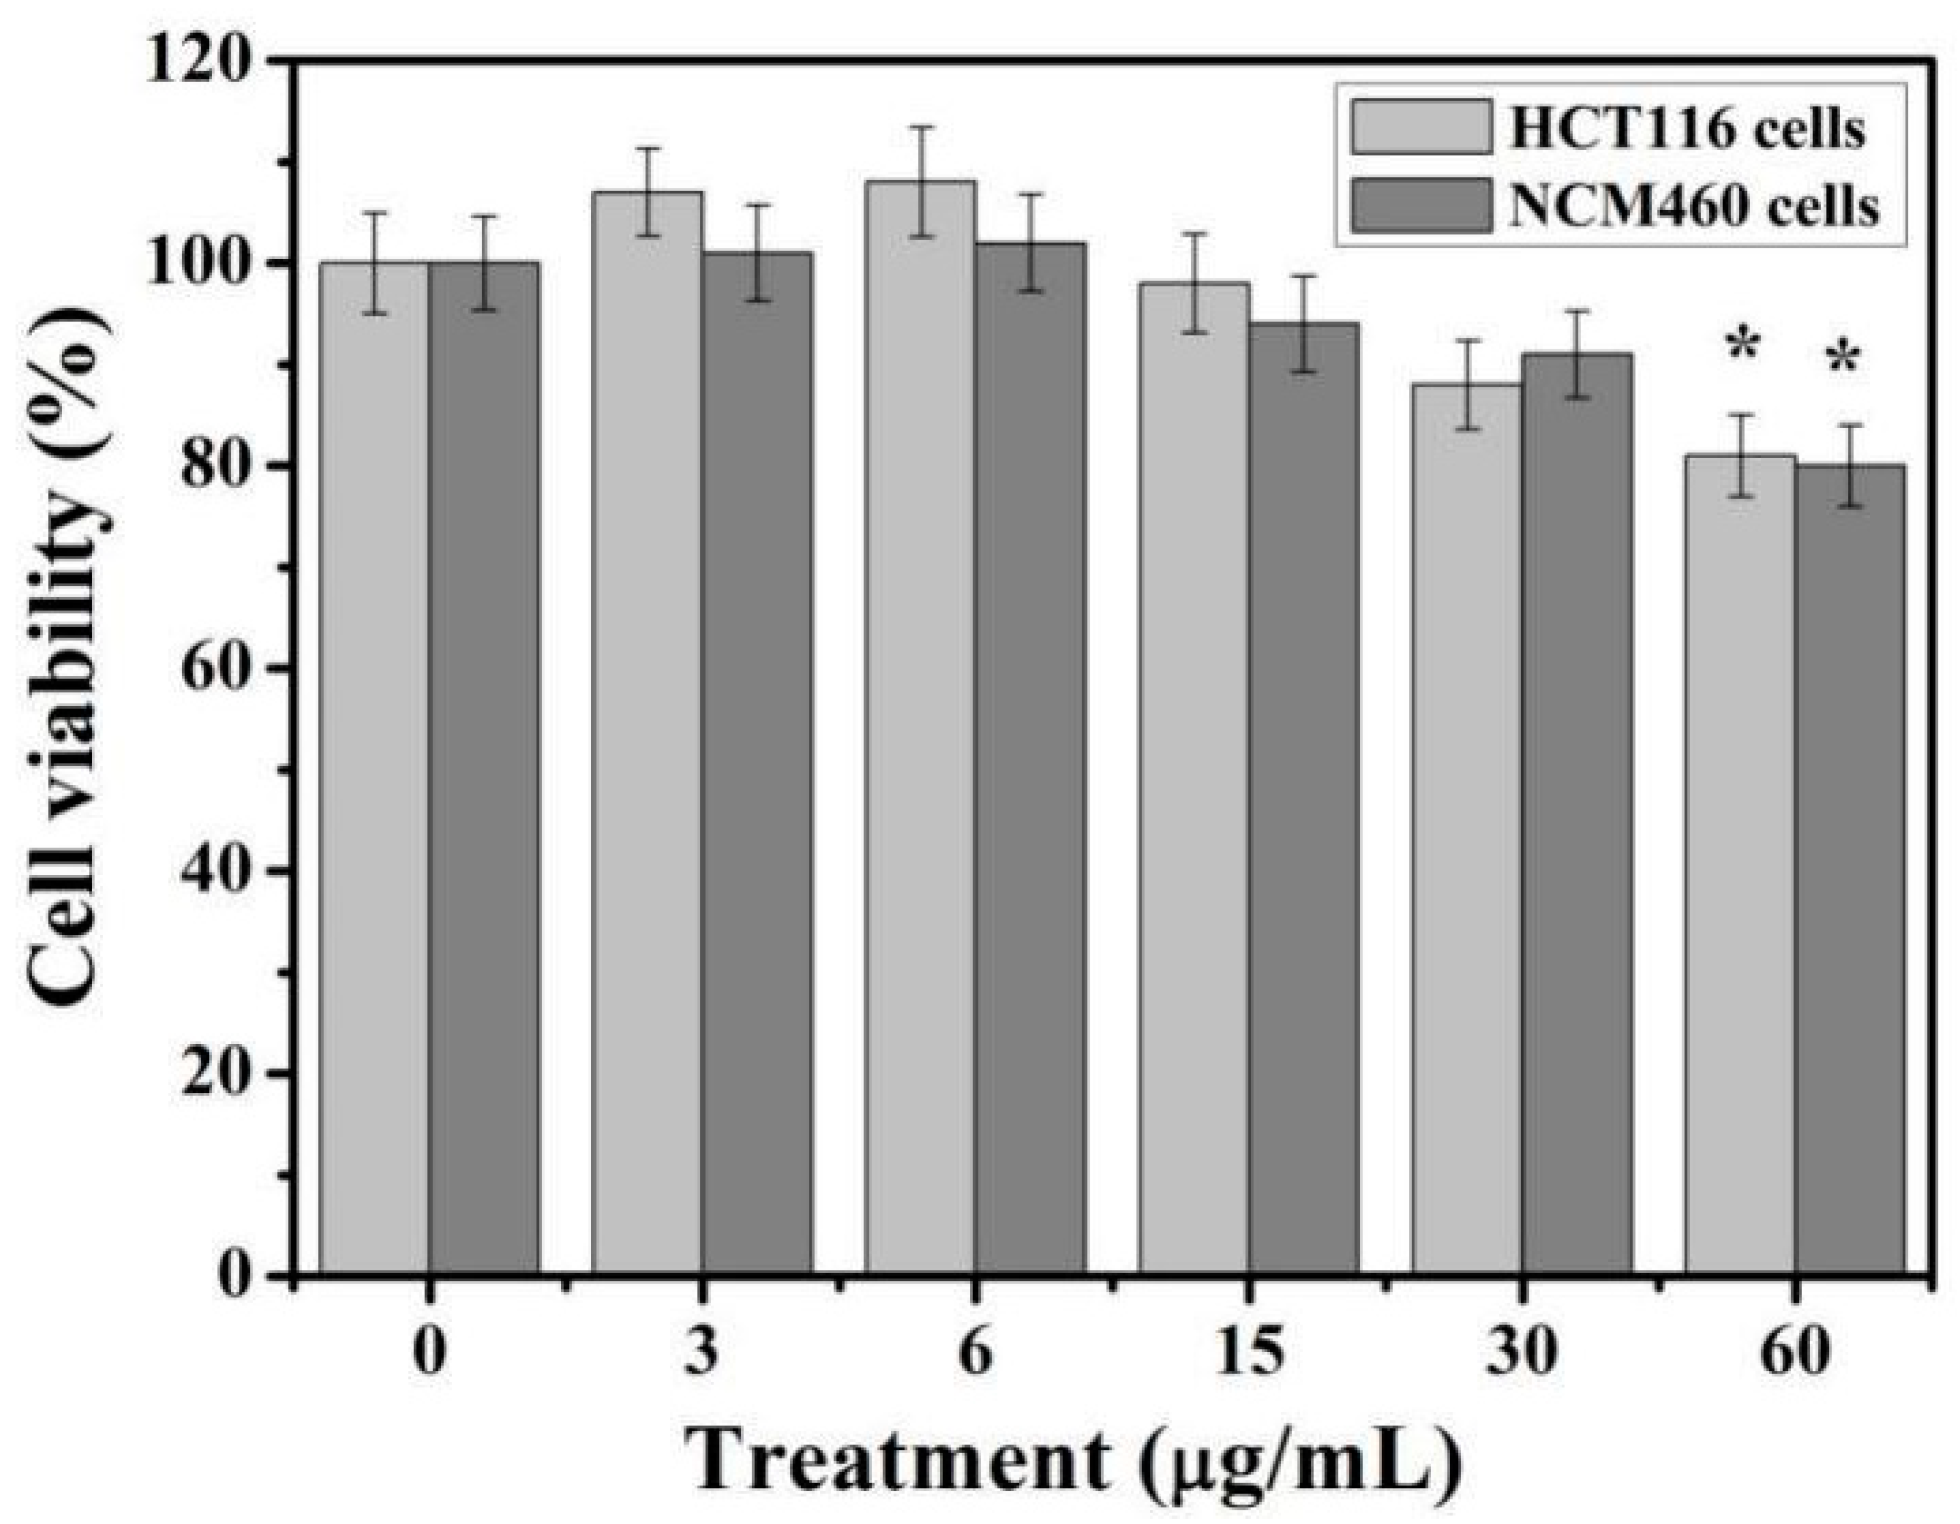
2.3. Cell Viability Assays

MTT cell proliferation and cytotoxicity assay kits (Sangon, Shanghai, China) were used to detect colon cell viability after exposure to different concentrations of TiO2-NPs. Cells were seeded in 96-well plates at 1 × 10⁵ cells/well. After 12 h, the adherent growth of cells was observed under a microscope about 60%. Then the cells were exposed to 100 mL of different concentrations of TiO2-NPs for 24 h. The cells were washed with D-Hanks and cultured for 4 h at 37 ℃ with 10 μL MTT (5 mg/mL). The formazan crystals were solubilised in 100 μL formazan solubilization solution for 10 min and absorbance read at 570 nm (Molecular Devices, San Jose, CA, USA) [31]. The percentage of cell viability changes was calculated and compared with untreated cells.

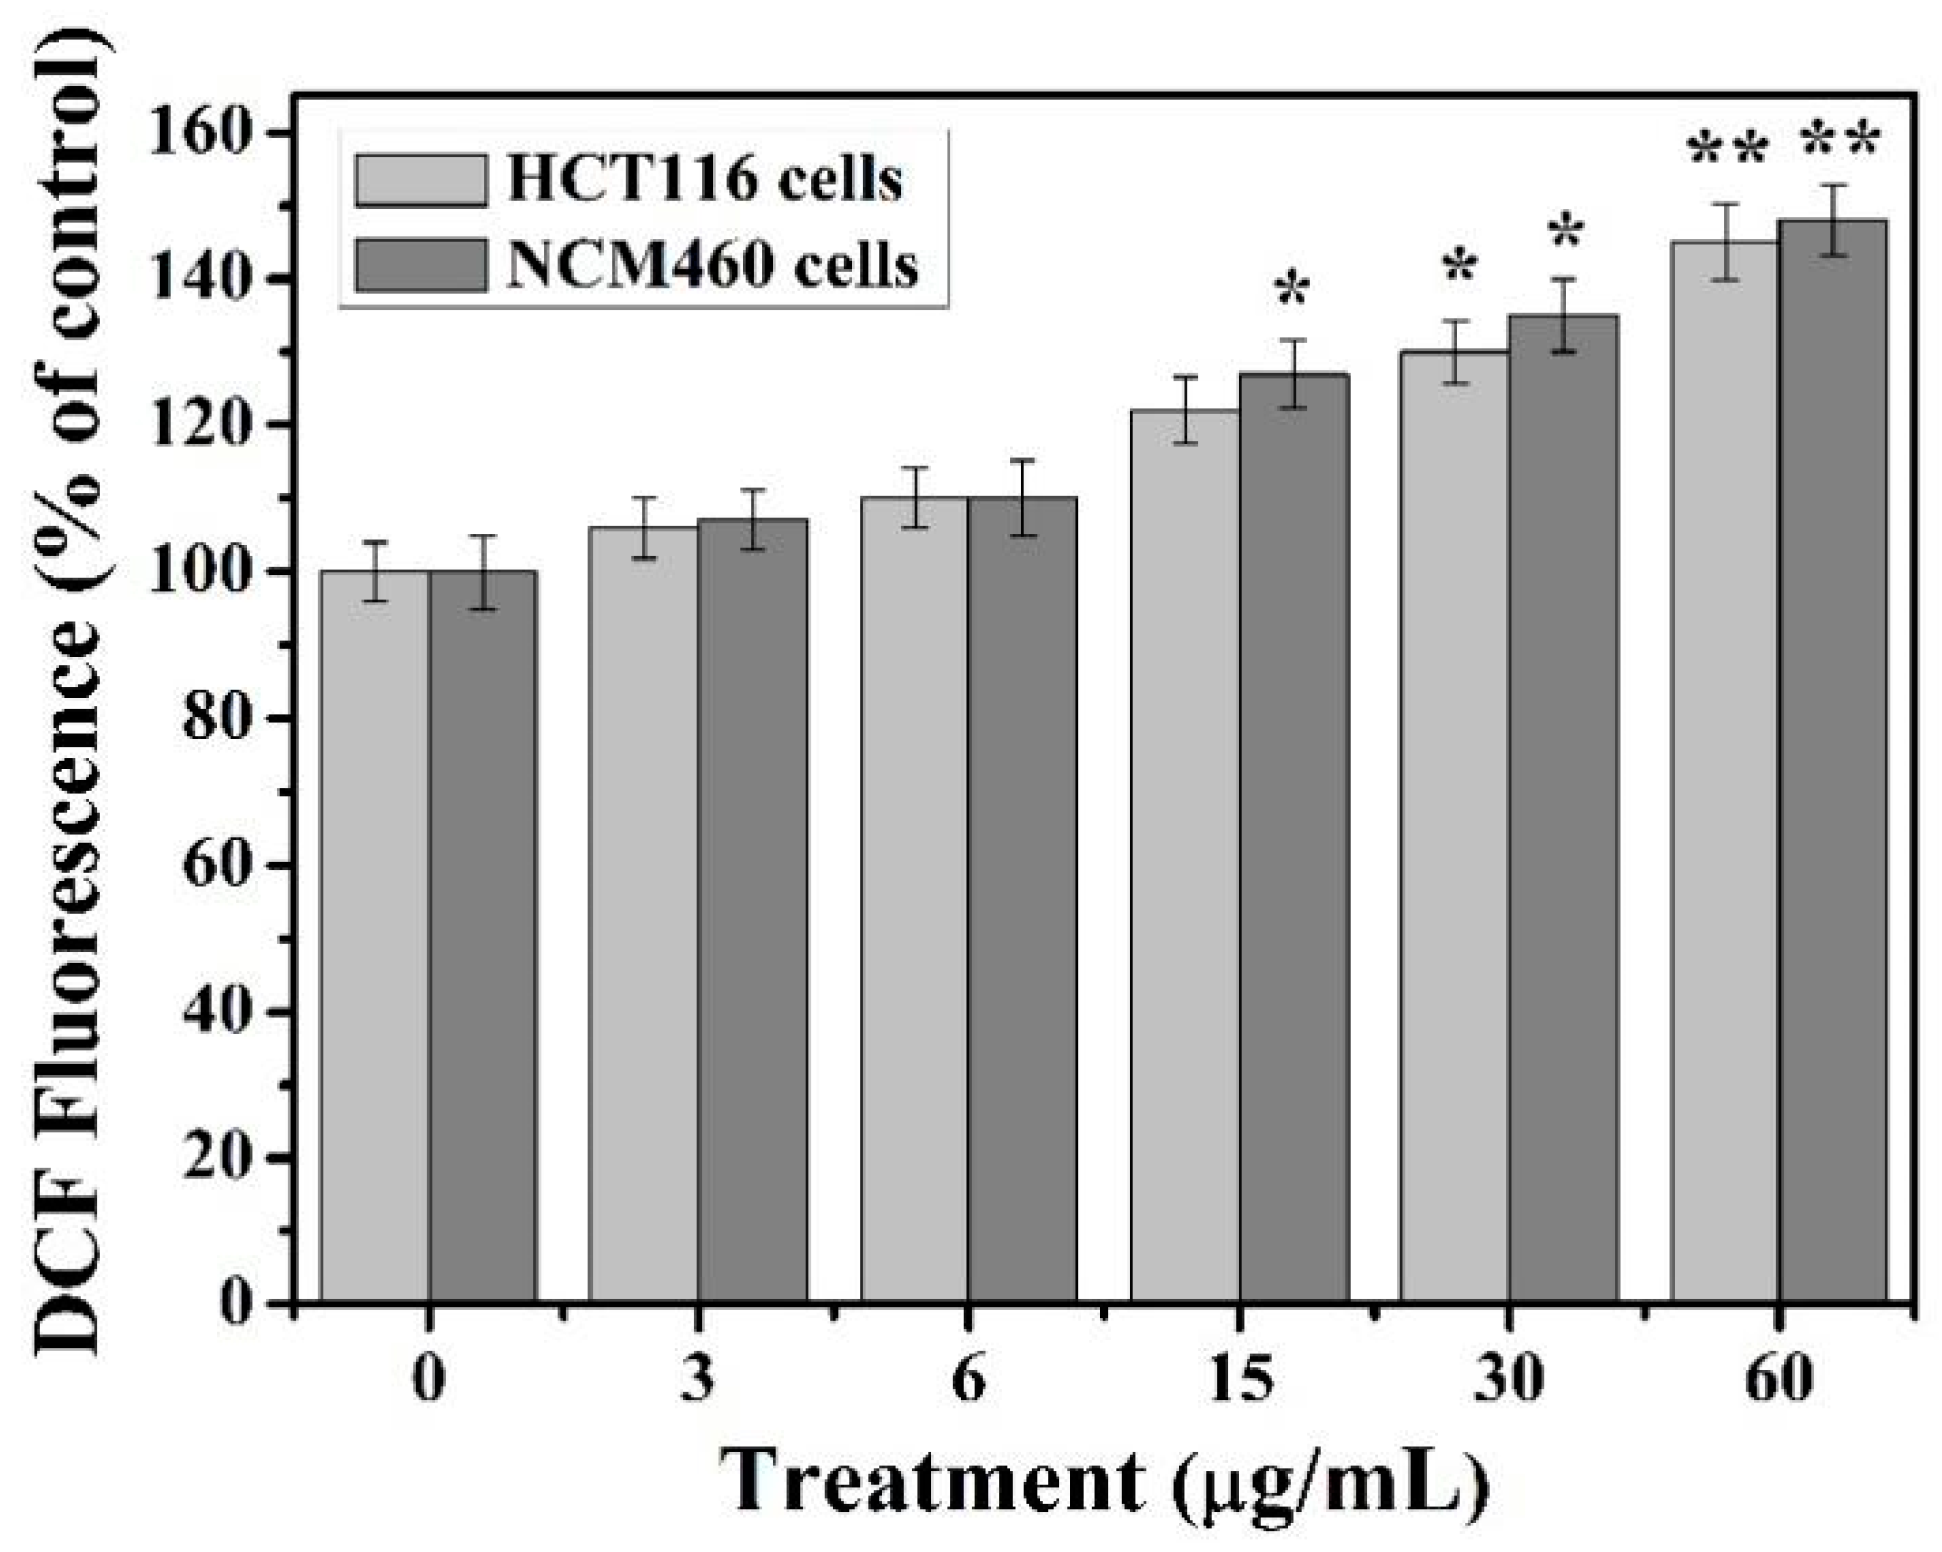
2.4. Determination of Intracellular ROS Production

Intracellular ROS levels were measured using a fluorescent probe 2′,7′-dichlorodihydrofluorescein diacetate (DCFH-DA) according to the manufacturer’s instructions (Beyotime, Shanghai, China) [32]. The cells were inoculated in a 24-well plate with 1 × 10⁵ cells/holes. After 12 h, the adherent growth of cells was observed under a microscope about 60%. The cells were exposed to 0, 3, 6, 15, 30, and 60 μg/mL TiO2-NPs for 24 h, respectively. The cells were then washed three times with D-Hanks and placed in a fresh 1640 medium (without FBS) with 5 μM DCFH-DA for 20–30 min. Then, cells were washed with D-Hank. Immediately, the fluorescence of samples was measured at 488 and 525 nm excitation and emission wavelengths in Spectra Max i3x (Molecular Devices, California, USA). Compared to the cells that were not incubated with TiO2-NPs, the inducing rate of ROS formation was calculated to increase the fluorescence intensity after exposure to TiO2-NPs.

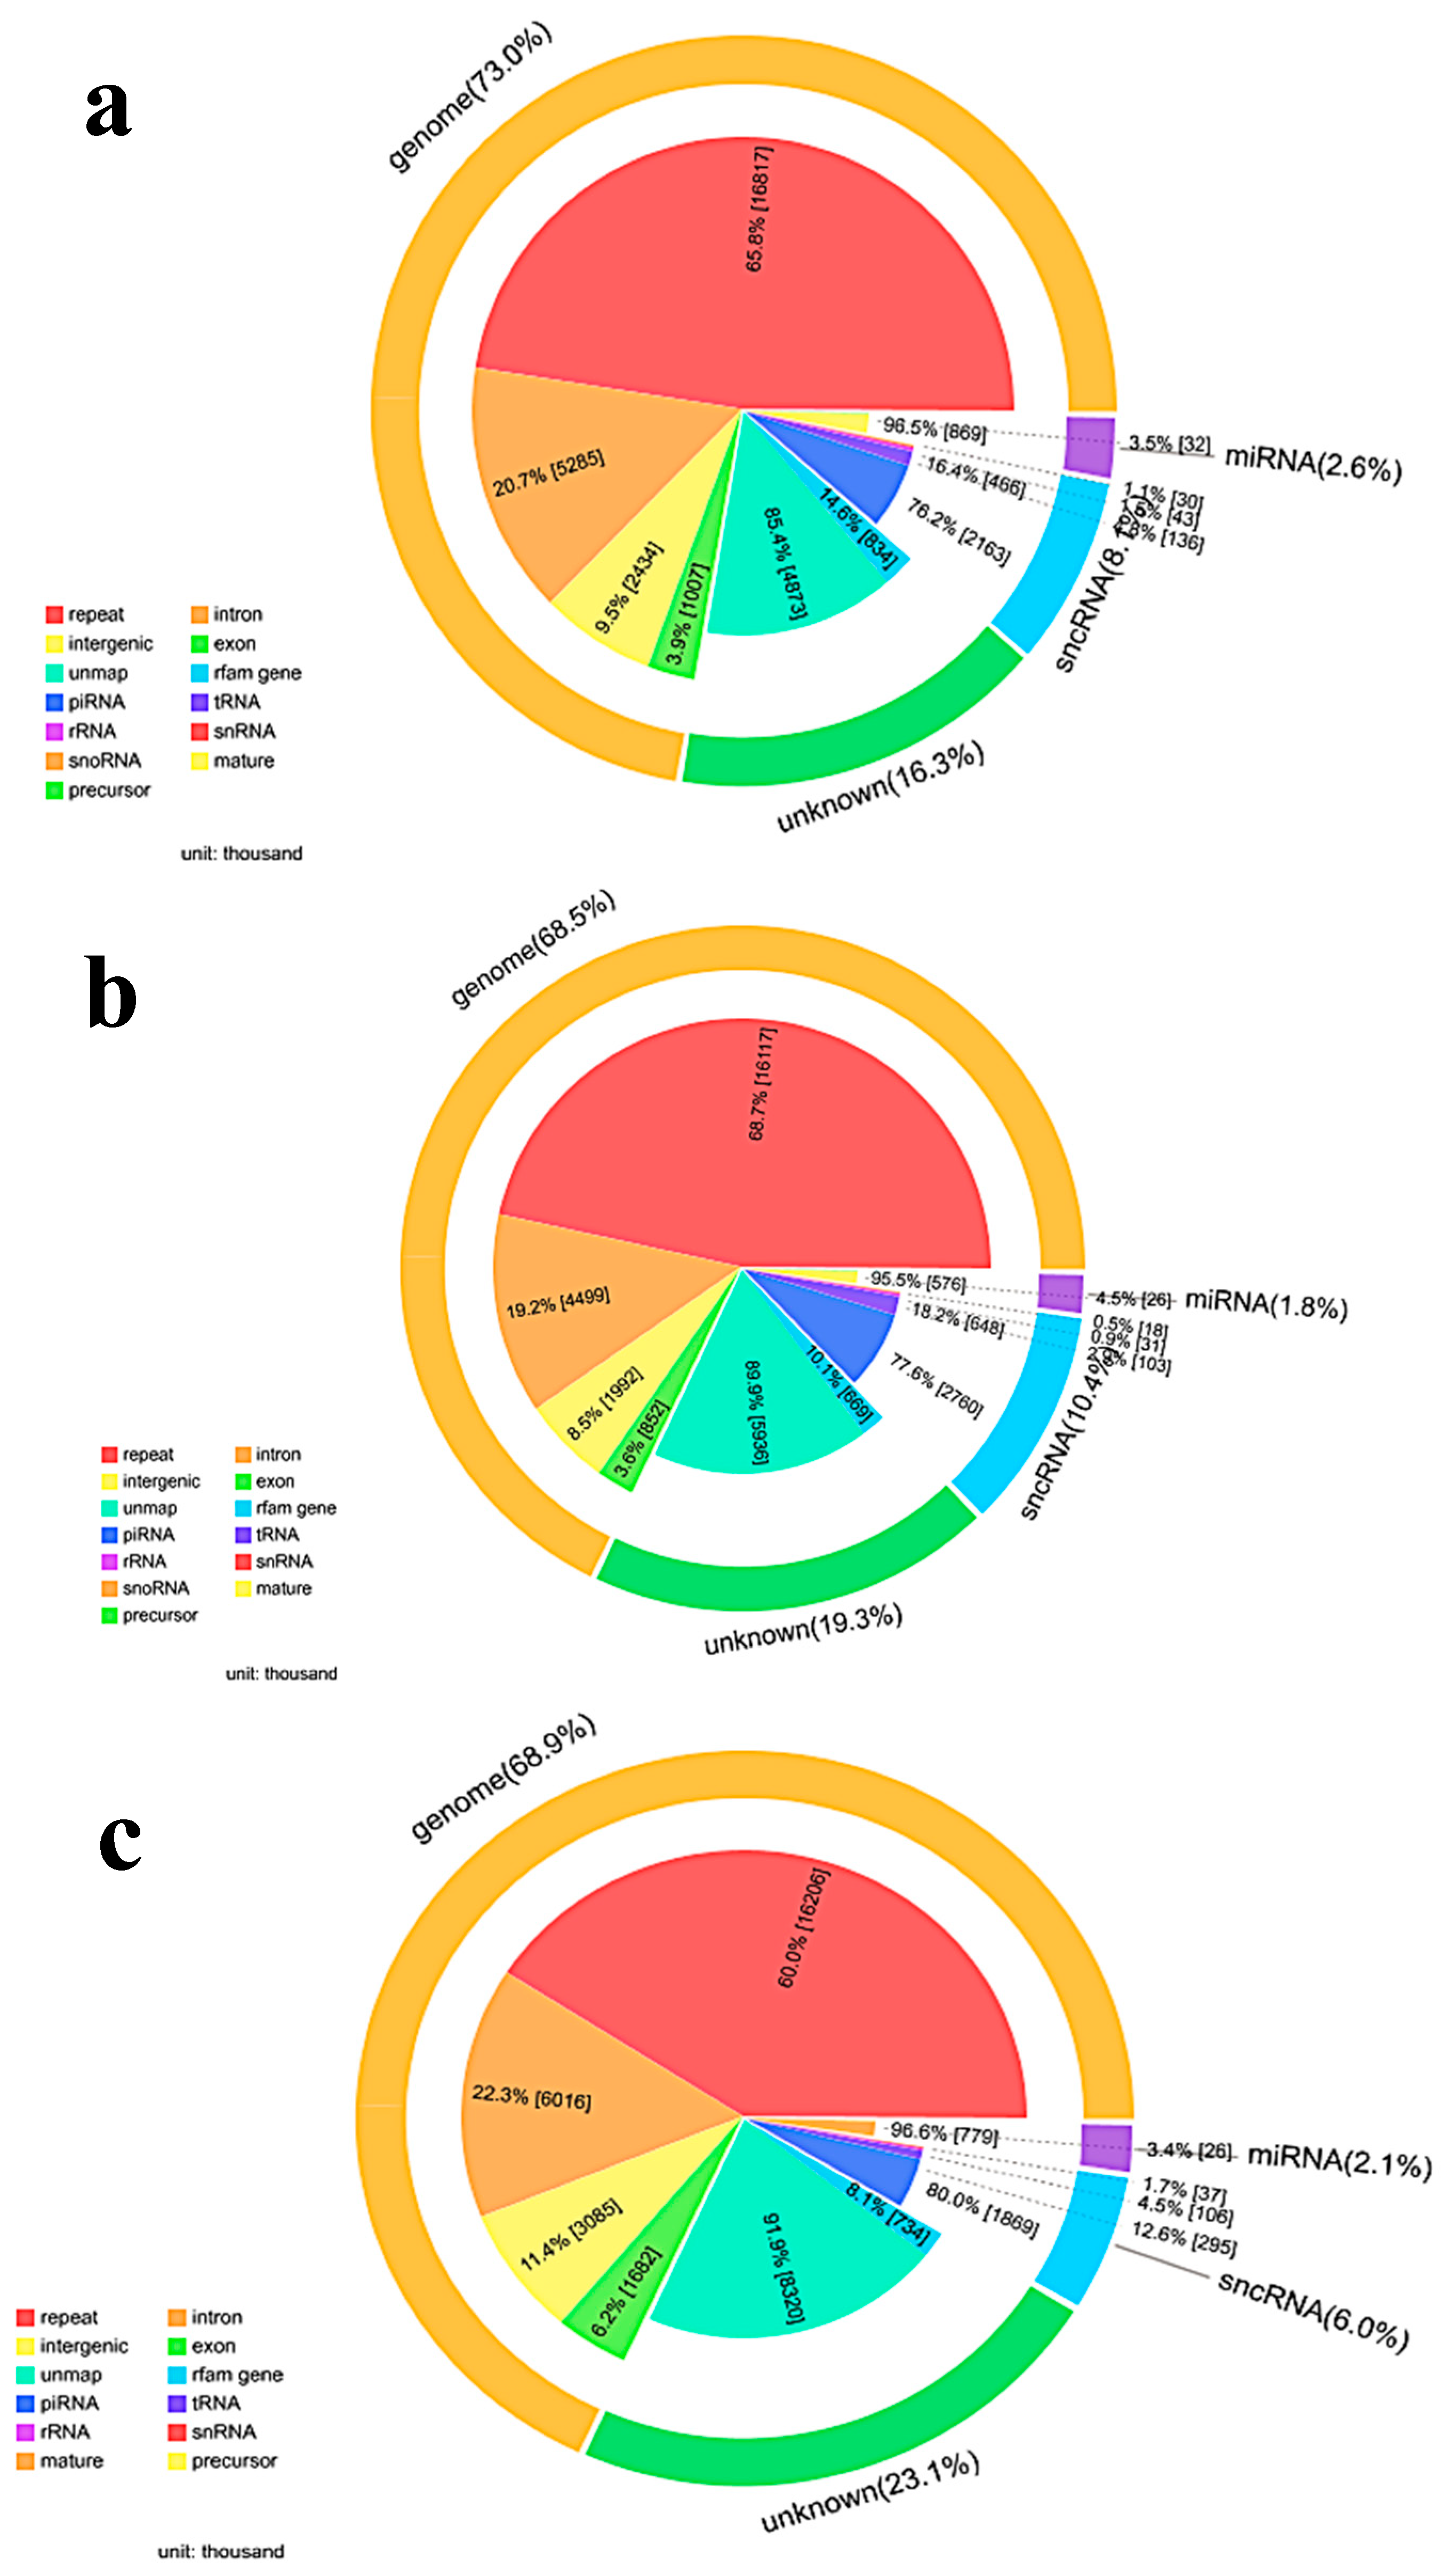
2.5. Small RNA Sequencing

HCT116 colon cancer cell lines were treated in triplicate with 0, 3 and 30 μg/mL TiO2-NPs for 24 h for microRNA changes. Then, cells were washed 2× with D-Hanks, and the total RNA was extracted by SanPrep Column RNA Extraction Kit (Sangon Biotech, Shanghai, China) by following the manufacturer’s protocol. The extracted RNA samples were then gel purified and 18–30 nt fragment construction library was selected [33]. Two kinds of adapters were respectively ligated to the ends of the small RNA fragments, and the prepared RNA was amplified by reverse transcription-polymerase chain reaction (RT-PCR). The 100–120 bp range PCR product was separated by PAGE electrophoresis, and by-products such as primer dimer were effectively removed. The isolated PCR product was loaded onto the BGISEQ-500 platform for sequencing. Experimental testing and data processing were performed by the Beijing Genomics Institute (BGI).

2.6. Prediction of microRNAs Target Genes

The data for microRNA profiling of TiO2-NPs-3 μg/mL and 30 μg/mL treated HCT116 cells are reported in this paper. MicroRNAs target mRNA were predicted using RNAhybrid, miRanda, and TargetScan. The final results of the target genes were predicted in combination of the three databases.

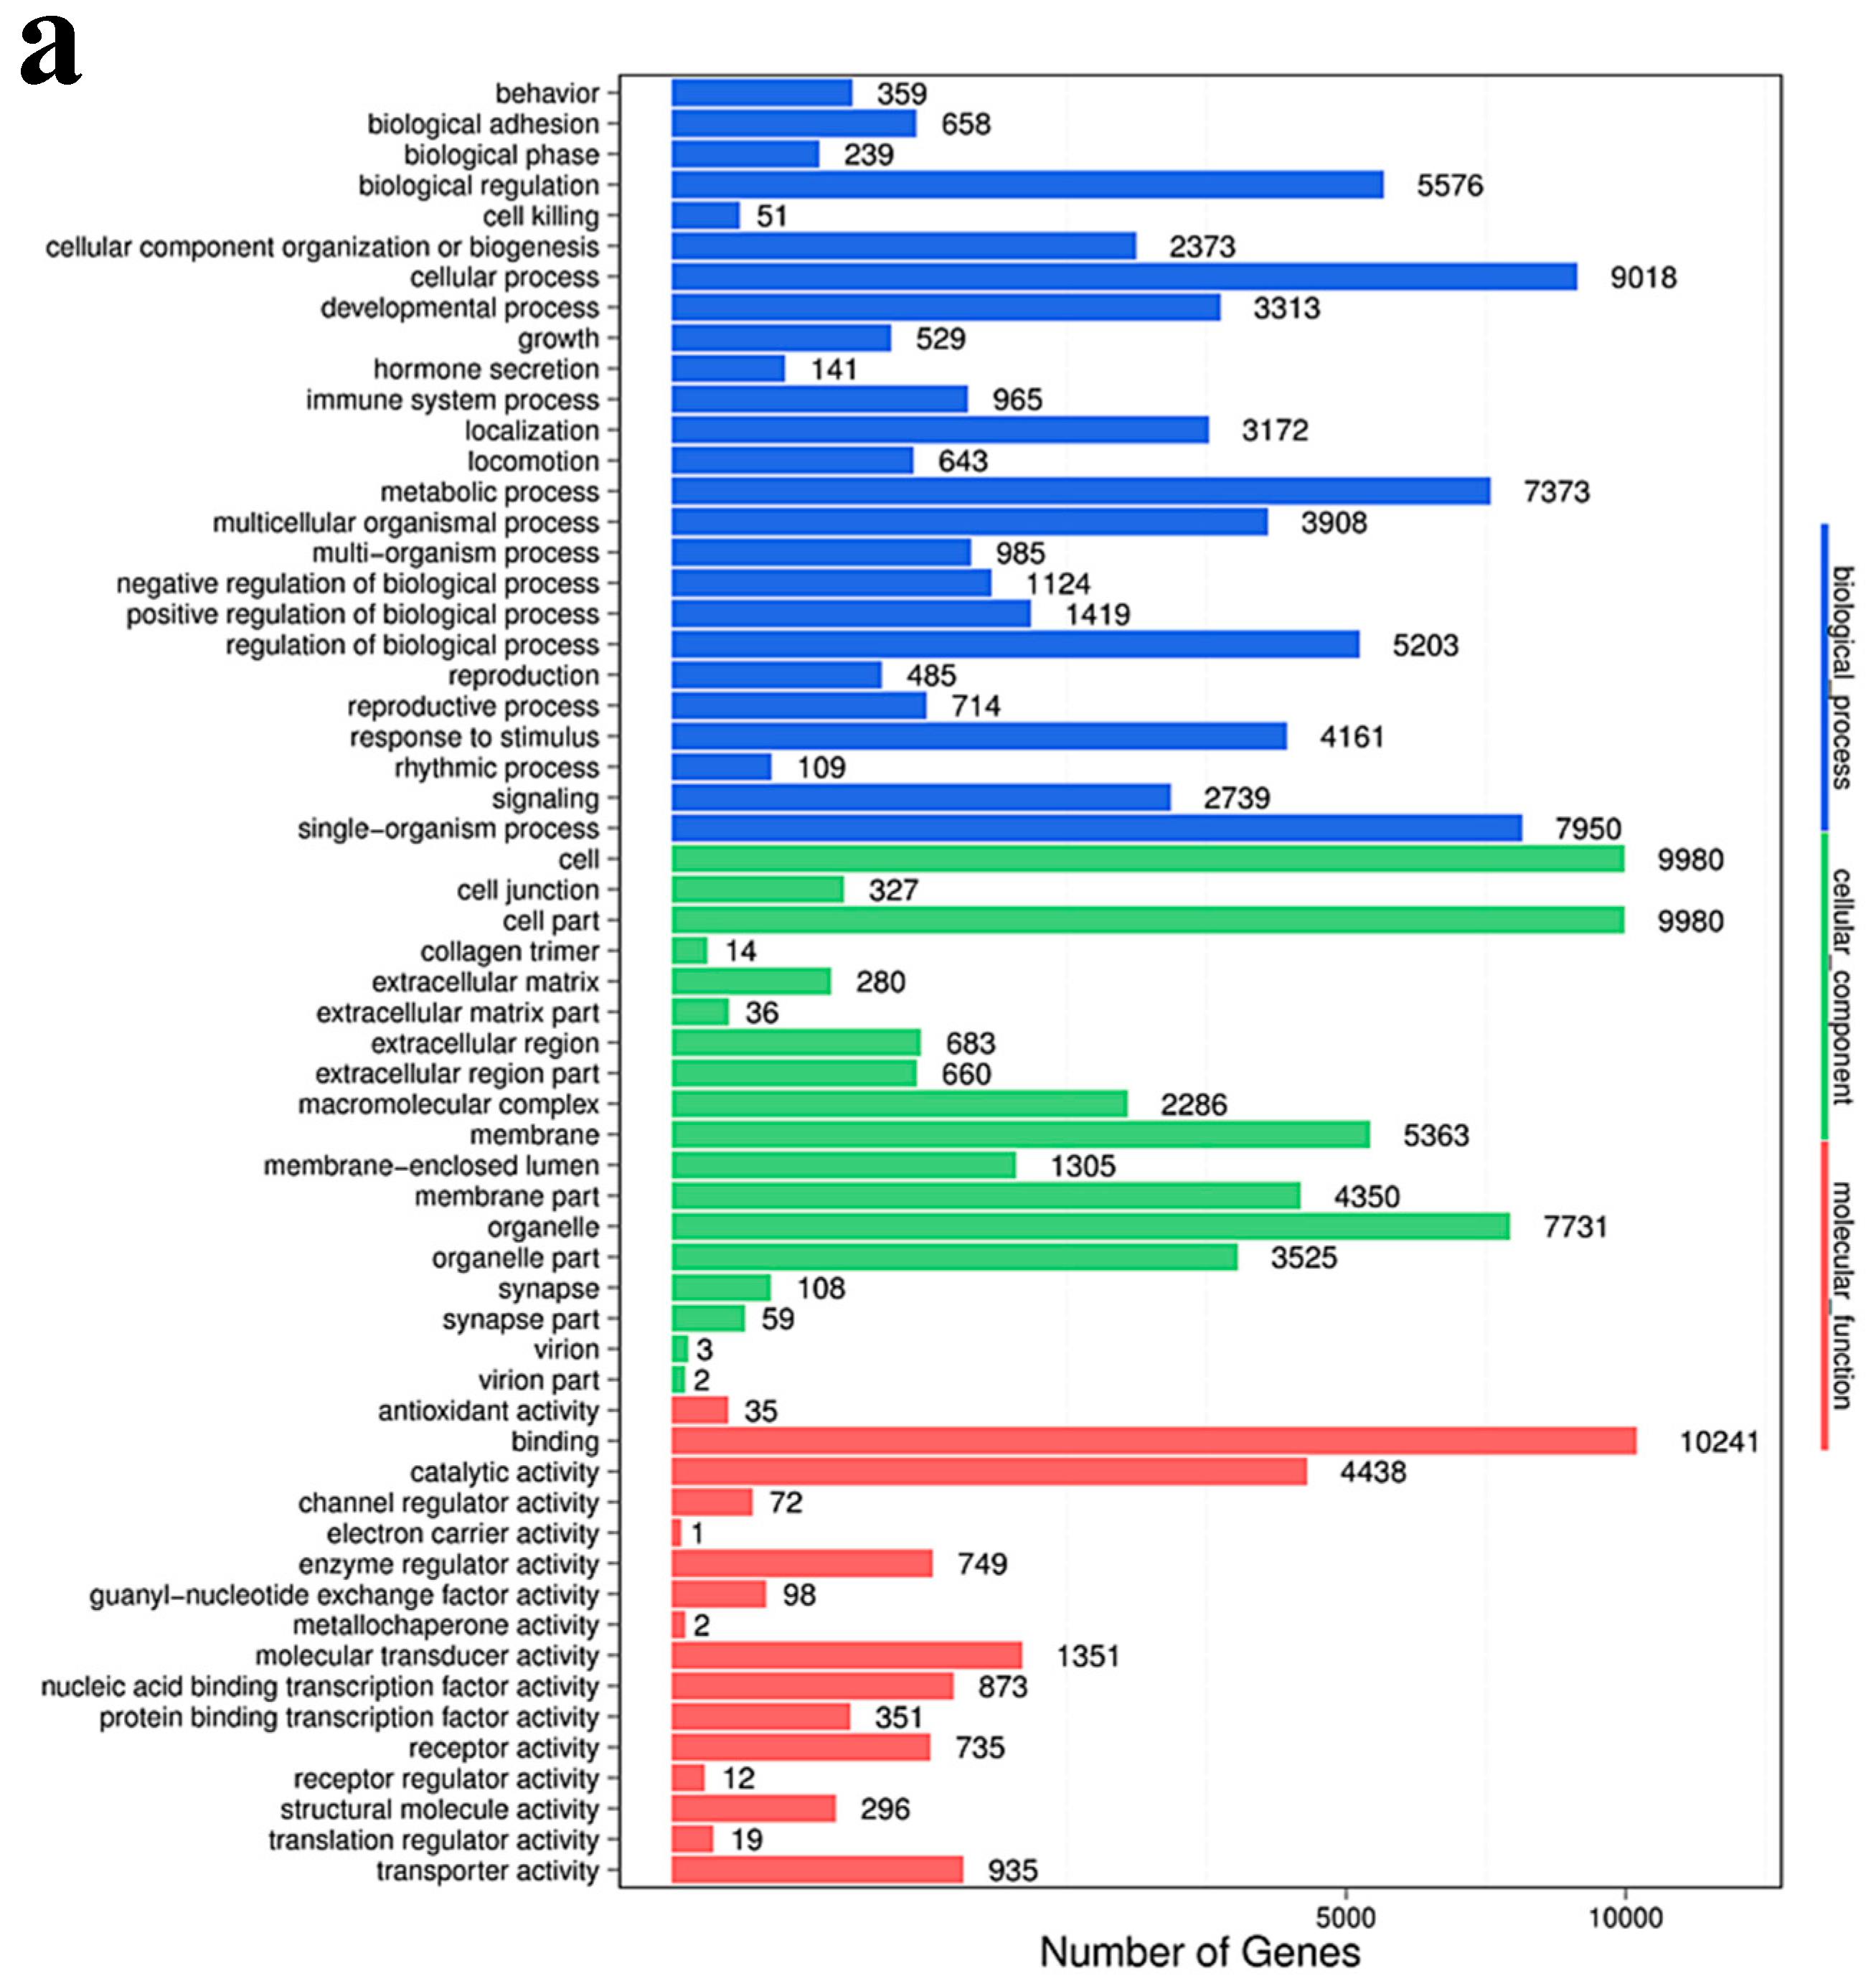
2.7. Gene Ontology Enrichment Analysis

Gene Ontology (GO) enrichment analysis finds all GO-terms that are significantly enriched in a list of differentially expressing small RNA’s (DESs) target genes, it also finds the genes that correspond to specific biological functions. To perform this analysis, BGI first maps all genes to GO-terms in the database, which calculates the gene numbers for every term. The hypergeometric test is then used to find significantly enriched GO-terms in the input gene list. This test is based on “GO-TermFinder”, using an algorithm developed by BGI to perform GO function analysis. The method used is described as follows:
P = 1 i = 0 m 1 ( M i ) ( N M n i ) ( N n )
In this algorithm, N is the number of all genes with GO annotation; n is the number of DES of the target gene in N; M is the number of all genes annotated to a particular GO term; m is the number of DES target genes in M.

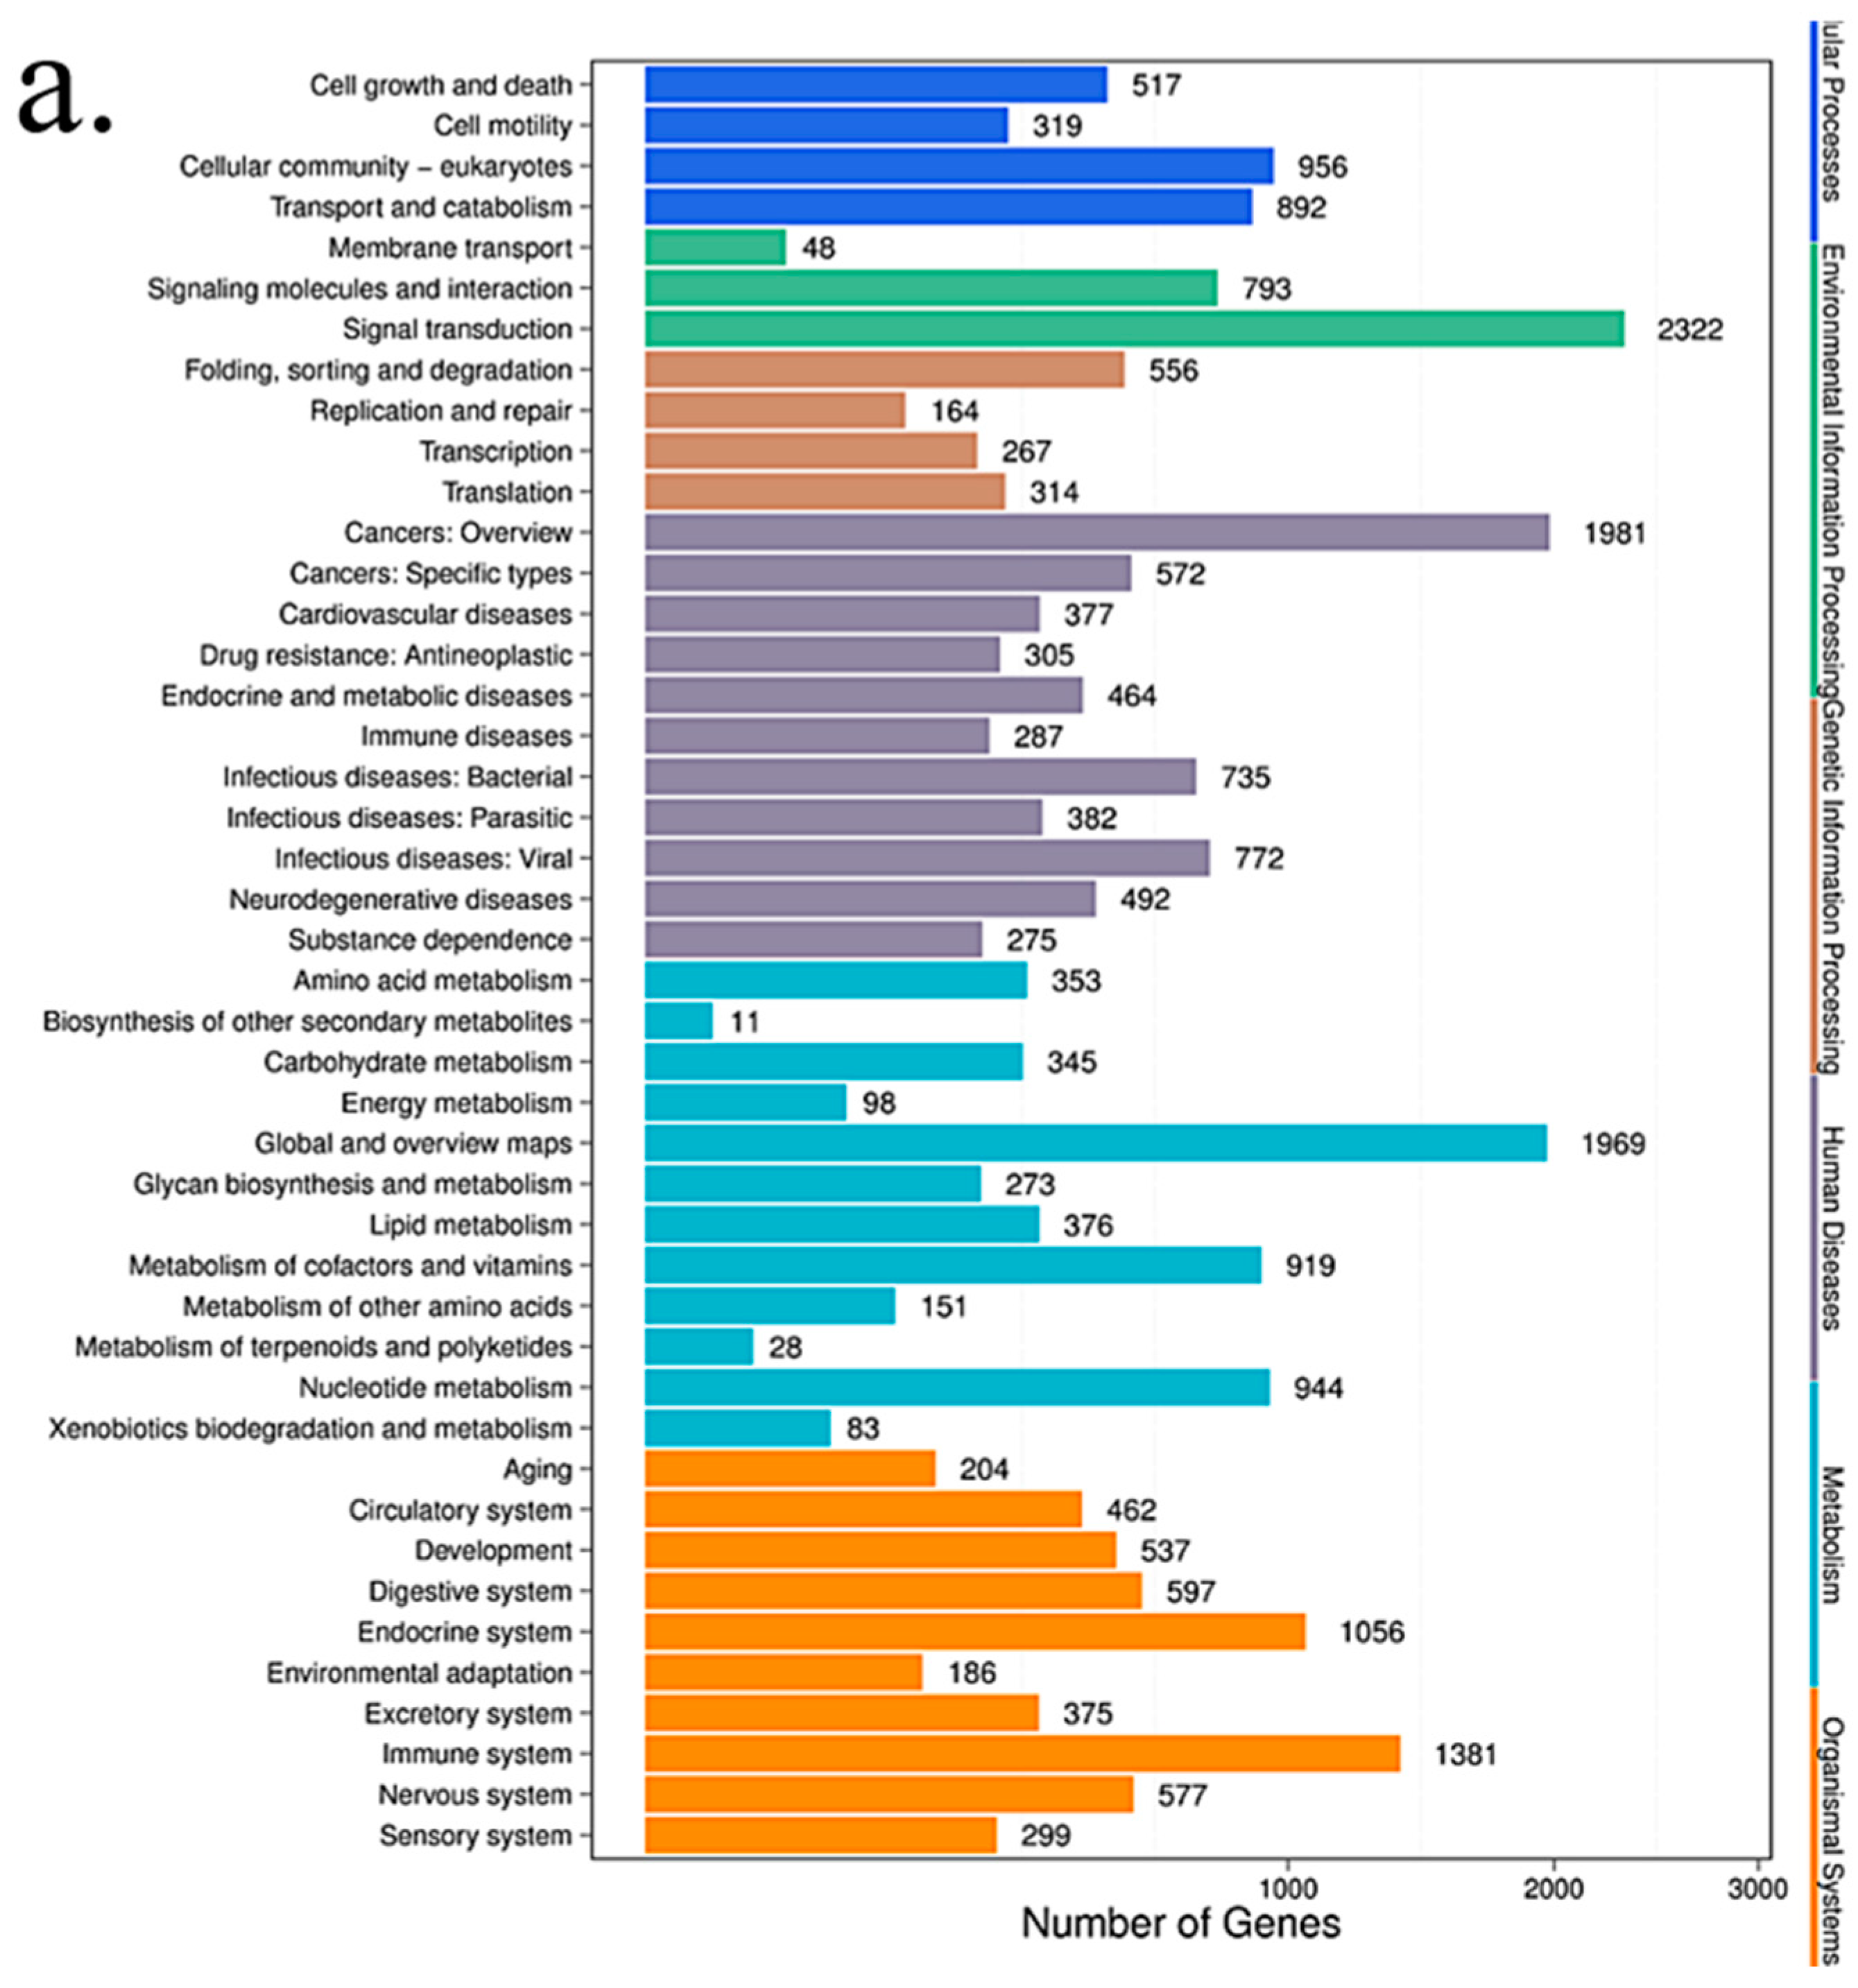
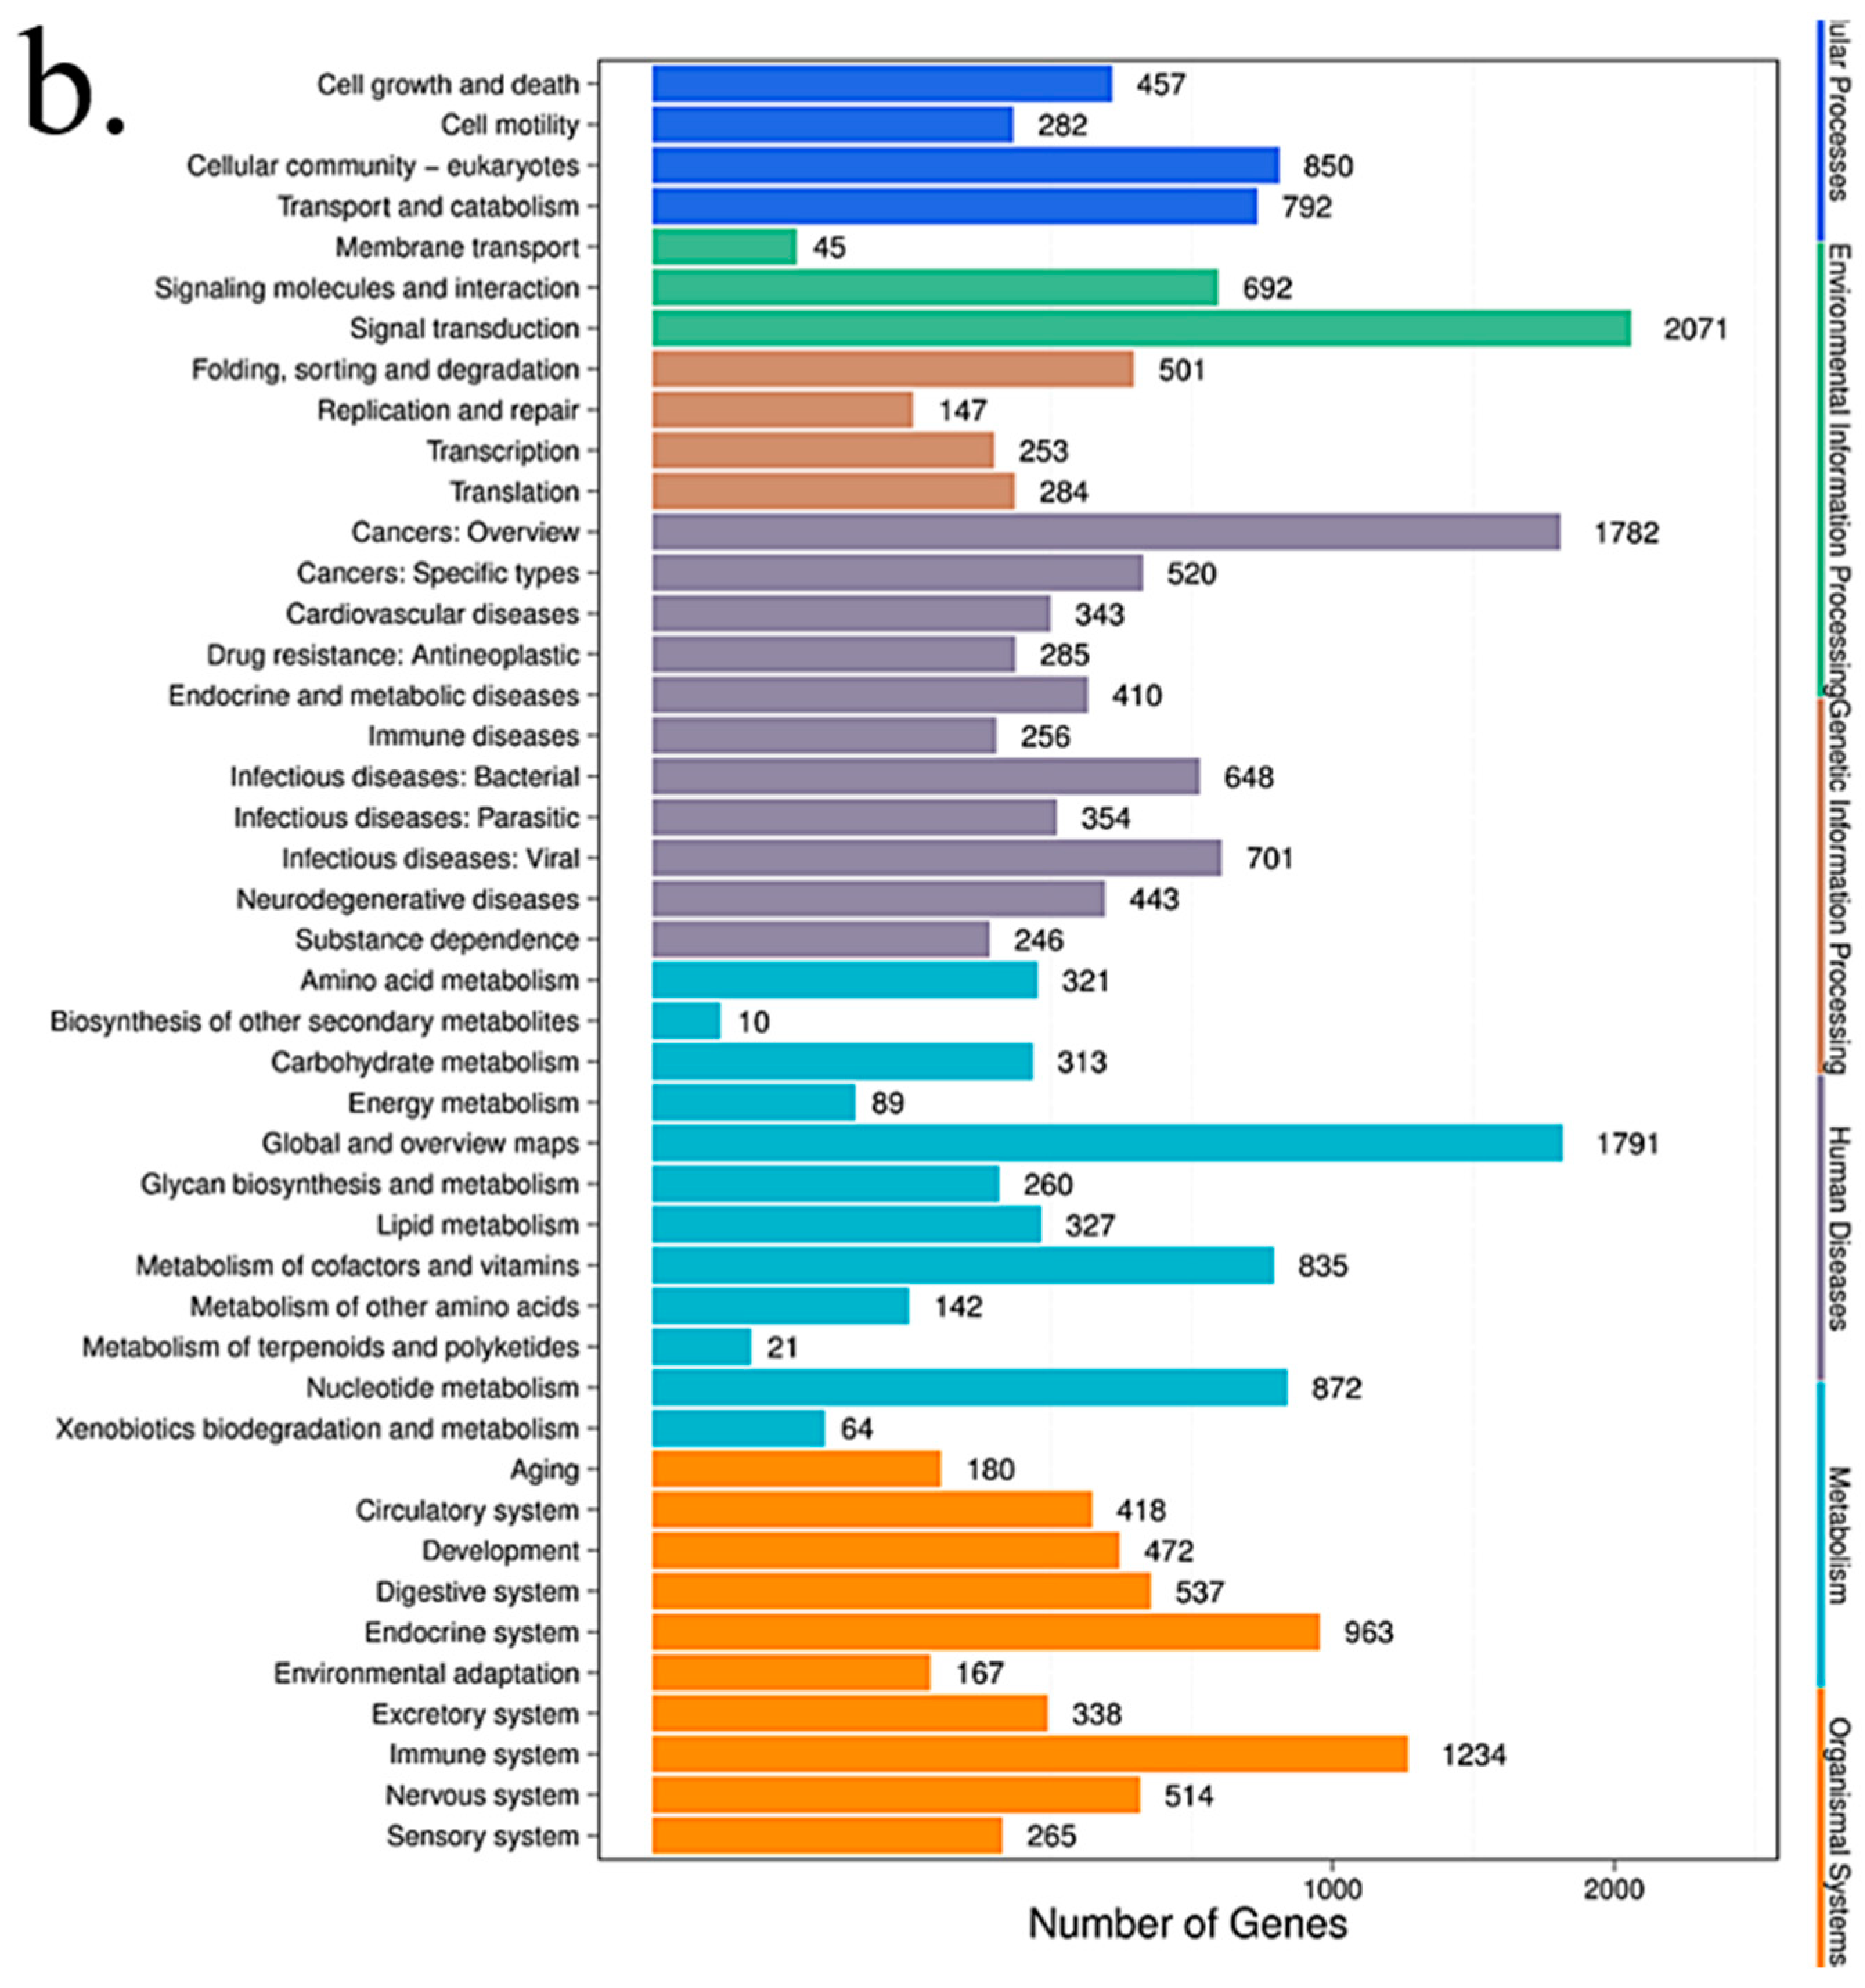
2.8. Pathway Analysis

Pathway-based analysis helps to further understand the biological functions of targeted genes that differentially express microRNAs. KEGG is used for pathway enrichment analysis. This analysis identifies significantly enriched metabolic pathways or signal transduction pathways in differential expressed microRNAs target genes when compared with the whole-genome background. The formula used is the same as that in GO analysis. However, N is the number of all genes with KEGG annotation; n is the number of DESs target genes in N; M is the number of all genes that are annotated to a specific pathway; m is the number of DESs target genes in M. The p-value is corrected by using the Bonferroni method, a corrected p-value < 0.05 is taken as a threshold. KEGG terms fulfilling this condition are defined as significantly enriched KEGG terms.

2.9. microRNA RT-qPCR

HCT116 cells and NCM460 cells were exposed to different concentrations of TiO2-NPs (0, 3, 15, 30, and 60 μg/mL) for 24 h, and the total RNA was extracted by SanPrep Column RNA Extraction Kit (Sangon Biotech, Shanghai, China) by following the manufacturer’s protocol. microRNA RT-PCR was performed by the microRNA first-strand cDNA Synthesis (Stem-loop method) from Sangon Biotech Co., Ltd (Shanghai, China) according to the manufacturer’s instructions. Briefly, 3 μg of total RNA was used to make the first-strand cDNA: 10 μL 2× microRNA L-RT solution mix, 1.5 μL microRNA L-RT enzyme mix, 1μL target gene’s stem-loop primer (10 μM), 1 μL U6 gene’s stem-loop primer (10 μM), 3 μg RNA sample and RNase free water to 20 μL. Gently mixed and centrifuged for 3~5 s. The reaction mixture was warmed at 16 °C for 30 min, then heated at 37 °C for 30 min, and at 85 °C for 5 min to inactivate the enzyme and then stored at 4 °C.
Fluorescence quantitative PCR was performed by using the prepared first strand cDNAs, were 1 μL/sample was used for one PCR reaction (in a 96-well plate) for each microRNA (three replicate wells per sample). Each PCR reaction (20 μL) contained 10 μL of 2× microRNA qPCR master mix, 0.5 μL forward primer (10 μM), 0.5μL of reverse primer (10 μM), 1 μL RT product and RNase-free water to 20 μL. The qPCR was performed with the CFX96 Touch (Bio-Rad, Hercules, CA, USA) and the reaction was set as follows: initial denaturation at 95 °C for 40 s followed by 40 cycles of denaturation at 95 °C for 5 s, annealing at 62 °C for 20 s and extension at 70 °C for 10 s. The primer sequences used are shown in Table 1 and Table 2.

2.10. Statistical Analysis

Results of at least three independent experiments are presented as mean ± SD. The comparison between treated and control groups was carried out by ANOVA analysis using the SPSS 23.0 software package (SPSS Company, Chicago, IL, USA). * p < 0.05 and ** p < 0.01 were considered as significant levels for all the analyses performed.

3. Results

3.1. Nanomaterials Characterization

The XRD spectra show that the diffraction peaks of powdered TiO2-NPs samples are consistent with those of standard anatase, and there are almost no impurity peaks, indicating that the samples have similar properties to anatase and have high purity (Figure 1a). The TEM spectra show that the TiO2-NPs are well-dispersed, uniform size, and complete morphology, with an average particle size of about 25 nm (Figure 1b).

3.2. Cell Viability

The two types of cells were treated with TiO2-NPs at doses ranging from 3 to 60 μg/mL, respectively. Cell viability was measured by MTT analysis after 24 h of treatment (Figure 2). At a concentration of 3–6 μg/mL, there was no significant change in the activity of the two colon cells. It is worth mentioning that the viability of HCT116 cells increased by about 8–10% (although there were no statistically significant differences, but there was an increasing trend). When the concentration of TiO2-NPs reached 60 μg/mL, the viability of both cells decreased to about 80%. TiO2-NPs showed slight toxicity to colon cells and inhibited cell viability. In the study of the effects of TiO2-NPs on colorectal cancer cells and HUVEC cells, it was also found that TiO2-NPs have different effects on the survival rates of these three cell lines [34]. A total of 100 and 400 μg/mL TiO2-NPs significantly increased the survival and proliferation of HCT116 cells (62–68%), but not in HT29 cancer cell lines. At the same time, HT29 cells exposed to varied concentrations between 50 and 400 μg/mL TiO2-NPs showed approximately 20–30% reduction in viability. The use of higher concentrations of nanoparticles may be related to the different properties of the material.

3.3. Intracellular ROS Analysis

TiO2-NPs increased ROS production in two types of colon cell lines (Figure 3). The two cell lines showed similar results in the analysis of ROS production, and the ROS content of the cells showed a dose-dependent relationship with TiO2-NPs. When the concentration of TiO2-NPs was 3–6 μg/mL, there was no change in ROS content. When TiO2-NPs was 15 μg/mL, the ROS content increased, about 20–25%. As the concentration of nanoparticles increased, the ROS content in both types of cells significantly increased. At higher doses of 30 and 60 μg/mL, the increase in ROS was more pronounced, about 40% and 45%, respectively.

3.4. Effects of TiO2 NPs on the Expression of microRNAs

Except for Small RNA Sequencing experiments, the other experiments were tested in two cell lines. This is because, through cytotoxicity experiments, we found that 3 μg/mL TiO2-NPs may have a potential role in promoting cell viability, while 30 μg/mL TiO2 inhibits cell viability. However, this difference was not shown in the NCM460 cell line, indicating that low concentrations of TiO2-NPs may promote the growth and inflammation of HCT116 cells. We studied the microRNA changes in HCT116 cells after exposure to 3 and 30 μg/mL TiO2-NPs. Except for small RNA sequencing experiments, the other experiments were tested in two cell lines.

3.4.1. Small RNA Annotation

After filtering, clean tags were mapped to small RNA database. Table 3 lists separate mapping rate for each sample and Figure 4 shows the distribution of tags. Figure 4a, 4b and 4c show the distribution of unique expressed small RNAs among different categories in control, TiO2-NPs-3 μg/mL and 30 μg/mL treated HCT116 cell lines, respectively. The numbers of annotated total microRNAs were most in TiO2-NPs-30 μg/mL treated HCT116 cell lines, then in control HCT116 cell lines, and the least in 3 μg/mL treated HCT116 cell lines. However, there were no significant differences in the number of microRNAs labeled in the three sample groups.

3.4.2. Analysis of Significant Differences in microRNAs

Compared to the global expression of control cells, 34 and 24 genes expression was significantly altered (p < 0.05) after 3 and 30 μg/mL of TiO2-NPs treated for 24 h, respectively. In 3 μg/mL TiO2-NPs treated cells, 27 genes were downregulated and 7 genes were upregulated, while 13 genes were downregulated and 11 genes were upregulated in 30 μg/mL TiO2-NPs treated cells (Figure 5). Table 4 shows some of the differentially expressed microRNAs.

3.4.3. GO Function Analysis

The target genes of all differential microRNAs were functionally enriched and classified by Gene Ontology, and the functional distribution characteristics of the differential genes were macroscopically recognized. Using all the coding protein genes as background genes, the p-value was calculated using the hypergeometric distribution and p < 0.05 was set as the significance threshold value. A high-frequency annotation with statistical significance relative to the background was obtained, so that the distribution information of the gene collection on the GO category can be obtained. GO has three ontologies: molecular function, cellular component, and biological process. The GO function of DESs target genes is mainly concentrated in the biological process, and the GO enrichment results of the DESs target genes of the experimental groups of 3 and 30 μg/mL were basically the same (Figure 6).

3.4.4. KEGG Pathway Analysis

We looked for canonical pathways altered by TiO2-NPs treatment (Table 5). Since HCT116 is a colon cancer cell line, pathways that occurred in other cell types were not included in this analysis. Under these criteria, there are significant changes in the canonical pathways in TiO2-NPs treated HCT116 cells (Figure 7). In these pathways, the enriched pathway can be roughly categorized into 4 different groups. Metabolism (Thiamine metabolism, Purine metabolism, Glycosaminoglycan biosynthesis-chondroitin sulfate/dermatan sulfate, Glycosaminoglycan biosynthesis-heparan sulfate/heparin, Metabolic pathways, Lysine degradation, Retinol metabolism), Human Diseases Cancers (Transcriptional misregulation in cancer, microRNAs in cancer, N-Glycan biosynthesis), Environmental Information Processing (Notch signaling pathway, ECM-receptor interaction, Hedgehog signaling pathway, mTOR signaling Pathway, Phosphatidylinositol signaling system), Cellular Processes (Gap junction, Endocytosis, Signaling pathways regulating pluripotency of stem cells), which may be regulated by corresponding microRNAs. microRNAs may play an important role in TiO2-NPs-mediated colonic cytotoxicity.
According to Table 6 and Table 7, it can be found that the target genes of microRNA 378b and 378g are involved in basic biological processes and functions such as cell metabolism, transcriptional regulation, protein modification, cell proliferation, differentiation, and apoptosis. Among the more familiar target genes related to cell growth, apoptosis and metabolism are MAPK1, CASP5, BCL2L2, MAPK3, and so on. In related research, it was found that nano-TiO2 significantly inhibited the viability of rat Sertoli cells in a concentration-dependent manner. Additionally, upregulated the expression of p-PKC and p-p38/MAPK in cells in a dose-dependent manner, thereby inducing cellular immune dysfunction, thereby triggering NF-κB activation and eventually inducing the expression of inflammatory factors in cells [35]. The MAPK pathway may be regulated by microRNA 378b and 378g to affect cell viability. The expression levels of miRNA 378b and 378g were verified in two colon cells by RT-PCR for their possible regulatory effects.

3.5. RT-qPCR

The expression levels showed a dose response for microRNA 378b (Figure 8a) and 378g (Figure 8b) from 3 to 30 μg/mL TiO2-NPs treatments. And microRNA 378b were significantly altered. Overall, the data from qRT-PCR correlated well with the microRNA data and demonstrated the changes of these microRNAs at 3 and 30 μg/mL treated samples.
MicroRNAs were extracted from HCT116 and NCM460 cells treated with TiO2-NPs and verified the expression changes of microRNA 378b and 378g by qRT-PCR. The results showed that the expression of miRNA 378b and miRNA 378g were consistent with the differential gene expression detected by HCT116 cell microRNA expression profiling, which proved the accuracy of microRNA expression profiling data. The expression of miRNA 378b was stable in NCM460 cells treated with TiO2-NPs, and the expression of miRNA 378g was decreased when treated with 3-6 μg/mL TiO2-NPs, and the expression increased with the increase of TiO2-NPs concentration. When the concentration was increased to 30-60 μg/mL, the expression level returned to normal. The differential expression of miRNA 378b and 378g induced by TiO2-NPs may be related to the cell line type. Our research group will conduct further studies to assess the regulatory effects of the differential expression of miRNA 378b and 378g in the two colon cell lines on related target genes.

4. Discussion

Toxicological effects of nanoparticles are to reveal the basic laws of interaction between nanoparticles and living systems, which ensure the steady development of nanotechnology itself [3,4]. The TiO2-NPs can easily enter the cell through the cell membrane because of the ultra-fine nature [13,14]. However, due to its large-specific surface area and high-reactivity, it may interact with many organelles and biological macromolecules in the cell, which can cause the intracellular microenvironment and cell function changes, and even cause genetic mutations and gene-level damage [12,13,14,15,16,17]. But so far, the mechanism of nanoparticle-induced tissue and cell damage is unclear, and the molecular level changes involved in this process are still unclear. Nevertheless, most researches have been focusing on the toxicity mechanism, exposure effects, toxicity effects, migration and transformation pathways, and risk prediction of TiO2-NPs [5,6,9,16,17].
Recently, studies on the interaction of biological macromolecules and molecular regulation mechanisms has just begun [5,17,19]. At present, studies on various cell lines have shown that TiO2 nanoparticles (NPs) induced the inflammatory response and cytotoxicity [36,37]. However, little is known about the potential mechanism of microRNA response in colon cells caused by TiO2-NPs exposure. In this study, HCT116 and NCM460 cell lines were selected to evaluate the colonic cytotoxicity of TiO2-NPs. Similarly, cell viability testing is a vital step in toxicology testing which shows the response of cells to drugs and provides information about cell death and survival [5,13,14,17,18,19,36,37]. In our study, when the concentration of TiO2-NPs reached 60 μg/mL, the viability of both cells decreased to about 80%. These results indicate that TiO2-NPs are slight toxic to colon cells and inhibited cell viability.
The ROS mechanism is one of the most commonly accepted oxides for assessing the toxicity of nanomaterials [9,14]. Similarly, nanoparticles with active ingredients on the surface enhance their ability to produce ROS [5,6]. ROS mainly include superoxide ions, hydrogen peroxide, hydroxyl radicals, etc. Trace reactive oxygen species play an important role in the regulation of certain physiological phenomena, while excess reactive oxygen species can cause oxidative damage to cellular macromolecules [37,38]. If exogenous substances cause overactive oxygen in the body, or reduce the amount of antioxidants, the structure and function of cells may be destroyed when the balance of ROS in the body is destroyed [38], and oxidative damage also causes apoptosis [38,39]. Our results show that the content of reactive oxygen species in HCT116 and NCM460 cells increased with the increase of TiO2-NPs concentration under the treatment of less than 60 μg/ml. Moreover, the intracellular ROS content considerably increased compared to control group at the concentration of 30–60 μg/mL TiO2-NPs and reached the highest at 60 μg/mL concentration. This indicates that the excessive accumulation of ROS induced by TiO2-NPs may be an important cause of cytotoxicity.
Due to unique physical and chemical properties of nanomaterials, traditional toxicological detection methods are not often completely applicable. Especially under low-dose exposure of nanomaterials (such as environmental exposure conditions), there is no significant oxidative stress damage, some indirect toxic effects such as secondary toxic reactions and compensatory damage effects are often ignored [39]. In the maintenance and transmission of epigenetic information, RNA editing is an important carrier. RNA levels can change rapidly to alter the stress and metabolic state of cells under endogenous and exogenous stimuli [23,24,40,41,42]. Therefore, microRNA expression levels are considered as sensitive early indicators of the cell/ body response to endogenous and exogenous stimuli [23,24,42].
At present, there are many unknowns about the changing rules and related mechanisms of the changes in microRNA levels caused by nanomaterial exposures [43,44]. There are many regulatory factors in the development and progression of cancer. However, in vivo studies have demonstrated that titanium dioxide facilitates growth of chemically induced colorectal tumors and induce transcriptomic changes suggestive of an impaired immune system and cancer development [35,36,43,44]. MicroRNA regulates cell proliferation, differentiation, and apoptosis, such as cytokines, transcription factors, growth factors, pro-apoptotic and anti-apoptotic genes, by regulating the expression of signaling molecules, indicating that microRNAs are closely related to tumorigenesis development [40,41]. Deregulation of microRNA expression may be an important factor in tumorigenesis and cancer progression [42,45]. New researches suggest that certain expression changes in oncogenes or tumor suppressor genes may also lead to colon cancer [43,44,46]. Moreover, in vitro studies showed that TiO2-NPs induced oxidative stress responses, DNA damage, and micronuclei formation, which showed that TiO2-NPs induce gene expression changes related to signaling, the olfactory/GPCR receptor family, oxidative stress, inflammation, immune system, transport and cancer. The gene expression changes associated with the immune system and inflammation induced by TiO2-NPs suggest the creation of a favorable environment for colon cancer development [37,43,44].
Furthermore, using nuclear factor (NF)-kappa B reporter gene assays, TiO2-NPs-induced IL8 mRNA expression occurs in part through activation of NF-kappa B and p38 mitogen-activated protein kinase pathways in the human colon adenocarcinoma cell line Caco-2 [36] and those results demonstrate that TiO2-NPs cause an activation of inflammatory pathways in the human colon adenocarcinoma cell line Caco-2. Nevertheless, studying changes in microRNA expression may help to more clearly understand the mechanisms of colon cancer development, progression, migration, and recurrence, as well as contribute to the early diagnosis and treatment of colon cancer. The detailed function of microRNA in colon cancer development has not been clearly defined. However, it has been found that the target pathways of microRNAs in colon tissue include cAMP, Wnt, TGF-β, MAPK, and mTOR signaling pathways [47,48,49]. MicroRNAs may control genes in these pathways to regulate colon tissue development and pathology [50].
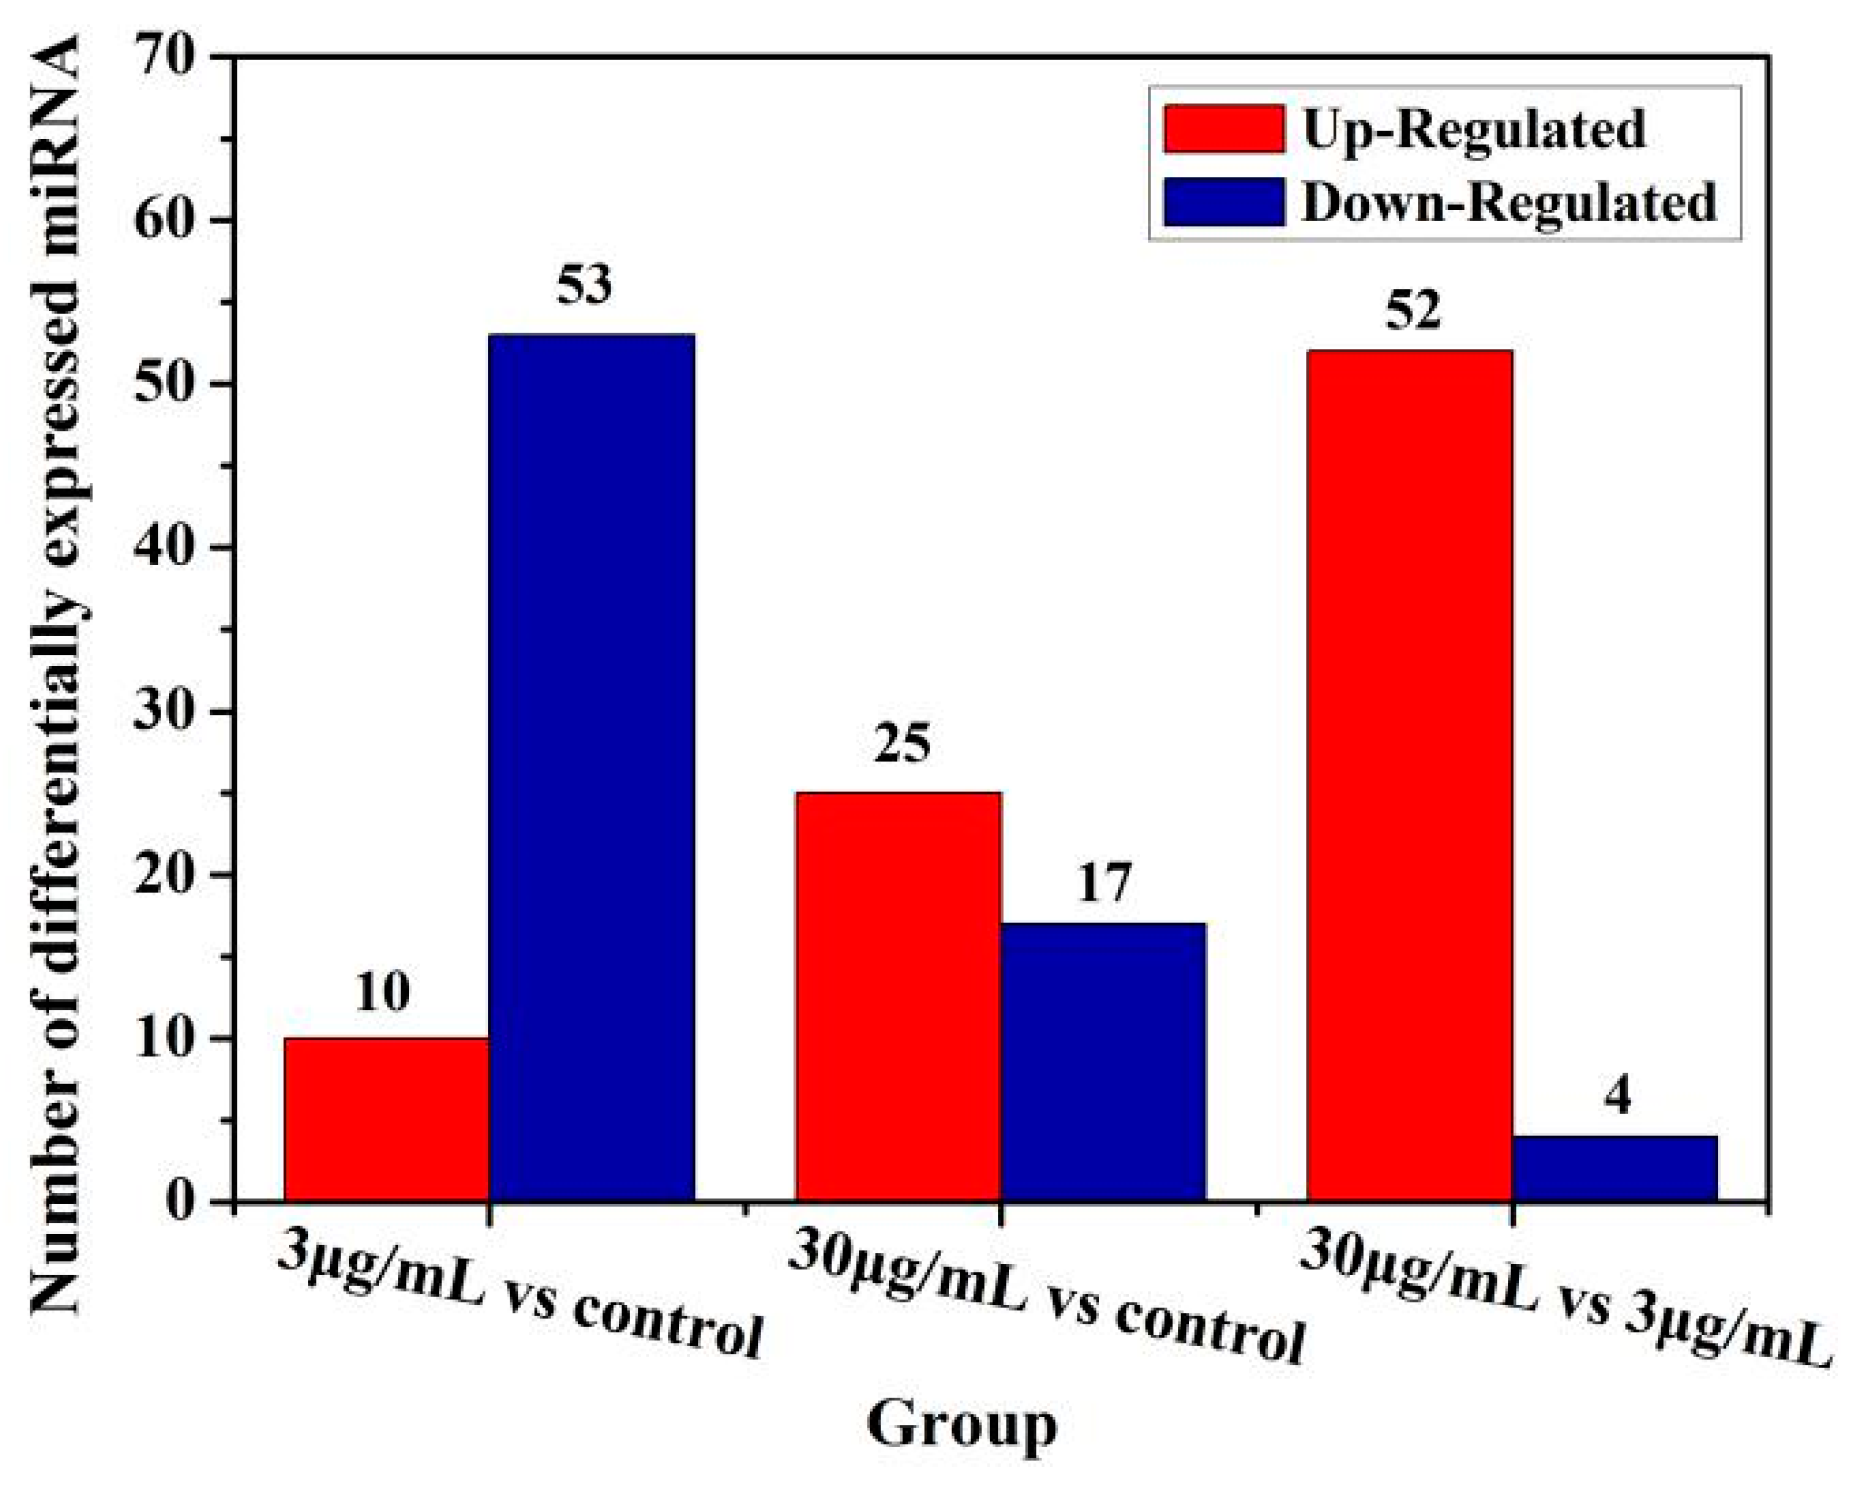
Moreover, function of some microRNAs has been extensively studied. Although the test dose of TiO2-NPs was not significantly cytotoxic to HCT116 cells, the expression of microRNA changed significantly. The expression of microRNA changes was examined in GO function analysis and ingenuity pathway analysis to delineate associated canonical/signaling pathways. The purpose was to analyze microRNA profiling of NCM460 and HCT116 cells after exposure to TiO2-NPs. Comparative analysis identified 34 and 24 microRNAs were significantly altered in the TiO2-NPs treated cells at concentrations of 3 and 30 μg/mL, respectively. Additionally, functional classification demonstrated that a large proportion of genes involved in thiamine metabolism, purine metabolism, glycosaminoglycan biosynthesis—chondroitin sulfate/dermatan sulfate, metabolic pathways, notch signaling pathway, glycosaminoglycan biosynthesis—heparan sulfate/heparin, transcriptional misregulation in cancer, lysine degradation, ECM-receptor interaction, amoebiasis, cAMP pathway and mTOR signaling pathway were significantly upregulated by TiO2-NPs.
In addition, bioinformatics analysis suggested that microRNA 378 may be an early indicator of cellular response to exogenous stimuli with apoptosis signals. Contrary, many genes are known to be regulated by microRNAs, and the expression of microRNAs is altered by nano-titanium dioxide treatment in these pathways. Hence, the microRNA 378 family that is involved in metabolism, transcriptional regulation, protein modification, cell proliferation, differentiation, and apoptosis were altered by TiO2-NPs treatments. However, studies have shown that microRNA 378 has biological functions that regulate a variety of tumor cells, including cell proliferation, migration and invasion, and drug resistance [51,52,53,54]. In gastric cancer, microRNA 378 affects cell proliferation and cell cycle by targeting CDK6 and VEGF genes [52]. Also, microRNA 378 inhibits the growth and proliferation of tumor cells in hepatocellular carcinoma [54]. MicroRNA 378 inhibits proliferation and migration of colon cancer cells by targeting SDAD1 [55]. Specifically, TiO2-NPs altered the expression of certain microRNAs and also regulate relevant microRNAs to their target genes [56,57]. This suggests that nanoparticles may disrupt the expression of genes in cells, and as the regulatory systems, microRNAs may correct perturbations by enhancing transcriptional programs or attenuating aberrant transcripts.

5. Conclusions

MicroRNAs play a crucial role in our biological systems and this is the first study to investigate toxicological effects of TiO2-NPs on the expression of microRNAs in colonic cell lines. MicroRNAs or genes altered by NPs may have adverse effects on the intestinal system by altering certain specific signaling pathways. Altogether, this study indicates that microRNAs may play an important role in TiO2-NPs-mediated colonic cytotoxicity, which may provide a valuable insight into the molecular mechanisms of potential risks in colitis and colon cancer. It is, therefore, necessary to conduct further studies in understanding the molecular mechanisms induced by TiO2-NPs in the regulation of specific microRNAs.

Author Contributions

J.D., and W.L. conceived and designed the experiments; M.X.J., and W.L. performed the experiments; J.H.W., J.B., S.Y., and Z.C. performed statistical analyses; J.D., W.L., M.X.J., J.H.W., Z.Z., J.B., and Z.C. wrote the paper. All authors have read and agreed to the published version of the manuscript.

Funding

This research was funded by National Key R&D Program of China (2018YFE0110200), the National Natural Science Foundation of China (61901168), the Natural Science Foundation of Hunan Province of China (2018JJ4061), the key program of Hunan Provincial Department of science and technology (2016NK2096, 2019NK2111 and 2019SK2121), Program for Science & Technology Innovation Platform/Talents of Hunan Province (2019TP1029), Hunan Scientific Talents Promotion Program of Hunan Association for Science and Technology (2019TJ-Q01), the Scientific Research Fund of Hunan Provincial Education Department (18B290), Zhuzhou Key Science & Technology Program of Hunan Province (2017 and 2019).

Conflicts of Interest

The authors declare no conflict of interest.

References

  1. Auffan, M.; Pedeutour, M.; Rose, J.; Masion, A.; Ziarelli, F.; Borschneck, D.; Chaneac, C.; Botta, C.; Chaurand, P.; Labille, J.; et al. Structural degradation at the surface of a TiO2-based nanomaterial used in cosmetics. Environ. Sci. Technol. 2010, 44, 2689–2694. [Google Scholar] [CrossRef] [PubMed]
  2. Weir, A.; Westerhoff, P.; Fabricius, L.; Hristovski, K.; Von Goetz, N. Titanium dioxide nanoparticles in food and personal care products. Environ. Sci. Technol. 2012, 46, 2242–2250. [Google Scholar] [CrossRef] [PubMed] [Green Version]
  3. Bettini, S.; Boutet-Robinet, E.; Cartier, C.; Coméra, C.; Gaultier, E.; Dupuy, J.; Naud, N.; Taché, S.; Grysan, P.; Reguer, S.; et al. Food-grade TiO2 impairs intestinal and systemic immune homeostasis, initiates preneoplastic lesions and promotes aberrant crypt development in the rat colon. Sci. Rep. 2017, 7, 4037. [Google Scholar] [CrossRef] [PubMed]
  4. Baranowska-Wójcik, E.; Szwajgier, D.; Oleszczuk, P.; Winiarska-Mieczan, A. Effects of Titanium Dioxide Nanoparticles Exposure on Human Health-a Review. Biol. Trace Elem. Res. 2019, 193, 118–129. [Google Scholar] [CrossRef] [PubMed] [Green Version]
  5. Lovisolo, D.; Dionisi, M.; Ruffinatti, F.A.; Distasi, C. Nanoparticles and potential neurotoxicity: Focus on molecular mechanisms. AIMS Mol. Sci. 2018, 5, 1–13. [Google Scholar] [CrossRef]
  6. Grande, F.; Tucci, P. Titanium dioxide nanoparticles: A risk for human health? Mini Rev. Med. Chem. 2016, 16, 762–769. [Google Scholar] [CrossRef]
  7. Jia, X.; Wang, S.; Zhou, L.; Sun, L. The potential liver, brain, and embryo toxicity of titanium dioxide nanoparticles on mice. Nanoscale Res. Lett. 2017, 12, 478. [Google Scholar] [CrossRef]
  8. Shakeel, M.; Jabeen, F.; Qureshi, N.A.; Fakhr-e-Alam, M. Toxic effects of titanium dioxide nanoparticles and titanium dioxide bulk salt in the liver and blood of male Sprague-Dawley rats assessed by different assays. Biol. Trace Elem. Res. 2016, 173, 405–426. [Google Scholar] [CrossRef]
  9. Cui, Y.; Liu, H.; Zhou, M.; Duan, Y.; Li, N.; Gong, X.; Hu, R.; Hong, M.; Hong, F. Signaling pathway of inflammatory responses in the mouse liver caused by TiO2 nanoparticles. J. Biomed. Mater. Res. Part A 2011, 96, 221–229. [Google Scholar] [CrossRef]
  10. Gui, S.; Li, B.; Zhao, X.; Sheng, L.; Hong, J.; Yu, X.; Sang, X.; Sun, Q.; Ze, Y.; Wang, L.; et al. Renal injury and Nrf2 modulation in mouse kidney following chronic exposure to TiO2 nanoparticles. J. Agric. Food Chem. 2013, 61, 8959–8968. [Google Scholar] [CrossRef]
  11. Fartkhooni, F.M.; Noori, A.; Mohammadi, A. Effects of titanium dioxide nanoparticles toxicity on the kidney of male rats. Int. J. Life Sci. 2016, 10, 65–69. [Google Scholar]
  12. Sukwong, P.; Somkid, K.; Kongseng, S.; Pissuwan, D.; Yoovathaworn, K. Respiratory tract toxicity of titanium dioxide nanoparticles and multi-walled carbon nanotubes on mice after intranasal exposure. Micro Nano Lett. 2016, 11, 183–187. [Google Scholar] [CrossRef]
  13. Valentini, X.; Deneufbourg, P.; Paci, P.; Rugira, P.; Laurent, S.; Frau, A.; Stanicki, D.; Ris, L.; Nonclercq, D. Morphological alterations induced by the exposure to TiO2 nanoparticles in primary cortical neuron cultures and in the brain of rats. Toxicol. Rep. 2018, 5, 878–889. [Google Scholar] [CrossRef] [PubMed]
  14. Hong, F.S.; Wang, L.; Yu, X.; Zhou, Y.; Hong, J.; Sheng, L. Toxicological effect of TiO2 nanoparticle-induced myocarditis in mice. Nanoscale Res. Lett. 2015, 10, 326. [Google Scholar] [CrossRef] [PubMed] [Green Version]
  15. Hong, F.; Wang, Y.; Zhou, Y.; Zhang, Q.; Ge, Y.; Chen, M.; Hong, J.; Wang, L. Exposure to TiO2 nanoparticles induces immunological dysfunction in mouse testitis. J. Agric. Food Chem. 2016, 64, 346–355. [Google Scholar] [CrossRef] [PubMed]
  16. Hong, F.; Zhao, X.; Si, W.; Ze, Y.; Wang, L.; Zhou, Y.; Hong, J.; Yu, X.; Sheng, L.; Liu, D.; et al. Decreased spermatogenesis led to alterations of testis- specific gene expression in male mice following nano-TiO2 exposure. J. Hazard. Mater. 2015, 300, 718–728. [Google Scholar] [CrossRef]
  17. Heringa, M.B.; Geraets, L.; van Eijkeren, J.C.; Vandebriel, R.J.; Jong, W.H.; Oomen, A.G. Risk assessment of titanium dioxide nanoparticles via oral exposure, including toxicokinetic considerations. Nanotoxicology 2016, 10, 1515–1525. [Google Scholar] [CrossRef] [Green Version]
  18. Kim, H.; Jeon, D.; Oh, S.; Nam, K.S.; Son, S.; Gye, M.C.; Shin, I. Titanium dioxide nanoparticles induce apoptosis by interfering with EGFR signaling in human breast cancer cells. Environ. Res. 2019, 175, 117–123. [Google Scholar] [CrossRef]
  19. Sahu, S.C.; Tsatsakis, A. microRNAs: Potential biomarkers of toxicity: A special issue of the journal Toxicology Reports. Toxicol. Rep. 2020, 7, 198–199. [Google Scholar] [CrossRef]
  20. Li, W.; Jia, M.X.; Deng, J.; Wang, J.H.; Lin, Q.L.; Tang, J.X.; Liu, X.Y. Down-regulation of microRNA-200b is a potential prognostic marker of lung cancer in southern-central Chinese population. Saudi J. Biol. Sci. 2019, 26, 173–177. [Google Scholar] [CrossRef]
  21. Zhao, Y.; Li, L.; Min, L.; Zhu, L.; Sun, Q.; Zhang, H.; Liu, X.; Zhang, W.; Ge, W.; Wang, J.J.; et al. Regulation of MicroRNAs, and the correlations of MicroRNAs and their targeted genes by zinc oxide nanoparticles in ovarian granulosa cells. PLoS ONE 2016, 11, 0155865. [Google Scholar] [CrossRef] [PubMed] [Green Version]
  22. Li, W.; Jia, M.X.; Wang, J.H.; Lu, J.L.; Deng, J.; Tang, J.X.; Liu, C. Association of MMP9-1562C/T and MMP13-77A/G Polymorphisms with Non-Small Cell Lung Cancer in Southern Chinese Population. Biomolecules 2019, 9, 107. [Google Scholar] [CrossRef] [PubMed] [Green Version]
  23. Thai, S.F.; Wallace, K.A.; Jones, C.P.; Ren, H.; Prasad, R.Y.; Ward, W.O.; Kohan, M.J.; Blackman, C.F. Signaling pathways and microRNA changes in nano-TiO2 treated human lung epithelial (BEAS-2B) cells. J. Nanosci. Nanotechnol. 2015, 15, 492–503. [Google Scholar] [CrossRef] [PubMed]
  24. Frazier, T.P.; Burklew, C.E.; Zhang, B. Titanium dioxide nanoparticles affect the growth and microRNA expression of tobacco (Nicotiana tabacum). Funct. Integr. Genom. 2014, 14, 75–83. [Google Scholar] [CrossRef] [PubMed]
  25. Halappanavar, S.; Jackson, P.; Williams, A.; Jensen, K.; Hougaard, K.S.; Vogel, U.; Yauk, C.; Wallin, H. Pulmonary response to surface-coated nanotitanium dioxide particles includes induction of acute phase response genes, inflammatory cascades, and changes in microRNAs: A toxicogenomic study. Environ. Mol. Mutagen. 2011, 52, 425–439. [Google Scholar] [CrossRef] [Green Version]
  26. Ebert, M.S.; Sharp, P.A. Roles for microRNAs in conferring robustness to biological processes. Cell 2012, 149, 515–524. [Google Scholar] [CrossRef] [Green Version]
  27. Peng, F.; Setyawati, M.I.; Tee, J.K.; Ding, X.; Wang, J.; Nga, M.E.; Leong, D.T. Nanoparticles promote in vivo breast cancer cell intravasation and extravasation by inducing endothelial leakiness. Nat. Nanotechnol. 2019, 14, 279–286. [Google Scholar] [CrossRef]
  28. Fu, Y.; Zhang, Y.; Chang, X.; Zhang, Y.; Ma, S.; Sui, J.; Yin, L.; Pu, Y.; Liang, G. Systemic Immune Effects of Titanium Dioxide Nanoparticles after Repeated Intratracheal Instillation in Rat. Int. J. Mol. Sci. 2014, 15, 6961–6973. [Google Scholar] [CrossRef] [Green Version]
  29. Hong, F.; Zhou, Y.; Ye, L.; Ze, Y.; Ji, J.; Zhuang, J.; Wang, L. Wnt pathway-mediated nano TiO2-induced toxic effects on rat primary cultured Sertoli cells. J. Biomed. Nanotechnol. 2018, 14, 2124–2134. [Google Scholar] [CrossRef]
  30. Guo, T.; Lin, Q.L.; Li, X.H.; Nie, Y.; Wang, L.; Shi, L.M.; Xu, W.; Yang, T.; Luo, F.J. Octacosanol Attenuates Inflammation in Both RAW264.7 Macrophages and a Mouse Model of Colitis. J. Agric. Food Chem. 2017, 65, 3647–3658. [Google Scholar] [CrossRef]
  31. Nie, Y.; Luo, F.J.; Wang, L.; Yang, T.; Shi, L.M.; Li, X.H.; Shen, J.J.; Xu, W.; Guo, T.; Lin, Q.L. Anti-hyperlipidemic effect of rice bran polysaccharide and its potential mechanism in high-fat diet mice. Food Funct. 2017, 8, 4028–4041. [Google Scholar] [CrossRef] [PubMed]
  32. Wang, L.; Lin, Q.L.; Yang, T.; Liang, Y.; Nie, Y.; Luo, Y.; Shen, J.J.; Fu, X.J.; Tang, Y.P.; Luo, F.J. Oryzanol Modifies High Fat Diet-Induced Obesity, Liver Gene Expression Profile, and Inflammation Response in Mice. J. Agric. Food Chem. 2017, 65, 8374–8385. [Google Scholar] [CrossRef] [PubMed]
  33. Liang, Y.; Lin, Q.L.; Huang, P.; Wang, Y.Q.; Li, J.J.; Zhang, L.; Cao, J.Z. Rice Bioactive Peptide Binding with TLR4 To Overcome H2O2-Induced Injury in Human Umbilical Vein Endothelial Cells through NF-κB Signaling. J. Agric. Food Chem. 2018, 66, 440–448. [Google Scholar] [CrossRef] [PubMed]
  34. Rahmani, K.N.; Rasmi, Y.; Abbasi, A.; Koshoridze, N.; Shirpoor, A.; Burjanadze, G.; Saboory, E. Bio-Effects of TiO2 Nanoparticles on Human Colorectal Cancer and Umbilical Vein Endothelial Cell Lines. Asian Pac. J. Cancer Prev. 2018, 19, 2821–2829. [Google Scholar]
  35. Ye, L.; Hong, F.; Ze, X.; Li, L.; Zhou, Y.; Ze, Y. Toxic effects of TiO2 nanoparticles in primary cultured rat sertoli cells are mediated via a dysregulated Ca2+ /PKC/p38 MAPK/NF-κB cascade. J. Biomed. Mater. Res. A 2017, 105, 1374–1382. [Google Scholar] [CrossRef]
  36. Krüger, K.; Cossais, F.; Neve, H.; Klempt, M. Titanium dioxide nanoparticles activate il8-related inflammatory pathways in human colonic epithelial caco-2 cells. J. Nanopart. Res. 2014, 16, 2402–2953. [Google Scholar] [CrossRef]
  37. Proquin, H.; Jetten, M.J.; Jonkhout, M.C.M.; Garduño-Balderas, L.G.; Briedé, J.J.; DeKok, T.M.; Chirino, Y.I.; Van Loveren, H. Gene expression profiling in colon of mice exposed to food additive titanium dioxide (e171). Food Chem. Toxicol. 2017, 111, 153–165. [Google Scholar] [CrossRef]
  38. Saikolappan, S.; Kumar, B.; Shishodia, G.; Koul, S.; Koul, H.K. Reactive Oxygen Species and Cancer: A Complex Interaction. Cancer Lett. 2019, 452, 132–143. [Google Scholar] [CrossRef]
  39. Place, T.L.; Domann, F.E.; Case, A.J. Limitations of Oxygen Delivery to Cells in Culture: An Underappreciated Problem in Basic and Translational Research. Free Radic. Biol. Med. 2017, 13, 311–322. [Google Scholar] [CrossRef]
  40. Chen, Y.; Xu, M.; Zhang, J.; Ma, J.; Gao, M.; Zhang, Z.; Xu, Y.; Liu, S.J. Genome-Wide DNA Methylation Variations upon Exposure to Engineered Nanomaterials and Their Implications in Nanosafety Assessment. Adv. Mater. 2017, 29. [Google Scholar] [CrossRef]
  41. Reddy, K.B. MicroRNA (miRNA) in cancer. Cancer Cell Int. 2015, 15, 28. [Google Scholar] [CrossRef] [PubMed] [Green Version]
  42. Fatica, A.; Bozzoni, I. Long non-coding RNAs: New players in cell differentiation and development. Nat. Rev. Genet. 2014, 15, 7–21. [Google Scholar] [CrossRef]
  43. Li, P.; Chen, S.; Xia, T.; Jiang, X.; Shao, Y.; Xiao, B.; Guo, J. Non-coding RNAs and gastric cancer. World J. Gastroenterol. 2014, 20, 5411–5419. [Google Scholar] [CrossRef] [PubMed]
  44. Proquin, H.; Jetten, M.J.; Jonkhout, M.C.M.; Garduño-Balderas, L.G.; Briedé, J.J.; deKok, T.M.; van Loveren, H.; Chirino, Y.I. Transcriptomics analysis reveals new insights in E171-induced molecular alterations in a mouse model of colon cancer. Sci. Rep. 2018, 8, 9738. [Google Scholar] [CrossRef] [PubMed]
  45. Proquin, H.; Jonkhout, M.C.M.; Jetten, M.J.; van Loveren, H.; Garduño-Balderas, L.G.; de Kok, T.M.; Briedé, J.J. Transcriptome changes in undifferentiated Caco-2 cells exposed to food-grade titanium dioxide (E171): Contribution of the nano- and micro- sized particles. Sci. Rep. 2019, 9, 18287. [Google Scholar] [CrossRef] [PubMed]
  46. Ha, T.Y. MicroRNAs in human diseases: From cancer to cardiovascular disease. Immune Netw. 2011, 11, 135–154. [Google Scholar] [CrossRef] [PubMed] [Green Version]
  47. Hao, Y.; Baker, D.; Dijke, P.T. TGF-β-mediated epithelial-mesenchymal transition and cancer metastasis. Int. J. Mol. Sci. 2019, 20, 2767. [Google Scholar] [CrossRef] [Green Version]
  48. Rahman, M.S.; Akhtar, N.; Jamil, H.M.; Banik, B.S.; Asaduzzaman, S.M. TGF-β/BMP signaling and other molecular events: Regulation of osteoblastogenesis and bone formation. Bone Res. 2015, 3, 15005. [Google Scholar] [CrossRef] [Green Version]
  49. Chen, W.; Zhou, S.; Mao, L.; Zhang, H.; Sun, D.; Zhang, J.; Li, J.; Tang, J. Crosstalk between TGF-β signaling and miRNAs in breast cancer metastasis. Tumor Biol. 2016, 37, 10011–10019. [Google Scholar] [CrossRef]
  50. Fanale, D.; Amodeo, V.; Bazan, V.; Insalaco, L.; Incorvaia, L.; Barraco, N.; Castiglia, M.; Rizzo, S.; Santini, D.; Giordano, A.; et al. Can the microRNA expression profile help to identify novel targets for zoledronic acid in breast cancer? Oncotarget 2016, 7, 29321–29332. [Google Scholar] [CrossRef] [Green Version]
  51. Slattery, M.L.; Lee, F.Y.; Pellatt, A.J.; Mullany, L.E.; Stevens, J.R.; Samowitz, W.S.; Wolff, R.K.; Herrick, J.S. Infrequently expressed miRNAs in colorectal cancer tissue and tumor molecular phenotype. Mod. Pathol. 2017, 30, 1152–1169. [Google Scholar] [CrossRef] [PubMed]
  52. Deng, H.; Guo, Y.; Song, H.; Xiao, B.; Sun, W.; Liu, Z.; Yu, X.; Xia, T.; Cui, L.; Guo, J. MicroRNA-195 and microRNA-378 mediate tumor growth suppression by epigenetical regulation in gastric cancer. Gene 2013, 518, 351–359. [Google Scholar] [CrossRef] [PubMed]
  53. Chen, X.; Jiang, Y.; Huang, Z.; Li, D.; Chen, X.; Cao, M.; Meng, Q.; Pang, H.; Sun, L.; Zhao, Y.; et al. miRNA-378 reverses chemoresistance to cisplatin in lung adenocarcinoma cells by targeting secreted clusterin. Sci. Rep. 2016, 6, 19455. [Google Scholar] [CrossRef] [Green Version]
  54. Niu, J.; Meng, X.; Ren, J. Studied microRNA gene expression in human hepatocellular carcinoma by microRNA microarray techniques. World J. Gastroenterol. 2015, 21, 12605–12611. [Google Scholar] [CrossRef] [PubMed]
  55. Zeng, M.X.; Zhu, L.L.; Li, L.P.; Kang, C.M. MiR-378 suppresses the proliferation, migration and invasion of colon cancer cells by inhibiting SDAD1. Cell. Mol. Biol. Lett. 2017, 22, 12. [Google Scholar] [CrossRef] [PubMed] [Green Version]
  56. Boykov, I.N.; Shuford, E.; Zhang, B.H. Nanoparticle titanium dioxide affects the growth and microRNA expression of switchgrass (Panicum virgatum). Genomics 2019, 111, 450–456. [Google Scholar] [CrossRef]
  57. Sui, J.; Fu, Y.Y.; Zhang, Y.Q.; Ma, S.M.; Yin, L.H.; Pu, Y.P.; Liang, G.Y. Molecular mechanism for miR-350 in regulating of titanium dioxide nanoparticles in macrophage RAW264.7 cells. Chem. Biol. Interact. 2018, 280, 77–85. [Google Scholar] [CrossRef]
Figure 1. Characterization of nanomaterials. (a) XRD pattern of titanium dioxide nanoparticles (TiO2-NPs); (b) TEM image of TiO2-NPs.
Cancers 12 01236 g001
Figure 2. Cytotoxicity of TiO2-NPs against HCT116 and NCM460 cell lines. The experiments were carried out in triplicate and data presented are in mean values. * indicates p < 0.05.
Cancers 12 01236 g002
Figure 3. TiO2-NPs induces oxidative stress. The cells were treated with 3 to 60 μg/mL of titanium dioxide NPs within 24 h. The experiments were carried out in triplicate and data presented are in mean values, * indicates p < 0.05, ** indicates p < 0.01.
Cancers 12 01236 g003
Figure 4. Proportion of small RNAs among different categories. To make every unique small RNA mapped to only one annotation, we follow the following priority rule: microRNA > piRNA > snRNA > Rfam > other RNAs. (a) Pie diagram for annotation of small RNA in control HCT116 cell lines (total for each category); (b) Pie diagram for annotation of small RNA in TiO2-NPs-3μg/mL treated HCT116 cell lines (total for each category); (c) Pie diagram for annotation of small RNA in TiO2-30 μg/mL treated HCT116 cell lines (total for each category).
Cancers 12 01236 g004
Figure 5. Graph of statistical numbers of differentially expressed microRNA. X-axis represents each pair of differential alignment schemes, and Y-axis represents the corresponding number of differential microRNAs. A vs B means sample B is the control and sample A is the case. If a gene is upregulated it means the expression of this gene is upregulated in sample A compared to sample B.
Cancers 12 01236 g005
Figure 6. GO classification map of target genes of differential microRNAs. (a) 3 μg/mL group VS control group; (b). 30 μg/mL group VS control group. X-axis represents number of DEGs (the number is presented by its square root value), Y-axis represents GO terms. All GO terms are grouped into three ontologies: blue is for biological processes, brown is for cellular component, and orange is for molecular function.
Cancers 12 01236 g006aCancers 12 01236 g006b
Figure 7. The KEGG pathway annotation classification chart of the differential microRNA target gene. (a) 3 μg/mL group VS control group; (b) 30 μg/mL group VS control group. The abscissa is the number of target genes that differ in small RNA, and the ordinate represents the secondary KEGG pathway. The secondary pathways belong to different primary pathways, respectively, and different levels represent the first-level communication categories.
Cancers 12 01236 g007aCancers 12 01236 g007b
Figure 8. The expression patterns of microRNAs 378b and 378g at 3 and 60 μg/mL treatments in HCT116 and NCM460 cell lines. (a) Expression of microRNAs 378b; (b) Expression of microRNAs 378g. The experiments were carried out as in triplicate and data presented are in represent mean values. * indicates means p < 0.05, ** indicates means p < 0.01.
Cancers 12 01236 g008
Table 1. List of microRNA reverse transcriptional stem-loop primer sequences.
Gene NameLoop-RT Primer Sequence
Homo U6GTCGTATCCAGTGCAGGGTCCGAGGTATTCGCACTGGATACGACAAAATA
hsa-miR-378bGTCGTATCCAGTGCAGGGTCCGAGGTATTCGCACTGGATACGACTTCTGC
hsa-miR-378gGTCGTATCCAGTGCAGGGTCCGAGGTATTCGCACTGGATACGACCTTCTG
Table 2. List of upstream and downstream primer sequences.
Primer NameSequence (5′–3′)
Homo U6 Forward primerAGAGAAGATTAGCATGGCCCCTG
hsa-miR-378b Forward primerGCGCGACTGGACTTGGAG
hsa-miR-378g Forward primerCGCGACTGGGCTTGGAGT
General Reverse primerAGTGCAGGGTCCGAGGTATT
Table 3. Alignment statistics of tags align to reference genome.
Sample NameTotal TagMapped TagPercentage (%)
control34,995,30229,921,24985.50
TiO2-NPs-3 μg/mL34,231,51228,095,34682.07
TiO2-NPs-30 μg/mL39,190,34730,681,92678.29
Table 4. List of total microRNAs significantly regulated by TiO2-NPs. The fold change was the log2-Ratio value, cut-off at log2-Ratio ≥ 1 or log2Ratio ≤ −1.
TiO2-NPs-3μg/mLFold ChangeTiO2-NPs-30μg/mLFold Change
hsa-miR-378f3.520946008hsa-miR-378e4.722807531
hsa-miR-103a-3p2.953306765hsa-miR-199b-3p3.924812504
hsa-miR-27b-5p2.214124805hsa-miR-44432.025090981
hsa-miR-44432.201674124hsa-miR-101-3p1.893084796
hsa-miR-378g2.175707743hsa-miR-1307-5p1.620411337
hsa-miR-374c-3p1.415037499hsa-miR-378b1.61172941
hsa-miR-378i−4.07681560hsa-miR-103a-3p1.463602466
hsa-miR-374b-5p−3.824842349hsa-miR-210-3p1.429585808
hsa-miR-4284−3.148259549hsa-miR-193b-3p1.180827839
hsa-let-7f-2-3p−2.626782676hsa-miR-629-5p1.152003093
hsa-miR-501-5p−2.163975735hsa-miR-339-3p1.025943267
hsa-miR-24-3p−2.138268765hsa-miR-199a-3p−7.105035471
hsa-miR-3656−2.080703096hsa-miR-378i−6.169925001
hsa-miR-3074-5p−1.826741314hsa-miR-378g−3.798524718
hsa-miR-132-3p−1.712341807hsa-miR-548ae-5p−3.321928095
hsa-miR-339-5p−1.656663966hsa-miR-374b-5p−3.228198043
hsa-miR-3960−1.506687086hsa-miR-4284−1.982249598
hsa-miR-6821-5p−1.436099115hsa-miR-132-3p−1.712341807
hsa-miR-7704−1.395592382hsa-miR-1246−1.695664562
hsa-miR-143-3p−1.358520148hsa-miR-339-5p−1.5334322
hsa-let-7a-3p−1.311523999hsa-miR-24-3p−1.389680675
hsa-miR-135b-5p−1.300942024hsa-miR-1290−1.253756592
hsa-miR-5701−1.247461602hsa-miR-143-3p−1.130466392
hsa-miR-148b-3p−1.235501962hsa-miR-5701−1.003732719
hsa-miR-1290−1.208769137
hsa-miR-29b-3p−1.198023321
hsa-miR-96-5p−1.168774188
hsa-miR-103b−1.141661149
hsa-miR-128-3p−1.132807408
hsa-miR-4532−1.114263111
hsa-let-7i-3p−1.101879614
hsa-miR-33b-3p−1.091524104
hsa-miR-151b−1.032454631
Table 5. Altered canonical pathways by TiO2-NPs in HCT116 cells.
TiO2-NPs-3 μg/mLTiO2-NPs-30 μg/mL
Thiamine metabolismThiamine metabolism
Purine metabolismPurine metabolism
Glycosaminoglycan biosynthesis—chondroitin sulfate/dermatan sulfateTranscriptional misregulation in cancer
Glycosaminoglycan biosynthesis—heparan sulfate/heparinMetabolic pathways
Transcriptional misregulation in cancerGlycosaminoglycan biosynthesis—chondroitin sulfate/dermatan sulfate
Metabolic pathwaysGlycosaminoglycan biosynthesis—heparan sulfate/heparin
Notch signaling pathwayPhosphatidylinositol signaling system
ECM-receptor interactionNotch signaling pathway
Vibrio cholerae infectionEndocytosis
Lysine degradationBreast cancer
AmoebiasisLysine degradation
Hedgehog signaling pathwayN-Glycan biosynthesis
Axon guidanceHippo signaling pathway—multiple species
cAMP pathwaySignaling pathways regulating pluripotency of stem cells
Gap junctioncAMP pathway
MicroRNAs in cancer
Prion diseases
mTOR signaling pathway
MAPK/ERK pathway
Table 6. List of predicted microRNA 378b target gene.
Target GeneGene NameCumulative Weighted Context++ Score
GOLT1Agolgi transport 1A−0.59
SBDSShwachman–Bodian–Diamond syndrome−0.47
EIF4G3eukaryotic translation initiation factor 4 gamma, 3−0.47
KIAA1522KIAA1522−0.46
VANGL1VANGL planar cell polarity protein 1−0.46
ZFP36L2ZFP36 ring finger protein-like 2−0.39
PTPRTprotein tyrosine phosphatase, receptor type, T−0.36
TOB2transducer of ERBB2, 2−0.34
ATG12autophagy related 12−0.32
MAPK1mitogen-activated protein kinase 1−0.31
DACT1dishevelled-binding antagonist of beta-catenin 1−0.31
KIF2Akinesin heavy chain member 2A−0.31
VAT1Lvesicle amine transport 1-like−0.29
RBMS1RNA binding motif, single-stranded interacting protein 1−0.29
SAMD1sterile alpha motif domain containing 1−0.27
SCAMP2secretory carrier membrane protein 2−0.27
RNF144Bring finger protein 144B−0.26
PIWIL2piwi-like RNA-mediated gene silencing 2−0.25
ZDHHC9zinc finger, DHHC-type containing 9−0.22
SUFUsuppressor of fused homolog (Drosophila)−0.22
GSTM4glutathione S-transferase mu 4−0.20
CSNK1G2casein kinase 1, gamma 2−0.20
UBQLN4ubiquilin 4−0.19
ALPK3alpha-kinase 3−0.18
CTDP1CTD (carboxy-terminal domain, RNA polymerase II, polypeptide A) phosphatase, subunit 1−0.17
DYNC1LI2dynein, cytoplasmic 1, light intermediate chain 2−0.17
WDR37WD repeat domain 37−0.17
IGF1Rinsulin-like growth factor 1 receptor−0.16
ZKSCAN1zinc finger with KRAB and SCAN domains 1−0.15
CADM4cell adhesion molecule 4−0.15
FCRLBFc receptor-like B−0.15
CUEDC1CUE domain containing 1−0.14
PHF15PHD finger protein 15−0.14
Table 7. List of predicted microRNA 378g target gene.
Target GeneGene NameCumulative Weighted Context++ Score
STARD9StAR-related lipid transfer (START) domain containing 9−1.01
AKAP13A kinase (PRKA) anchor protein 13−0.88
TMEM91transmembrane protein 91−0.88
ADM2adrenomedullin 2−0.88
HMHB1histocompatibility (minor) HB-1−0.84
MYL12Bmyosin, light chain 12B, regulatory−0.79
GP9glycoprotein IX (platelet)−0.78
NDUFA4L2NADH dehydrogenase (ubiquinone) 1 alpha subcomplex, 4-like 2−0.78
GRAPLGRB2-related adaptor protein-like−0.78
DAD1defender against cell death 1−0.75
SLC39A4solute carrier family 39 (zinc transporter), member 4−0.75
GAS8growth arrest-specific 8−0.73
SCAMP5secretory carrier membrane protein 5−0.72
ERI3ERI1 exoribonuclease family member 3−0.72
CARD16caspase recruitment domain family, member 16−0.71
GLTPD1glycolipid transfer protein domain containing 1−0.69
IFI30Interferon, gamma-inducible protein 30−0.69
CASP5caspase 5, apoptosis-related cysteine peptidase−0.68
ME3malic enzyme 3, NADP(+)-dependent, mitochondrial−0.64
KCNB1potassium voltage-gated channel, Shab-related subfamily, member 1−0.64
PPP4R1Lprotein phosphatase 4, regulatory subunit 1-like−0.64
BCL2L2BCL2-like 2−0.56
NKAIN1Na+/K+ transporting ATP ase interacting 1−0.55
MAP3K3mitogen-activated protein kinase kinase kinase 3−0.49
PRKACGprotein kinase, cAMP-dependent, catalytic, gamma−0.47
BOCBOC cell adhesion-associated, oncogene regulated−0.47
PRKACAprotein kinase, cAMP-dependent, catalytic, alpha−0.45
MAPK3mitogen-activated protein kinase 3−0.42
GRB2growth factor receptor-bound protein 2−0.40

