Urine Endocannabinoids as Novel Non-Invasive Biomarkers for Bladder Cancer at Early Stage

 ,
,  , ,
, ,  ,
,  and
and
Abstract
1. Introduction
2. Results
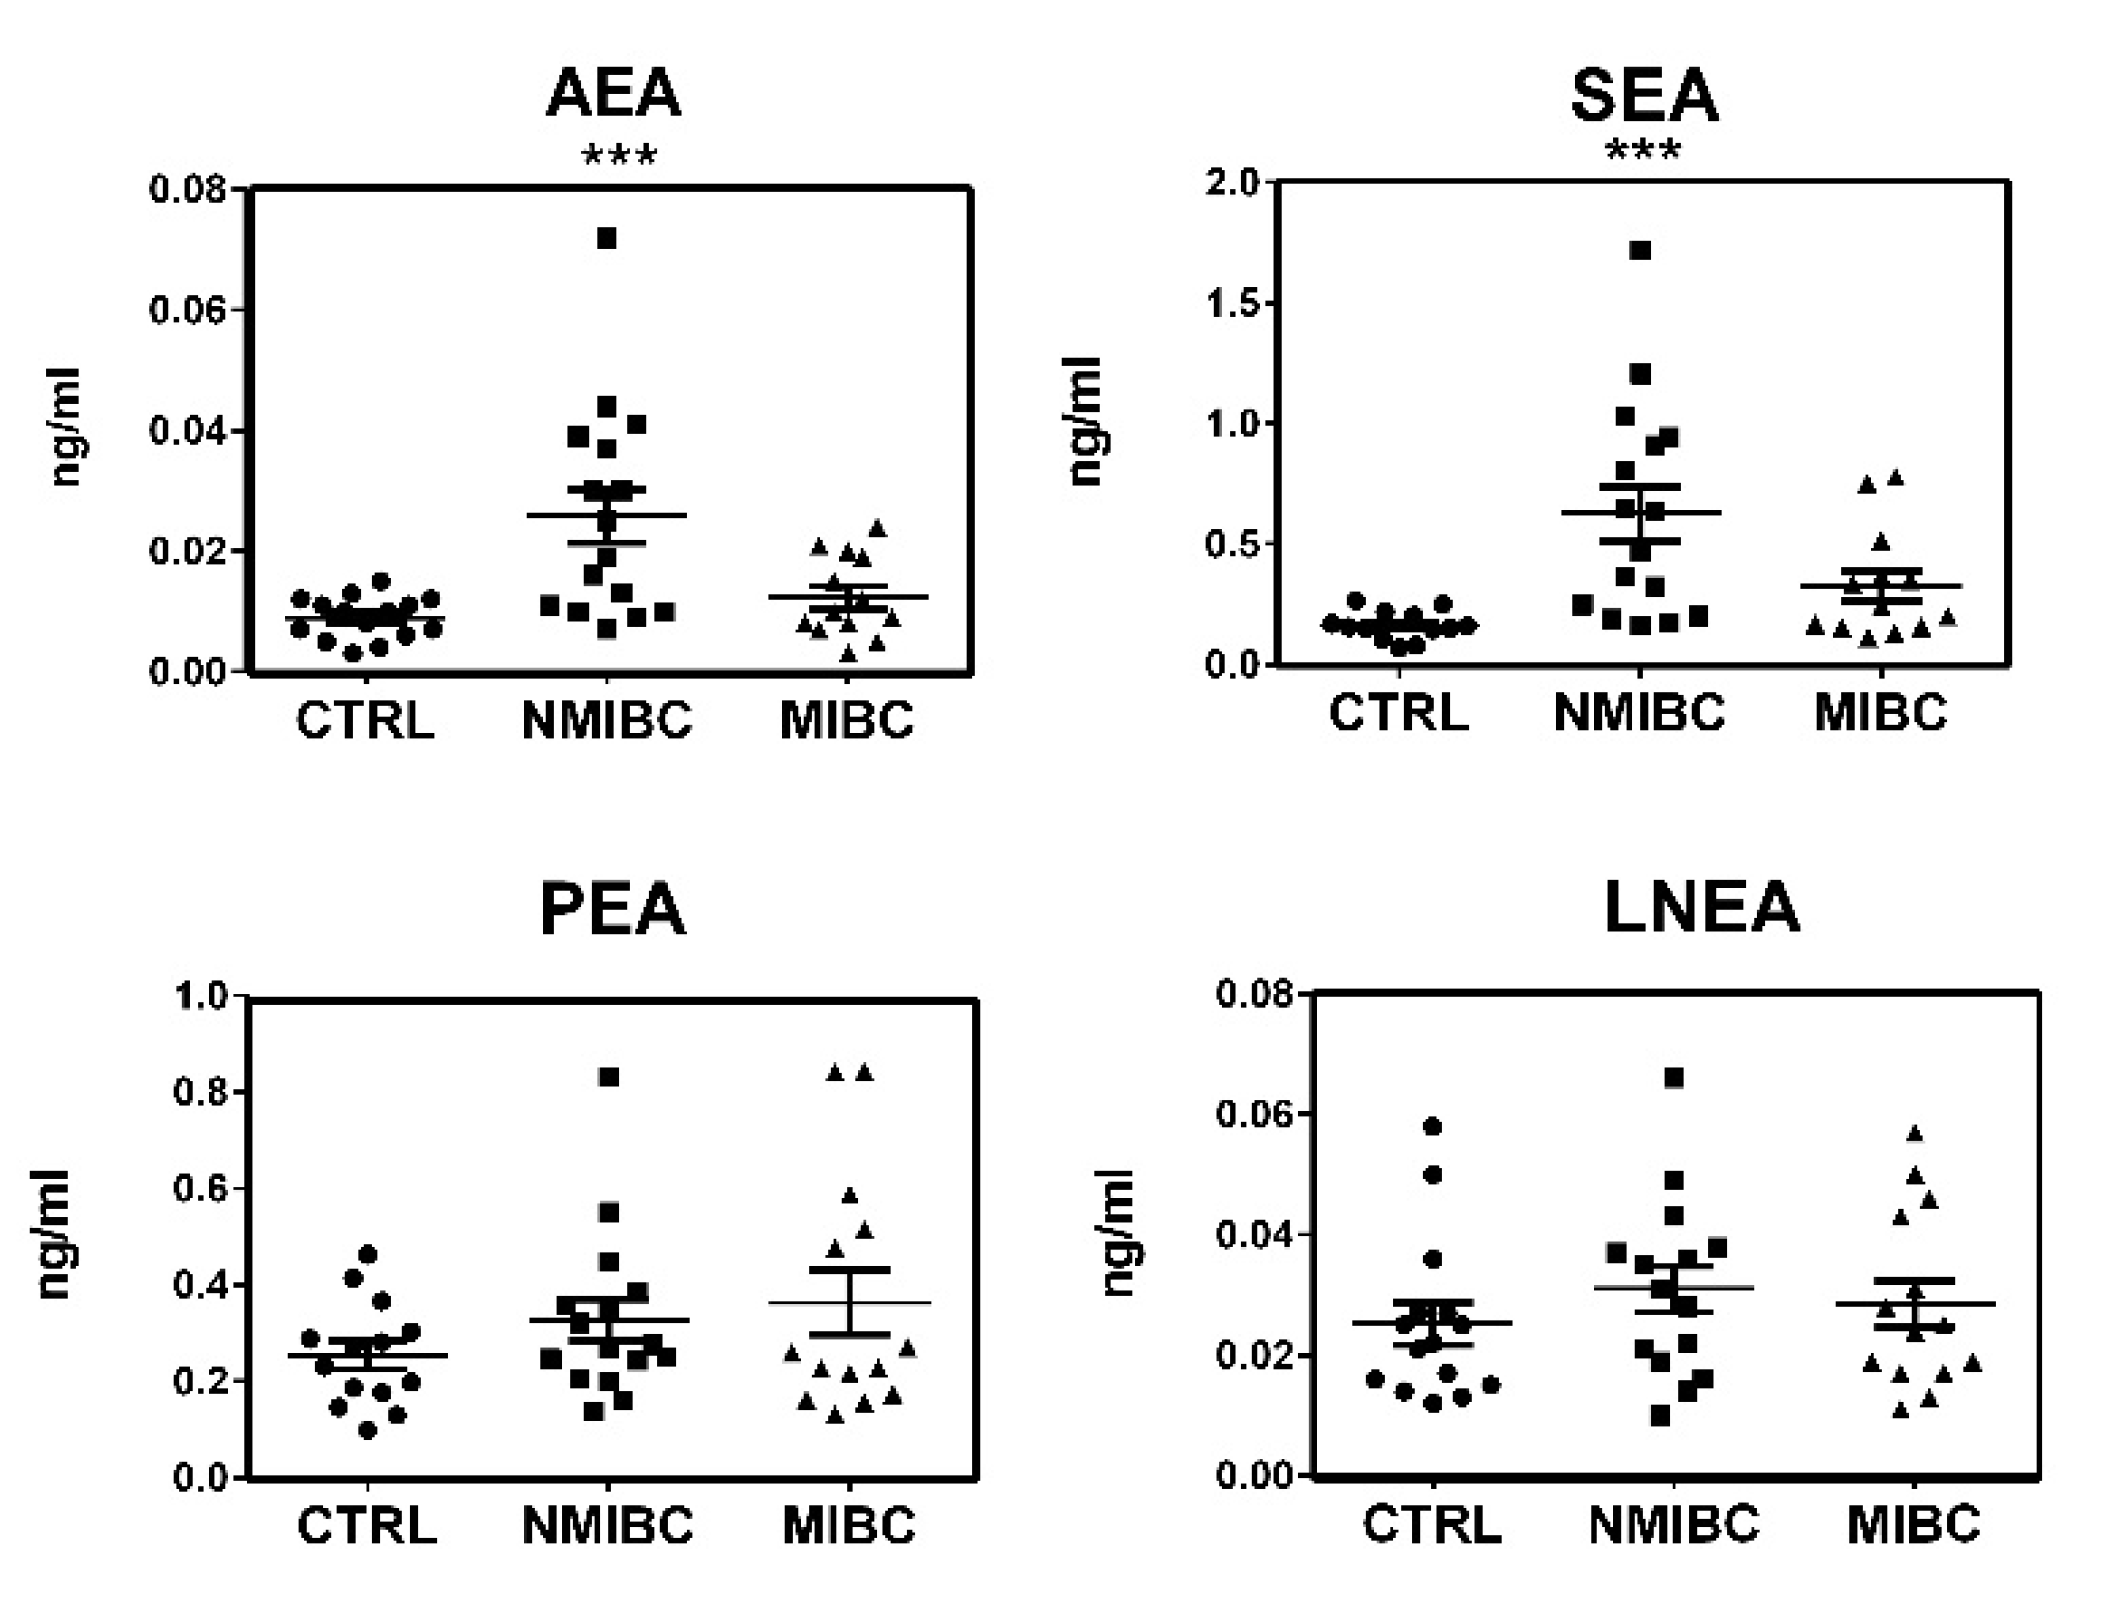
2.1. EC and NAE Quantification in Urine
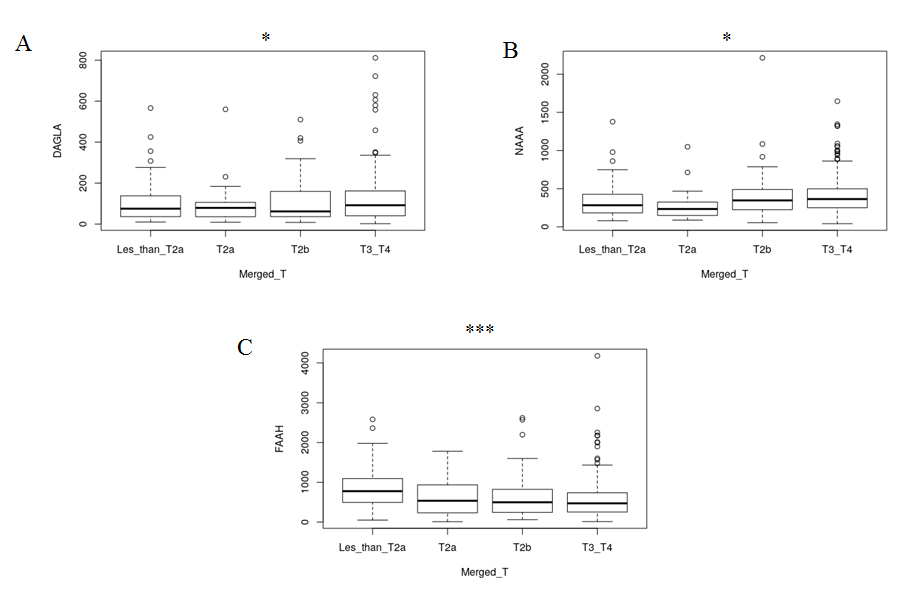
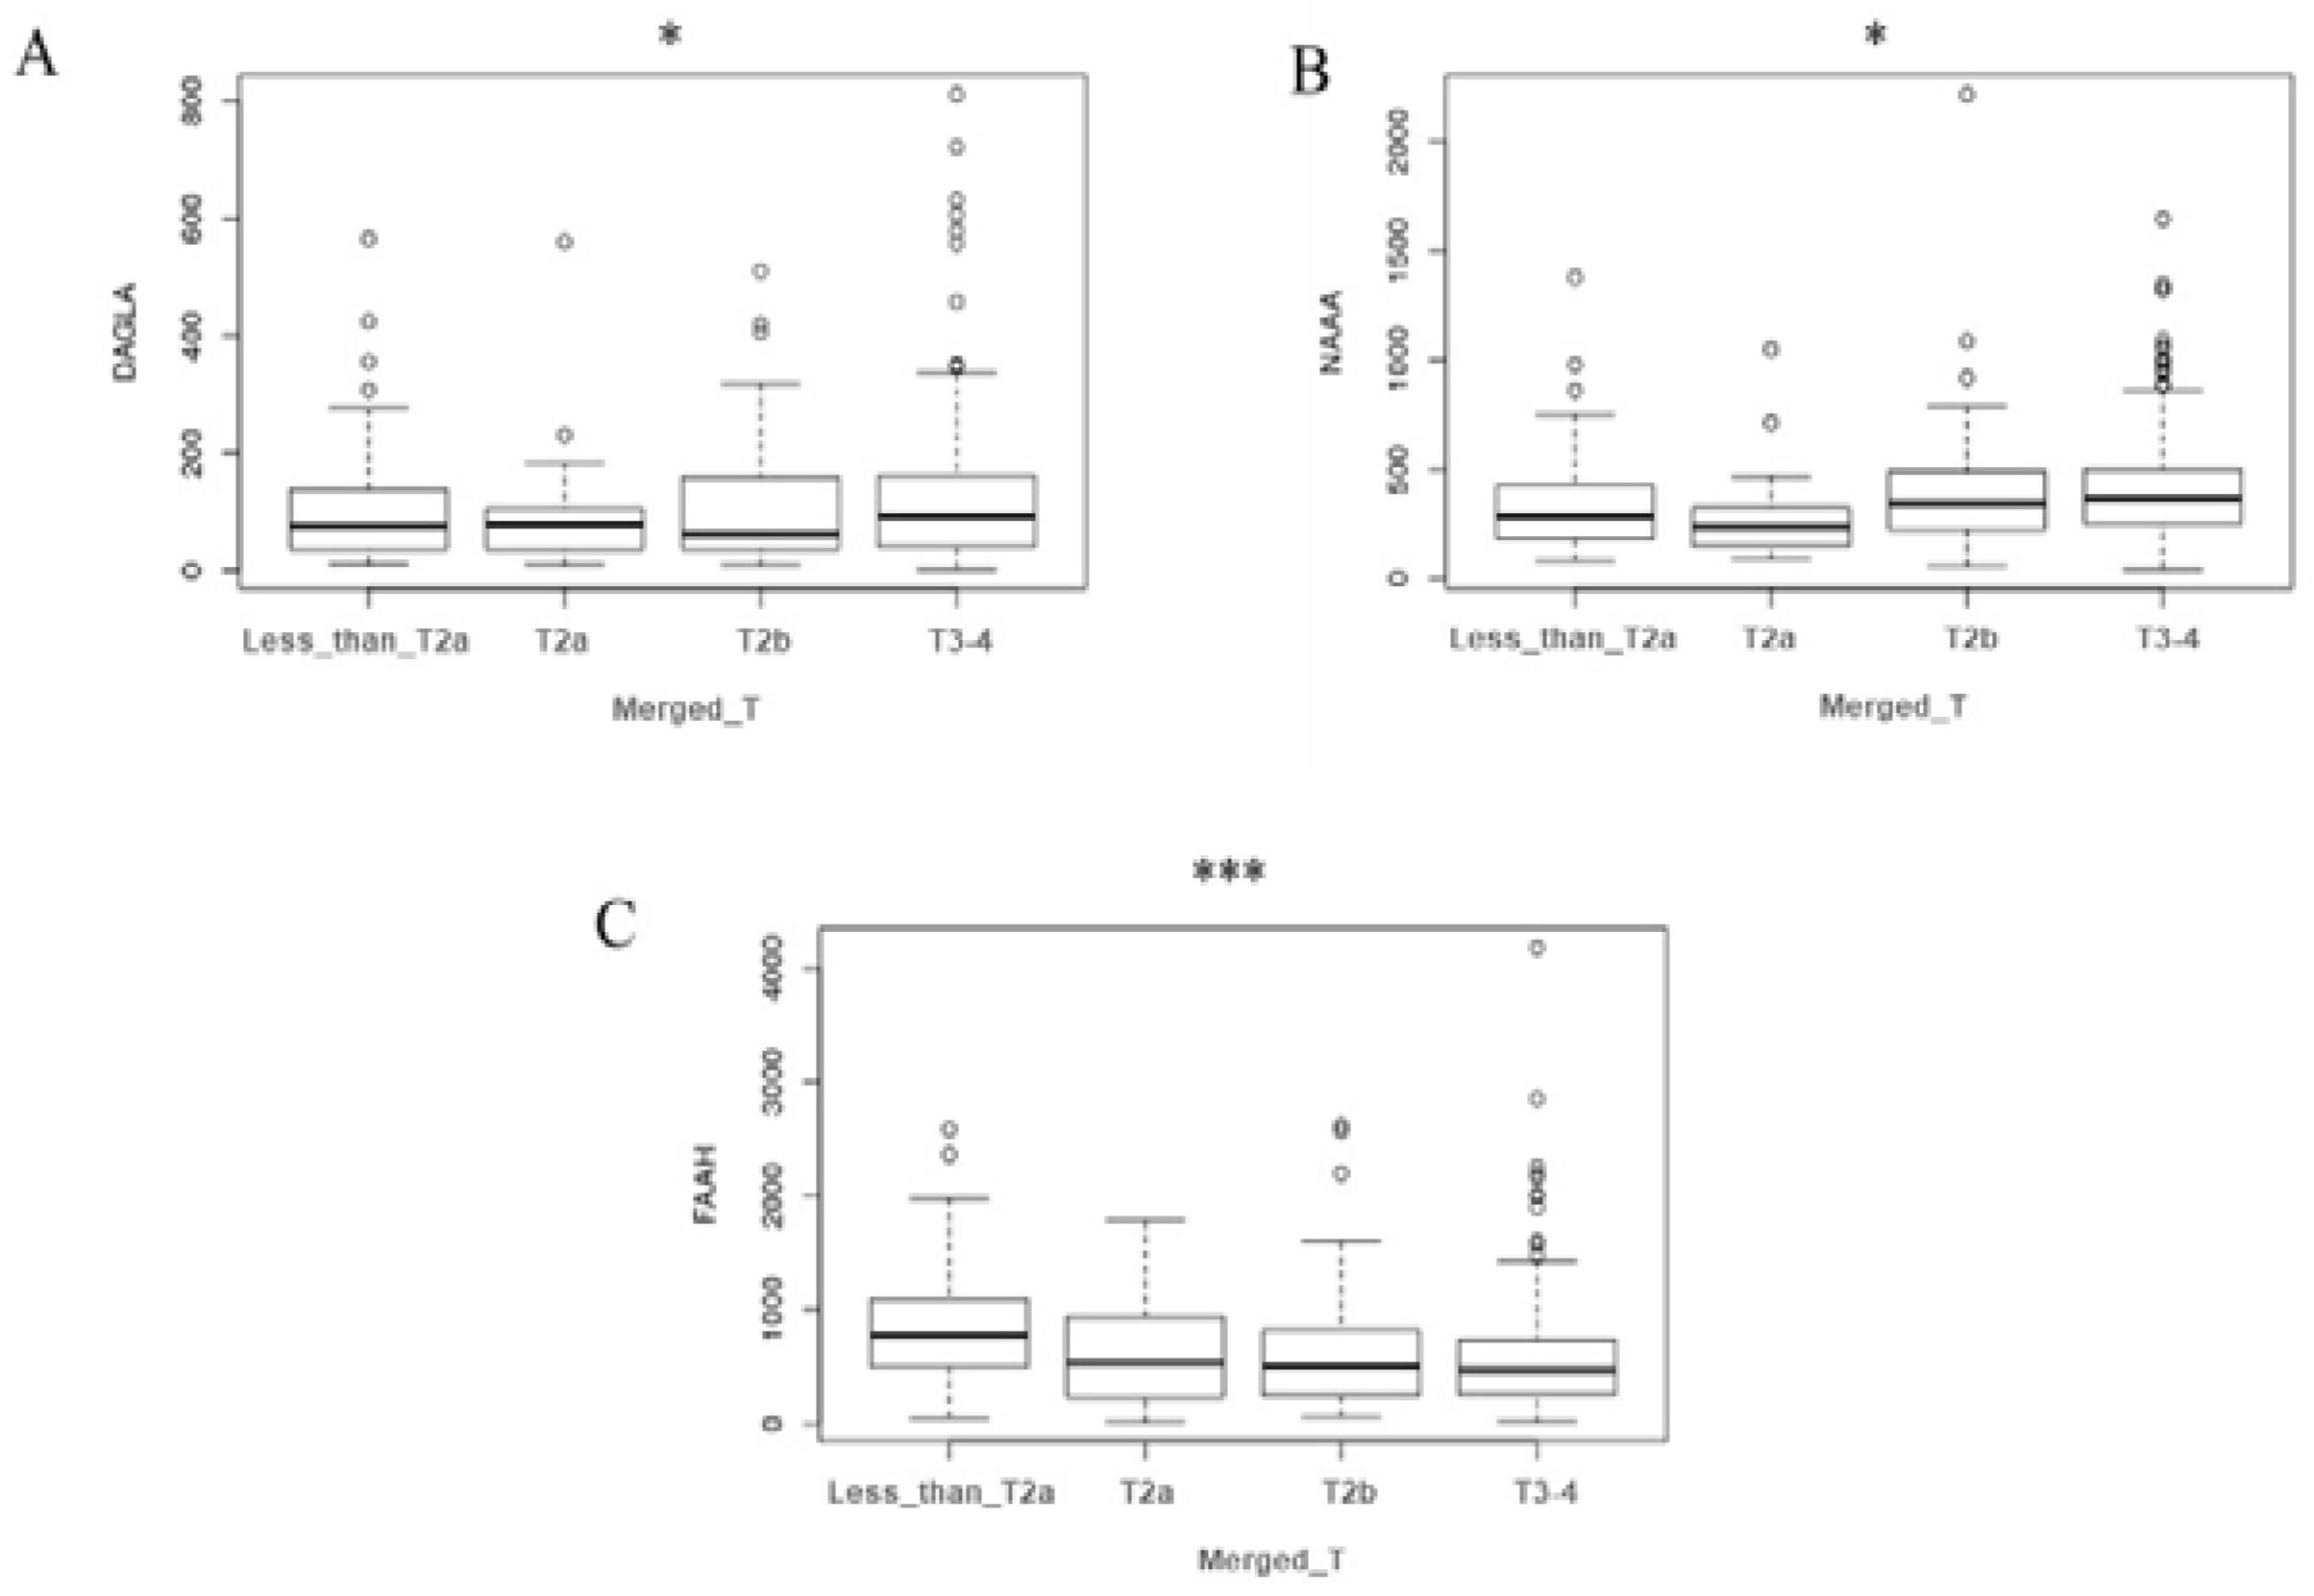
2.2. The Cancer Genome Atlas Analysis
3. Discussion
4. Materials and Methods
4.1. Reagents and Solvents
4.2. Patients Selection and Urine Collection
4.3. EC and NAE Quantification in Urine
4.4. Creatinine Quantification in Urine
4.5. The Cancer Genome Atlas Analysis
4.6. Statistical Analysis
5. Conclusions
Author Contributions
Funding
Acknowledgments
Conflicts of Interest
References
- Antoni, S.; Ferlay, J.; Soerjomataram, I.; Znaor, A.; Jemal, A.; Bray, F. Bladder Cancer Incidence and Mortality: A Global Overview and Recent Trends. Eur. Urol. 2017, 71, 96–108. [Google Scholar] [CrossRef] [PubMed]
- Siegel, R.L.; Miller, K.D.; Jemal, A. Cancer statistics, 2019. CA: Cancer J. Clin. 2019, 69, 7–34. [Google Scholar] [CrossRef] [PubMed]
- Ferlay, J.; Colombet, M.; Soerjomataram, I.; Dyba, T.; Randi, G.; Bettio, M.; Gavin, A.; Visser, O.; Bray, F. Cancer incidence and mortality patterns in Europe: Estimates for 40 countries and 25 major cancers in 2018. Eur. J. Cancer 2018, 103, 356–387. [Google Scholar] [CrossRef] [PubMed]
- Subiela, J.D.; Faba Óscar, R.; Guerrero-Ramos, F.; Reyes, H.V.; Pisano, F.; Breda, A.; Palou, J. Carcinoma In Situ of the Urinary Bladder: A Systematic Review of Current Knowledge Regarding Detection, Treatment, and Outcomes. Eur. Urol. Focus 2019, 2405. [Google Scholar] [CrossRef] [PubMed]
- Smith, A.; Jaeger, B.C.; Pinheiro, L.C.; Edwards, L.; Tan, H.-J.; Nielsen, M.E.; Reeve, B.B. Impact of bladder cancer on health-related quality of life. BJU Int. 2017, 121, 549–557. [Google Scholar] [CrossRef]
- Fonseca, B.M.; Costa, M.; Almada, M.; Correia-Da-Silva, G.; Teixeira, N. Endogenous cannabinoids revisited: A biochemistry perspective. Prostaglandins Other Lipid Mediat. 2013, 102, 13–30. [Google Scholar] [CrossRef]
- Chanda, D.; Neumann, D.; Glatz, J.F. The endocannabinoid system: Overview of an emerging multi-faceted therapeutic target. Prostaglandins Leukot. Essent. Fat. Acids 2019, 140, 51–56. [Google Scholar] [CrossRef]
- Lu, Y.; Anderson, H.D. Cannabinoid signaling in health and disease. Can. J. Physiol. Pharmacol. 2017, 95, 311–327. [Google Scholar] [CrossRef]
- Bakali, E.; Elliott, R.A.; Taylor, A.; Willets, J.; Konje, J.; Tincello, U.G. Distribution and function of the endocannabinoid system in the rat and human bladder. Int. Urogynecol. J. 2012, 24, 855–863. [Google Scholar] [CrossRef]
- Hedlund, P. Cannabinoids and the endocannabinoid system in lower urinary tract function and dysfunction. Neurourol. Urodyn. 2013, 33, 46–53. [Google Scholar] [CrossRef]
- Moreno, E.; Cavic, M.; Krivokuca, A.; Casadó, V.; Hedlund, E.; Canela, P. The Endocannabinoid System as a Target in Cancer Diseases: Are We There Yet? Front Pharmacol. 2019, 10, 339. [Google Scholar] [CrossRef] [PubMed]
- Velasco, G.; Sanchez, C.; Guzmán, M. Endocannabinoids and Cancer. Gener. Eff. Ther. Implic. 2015, 231, 449–472. [Google Scholar]
- Fraguas-Sánchez, A.; Torres-Suárez, A.-I.; Martín-Sabroso, C. Insights into the effects of the endocannabinoid system in cancer: A review. Br. J. Pharmacol. 2018, 175, 2566–2580. [Google Scholar] [CrossRef]
- Khan, M.I.; Sobocińska, A.A.; Czarnecka, A.M.; Król, M.; Botta, B.; Szczylik, C. The Therapeutic Aspects of the Endocannabinoid System (ECS) for Cancer and their Development: From Nature to Laboratory. Curr. Pharm. Des. 2016, 22, 1756–1766. [Google Scholar] [CrossRef] [PubMed]
- Lauria, S.; Perrotta, C.; Casati, S.; Di Renzo, I.; Ottria, R.; Eberini, I.; Palazzolo, L.; Parravicini, C.; Ciuffreda, P. Design, synthesis, molecular modelling and in vitro cytotoxicity analysis of novel carbamate derivatives as inhibitors of Monoacylglycerol lipase. Bioorganic Med. Chem. 2018, 26, 2561–2572. [Google Scholar] [CrossRef]
- Carnovali, M.; Ottria, R.; Pasqualetti, S.; Banfi, G.; Ciuffreda, P.; Mariotti, M. Effects of bioactive fatty acid amide derivatives in zebrafish scale model of bone metabolism and disease. Pharmacol. Res. 2016, 104, 1–8. [Google Scholar] [CrossRef]
- Gasperi, V.; Evangelista, D.; Oddi, S.; Florenzano, F.; Chiurchiù, V.; Avigliano, L.; Catani, M.V.; Maccarrone, M. Regulation of inflammation and proliferation of human bladder carcinoma cells by type-1 and type-2 cannabinoid receptors. Life Sci. 2015, 138, 41–51. [Google Scholar] [CrossRef]
- Bettiga, A.; Aureli, M.; Colciago, G.; Murdica, V.; Moschini, M.; Lucianò, R.; Canals, D.; Hannun, Y.; Hedlund, P.; Lavorgna, G.; et al. Bladder cancer cell growth and motility implicate cannabinoid 2 receptor-mediated modifications of sphingolipids metabolism. Sci. Rep. 2017, 7, 42157. [Google Scholar] [CrossRef]
- Vago, R.; Bettiga, A.; Salonia, A.; Ciuffreda, P.; Ottria, R. Development of new inhibitors for N-acylethanolamine-hydrolyzing acid amidase as promising tool against bladder cancer. Bioorganic Med. Chem. 2017, 25, 1242–1249. [Google Scholar] [CrossRef]
- Hutter, C.; Zenklusen, J.C. The Cancer Genome Atlas: Creating Lasting Value beyond Its Data. Cell 2018, 173, 283–285. [Google Scholar] [CrossRef]
- Liu, J.; Lichtenberg, T.M.; Hoadley, K.A.; Poisson, L.M.; Lazar, A.J.; Cherniack, A.D.; Kovatich, A.J.; Benz, C.C.; Levine, D.A.; Lee, A.V.; et al. An Integrated TCGA Pan-Cancer Clinical Data Resource to Drive High-Quality Survival Outcome Analytics. Cell 2018, 173, 400–416.e11. [Google Scholar] [CrossRef] [PubMed]
- Toora, B.D.; Rajagopal, G. Measurement of creatinine by Jaffe’s reaction--determination of concentration of sodium hydroxide required for maximum color development in standard, urine and protein free filtrate of serum. Indian J. Exp. Boil. 2002, 40, 239–376. [Google Scholar]
- Ma, C.; Wu, T.-T.; Jiang, P.-C.; Li, Z.-Q.; Chen, X.-J.; Fu, K.; Wang, W.; Gong, R. Anti-carcinogenic activity of anandamide on human glioma in vitro and in vivo. Mol. Med. Rep. 2015, 13, 1558–1562. [Google Scholar] [CrossRef] [PubMed][Green Version]
- Contassot, E.; Tenan, M.; Schnüriger, V.; Pelte, M.-F.; Dietrich, P.-Y. Arachidonyl ethanolamide induces apoptosis of uterine cervix cancer cells via aberrantly expressed vanilloid receptor-1. Gynecol. Oncol. 2004, 93, 182–188. [Google Scholar] [CrossRef]
- Hermanson, D.J.; Marnett, L.J. Cannabinoids, endocannabinoids, and cancer. Cancer Metastasis Rev. 2011, 30, 599–612. [Google Scholar] [CrossRef]
- Maccarrone, M.; Cartoni, A.; Parolaro, D.; Margonelli, A.; Massi, P.; Bari, M.; Battista, N.; Finazzi-Agrò, A. Cannabimimetic activity, binding, and degradation of stearoylethanolamide within the mouse central nervous system. Mol. Cell. Neurosci. 2002, 21, 126–140. [Google Scholar] [CrossRef]
- Maccarrone, M.; Pauselli, R.; Di Rienzo, M.; Finazzi-Agrò, A. Binding, degradation and apoptotic activity of stearoylethanolamide in rat C6 glioma cells. Biochem. J. 2002, 366, 137–144. [Google Scholar] [CrossRef]
- Maccarrone, M.; Attinà, M.; Cartoni, A.; Bari, M.; Agrò, A.F. Gas chromatography-mass spectrometry analysis of endogenous cannabinoids in healthy and tumoral human brain and human cells in culture. J. Neurochem. 2001, 76, 594–601. [Google Scholar] [CrossRef]
- Ottria, R.; Casati, S.; Ciuffreda, P. Optimized synthesis and characterization of N-acylethanolamines and O-acylethanolamines, important family of lipid-signalling molecules. Chem. Phys. Lipids 2012, 165, 705–711. [Google Scholar] [CrossRef]
- Ottria, R.; Casati, S.; Ciuffreda, P. 1H, 13C and15N NMR assignments forN- andO-acylethanolamines, important family of naturally occurring bioactive lipid mediators. Magn. Reson. Chem. 2012, 50, 823–828. [Google Scholar] [CrossRef]
- Casati, S.; Manzocchi, A.; Ottria, R.; Ciuffreda, P. 1H, 13C and 15N NMR spectral assignments of adenosine derivatives with different amino substituents at C6-position. Magn. Reson. Chem. 2011, 49, 279–283. [Google Scholar] [CrossRef] [PubMed]
- Ottria, R.; Ravelli, A.; Gigli, F.; Ciuffreda, P. Simultaneous ultra-high performance liquid chromathograpy-electrospray ionization-quadrupole-time of flight mass spectrometry quantification of endogenous anandamide and related N-acylethanolamides in bio-matrices. J. Chromatogr. B 2014, 958, 83–89. [Google Scholar] [CrossRef] [PubMed]
- Pezzilli, R.; Ciuffreda, P.; Ottria, R.; Ravelli, A.; D’Eril, G.M.; Barassi, A. Serum endocannabinoids in assessing pain in patients with chronic pancreatitis and in those with pancreatic ductal adenocarcinoma. Scand. J. Gastroenterol. 2017, 52, 1133–1139. [Google Scholar] [CrossRef] [PubMed]
- Ottria, R.; Cappelletti, L.; Ravelli, A.; Mariotti, M.; Gigli, F.; Romagnoli, S.; Ciuffreda, P.; Banfi, G.; Drago, L. Plasma endocannabinoid behaviour in total knee and hip arthroplasty. J. Biol. Regul. Homeost. Agents 2016, 30, 1147–1152. [Google Scholar]
- Gao, J.; Aksoy, B.A.; Dogrusoz, U.; Dresdner, G.; Gross, B.; Sumer, S.O.; Sun, Y.; Skanderup, A.J.; Sinha, R.; Larsson, E.; et al. Integrative Analysis of Complex Cancer Genomics and Clinical Profiles Using the cBioPortal. Sci. Signal. 2013, 6, 1. [Google Scholar] [CrossRef]
- The Cancer Genome Atlas Research Network; Cancer Genome Atlas Research Network Comprehensive molecular characterization of urothelial bladder carcinoma. Nature 2014, 507, 315–322. [CrossRef]
- Lánczky, A.; Bottai, G.; Munkácsy, G.; Nagy, Á.; Szabó, A.; Santarpia, L.; Gyorffy, B. miRpower: A web-tool to validate survival-associated miRNAs utilizing expression data from 2178 breast cancer patients. Breast Cancer Res. Treat. 2016, 160, 439–446. [Google Scholar]


| Variables | NMIBC pTa-pT1 (n = 16) | MIBC Pt2-Pt4 (n = 14) | Healthy Control (n = 14) |
|---|---|---|---|
| Age (mean ± SD, years) | 65.0 ± 17.2 | 65.0 ± 11.4 | 57.2 ± 11.9 |
| Tumor grade | |||
| Low grade (G1–G2) | 13 (81%) | 0 (0%) | |
| High grade (G2–G3) | 3 (19%) | 14 (100%) | |
| Carcinoma in situ (CIS) | |||
| Yes | 2 (12%) | 9 (64%) | |
| No | 14 (88%) | 5 (36%) | |
| Lymph node involvement | |||
| N0 | 16 (100%) | 8 (57%) | |
| N1–3 | (0%) | 6 (43%) | |
| First episode | |||
| Yes | 7 (44%) | 3 (21%) | |
| No | 9 (56%) | 11 (79%) | |
| Angioinvasion | |||
| Yes | 0 (100%) | 4 (28%) | |
| No | 16 (0%) | 10 (72%) |
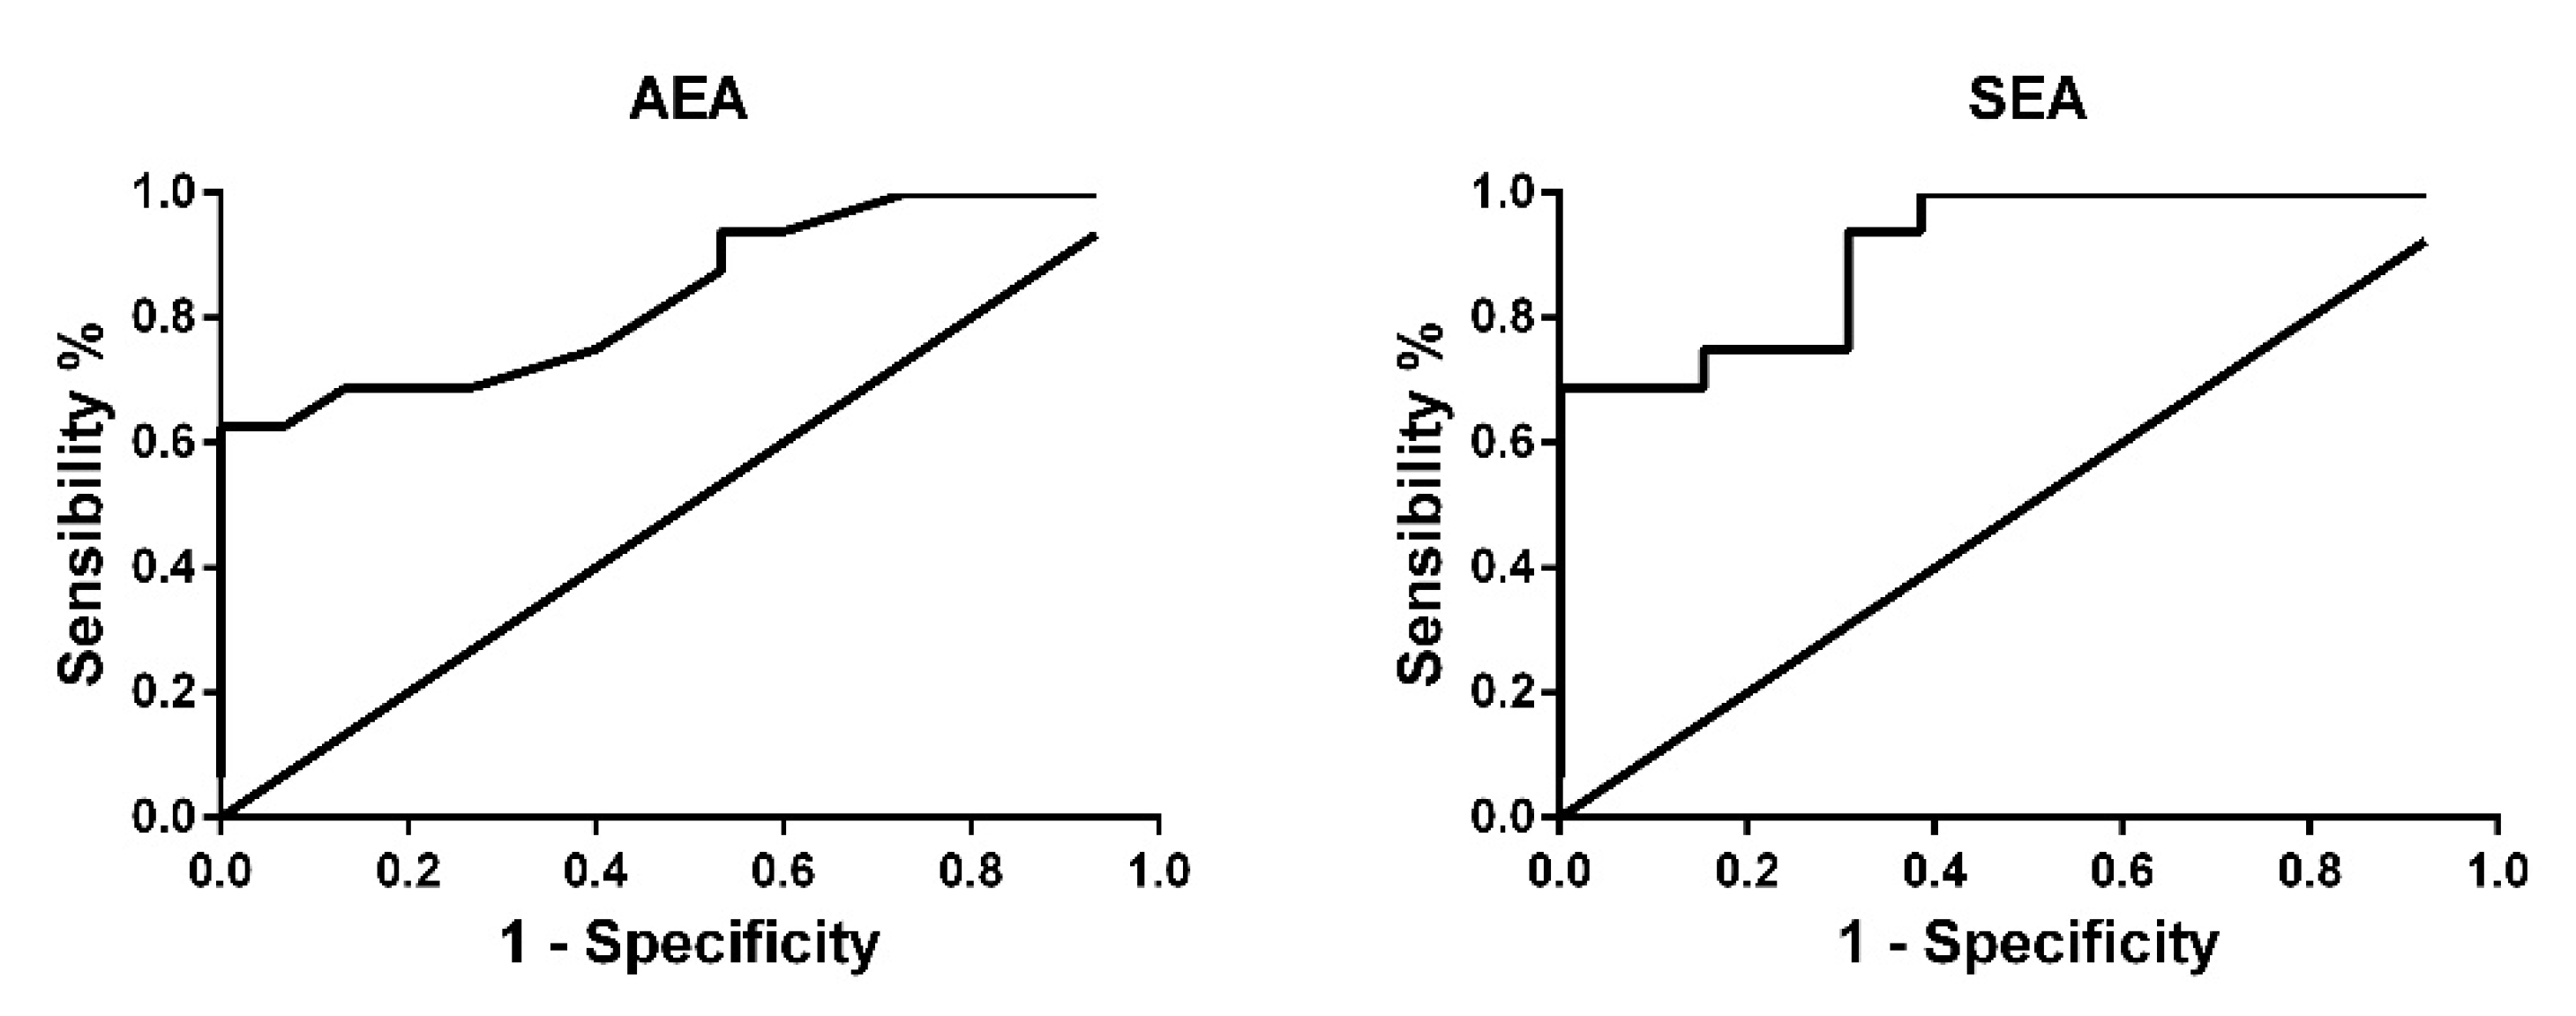
| Markers | Sensitivity | Specificity | Cut-off | Likelihood | AUC |
|---|---|---|---|---|---|
| AEA | 94% | 45% | 8 pg/mL | 1.76 | 0.85 |
| SEA | 94% | 61% | 160 pg/mL | 2.43 | 0.91 |
| Gene Name | less_than_T2a | T2a | T2b | T3–T4 | p Value |
|---|---|---|---|---|---|
| PLCB1 | 343.60 | 430.09 | 334.07 | 364.06 | 0.251 |
| PLBC2 | 232.18 | 430.09 | 258.14 | 271.75 | 0.702 |
| PLBC3 | 1986.26 | 2095.16 | 2065.71 | 2045.11 | 0.900 |
| PLBC4 | 89.60 | 130.41 | 131.73 | 122.30 | 0.720 |
| NAPE-PLD | 398.99 | 382.45 | 324.87 | 337.41 | 0.085 |
| PTPN22 | 42.53 | 43.75 | 71.75 | 67.90 | 0.179 |
| ABHD4 | 1030.56 | 924.14 | 923.84 | 1055.02 | 0.154 |
| GDE1 | 3131.74 | 2719.12 | 2513.97 | 2694.98 | 0.475 |
| DAGLA | 109.29 | 94.03 | 114.13 | 124.48 | 0.023 * |
| DAGLB | 587.9 | 530.75 | 652.54 | 624.55 | 0.138 |
| FAAH | 886.46 | 612.25 | 650.59 | 577.65 | 1.00 × 10⁻⁴ *** |
| NAAA | 334.28 | 269.56 | 415.36 | 405.78 | 0.012 * |
| MGLL | 684.47 | 807.24 | 842.41 | 957.37 | 0.158 |
© 2020 by the authors. Licensee MDPI, Basel, Switzerland. This article is an open access article distributed under the terms and conditions of the Creative Commons Attribution (CC BY) license (http://creativecommons.org/licenses/by/4.0/).
Share and Cite
Vago, R.; Ravelli, A.; Bettiga, A.; Casati, S.; Lavorgna, G.; Benigni, F.; Salonia, A.; Montorsi, F.; Orioli, M.; Ciuffreda, P.; et al. Urine Endocannabinoids as Novel Non-Invasive Biomarkers for Bladder Cancer at Early Stage. Cancers 2020, 12, 870. https://doi.org/10.3390/cancers12040870
Vago R, Ravelli A, Bettiga A, Casati S, Lavorgna G, Benigni F, Salonia A, Montorsi F, Orioli M, Ciuffreda P, et al. Urine Endocannabinoids as Novel Non-Invasive Biomarkers for Bladder Cancer at Early Stage. Cancers. 2020; 12(4):870. https://doi.org/10.3390/cancers12040870
Chicago/Turabian StyleVago, Riccardo, Alessandro Ravelli, Arianna Bettiga, Silvana Casati, Giovanni Lavorgna, Fabio Benigni, Andrea Salonia, Francesco Montorsi, Marica Orioli, Pierangela Ciuffreda, and et al. 2020. "Urine Endocannabinoids as Novel Non-Invasive Biomarkers for Bladder Cancer at Early Stage" Cancers 12, no. 4: 870. https://doi.org/10.3390/cancers12040870
APA StyleVago, R., Ravelli, A., Bettiga, A., Casati, S., Lavorgna, G., Benigni, F., Salonia, A., Montorsi, F., Orioli, M., Ciuffreda, P., & Ottria, R. (2020). Urine Endocannabinoids as Novel Non-Invasive Biomarkers for Bladder Cancer at Early Stage. Cancers, 12(4), 870. https://doi.org/10.3390/cancers12040870