External Beam Radiation Therapy and Enadenotucirev: Inhibition of the DDR and Mechanisms of Radiation-Mediated Virus Increase


 , ,
, ,  , , and
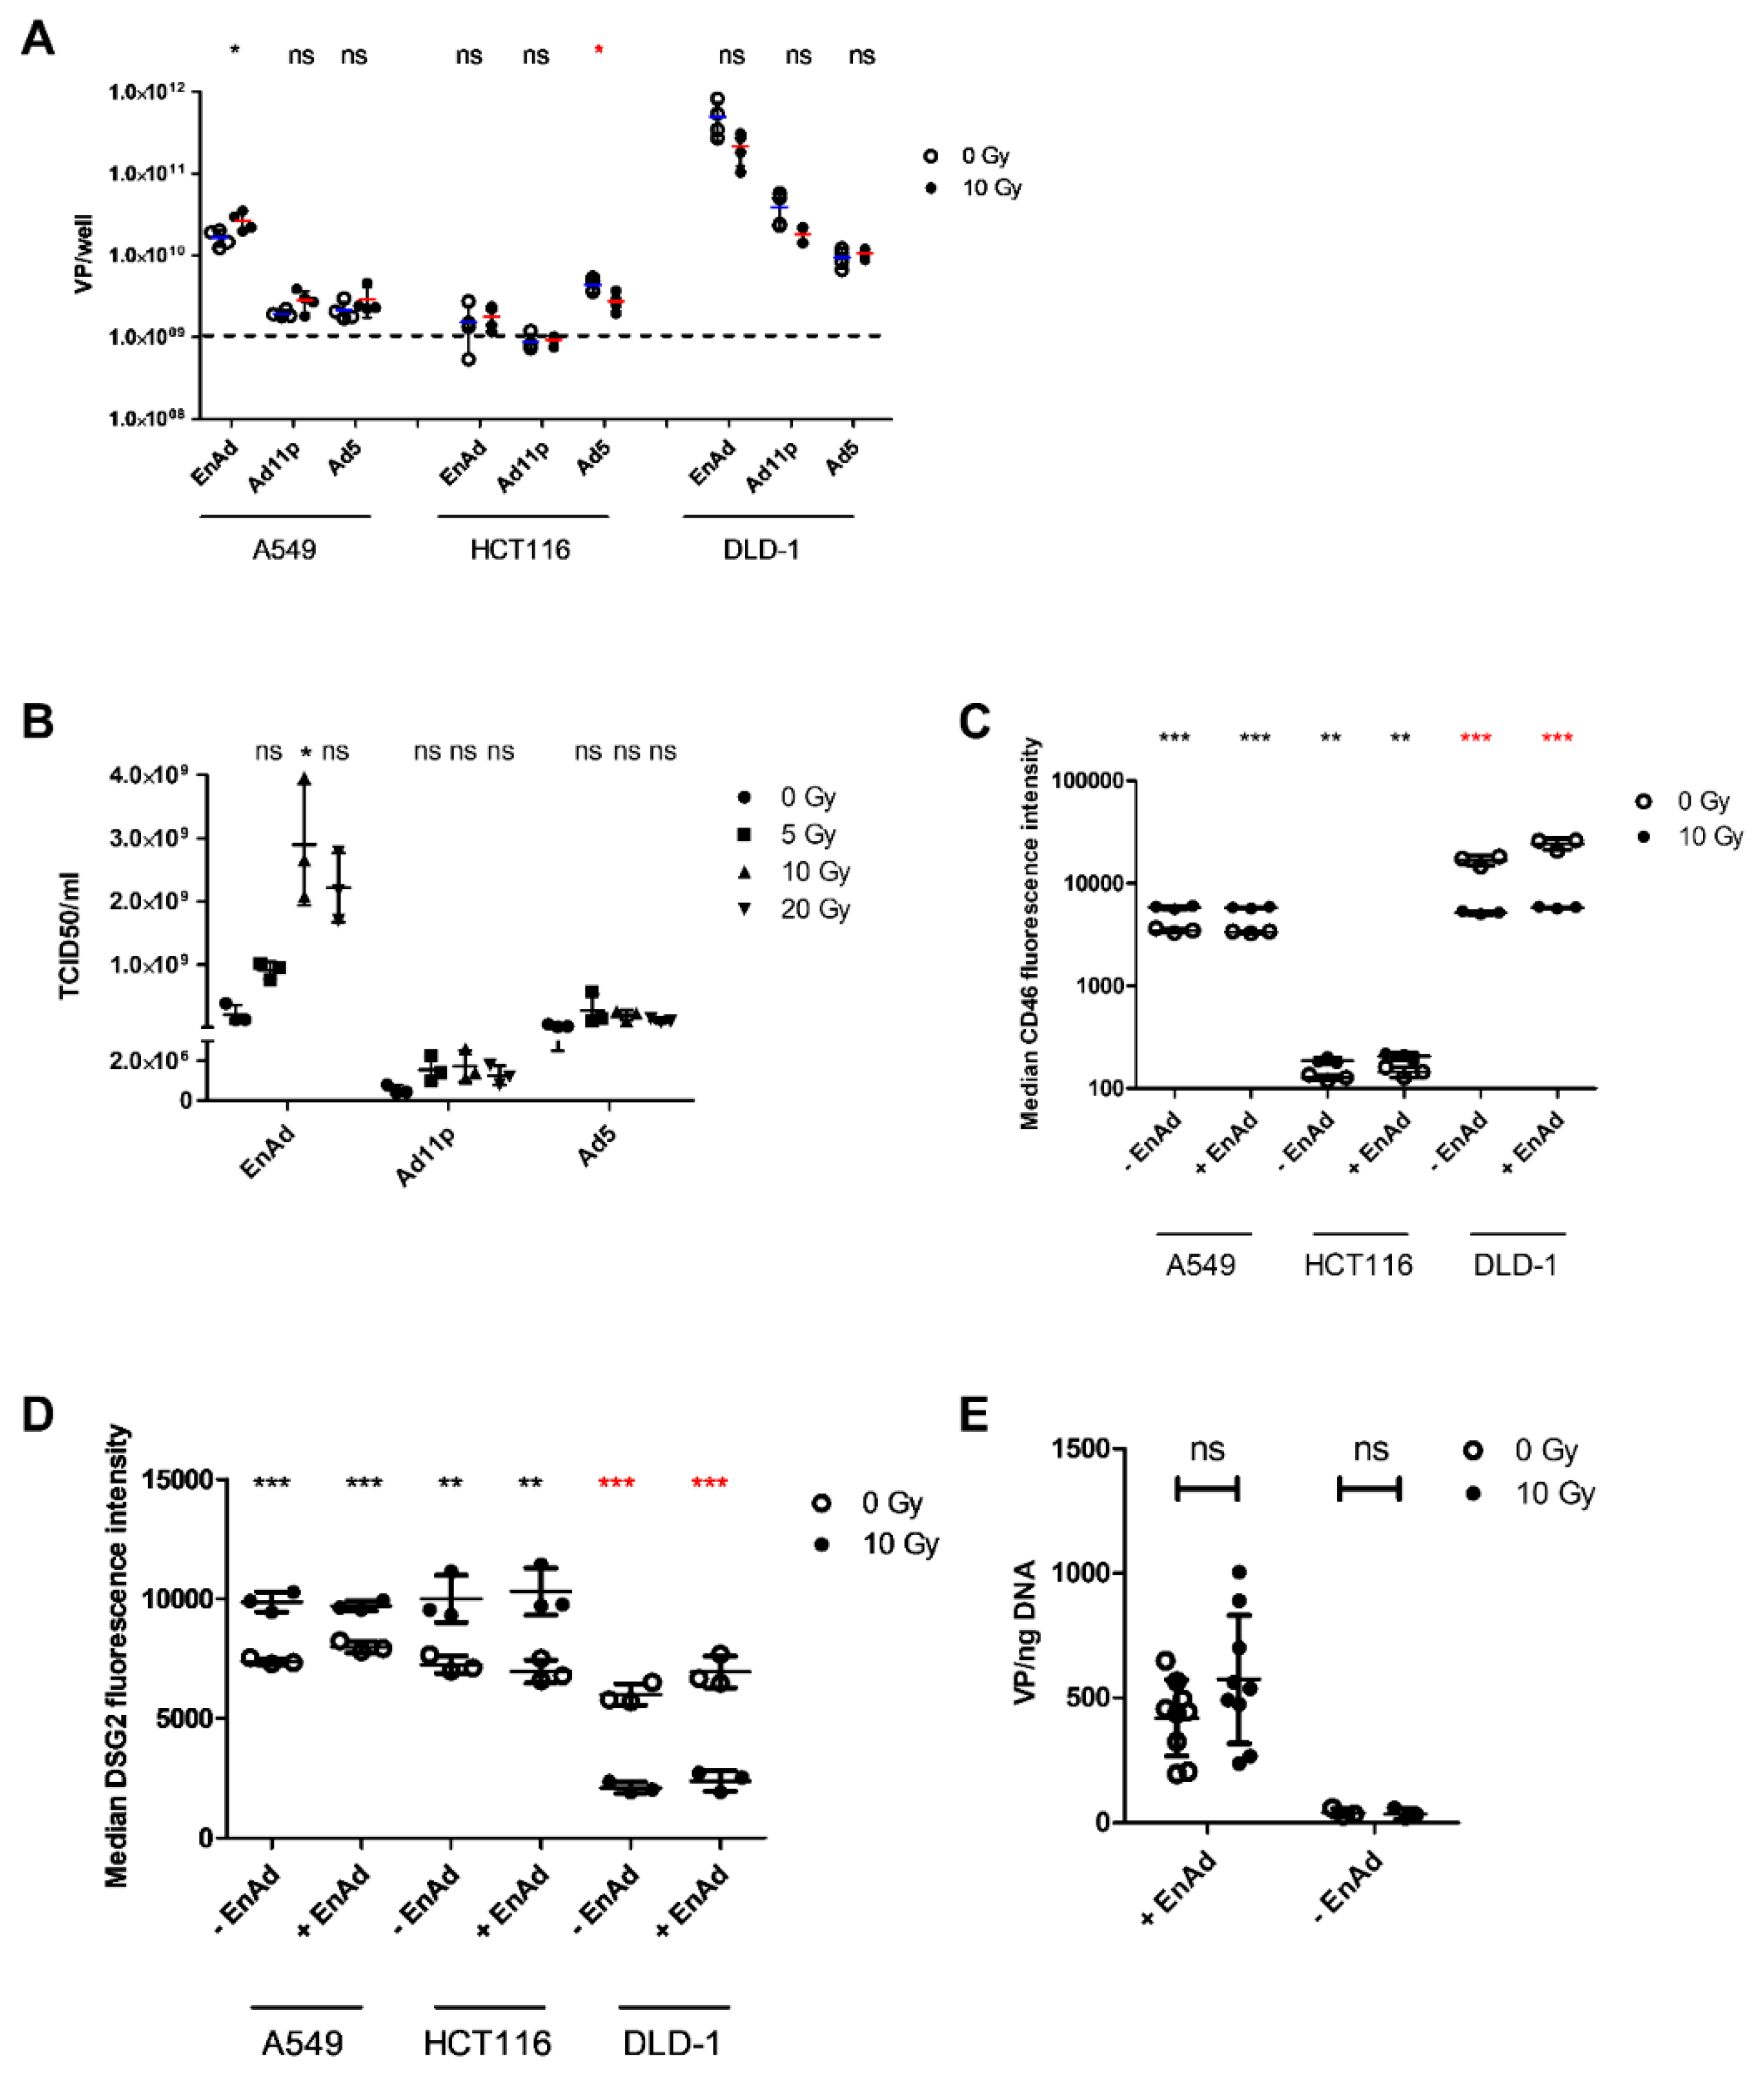
Abstract
1. Introduction
2. Results
2.1. Irradiation of A549 Increases Total EnAd Production
2.2. Irradiation of A549 Cells Increases EnAd, but not Ad11p or Ad5 Infectious Particle Release
2.3. Radiation Leads to a Cell Line-Dependent Increase in Surface CD46 and DSG2 Levels
2.4. EnAd Uptake Is not Affected by Irradiation
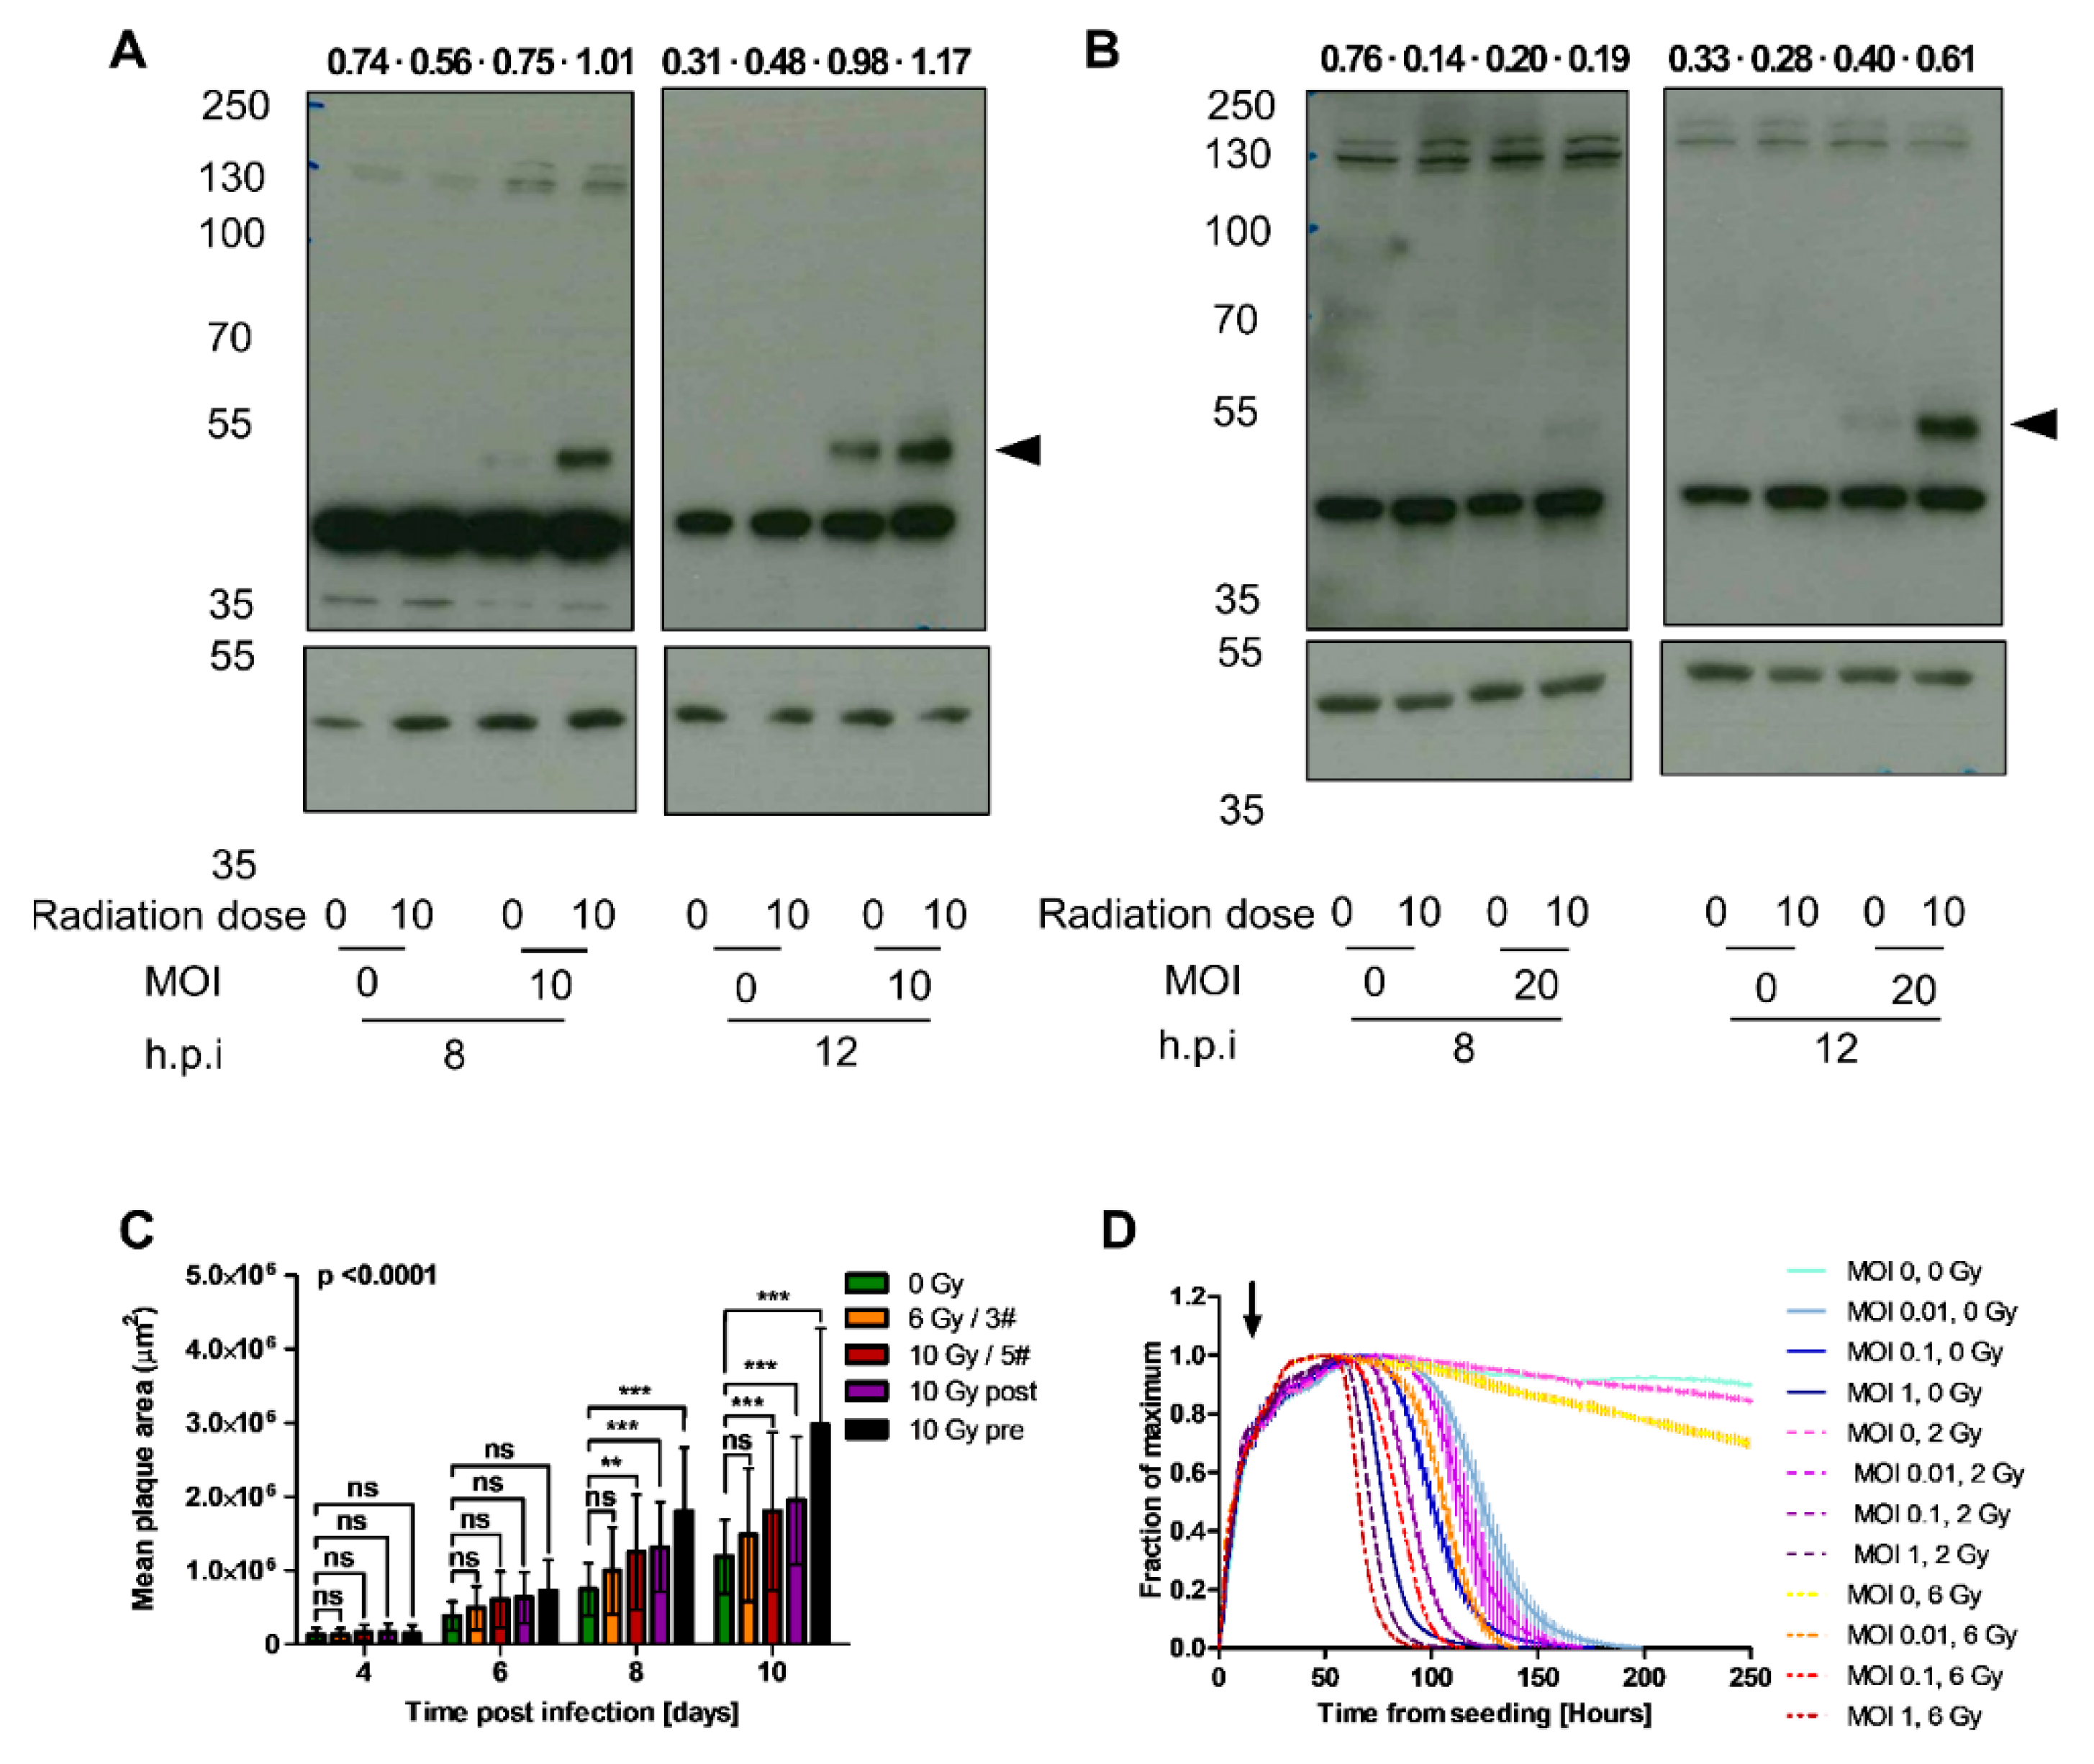
2.5. EnAd E1A Expression Increases in Pre-Irradiated Cells
2.6. Irradiation Increases Mean Plaque Area
2.7. Irradiation and Infection Act Together to Improve Target Cell Cytotoxicity
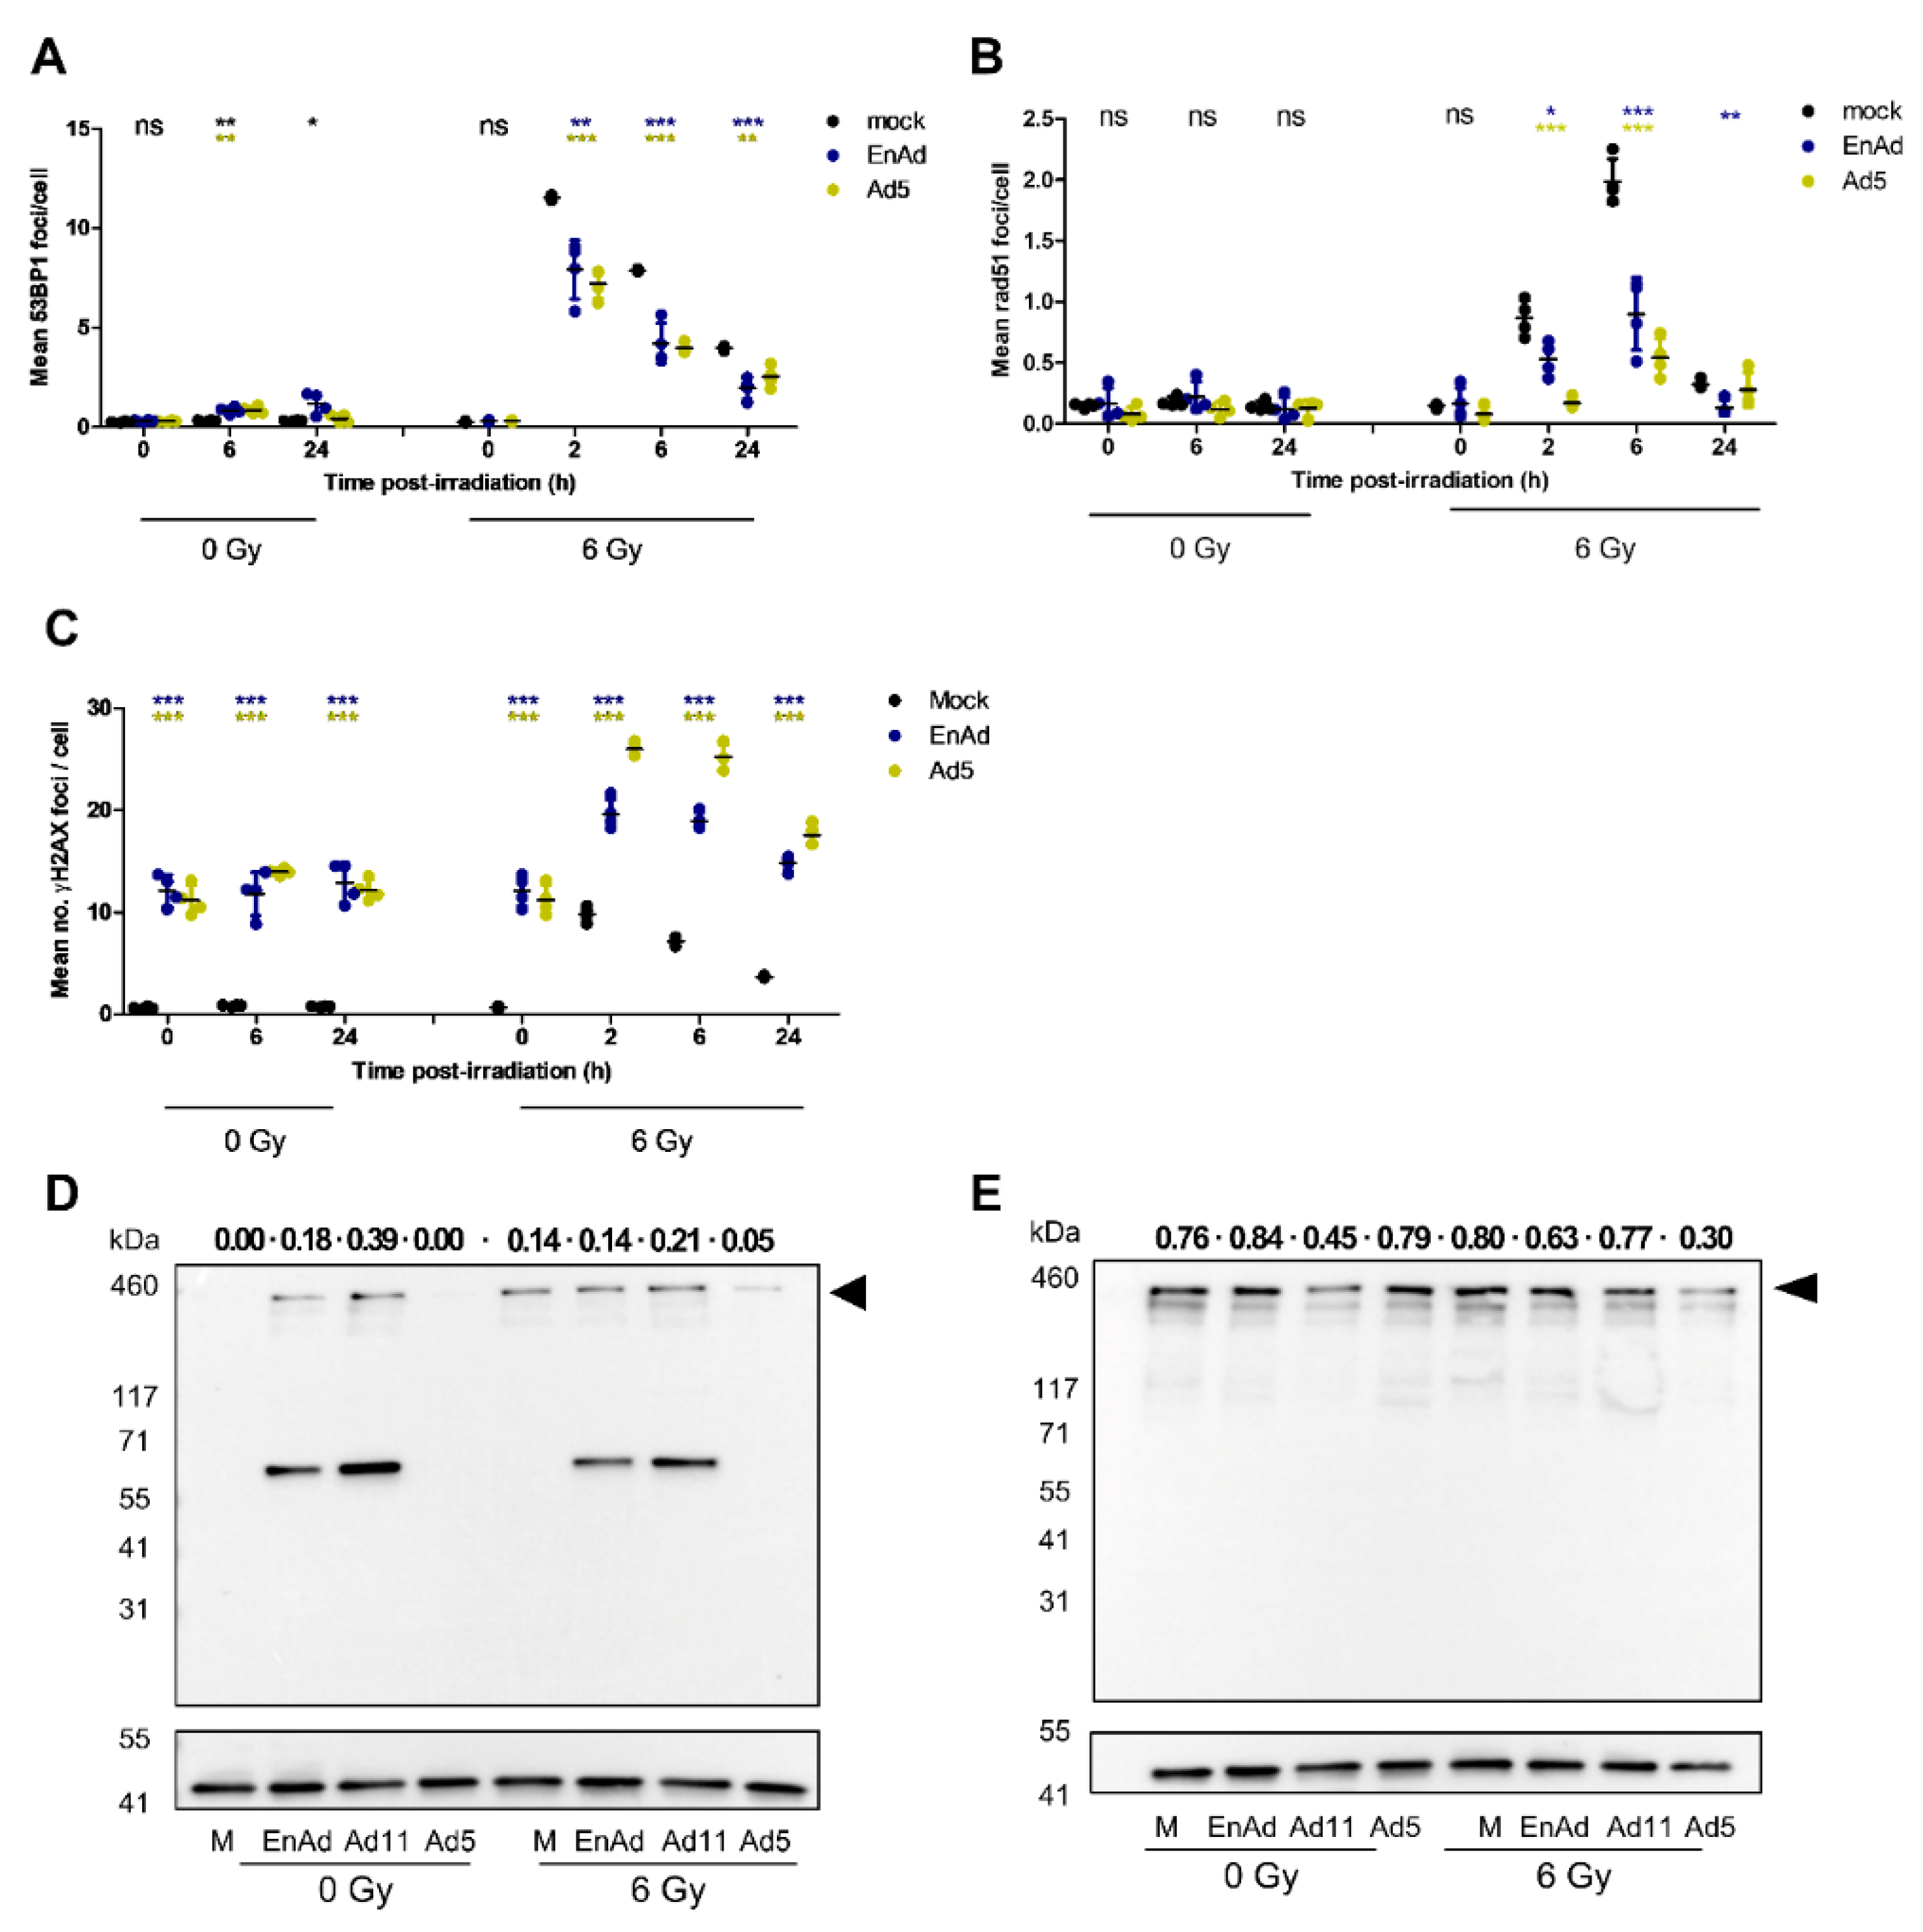
2.8. Virus Infection Reduces the Number of 53BP1 and Rad51 Foci in Irradiated Cells
2.9. EnAd Triggers 53BP1 Phosphorylation in Infected Cells
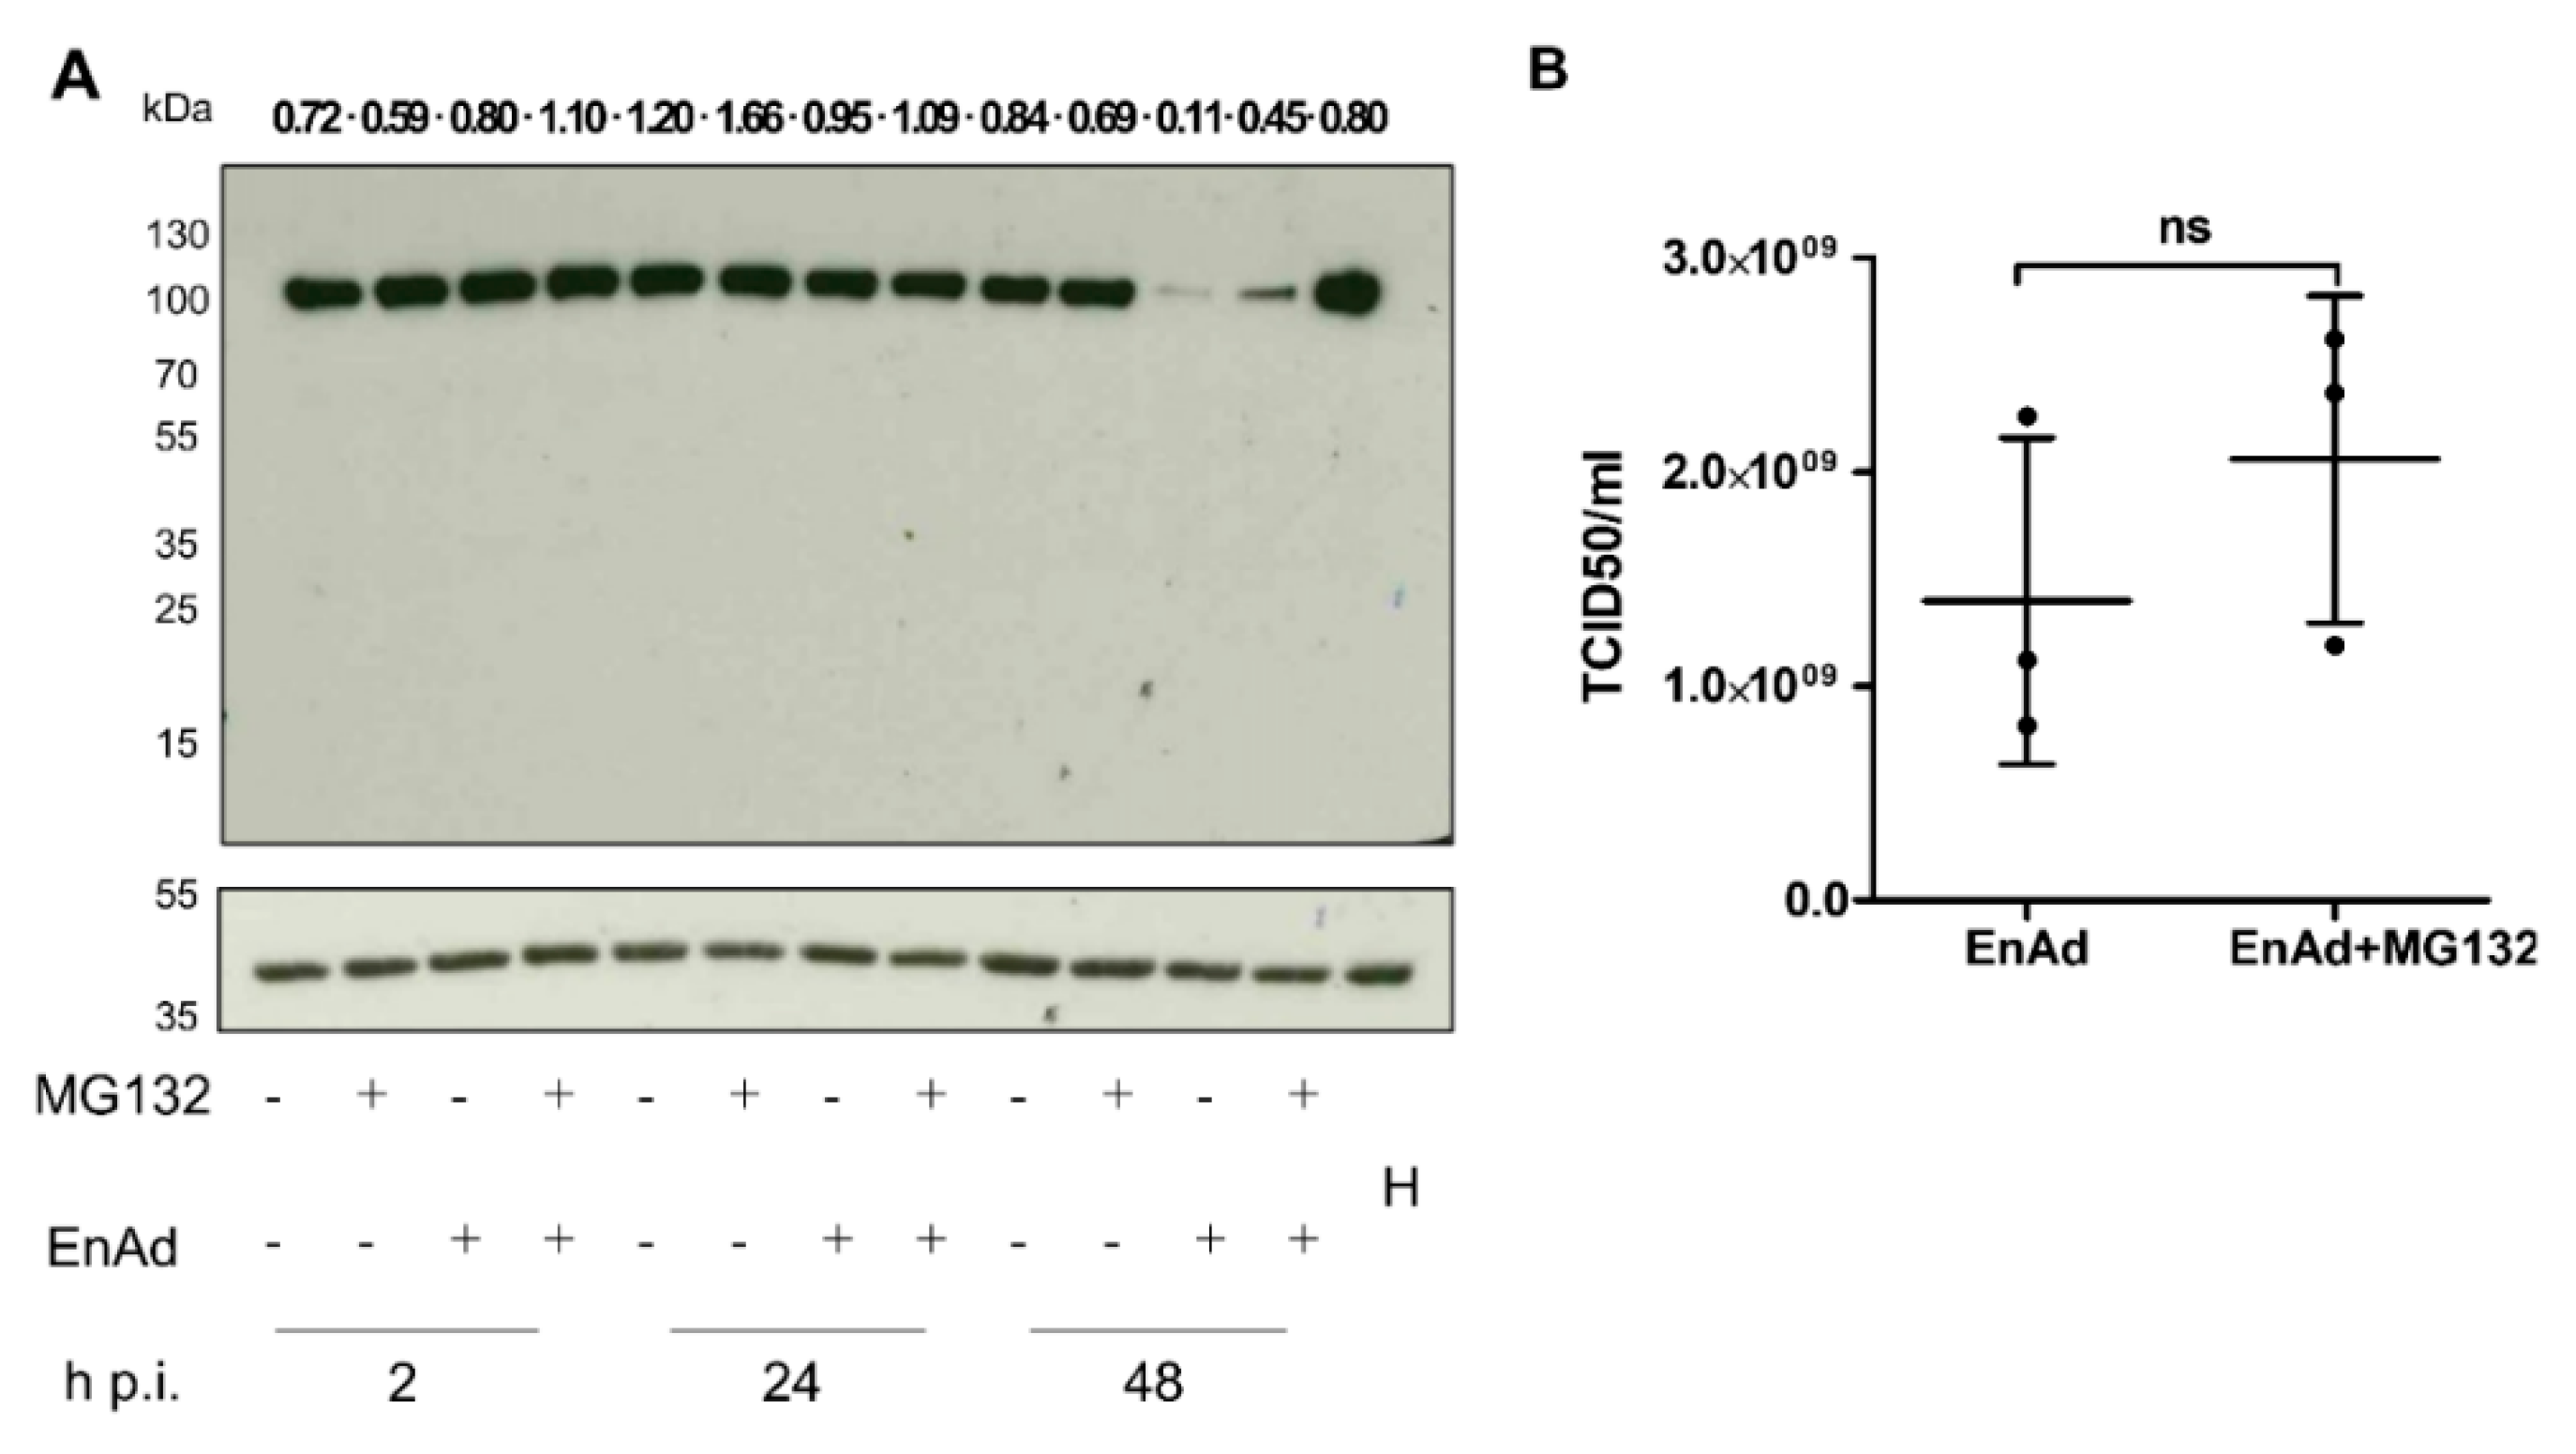
2.10. EnAd Causes a Decrease in DNA Ligase IV Levels that Is Partially Dependent on Proteosomal Degradation
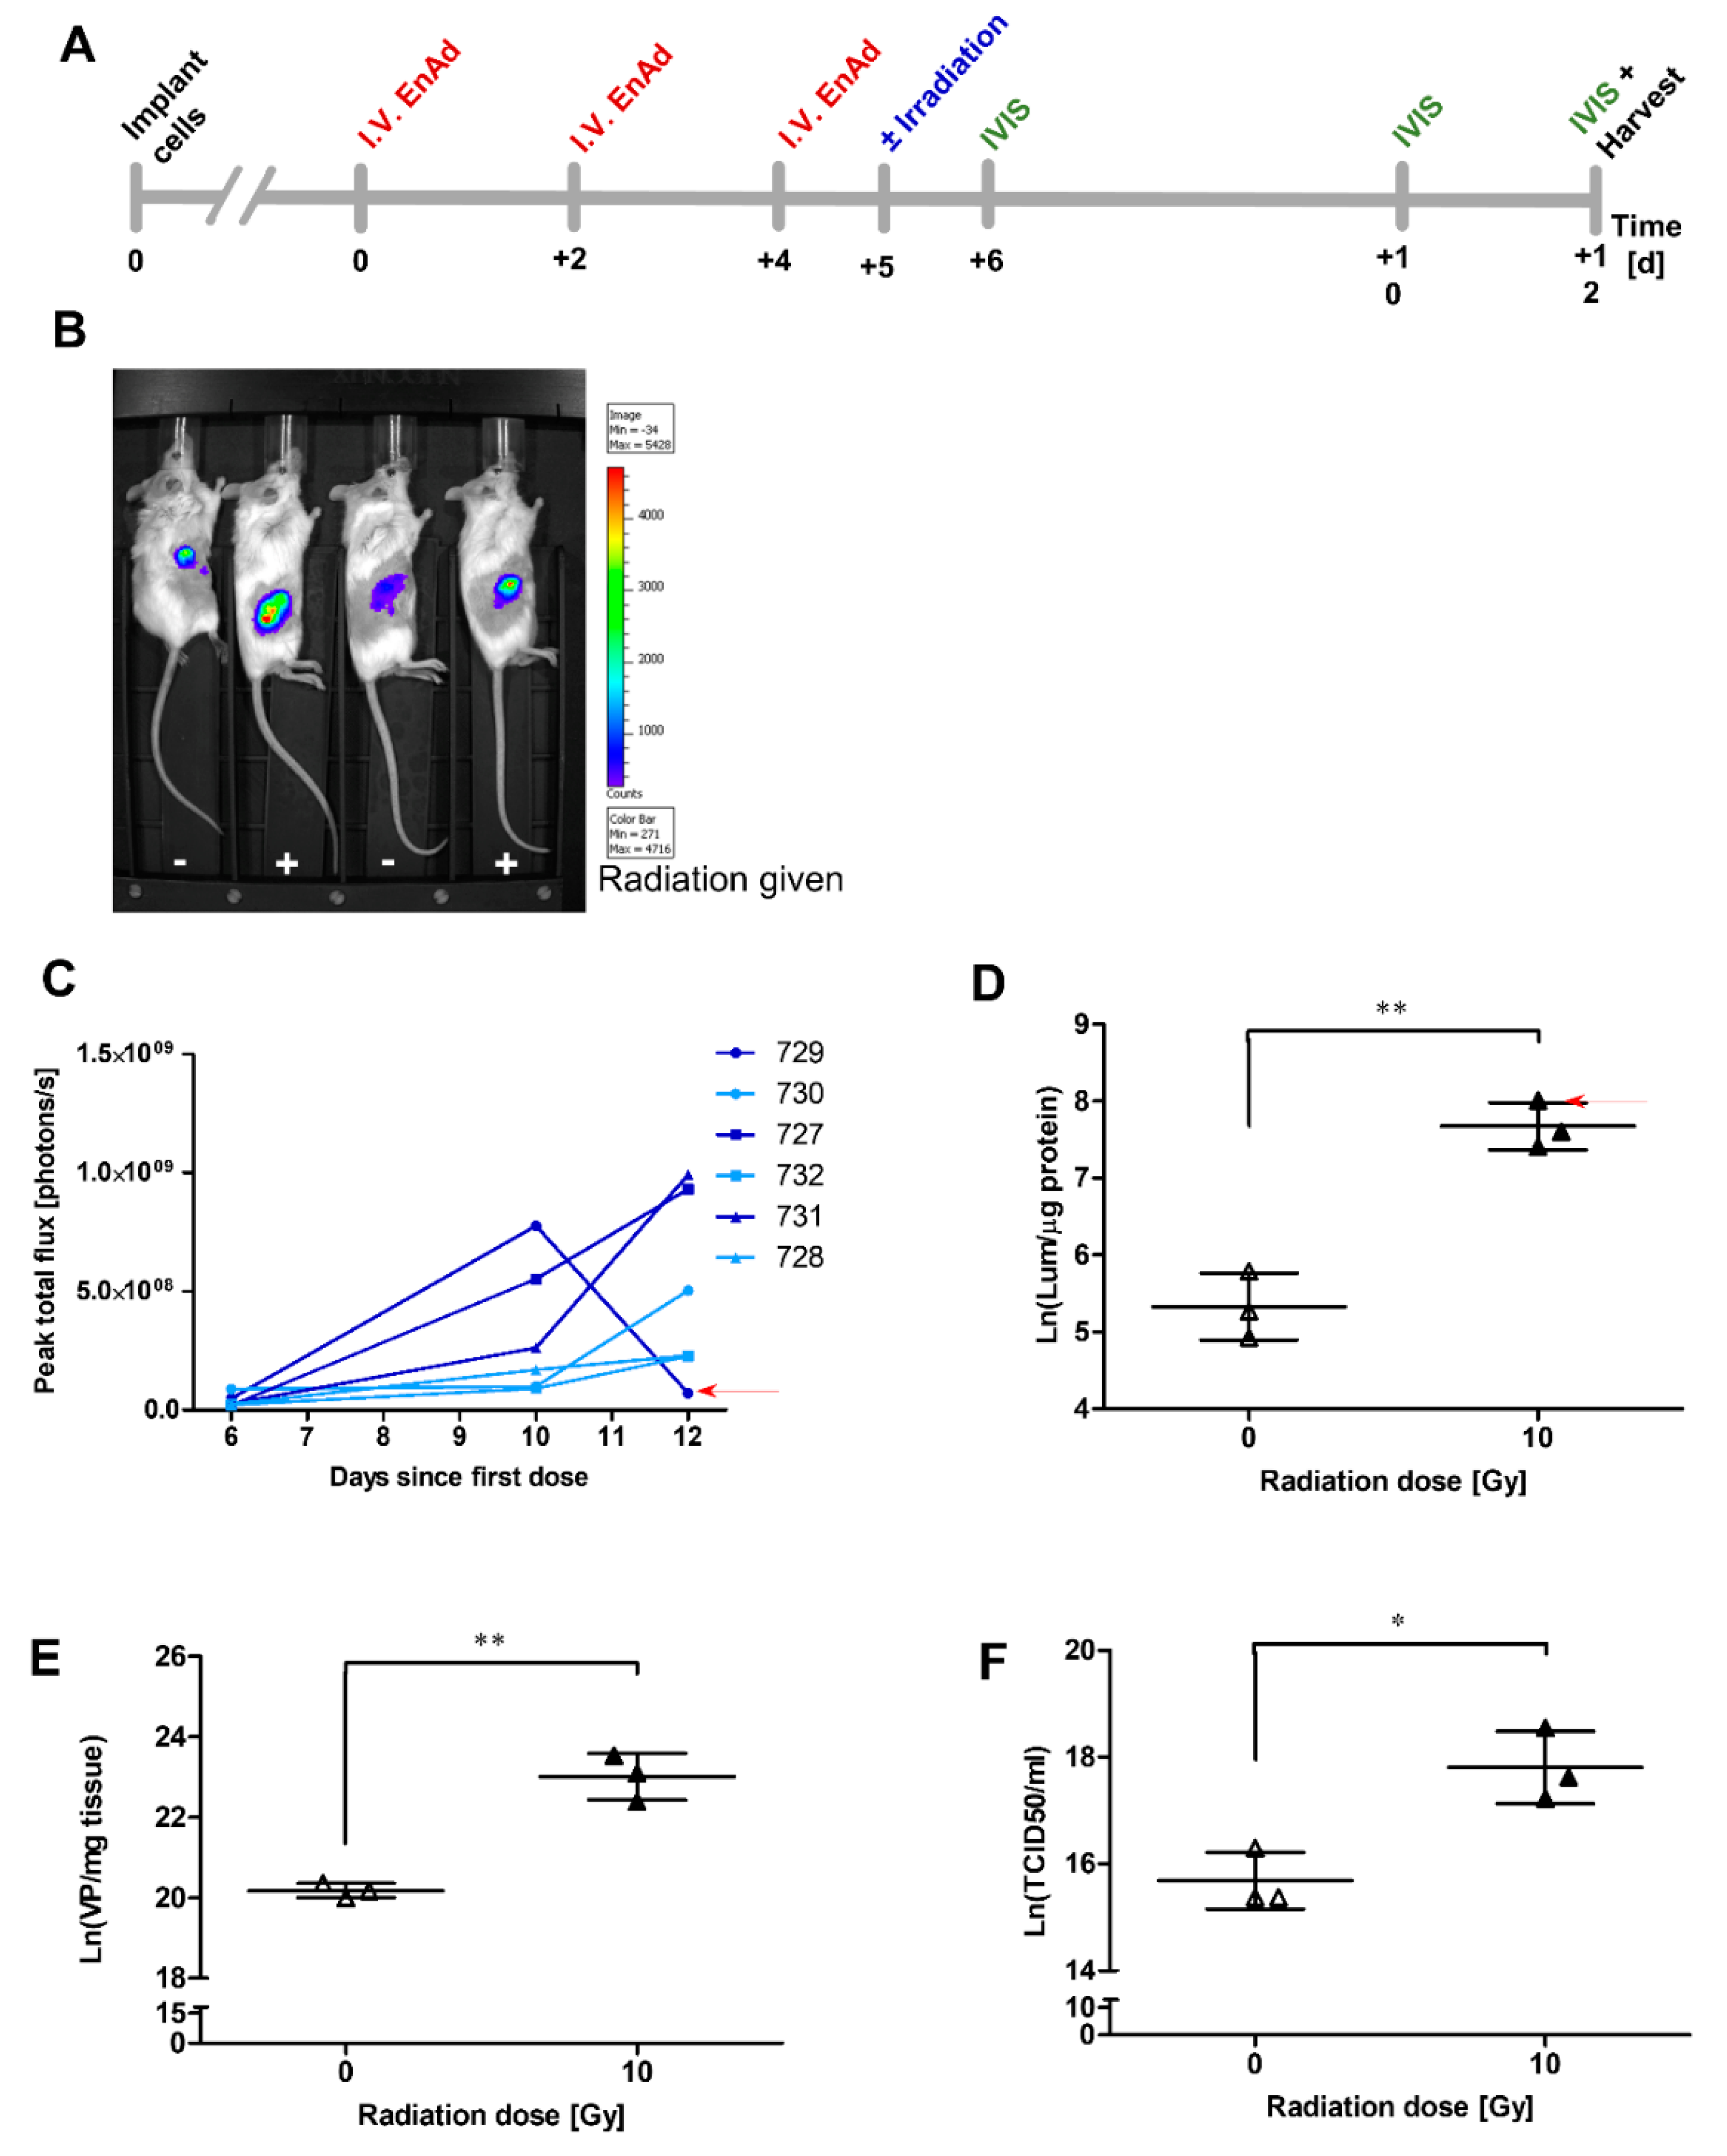
2.11. Irradiation of Mouse Tumours Increases Viral Vector Transgene Expression
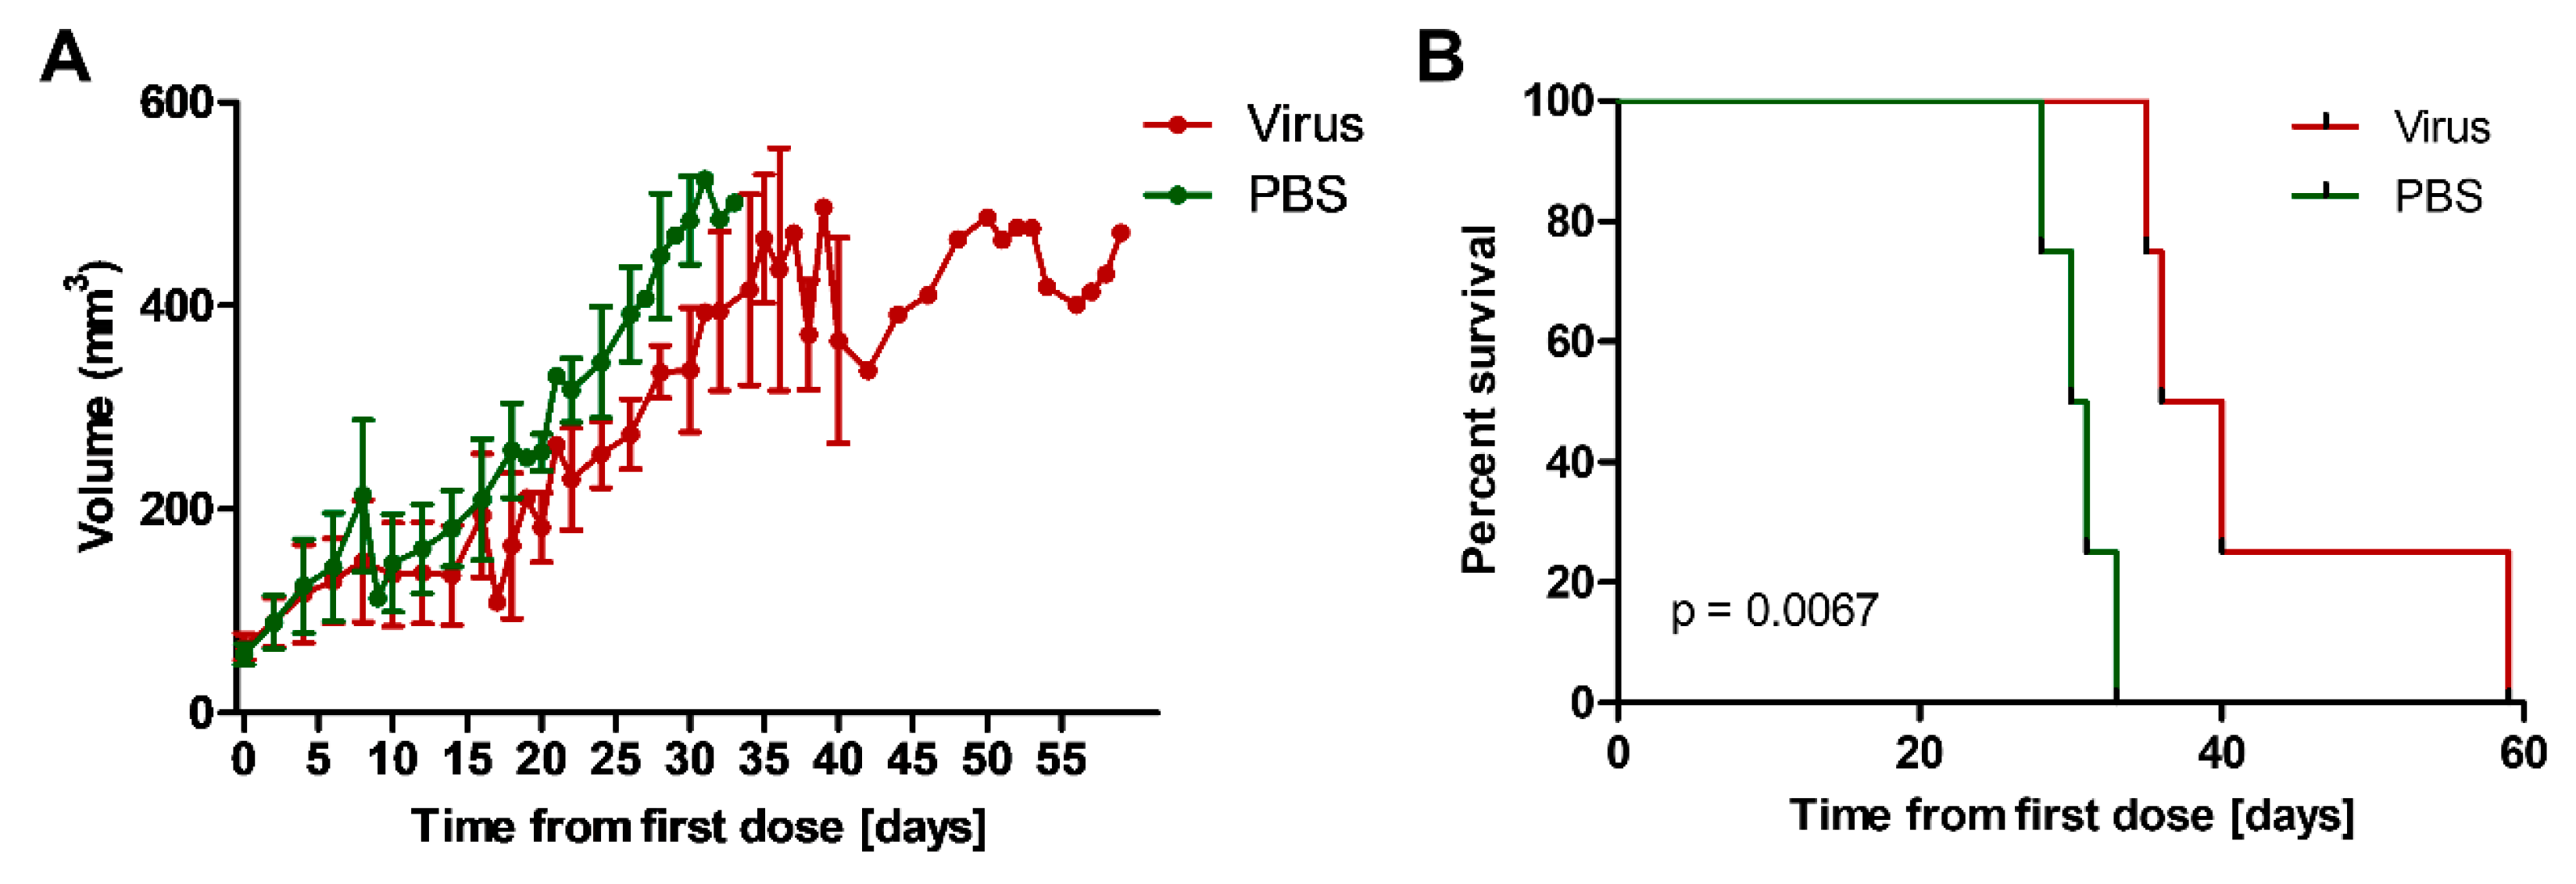
2.12. Addition of EnAd to Irradiation Slows Growth of Mouse Tumours
3. Discussion
4. Materials and Methods
4.1. Mammalian Cell Culture
4.2. In Vitro Irradiation
4.3. Infection Studies
4.4. Quantitative PCR
4.5. Immunoblotting and Immunocytochemistry
4.6. xCELLigence Studies
4.7. Assessment of Viral Plaque Growth by the Celigo Image Cytometer
4.8. Luciferase Reporter Assay
4.9. Flow Cytometry
4.10. In Vivo Studies
4.11. Statistical Analysis
5. Conclusions
Supplementary Materials
Author Contributions
Funding
Acknowledgments
Conflicts of Interest
References
- Joiner, M.; van der Kogel, A. Basic Clinical Radiobiology, 5th ed.; CRC Press: Boca Raton, FL, USA, 2018. [Google Scholar]
- Bonner, J.A.; Harari, P.M.; Giralt, J.; Azarnia, N.; Shin, D.M.; Cohen, R.B.; Jones, C.U.; Sur, R.; Raben, D.; Jassem, J.; et al. Radiotherapy plus cetuximab for squamous-cell carcinoma of the head and neck. N. Engl. J. Med. 2006, 354, 567–578. [Google Scholar] [CrossRef] [PubMed]
- Workenhe, S.T.; Mossman, K.L. Oncolytic virotherapy and immunogenic cancer cell death: Sharpening the sword for improved cancer treatment strategies. Mol. Ther. 2014, 22, 251–256. [Google Scholar] [CrossRef] [PubMed]
- Keller, B.A.; Bell, J.C. Oncolytic viruses—Immunotherapeutics on the rise. J. Mol. Med. 2016, 94, 979–991. [Google Scholar] [CrossRef] [PubMed]
- Dyer, A.; Di, Y.; Calderon, H.; Illingworth, S.; Kueberuwa, G.; Tedcastle, A.; Jakeman, P.; Chia, S.L.; Brown, A.; Silva, M.A.; et al. Oncolytic Group B Adenovirus Enadenotucirev Mediates Non-apoptotic Cell Death with Membrane Disruption and Release of Inflammatory Mediators. Mol. Ther. Oncolytics 2017, 4, 18–30. [Google Scholar] [CrossRef] [PubMed]
- Russell, S.J.; Peng, K.-W.; Bell, J.C. Oncolytic virotherapy. Nat. Biotechnol. 2012, 30, 658–670. [Google Scholar] [CrossRef]
- Kaufman, H.L.; Kohlhapp, F.J.; Zloza, A. Oncolytic viruses: A new class of immunotherapy drugs. Nat. Rev. Drug Discov. 2015, 14, 642–662. [Google Scholar] [CrossRef] [PubMed]
- Lilley, C.E.; Schwartz, R.A.; Weitzman, M.D. Using or abusing: Viruses and the cellular DNA damage response. Trends Microbiol. 2007, 15, 119–126. [Google Scholar] [CrossRef]
- Weitzman, M.D.; Carson, C.T.; Schwartz, R.A.; Lilley, C.E. Interactions of viruses with the cellular DNA repair machinery. DNA Repair (Amst.) 2004, 3, 1165–1173. [Google Scholar] [CrossRef] [PubMed]
- O’Cathail, S.M.; Pokrovska, T.D.; Maughan, T.S.; Fisher, K.D.; Seymour, L.W.; Hawkins, M.A. Combining oncolytic adenovirus with radiation-a paradigm for the future of radiosensitization. Front. Oncol. 2017, 7, e153. [Google Scholar] [CrossRef]
- Karen, K.A.; Hoey, P.J.; Young, C.S.H.; Hearing, P. Temporal Regulation of the Mre11-Rad50-Nbs1 Complex during Adenovirus Infection. J. Virol. 2009, 83, 4565–4573. [Google Scholar] [CrossRef]
- Hart, L.S.; Yannone, S.M.; Naczki, C.; Orlando, J.S.; Waters, S.B.; Akman, S.A.; Chen, D.J.; Ornelles, D.; Koumenis, C. The adenovirus E4orf6 protein inhibits DNA double strand break repair and radiosensitizes human tumor cells in an E1B-55K-independent manner. J. Biol. Chem. 2005, 280, 1474–1481. [Google Scholar] [CrossRef]
- Stracker, T.H.; Carson, C.T.; Weilzman, M.D. Adenovirus oncoproteins inactivate the Mre11-Rad50-NBs1 DNA repair complex. Nature 2002, 418, 348–352. [Google Scholar] [CrossRef] [PubMed]
- Stracker, T.H.; Lee, D.V.; Carson, C.T.; Araujo, F.D.; Ornelles, D.A.; Weitzman, M.D. Serotype-Specific Reorganization of the Mre11 Complex by Adenoviral E4orf3 Proteins. J. Virol. 2005, 79, 6664–6673. [Google Scholar] [CrossRef]
- Forrester, N.A.; Sedgwick, G.G.; Thomas, A.; Blackford, A.N.; Speiseder, T.; Dobner, T.; Byrd, P.J.; Stewart, G.S.; Turnell, A.S.; Grand, R.J.A. Serotype-Specific Inactivation of the Cellular DNA Damage Response during Adenovirus Infection. J. Virol. 2011, 85, 2201–2211. [Google Scholar] [CrossRef] [PubMed]
- Shah, G.A.; O’Shea, C.C. Viral and Cellular Genomes Activate Distinct DNA Damage Responses. Cell 2015, 162, 987–1002. [Google Scholar] [CrossRef] [PubMed]
- Araujo, F.D.; Stracker, T.H.; Carson, C.T.; Lee, D.V.; Weitzman, M.D. Adenovirus Type 5 E4orf3 Protein Targets the Mre11 Complex to Cytoplasmic Aggresomes. J. Virol. 2005, 79, 11382–11391. [Google Scholar] [CrossRef] [PubMed]
- Liu, Y.; Shevchenko, A.; Shevchenko, A.; Berk, A.J. Adenovirus Exploits the Cellular Aggresome Response To Accelerate Inactivation of the MRN Complex. J. Virol. 2005, 79, 14004–14016. [Google Scholar] [CrossRef]
- Nichols, G.J.; Schaack, J.; Ornelles, D.A. Widespread Phosphorylation of Histone H2AX by Species C Adenovirus Infection Requires Viral DNA Replication. J. Virol. 2009, 83, 5987–5998. [Google Scholar] [CrossRef]
- Cuconati, A.; Mukherjee, C.; Perez, D.; White, E. DNA damage response and MCL-1 destruction initiate apoptosis in adenovirus-infected cells. Genes Dev. 2003, 17, 2922–2932. [Google Scholar] [CrossRef]
- Blackford, A.N.; Bruton, R.K.; Dirlik, O.; Stewart, G.S.; Taylor, A.M.R.; Dobner, T.; Grand, R.J.A.; Turnell, A.S. A Role for E1B-AP5 in ATR Signaling Pathways during Adenovirus Infection. J. Virol. 2008, 82, 7640–7652. [Google Scholar] [CrossRef][Green Version]
- Boyer, J.; Rohleder, K.; Ketner, G. Adenovirus E4 34k and E4 11k inhibit double strand break repair and are physically associated with the cellular DNA-dependent protein kinase. Virology 1999, 263, 307–312. [Google Scholar] [CrossRef] [PubMed]
- Baker, A.; Rohleder, K.J.; Hanakahi, L.A.; Ketner, G. Adenovirus E4 34k and E1b 55k Oncoproteins Target Host DNA Ligase IV for Proteasomal Degradation. J. Virol. 2007, 81, 7034–7040. [Google Scholar] [CrossRef] [PubMed]
- Tookman, L.A.; Browne, A.K.; Connell, C.M.; Bridge, G.; Ingemarsdotter, C.K.; Dowson, S.; Shibata, A.; Lockley, M.; Martin, S.A.; McNeish, I.A. RAD51 and BRCA2 enhance oncolytic adenovirus type 5 activity in ovarian cancer. Mol. Cancer Res. 2016, 14, 44–55. [Google Scholar] [CrossRef]
- Zhang, M.; Li, S.; Li, J.; Ensminger, W.D.; Lawrence, T.S. Ionizing radiation increases adenovirus uptake and improves transgene expression in intrahepatic colon cancer xenografts. Mol. Ther. 2003, 8, 21–28. [Google Scholar] [CrossRef]
- Chen, Y.; DeWeese, T.; Dilley, J.; Zhang, Y.; Li, Y.; Ramesh, N.; Lee, J.; Pennathur-Das, R.; Radzyminski, J.; Wypych, J.; et al. CV706, a prostate cancer-specific adenovirus variant, in combination with radiotherapy produces synergistic antitumor efficacy without increasing toxicity. Cancer Res. 2001, 61, 5453–5460. [Google Scholar]
- Dilley, J.; Reddy, S.; Ko, D.; Nguyen, N.; Rojas, G.; Working, P.; Yu, D.C. Oncolytic adenovirus CG7870 in combination with radiation demonstrates synergistic enhancements of antitumor efficacy without loss of specificity. Cancer Gene Ther. 2005, 12, 715–722. [Google Scholar] [CrossRef]
- Hingorani, M.; White, C.L.; Merron, A.; Peerlinck, I.; Gore, M.E.; Slade, A.; Scott, S.D.; Nutting, C.M.; Pandha, H.S.; Melcher, A.A.; et al. Inhibition of repair of radiation-induced DNA damage enhances gene expression from replication-defective adenoviral vectors. Cancer Res. 2008, 68, 9771–9778. [Google Scholar] [CrossRef] [PubMed]
- Toth, K.; Tarakanova, V.; Doronin, K.; Ward, P.; Kuppuswamy, M.; Locke, J.E.; Dawson, J.E.; Kim, H.J.; Wold, W.S.M. Radiation increases the activity of oncolytic adenovirus cancer gene therapy vectors that overexpress the ADP (E3-11.6K) protein. Cancer Gene Ther. 2003, 10, 193–200. [Google Scholar] [CrossRef] [PubMed]
- Kawabe, S.; Munshi, A.; Zumstein, L.A.; Wilson, D.R.; Roth, J.A.; Meyn, R.E. Adenovirus-mediated wild-type p53 gene expression radiosensitizes non-small cell lung cancer cells but not normal lung fibroblasts. Int. J. Radiat. Biol. 2001, 77, 185–194. [Google Scholar] [CrossRef] [PubMed]
- Portella, G.; Pacelli, R.; Libertini, S.; Cella, L.; Vecchio, G.; Salvatore, M.; Fusco, A. ONYX-015 Enhances Radiation-Induced Death of Human Anaplastic Thyroid Carcinoma Cells. J. Clin. Endocrinol. Metab. 2003, 88, 5027–5032. [Google Scholar] [CrossRef]
- Geoerger, B.; Grill, J.; Opolon, P.; Morizet, J.; Aubert, G.; Lecluse, Y.; Van Beusechem, V.W.; Gerritsen, W.R.; Kirn, D.H.; Vassal, G. Potentiation of radiation therapy by the oncolytic adenovirus dl1520 (ONYX-015) in human malignant glioma xenografts. Br. J. Cancer 2003, 89, 577–584. [Google Scholar] [CrossRef][Green Version]
- Ganesh, S.; Gonzalez-Edick, M.; Gibbons, D.; Ge, Y.; Vanroey, M.; Robinson, M.; Jooss, K. Combination therapy with radiation or cisplatin enhances the potency of Ad5/35 chimeric oncolytic adenovirus in a preclinical model of head and neck cancer. Cancer Gene Ther. 2009, 16, 383–392. [Google Scholar] [CrossRef] [PubMed]
- Kuhn, I.; Harden, P.; Bauzon, M.; Chartier, C.; Nye, J.; Thorne, S.; Reid, T.; Ni, S.; Lieber, A.; Fisher, K.; et al. Directed evolution generates a novel oncolytic virus for the treatment of colon cancer. PLoS ONE 2008, 3, e2409. [Google Scholar] [CrossRef] [PubMed]
- Vogels, R.; Zuijdgeest, D.; van Rijnsoever, R.; Hartkoorn, E.; Damen, I.; de Béthune, M.-P.; Kostense, S.; Penders, G.; Helmus, N.; Koudstaal, W.; et al. Replication-deficient human adenovirus type 35 vectors for gene transfer and vaccination: Efficient human cell infection and bypass of preexisting adenovirus immunity. J. Virol. 2003, 77, 8263–8271. [Google Scholar] [CrossRef] [PubMed]
- Holterman, L.; Vogels, R.; van der Vlugt, R.; Sieuwerts, M.; Grimbergen, J.; Kaspers, J.; Geelen, E.; van der Helm, E.; Lemckert, A.; Gillissen, G.; et al. Novel Replication-Incompetent Vector Derived from Adenovirus Type 11 (Ad11) for Vaccination and Gene Therapy: Low Seroprevalence and Non-Cross-Reactivity with Ad5. J. Virol. 2004, 78, 13207–13215. [Google Scholar] [CrossRef] [PubMed]
- Illingworth, S.; Di, Y.; Bauzon, M.; Lei, J.; Duffy, M.R.; Alvis, S.; Champion, B.; Lieber, A.; Hermiston, T.; Seymour, L.W.L.W.; et al. Preclinical Safety Studies of Enadenotucirev, a Chimeric Group B Human-Specific Oncolytic Adenovirus. Mol. Ther. Oncolytics 2017, 5, 62–74. [Google Scholar] [CrossRef] [PubMed]
- Machiels, J.-P.; Salazar, R.; Rottey, S.; Duran, I.; Dirix, L.; Geboes, K.; Wilkinson-Blanc, C.; Pover, G.; Alvis, S.; Champion, B.; et al. A phase 1 dose escalation study of the oncolytic adenovirus enadenotucirev, administered intravenously to patients with epithelial solid tumors (EVOLVE). J. Immunother. Cancer 2019, 7, e20. [Google Scholar] [CrossRef]
- Marino, N.; Illingworth, S.; Kodialbail, P.; Patel, A.; Calderon, H.; Lear, R.; Fisher, K.D.; Champion, B.R.; Brown, A.C.N.N. Development of a versatile oncolytic virus platform for local intra-tumoural expression of therapeutic transgenes. PLoS ONE 2017, 12, e0177810. [Google Scholar] [CrossRef]
- Freedman, J.D.; Hagel, J.; Scott, E.M.; Psallidas, I.; Gupta, A.; Spiers, L.; Miller, P.; Kanellakis, N.; Ashfield, R.; Fisher, K.D.; et al. Oncolytic adenovirus expressing bispecific antibody targets T-cell cytotoxicity in cancer biopsies. EMBO Mol. Med. 2017, 9, 1067–1087. [Google Scholar] [CrossRef]
- Freedman, J.D.; Duffy, M.R.; Lei-Rossmann, J.; Muntzer, A.; Scott, E.M.; Hagel, J.; Campo, L.; Bryant, R.J.; Verrill, C.; Lambert, A.; et al. An Oncolytic Virus Expressing a T-cell Engager Simultaneously Targets Cancer and Immunosuppressive Stromal Cells. Cancer Res. 2018, 78, 6852–6865. [Google Scholar] [CrossRef]
- Scott, E.M.; Jacobus, E.J.; Lyons, B.; Frost, S.; Freedman, J.D.; Dyer, A.; Khalique, H.; Taverner, W.K.; Carr, A.; Champion, B.R.; et al. Bi- And tri-valent T cell engagers deplete tumour-associated macrophages in cancer patient samples. J. Immunother. Cancer 2019, 7, e320. [Google Scholar] [CrossRef] [PubMed]
- Garcia-Carbonero, R.; Salazar, R.; Duran, I.; Osman-Garcia, I.; Paz-Ares, L.; Bozada, J.M.; Boni, V.; Blanc, C.; Seymour, L.; Beadle, J.; et al. Phase 1 study of intravenous administration of the chimeric adenovirus enadenotucirev in patients undergoing primary tumor resection. J. Immunother. Cancer 2017, 5, e71. [Google Scholar] [CrossRef] [PubMed]
- Di, Y.; Seymour, L.; Fisher, K. Activity of a group B oncolytic adenovirus (ColoAd1) in whole human blood. Gene Ther. 2014, 21, 440–443. [Google Scholar] [CrossRef] [PubMed]
- Chia, S.-L.; Lei, J.; Ferguson, D.J.P.; Dyer, A.; Fisher, K.D.; Seymour, L.W. Group B adenovirus enadenotucirev infects polarised colorectal cancer cells efficiently from the basolateral surface expected to be encountered during intravenous delivery to treat disseminated cancer. Virology 2017, 505, 162–171. [Google Scholar] [CrossRef] [PubMed]
- Hingorani, M.; White, C.L.; Zaidi, S.; Merron, A.; Peerlinck, I.; Gore, M.E.; Nutting, C.M.; Pandha, H.S.; Melcher, A.A.; Vile, R.G.; et al. Radiation-mediated up-regulation of gene expression from replication-defective adenoviral vectors: Implications for sodium iodide symporter gene therapy. Clin. Cancer Res. 2008, 14, 4915–4924. [Google Scholar] [CrossRef] [PubMed]
- Das, A.K.; Sato, M.; Story, M.D.; Peyton, M.; Graves, R.; Redpath, S.; Girard, L.; Gazdar, A.F.; Shay, J.W.; Minna, J.D.; et al. Non-small cell lung cancers with kinase domain mutations in the epidermal growth factor receptor are sensitive to ionizing radiation. Cancer Res. 2006, 66, 9601–9608. [Google Scholar] [CrossRef]
- Williams, J.R.; Zhang, Y.; Russell, J.; Koch, C.; Little, J.B. Human tumor cells segregate into radiosensitivity groups that associate with ATM and TP53 status. Acta Oncol. (Madr.) 2007, 46, 628–638. [Google Scholar] [CrossRef]
- Yang, X.-D.; Xu, X.-H.; Zhang, S.-Y.; Wu, Y.; Xing, C.-G.; Ru, G.; Xu, H.-T.; Cao, J.-P. Role of miR-100 in the radioresistance of colorectal cancer cells. Am. J. Cancer Res. 2015, 5, e545. [Google Scholar]
- Knipe, D.M.; Howley, P. Fields Virology, 6th ed.; Lippincott Williams & Wilkins: Philadelphia, PA, USA, 2013. [Google Scholar]
- Bliss, C.I. The calculation of microbial assays. Bacteriol. Rev. 1956, 20, e243. [Google Scholar] [CrossRef]
- Panier, S.; Boulton, S.J. Double-strand break repair: 53BP1 comes into focus. Nat. Rev. Mol. Cell Biol. 2014, 15, 7–18. [Google Scholar] [CrossRef]
- Cruz, C.; Castroviejo-Bermejo, M.; Gutiérrez-Enríquez, S.; Llop-Guevara, A.; Ibrahim, Y.H.; Gris-Oliver, A.; Bonache, S.; Morancho, B.; Bruna, A.; Rueda, O.M.; et al. RAD51 foci as a functional biomarker of homologous recombination repair and PARP inhibitor resistance in germline BRCA-mutated breast cancer. Ann. Oncol. 2018, 29, 1203–1210. [Google Scholar] [CrossRef] [PubMed]
- Kinner, A.; Wu, W.; Staudt, C.; Iliakis, G. Gamma-H2AX in recognition and signaling of DNA double-strand breaks in the context of chromatin. Nucleic Acids Res. 2008, 36, 5678–5694. [Google Scholar] [CrossRef] [PubMed]
- Brestovitsky, A.; Nebenzahl-Sharon, K.; Kechker, P.; Sharf, R.; Kleinberger, T. The Adenovirus E4orf4 Protein Provides a Novel Mechanism for Inhibition of the DNA Damage Response. PLoS Pathog. 2016, 12, e1005420. [Google Scholar] [CrossRef] [PubMed]
- Lei, J.; Jacobus, E.J.; Taverner, W.K.; Fisher, K.D.; Hemmi, S.; West, K.; Slater, L.; Lilley, F.; Brown, A.; Champion, B.; et al. Expression of human CD46 and trans-complementation by murine adenovirus 1 fails to allow productive infection by a group B oncolytic adenovirus in murine cancer cells. J. Immunother. Cancer 2018, 6, e55. [Google Scholar] [CrossRef]
- Lee, J.H.; Cheong, H.M.; Kang, M.Y.; Kim, S.Y.; Kang, Y. Ser1778 of 53BP1 plays a role in DNA double-strand break repairs. Korean J. Physiol. Pharmacol. 2009, 13, 343–348. [Google Scholar] [CrossRef]
- Ahmed, D.; Eide, P.W.; Eilertsen, I.A.; Danielsen, S.A.; Eknæs, M.; Hektoen, M.; Lind, G.E.; Lothe, R.A. Epigenetic and genetic features of 24 colon cancer cell lines. Oncogenesis 2013, 2, e71. [Google Scholar] [CrossRef]
- Seitz, S.; Waßmuth, P.; Plaschke, J.; Schackert, H.K.; Karsten, U.; Santibanez-Koref, M.F.; Schlag, P.M.; Scherneck, S. Identification of microsatellite instability and mismatch repair gene mutations in breast cancer cell lines. Genes Chromosom. Cancer 2003, 37, 29–35. [Google Scholar] [CrossRef]
- Royds, J.A.; Hibma, M.; Dix, B.R.; Hananeia, L.; Russell, I.A.; Wiles, A.; Wynford-Thomas, D.; Braithwaite, A.W. p53 promotes adenoviral replication and increases late viral gene expression. Oncogene 2006, 25, 1509–1520. [Google Scholar] [CrossRef]
- Klopp, A.H.; Spaeth, E.L.; Dembinski, J.L.; Woodward, W.A.; Munshi, A.; Meyn, R.E.; Cox, J.D.; Andreeff, M.; Marini, F.C. Tumor irradiation increases the recruitment of circulating mesenchymal stem cells into the tumor microenvironment. Cancer Res. 2007, 67, 11687–11695. [Google Scholar] [CrossRef]
- Wang, Y.; Deng, W.; Li, N.; Neri, S.; Sharma, A.; Jiang, W.; Lin, S.H. Combining immunotherapy and radiotherapy for cancer treatment: Current challenges and future directions. Front. Pharmacol. 2018, 9, e185. [Google Scholar] [CrossRef]


© 2020 by the authors. Licensee MDPI, Basel, Switzerland. This article is an open access article distributed under the terms and conditions of the Creative Commons Attribution (CC BY) license (http://creativecommons.org/licenses/by/4.0/).
Share and Cite
Pokrovska, T.D.; Jacobus, E.J.; Puliyadi, R.; Prevo, R.; Frost, S.; Dyer, A.; Baugh, R.; Rodriguez-Berriguete, G.; Fisher, K.; Granata, G.; et al. External Beam Radiation Therapy and Enadenotucirev: Inhibition of the DDR and Mechanisms of Radiation-Mediated Virus Increase. Cancers 2020, 12, 798. https://doi.org/10.3390/cancers12040798
Pokrovska TD, Jacobus EJ, Puliyadi R, Prevo R, Frost S, Dyer A, Baugh R, Rodriguez-Berriguete G, Fisher K, Granata G, et al. External Beam Radiation Therapy and Enadenotucirev: Inhibition of the DDR and Mechanisms of Radiation-Mediated Virus Increase. Cancers. 2020; 12(4):798. https://doi.org/10.3390/cancers12040798
Chicago/Turabian StylePokrovska, Tzveta D., Egon J. Jacobus, Rathi Puliyadi, Remko Prevo, Sally Frost, Arthur Dyer, Richard Baugh, Gonzalo Rodriguez-Berriguete, Kerry Fisher, Giovanna Granata, and et al. 2020. "External Beam Radiation Therapy and Enadenotucirev: Inhibition of the DDR and Mechanisms of Radiation-Mediated Virus Increase" Cancers 12, no. 4: 798. https://doi.org/10.3390/cancers12040798
APA StylePokrovska, T. D., Jacobus, E. J., Puliyadi, R., Prevo, R., Frost, S., Dyer, A., Baugh, R., Rodriguez-Berriguete, G., Fisher, K., Granata, G., Herbert, K., Taverner, W. K., Champion, B. R., Higgins, G. S., Seymour, L. W., & Lei-Rossmann, J. (2020). External Beam Radiation Therapy and Enadenotucirev: Inhibition of the DDR and Mechanisms of Radiation-Mediated Virus Increase. Cancers, 12(4), 798. https://doi.org/10.3390/cancers12040798