Article

Role of Microtubule-Associated Protein 1b in Urothelial Carcinoma: Overexpression Predicts Poor Prognosis

1
Graduate Institute of Clinical Medicine, College of Medicine, Kaohsiung Medical University, Kaohsiung 807, Taiwan
2
Department of Urology, Kaohsiung Medical University Hospital, Kaohsiung 807, Taiwan
3
Department of Urology, School of Medicine, College of Medicine, Kaohsiung Medical University, Kaohsiung 807, Taiwan
4
Institute of Biomedical Science, National Sun Yat-sen University, Kaohsiung 80424, Taiwan
5
Department of Pathology, Chi Mei Medical Center, Tainan 710, Taiwan
6
Department of Urology, Chi Mei Medical Center, Tainan 710, Taiwan
7
Department of Urology, Ministry of Health and Welfare Pingtung Hospital, Pingtung 900, Taiwan
8
Department of Urology, Kaohsiung Municipal Ta-Tung Hospital, Kaohsiung 801, Taiwan
9
Center for Infectious Disease and Cancer Research, Kaohsiung Medical University, Kaohsiung 807, Taiwan
10
Center for Stem Cell Research, Kaohsiung Medical University, Kaohsiung 807, Taiwan
11
Institute of Medical Science and Technology, National Sun Yat-sen University, Kaohsiung 80424, Taiwan
12
Department of Biotechnology, Southern Taiwan University of Science and Technology, Tainan 71005, Taiwan
13
National Cancer Research Institute, National Health Research Institutes, Tainan 70456, Taiwan
*
Author to whom correspondence should be addressed.
Cancers 2020, 12(3), 630; https://doi.org/10.3390/cancers12030630
Submission received: 6 February 2020 / Revised: 5 March 2020 / Accepted: 6 March 2020 / Published: 9 March 2020
(This article belongs to the Special Issue Urological Cancer 2020)

Abstract

:
We sought to examine the relationship between microtubule-associated proteins (MAPs) and the prognosis of urothelial carcinoma by assessing the microtubule bundle formation genes using a reappraisal transcriptome dataset of urothelial carcinoma (GSE31684). The result revealed that microtubule-associated protein 1b (MAP1B) is the most significant upregulated gene related to cancer progression. Real-time reverse-transcription polymerase chain reaction was used to measure MAP1B transcription levels in urothelial carcinoma of the upper tract (UTUC) and the bladder (UBUC). Immunohistochemistry was conducted to detect MAP1B protein expression in 340 UTUC and 295 UBUC cases. Correlations of MAP1B expression with clinicopathological status, disease-specific survival, and metastasis-free survival were completed. To assess the oncogenic functions of MAP1B, the RTCC1 and J82 cell lines were stably silenced against their endogenous MAP1B expression. Study findings indicated that MAP1B overexpression was associated with adverse clinical features and could independently predict unfavorable prognostic effects, indicating its theranostic value in urothelial carcinoma.

1. Introduction

Urothelial carcinoma (UC) is the most common malignancy of the urinary tract and includes UC of the urinary bladder (UBUC) and upper urinary tract (UTUC). UBUC is a major UC, with an estimated 429,800 new cases and 165,100 deaths annually worldwide [1]. When first diagnosed, UBUC presents in most patients as a non–muscle-involved invasive disease with an estimated five-year survival rate of 88%, but this rate dramatically decreases to 15% in patients with tumor metastasis [2]. The prevalence of UTUC accounts for approximately 5% to 10% of all UC cases [3]; however, in Taiwan, the rate of UTUC is as high as 30% of affected cases. Furthermore, there is a slight predominance toward females, and ureteral tumors are attributed to greater than half of all cases of UTUC [4,5].
Transurethral resection of the bladder and radical nephroureterectomy with bladder cuff excision remain the gold-standard treatments in UBUC and UTUC for adequate local tumor control and improved long-term survival. However, despite proper surgical treatment, the mortality rate remains high [2,6,7]. Clinical prognostic factors, such as pathological tumor stage and grade, have diverse impacts in patients with identical findings; therefore, they are insufficient means for detailed risk stratification and are difficult to define before treatment [5].
UBUC staging starts from papillary (Ta) and superficial (T1) stages and extends to muscle-invasive advanced stages (T2–T4). Although the recurrence rate of superficial tumors following surgical resection of the bladder is high, it is associated with a markedly better prognosis than that of muscle-invasive tumors [8]. There is a growing pool of evidence to suggest a pathophysiological distinction exists between superficial and muscle-invasive cases of UBUC [9]. It is also important to distinguish a particular variant that may be associated with the administration of a therapy distinctive from that used in conventional invasive UC [10]. A previous study demonstrated that the gene expression profiles of UC from renal pelvis, ureter and bladder were highly similar, indicating that a common functional molecular pathway likely underlies the carcinogenesis [11]. A larger, follow-up study to elucidate better genomics-based predictors for UC is warranted, the results of which could lead to improvements in neoadjuvant/adjuvant therapy and provide suitable follow-up strategies.
Microtubules are a critical component of the cytoskeleton and are important and indispensable in several cellular processes. They are located throughout the cytoplasm and are dynamically unstable (i.e., coexisting in a state of assembly and disassembly). Microtubule-associated proteins (MAPs) are a large family of proteins involved in microtubule assembly, which is an essential step in stabilizing microtubules. MAPs are divided into two classical families: type I, which includes the MAP1 (MAP1A, MAP1B, and MAP1S) proteins [12] and type II, which includes MAP2, MAP4, and MAPT/TAU proteins [13]. Disrupting microtubule dynamics is one of the most successful and widely considered targets of cancer chemotherapy agents [14,15]. Microtubule agents target the aberrant expression of MAPs in a variety of malignancies, and their resistant phenotypes have been documented. Herein, we aimed to examine the relationship between MAPs and the prognosis of urothelial carcinoma by assessing the microtubule bundle formation genes using a reappraisal transcriptome dataset of urothelial carcinoma (GSE31684). Moreover, to our knowledge, this study is the first to examine MAP1B expression and the prognosis and intrinsic biologic aggressiveness of UC.

2. Results

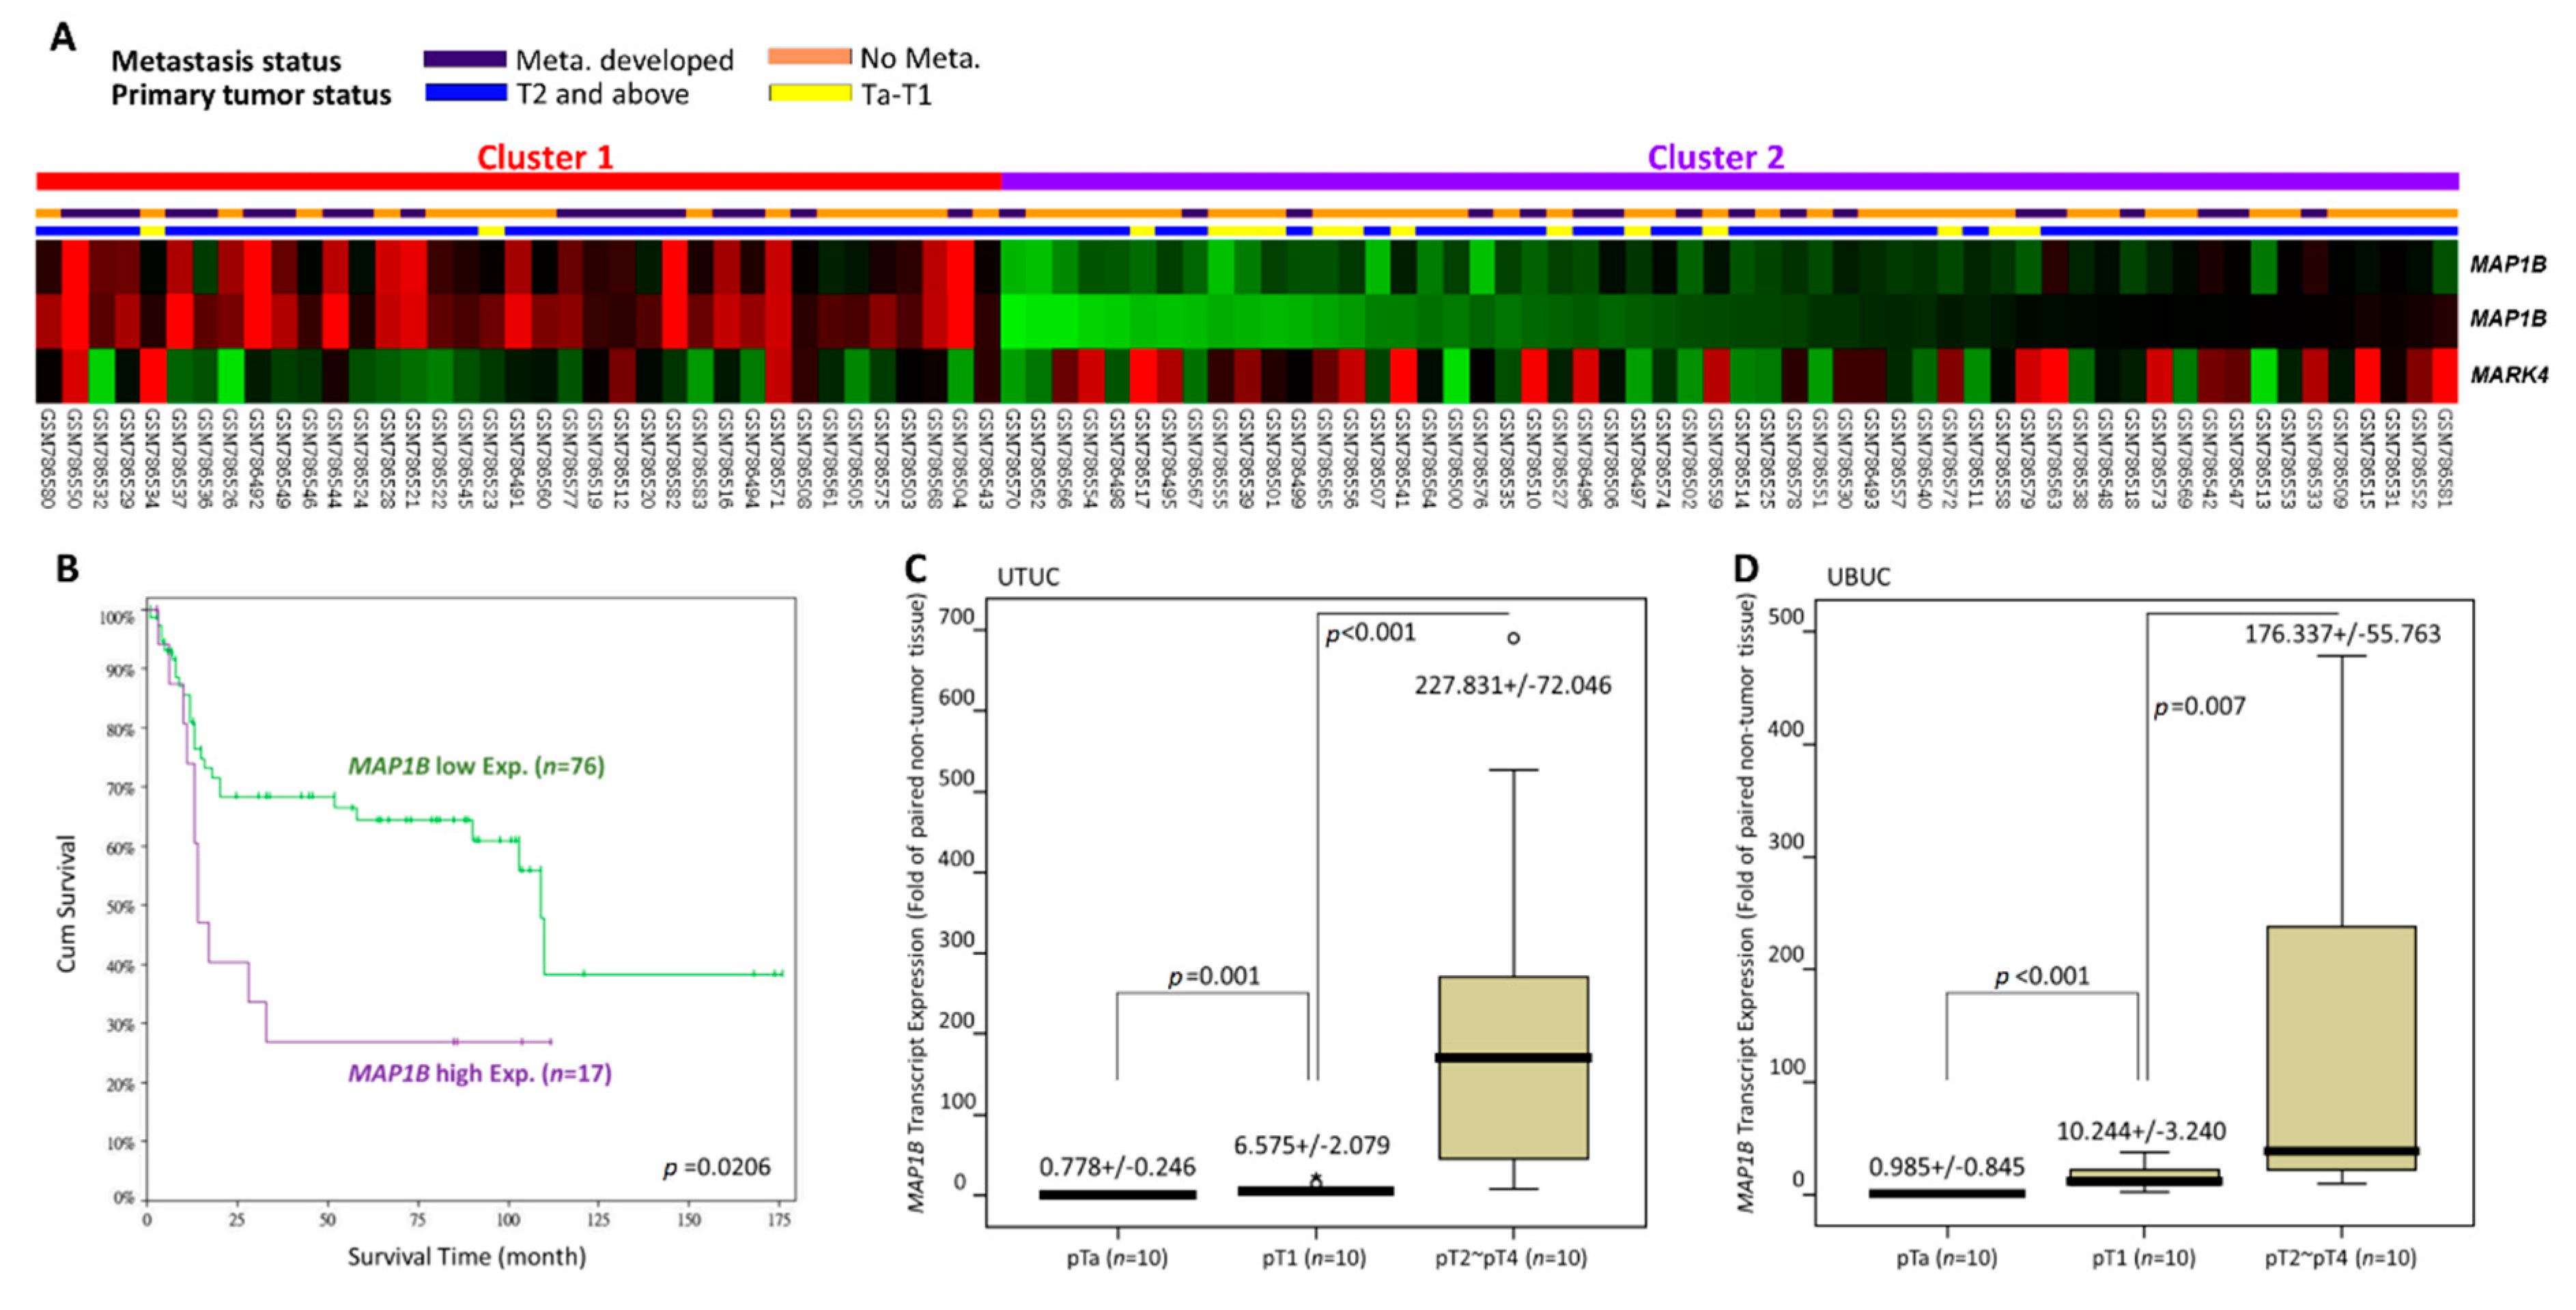
2.1. MAP1B Is the Most Significantly Upregulated Gene Associated with Microtubule Bundle Formation in UBUC Transcriptomes

The UBUC transcriptome dataset includes 93 tissue samples, with 78 categorized as deeply invasive tissues (pT2–pT4) and 15 categorized as noninvasive or superficial (pTa and pT1) tissues. Metastasis was detected in 28 patients and absent in 49 patients. Through transcriptome profiling, we identified 11 probes spanning six transcripts associated with microtubule bundle formation (GO:0001578). Among these expressed genes, we found that tumors with increased MAP1B expression and decreased MARK4 had a more advanced pT status and a higher incidence of metastatic events (Figure 1A). Our main goal was to find the most significant upregulated genes associated with advanced disease. Therefore, we choose MAP1B for further validation. Table 1 shows the MAP1B gene (Probe: 226084_at, 214577_at) upregulation with up to 1.2832-, 0.3773- and 0.9436-, 0.3943- fold log ratios in advanced and metastatic UC, respectively. Furthermore, we found through survival analysis that increased MAP1B expression was significantly related to poor prognosis in patients with UBUC (Figure 1B). As shown in Figure 1c,d, the MAP1B transcripts level was significantly higher among tumors with high pT status (pT2–pT4) than in noninvasive tumors (pTa–pT1) in both the UTUC and UBUC groups (both p < 0.01). Our findings indicate that MAP1B is associated with tumor aggressiveness.

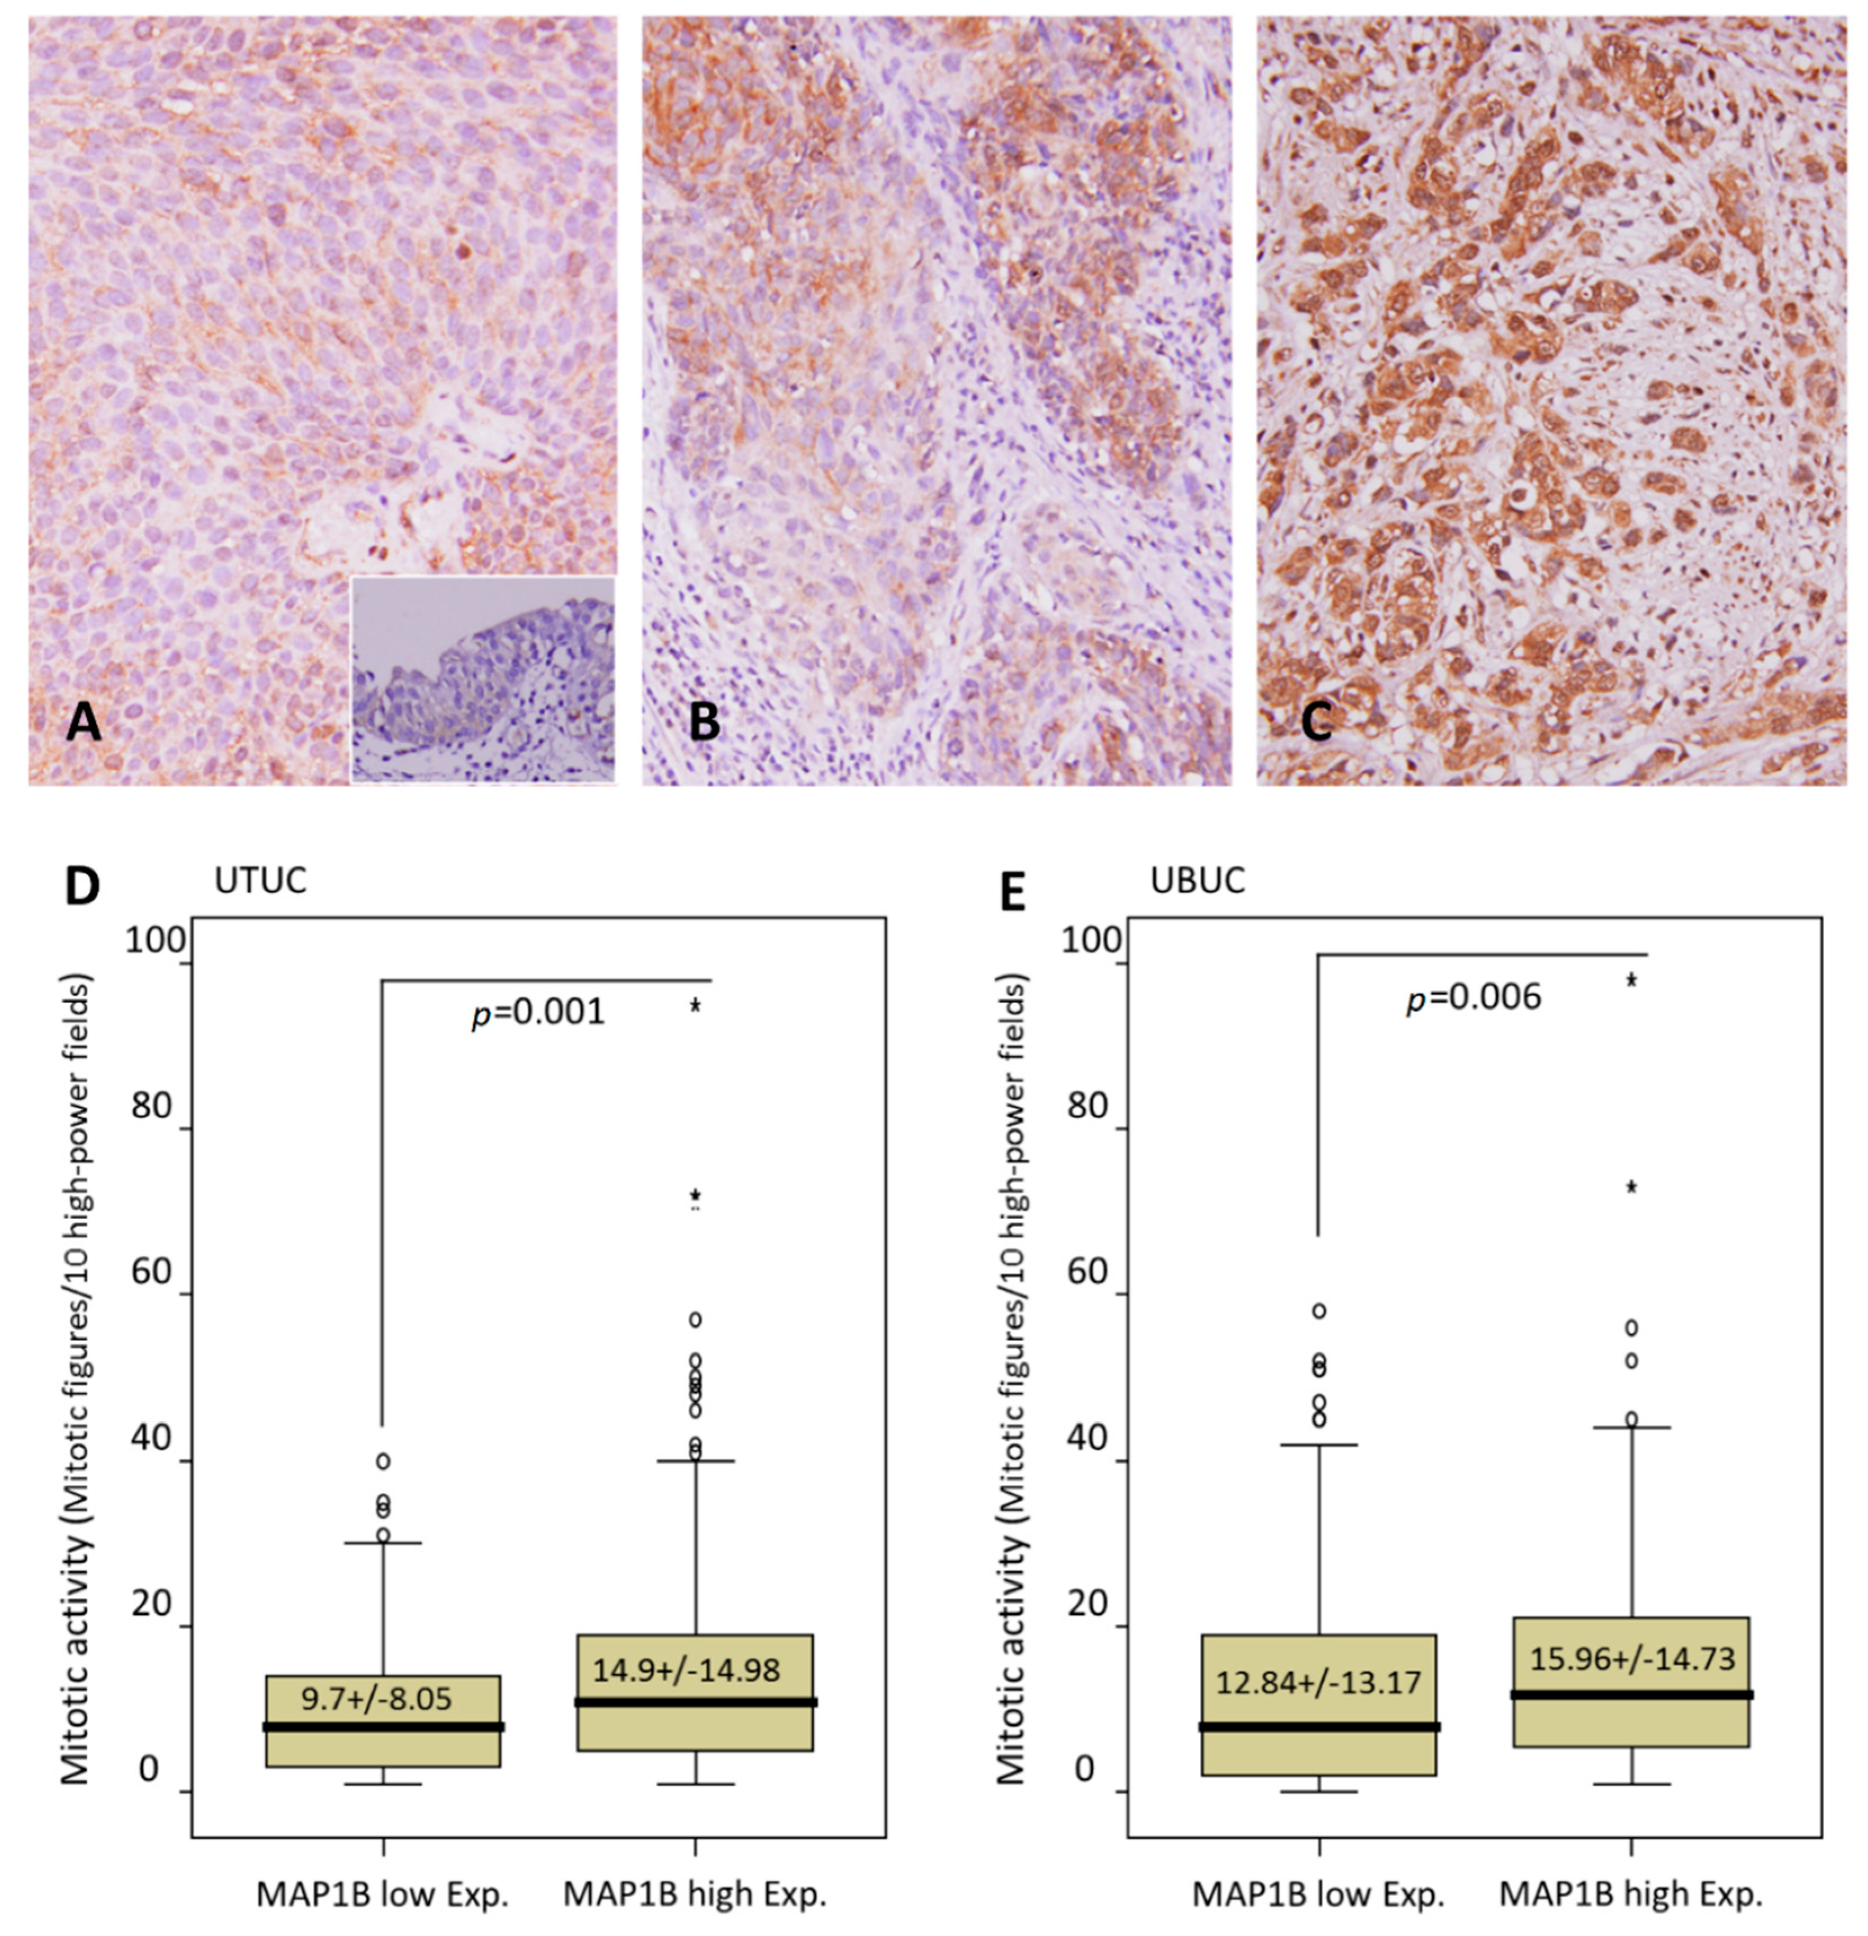
2.2. MAP1B Immunoexpression and Clinicopathological and Genomic Correlations in UTUC and UBUC

The association of clinicopathological characteristics with MAP1B immunoreactivity is shown in Table 2. We found, in UTUC cases, that high MAP1B expression was markedly associated with synchronous multiple tumors (p = 0.024), advanced pT status (p = 0.005) (Figure 2A–C), positive lymph node metastasis (p = 0.002), the presence of vascular invasion (p < 0.001), and an increased mitotic rate (p < 0.001) (Table 2 and Figure 2D). Similarly, in cases with UBUC, we found evidence of associations between increased MAP1B expression and advanced pathological tumor stage (p < 0.001), positive lymph node metastasis (p = 0.012), a high histological tumor grade (p = 0.016), the presence of vascular invasion (p = 0.045), and an increased mitotic rate (p = 0.006) (Table 2 and Figure 2E). Of note, none of the 30 cases displaying high MAP1B expression enrolled for mutational analysis were positive for MAP1B mutation, suggesting a mutation-independent expression of MAP1B.

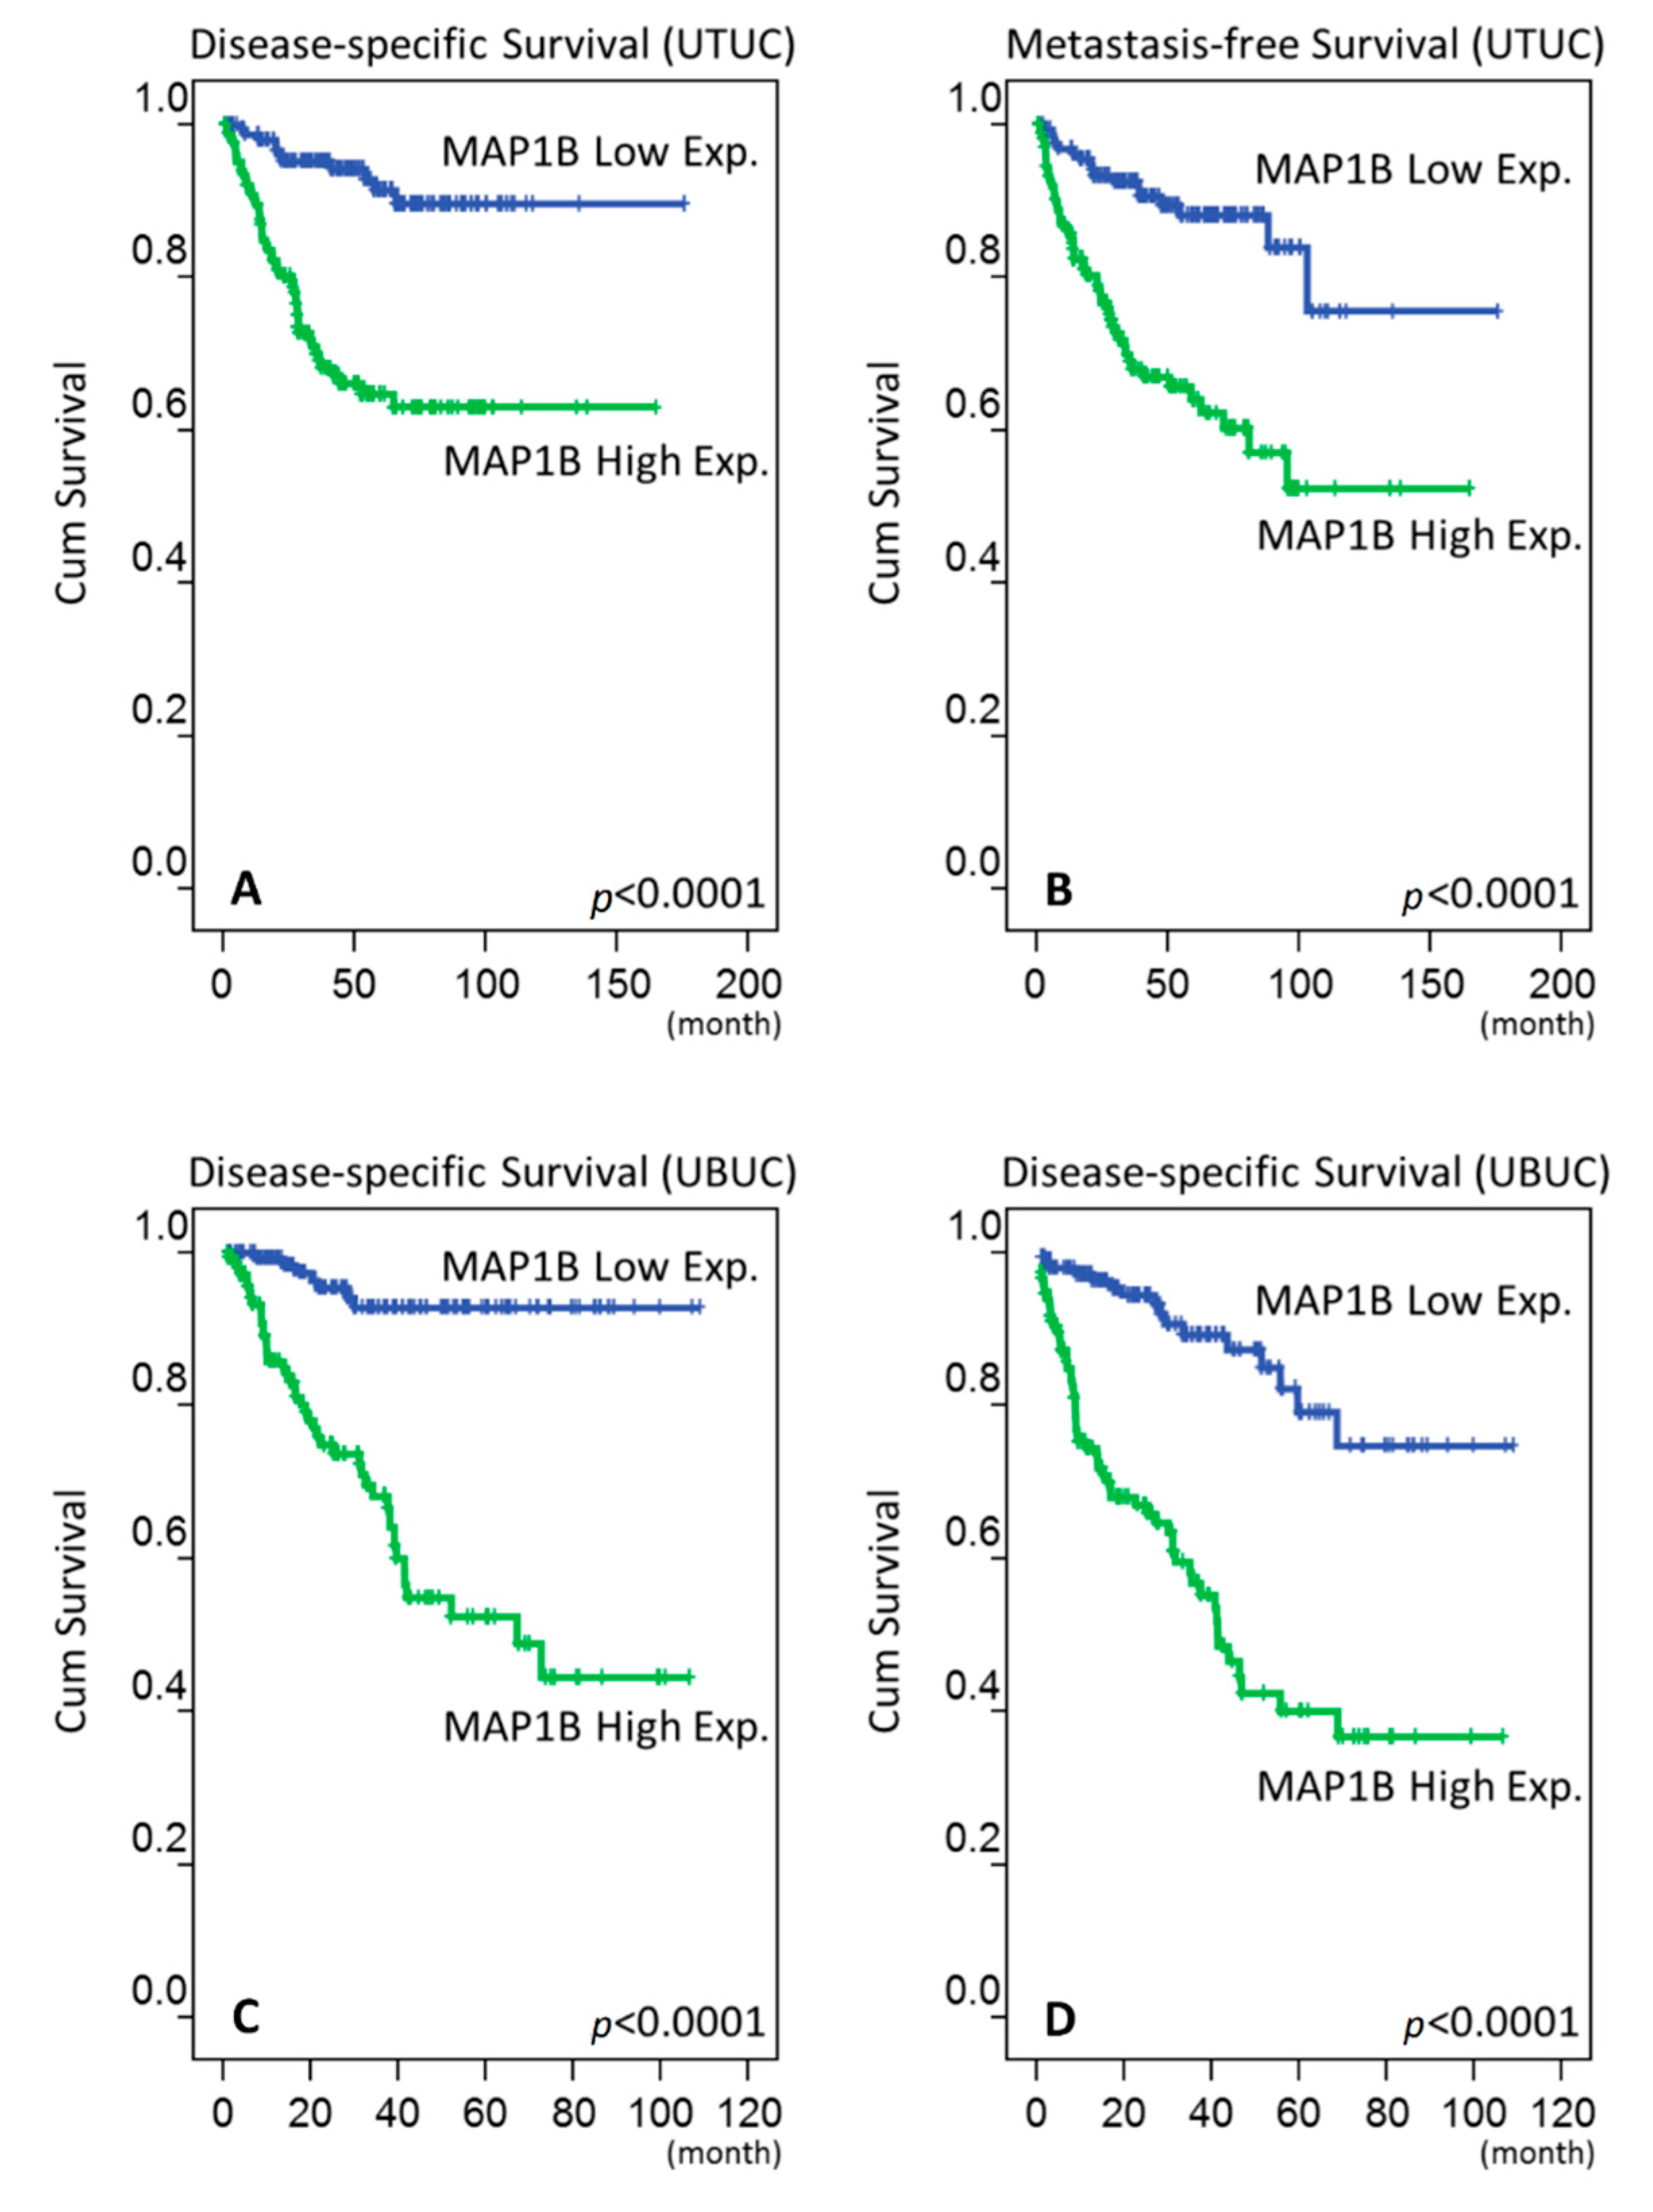
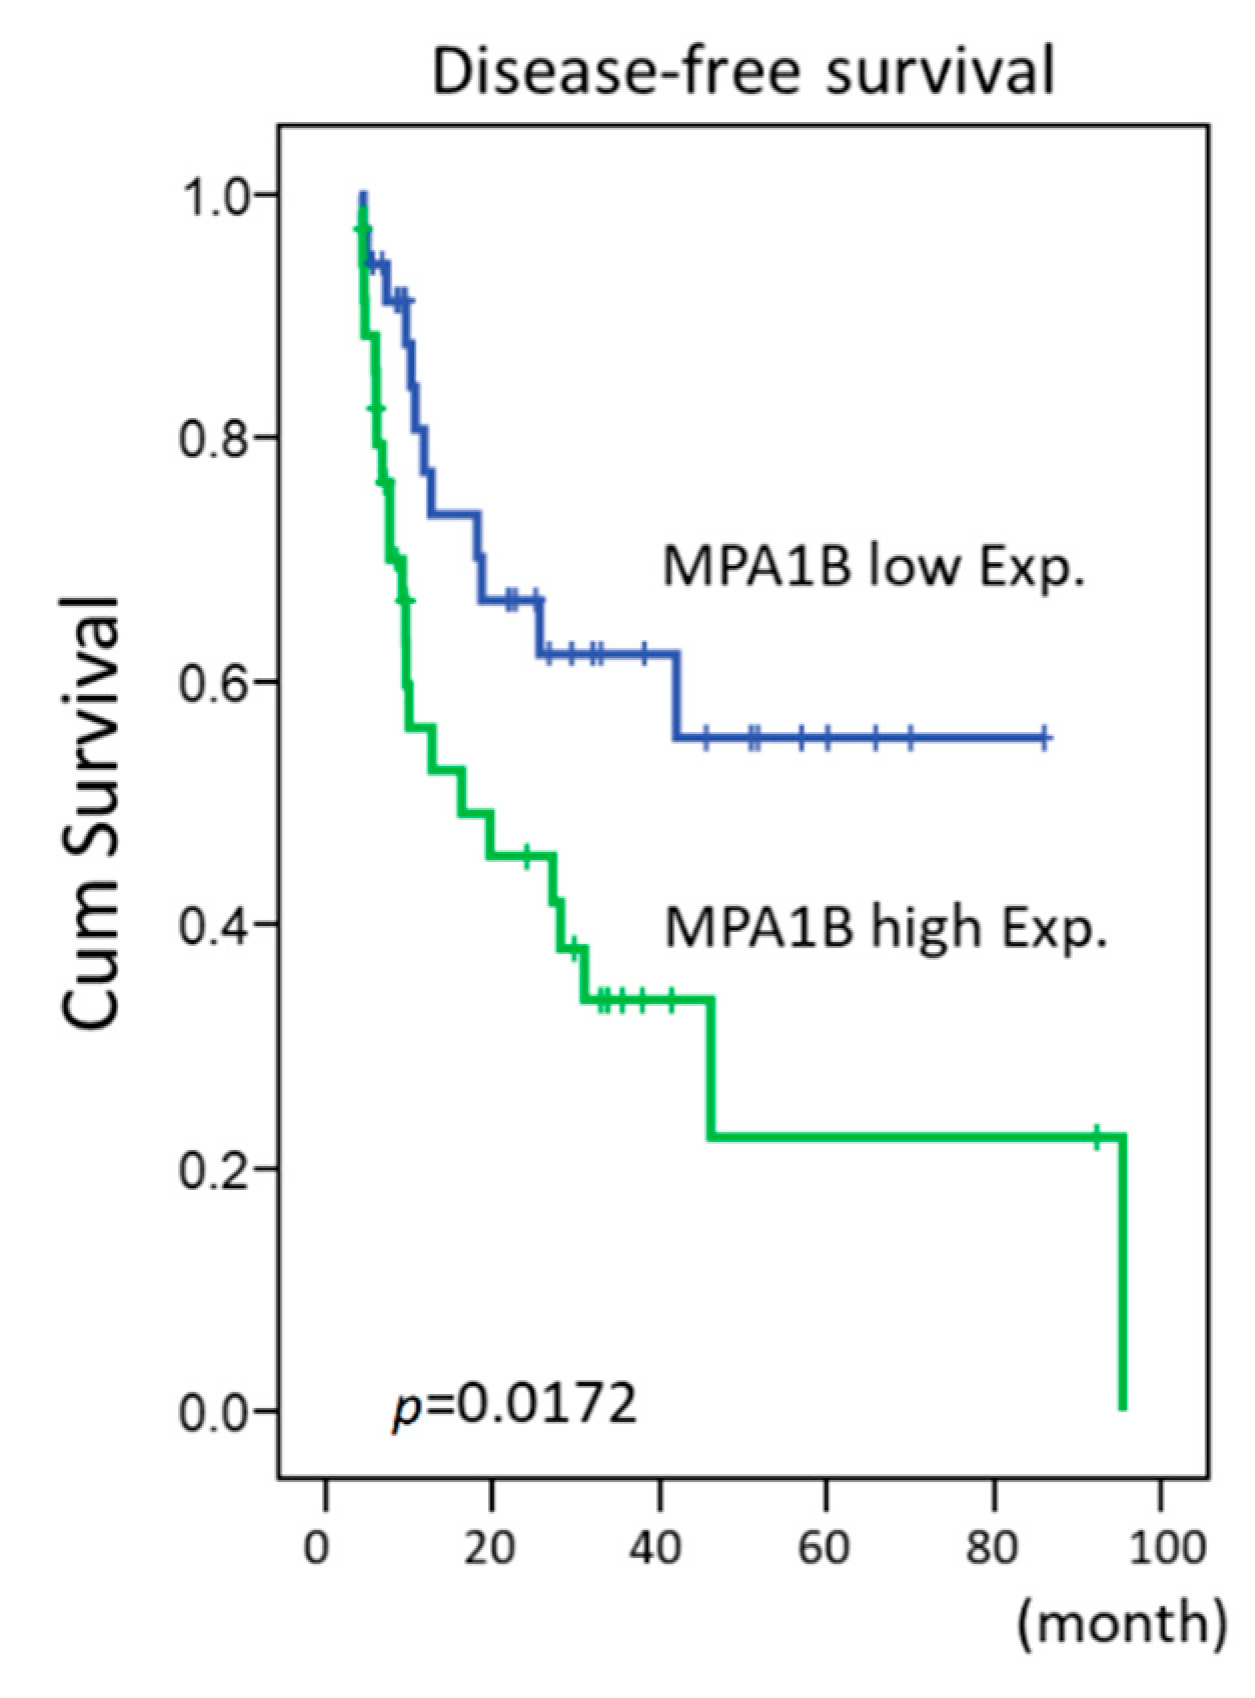
2.3. Survival Analysis in UTUC and UBUC

During follow-up, we found in our UTUC cohort that 61 (17.9%) patients died because of their cancer and 70 (20.6%) patients experienced disease progression. During univariate analysis, we observed that multifocal tumors, advanced pathological tumor stage, positive lymph node metastasis, high histological tumor grade, the presence of vascular invasion, perineural invasion, and high MAP1B expression (Figure 3A,B) were associated with worse disease-specific survival (DSS) and metastasis-free survival (MFS) (all p < 0.05). In multivariate analysis, multifocal tumors, advanced pathological tumor stage, positive lymph node metastasis, high histological tumor grade, perineural invasion, and MAP1B expression were independently predictive for both DSS and MFS (all p < 0.05) (Table 3).
In our follow-up of UBUC patients, we found that 52 (17.6%) patients died due to the cancer and 76 (25.8%) patients experienced disease progression. During univariate analysis, we determined that advanced pT status, positive lymph node metastasis, high histological tumor grade, the presence of vascular invasion, perineural invasion, an increased mitotic rate, and increment of MAP1B expression (Figure 3C,D) were associated with worse DSS and MFS (all p < 0.05). Using multivariate analysis, we confirmed that advanced pathological tumor stage, an increased mitotic rate, and MAP1B expression remained significant in predicting reduced DSS and MFS (all p < 0.05) (Table 4).

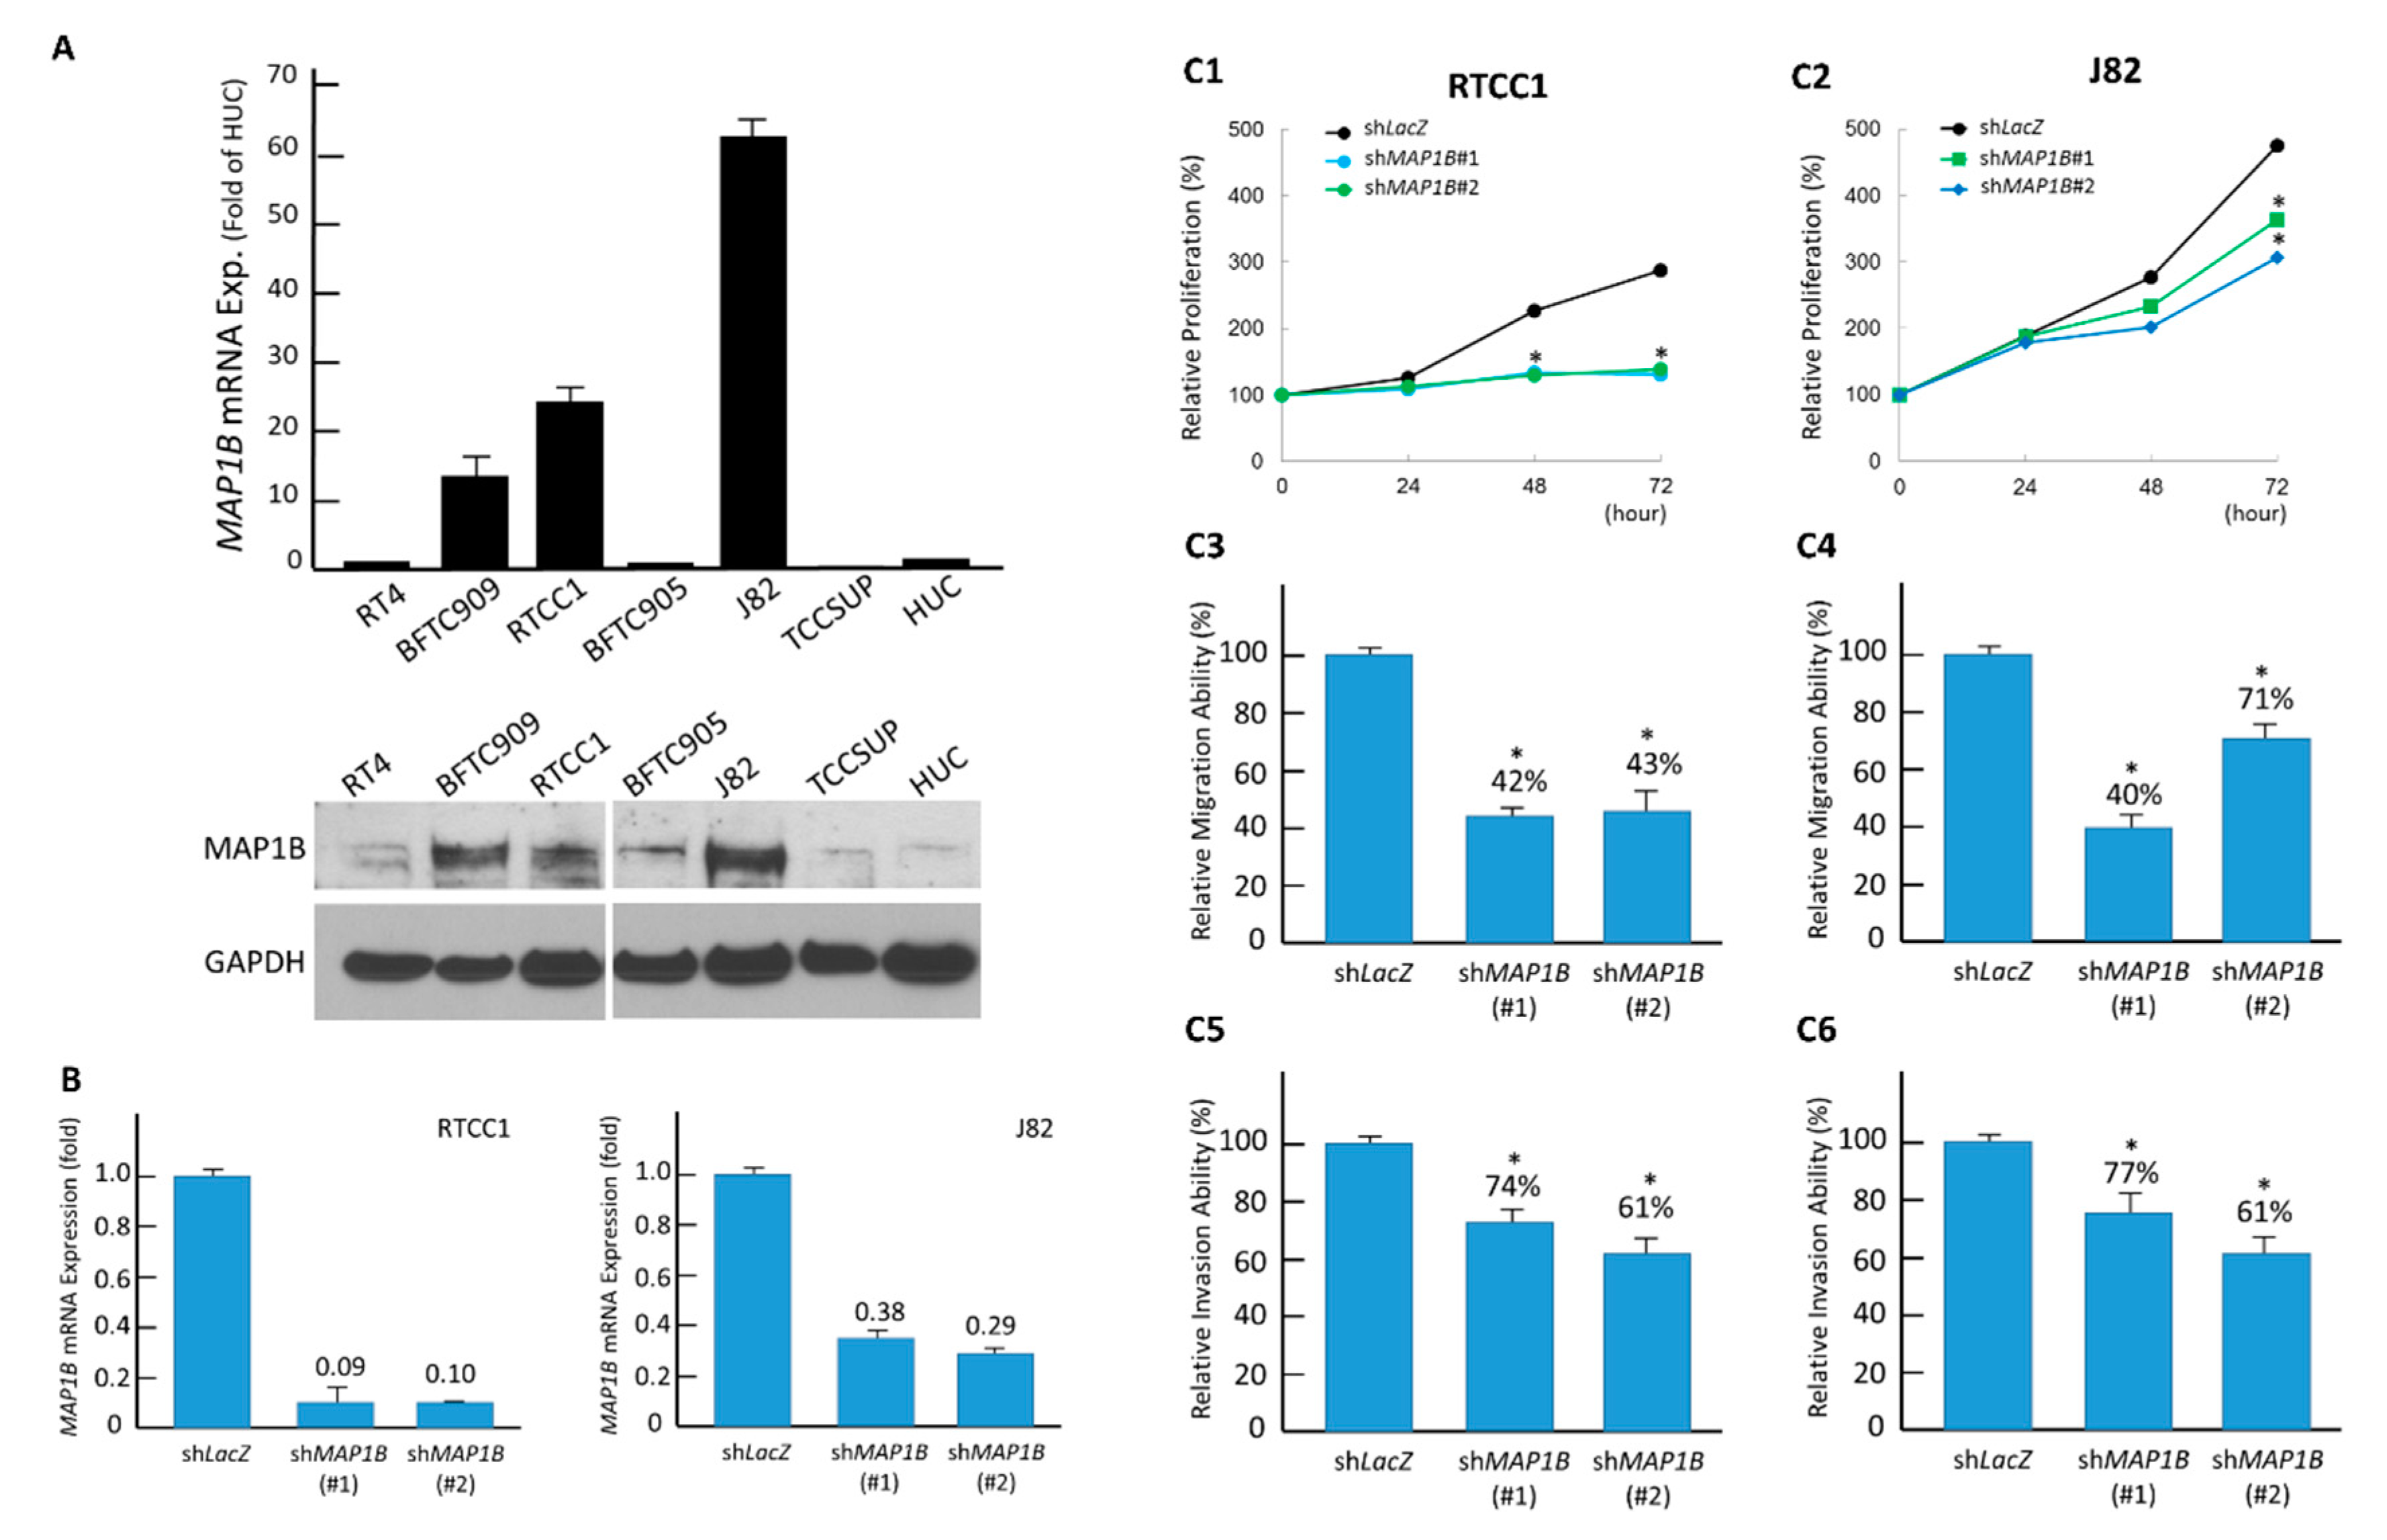
2.4. MAP1B Promotes the Cell Proliferation, Migration, and Invasion of UC Cell Lines

To investigate the biological effects of MAP1B, we first characterized endogenous MAP1B expression in eight UC cell lines and noticed RTCC1 and J82 cells had the most abundant MAP1B transcripts and protein expression (Figure 4A). We next successfully knocked down MAP1B in both the RTCC1 (Figure 4B, left) and J82 (Figure 4B, right) cell lines using short hairpin RNA (shRNA). We found significantly attenuated proliferation (viability) in stable MAP1B-silenced RTCC1 (Figure 4C1) and J82 (Figure 4C2) cells. Due to the positive relationship between MAP1B expression and the development of metastasis, we evaluated the effect of MAP1B in UC cell migration and invasion. MAP1B knockdown significantly decreased the migratory and invasive abilities of RTCC1 (Figure 4C3,C5) and J82 (Figure 4C4,C6) cells.

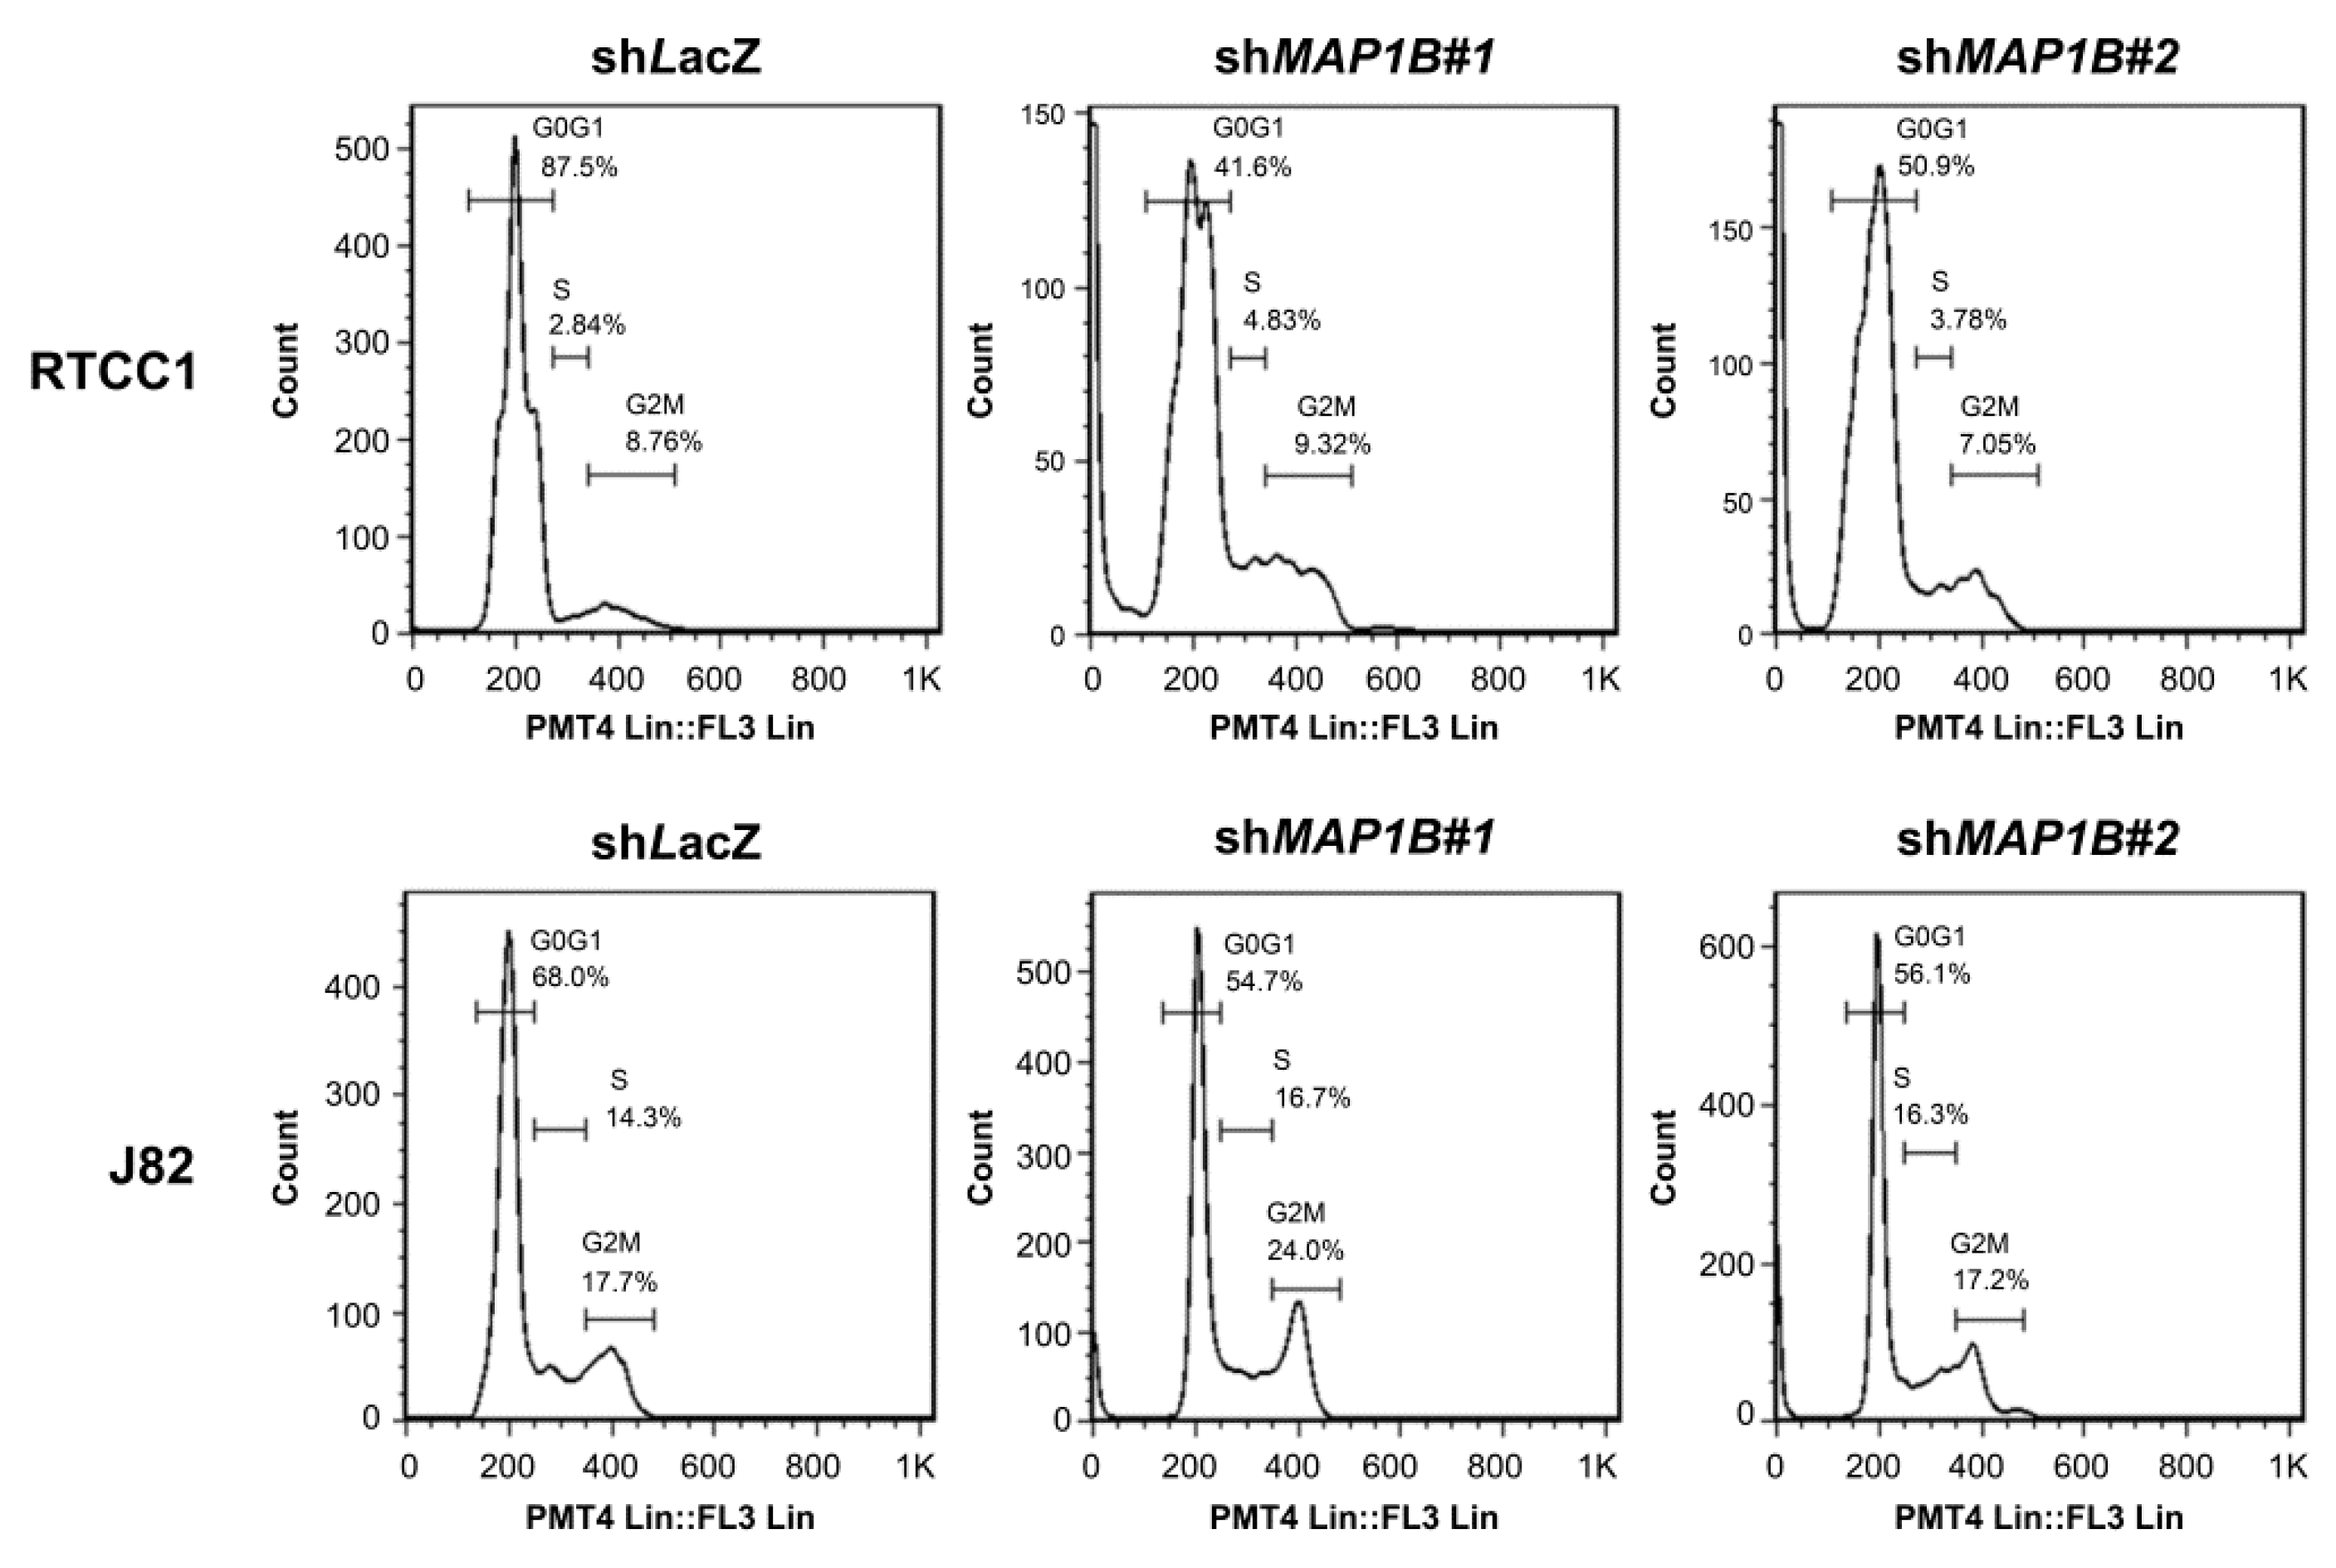
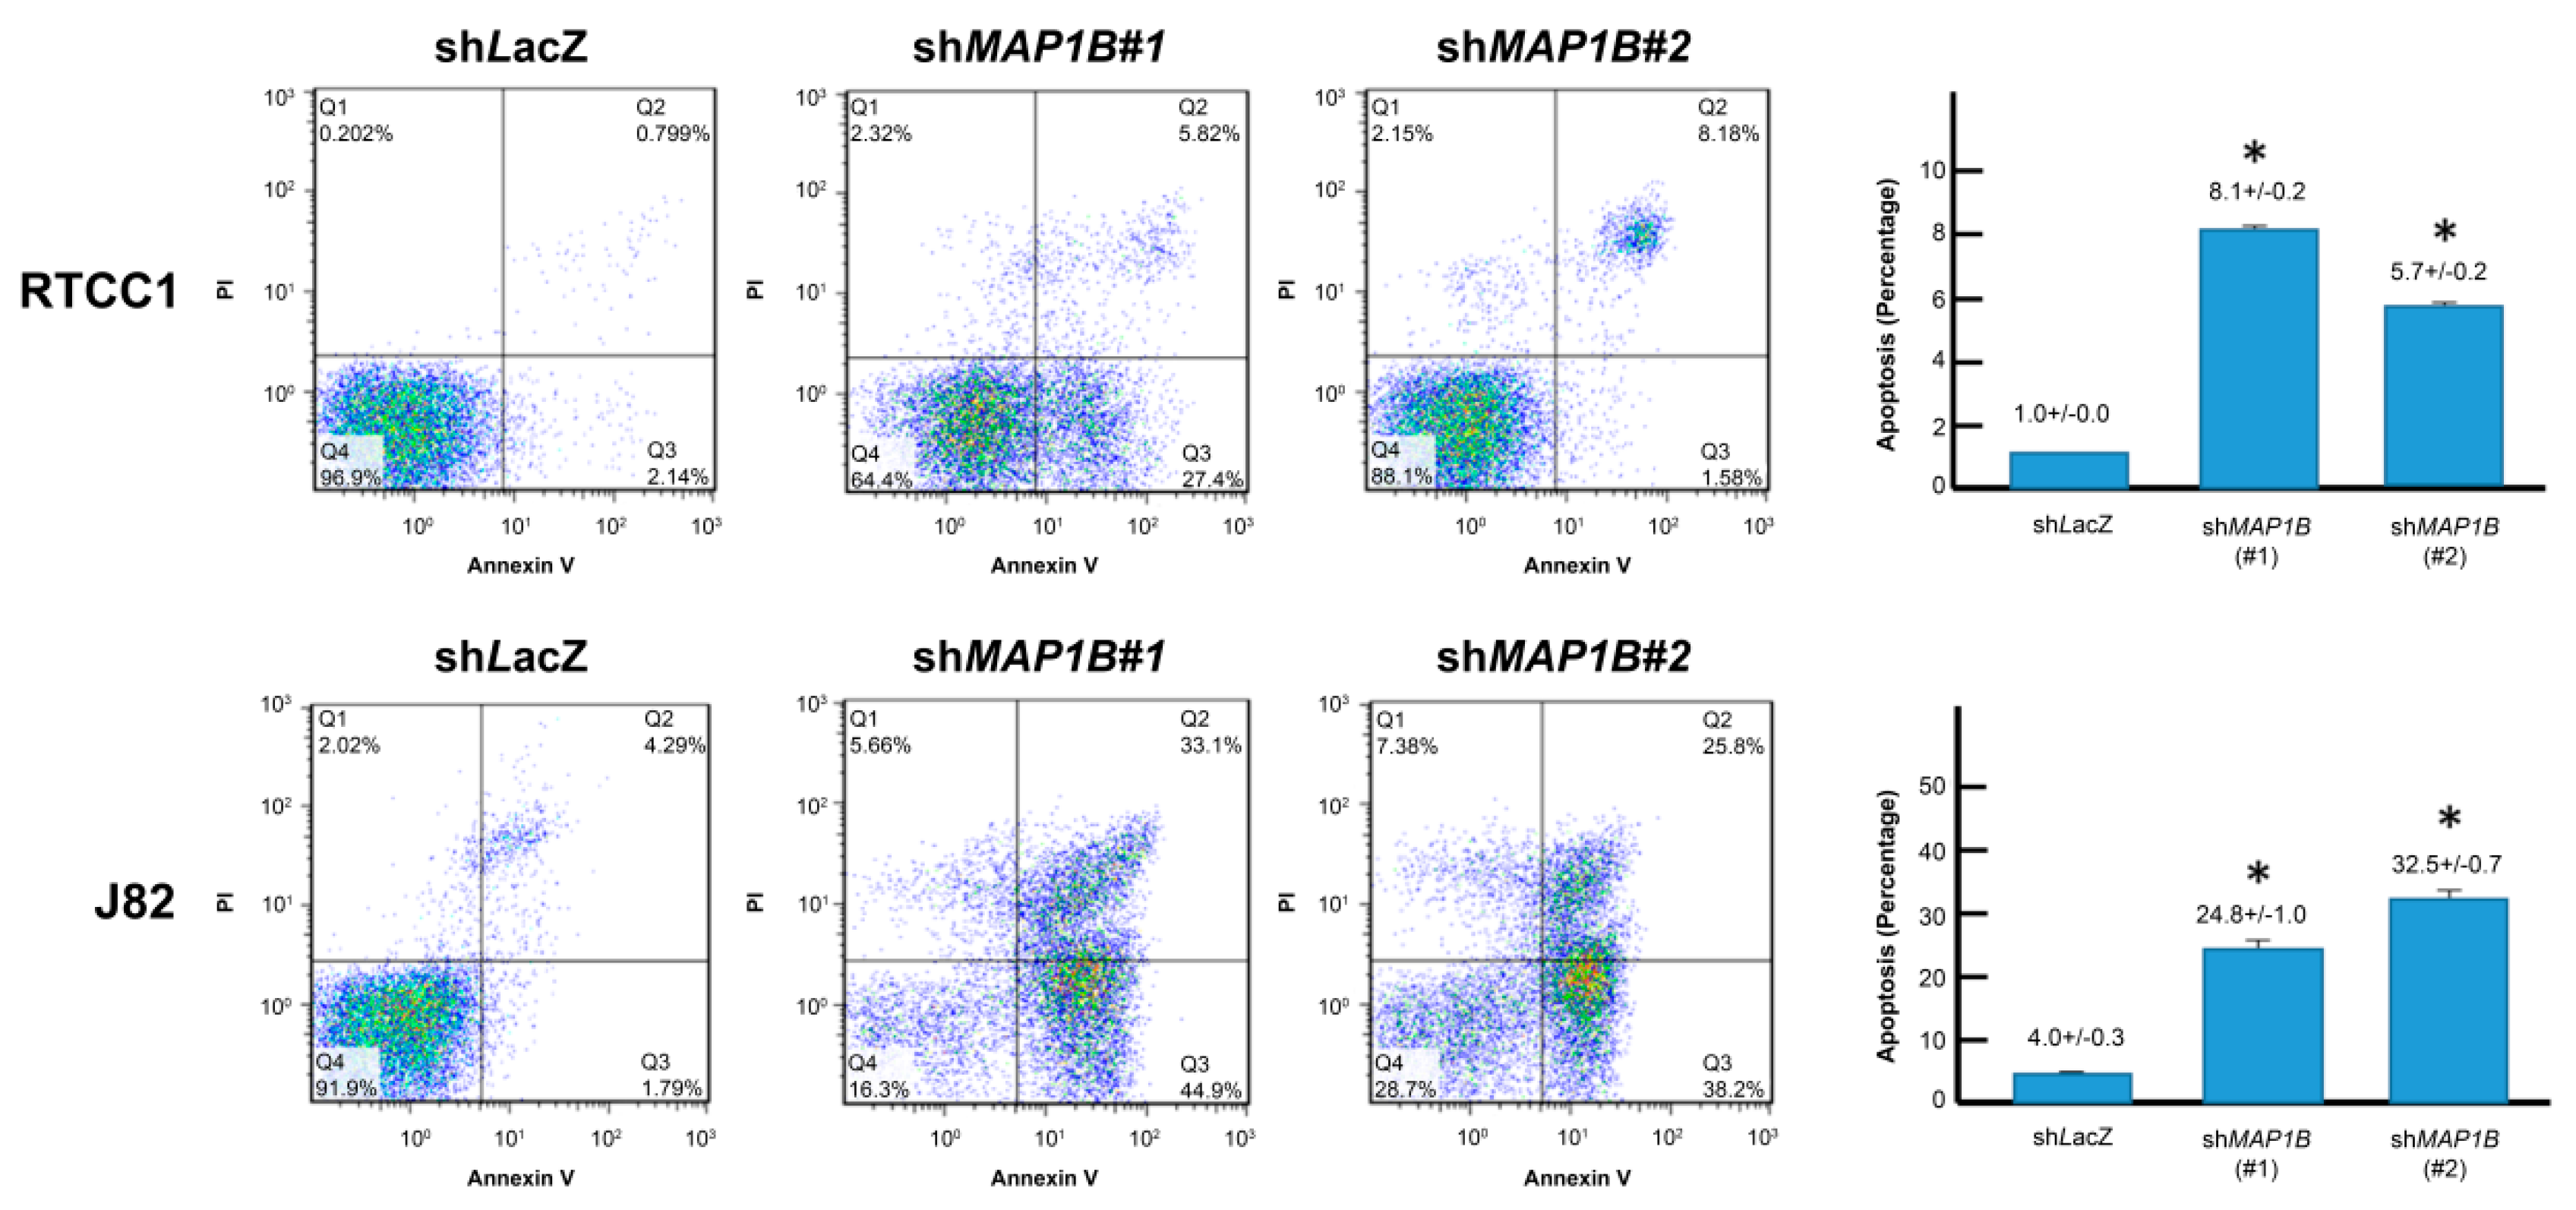
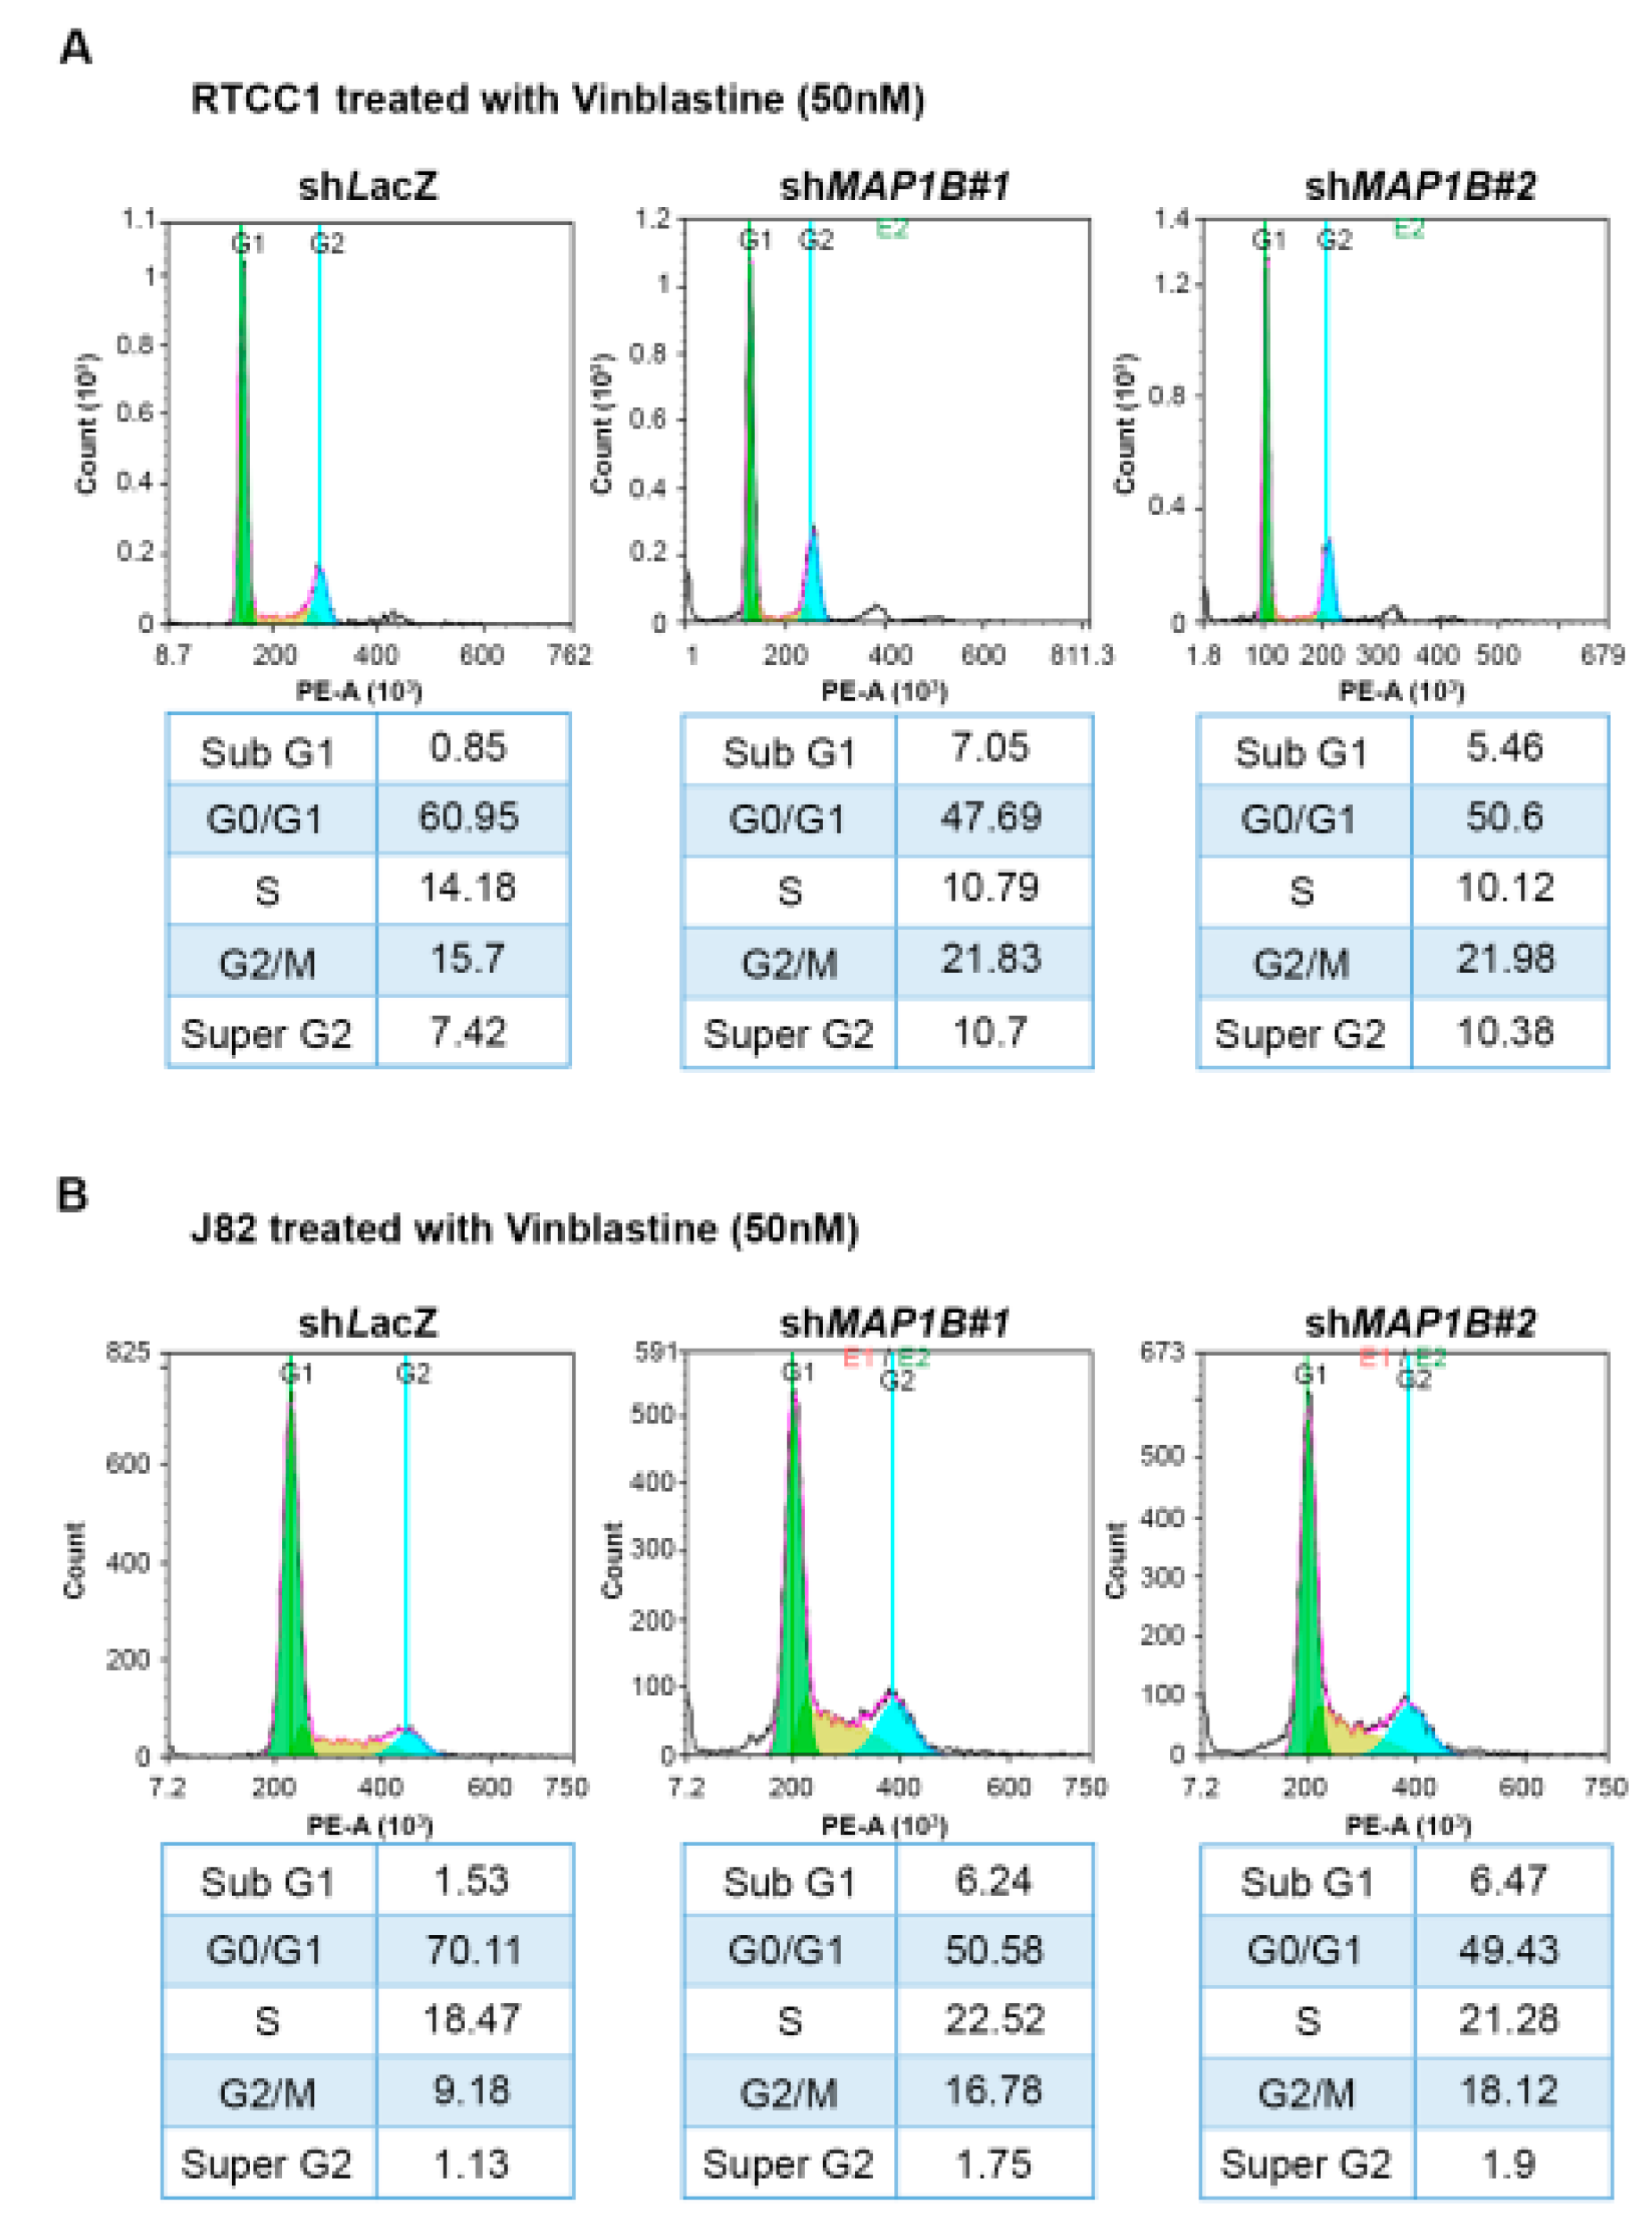
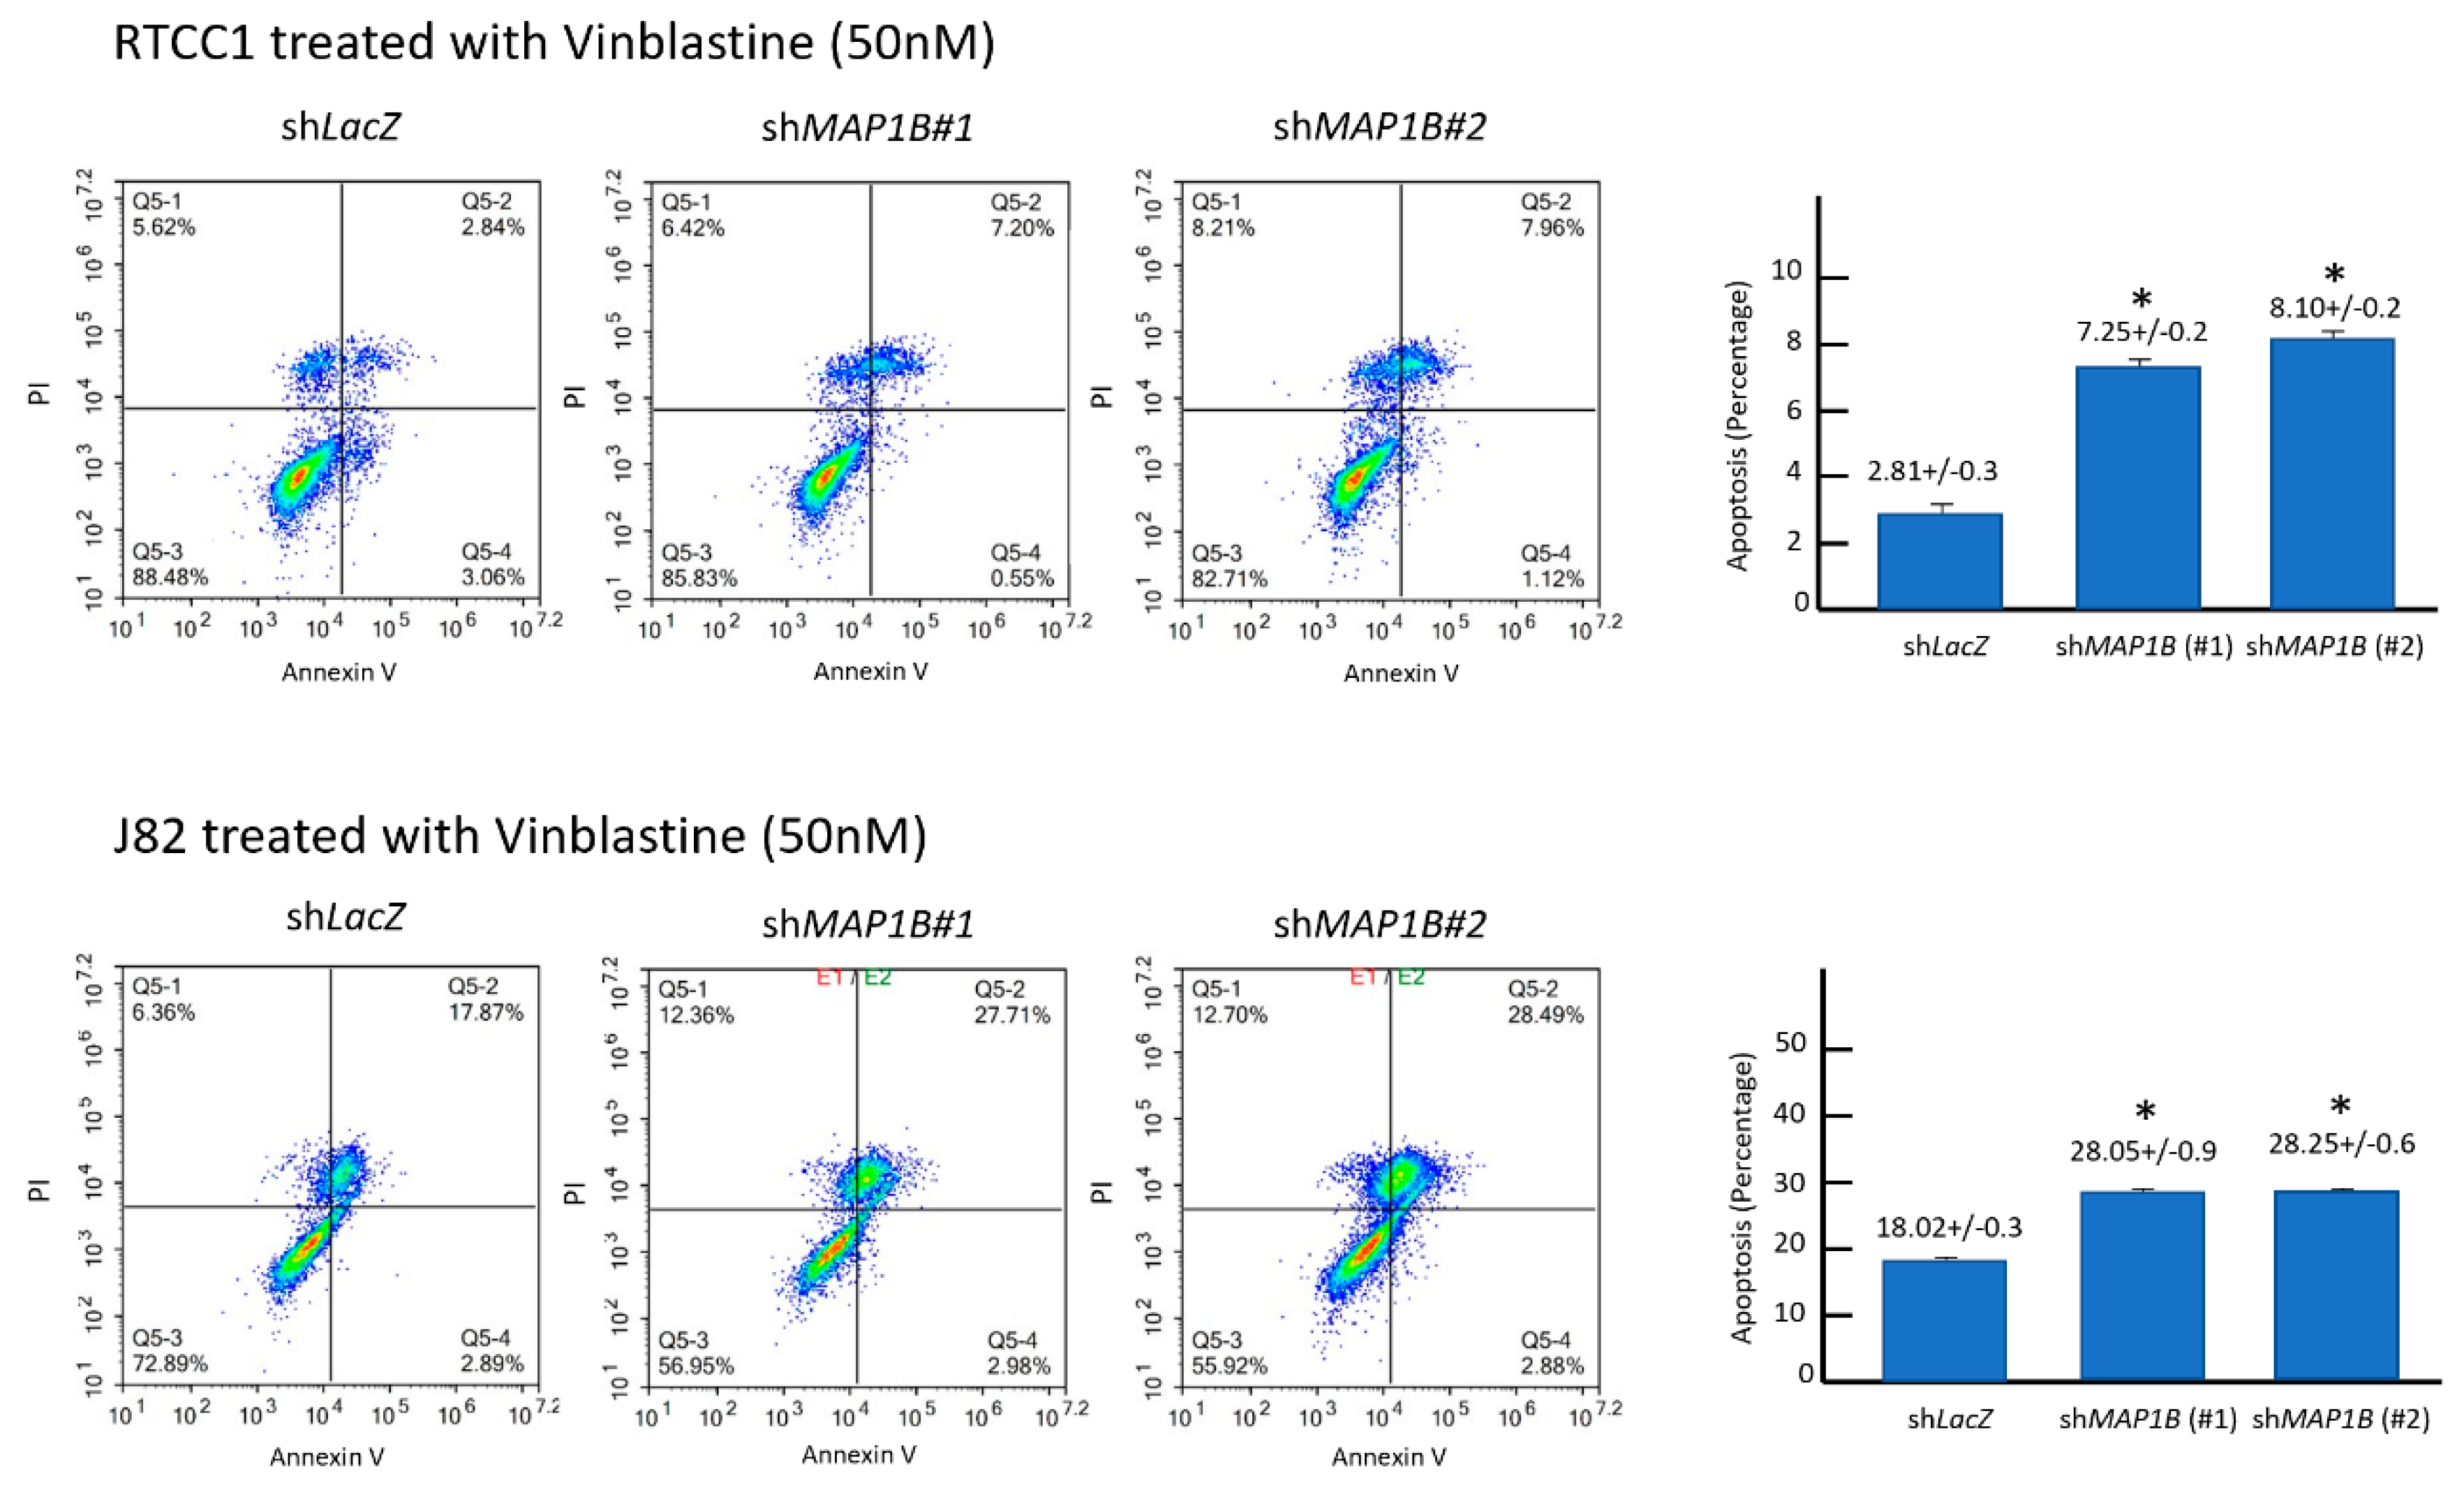
2.5. MAP1B Expression Correlates with Chemoresistance In Vitro and In Vivo

Flow cytometric analysis of stable MAP1B knockdown RTCC1 and J82 cell lines showed stable MAP1B knockdown significantly increased the sub-G1 population, indicating induced cell apoptosis (Figure 5 and Figure 6). Further analysis of vinblastine-treated RTCC1 and J82 cell lines also disclosed induced cell apoptosis (Figure 7 and Figure 8). In other words, MAP1B expression might lead to a resistance to anti-mitotic chemotherapeutics. In the independent UBUC patient cohort receiving adjuvant chemotherapy, Kaplan–Meier survival analysis showed high MAP1B expression correlated with inferior DFS (Figure 9), further supporting the role of MAP1B in chemoresistance.

3. Discussion

It is estimated that one-third of patients with UBUC have advanced disease at presentation [16]. A similar poor prognosis was found among patients with advanced UTUC in that the DSS has not changed significantly during the last two decades [17]. Regardless of the high initial response, the therapeutic effects of current treatment were insufficient and resulted in recurrence and death. Currently, there are no effective salvage regimens for treating metastatic UC. Metastasis requires the inherent dynamic instability of microtubules for cell motility, and many changes in the microtubule network have been identified in various cancers [14]. There is accumulating evidence that MAPs are associated with changes in microtubule dynamics, that they can determine the effects of microtubule-targeting agents, and that they play a role in cancer resistance [14]. However, reliable tumor markers that predict the sensitivity to chemotherapy and resistance to tumor metastasis remain elusive.
MAPs contain products of oncogenes, tumor suppressors, and apoptosis regulators thought to be involved in microtubule assembly. On the other hand, vinblastine, listed in the World Health Organization’s List of Essential Medicines, binds tubulin and inhibits the assembly of microtubules [18]. It causes M-phase–specific cell-cycle arrest by breaking microtubule assembly and proper formation of the mitotic spindle and the kinetochore, which were essential for the separation of chromosomes during the anaphase of mitosis. Due to the possibility of sharing a common function, the rational microtubule-targeting cancer therapeutic approaches should preferably include proteomic profiling of tumor MAPs before the administration of antimicrotubule agents preferentially in combination with agents that modulate the expression of relevant MAPs [14].
Histologically, MAPs were originally related to the development of the nervous system, based on their very early detection in neurons. However, the aberrant expression of primarily neuronal MAPs has since been detected in non-neural cancer tissues [14]. We also assessed MAP1B expression across various cancer types using Oncomine™ Platform (Thermo Fisher, Ann Arbor, MI). Data revealed a diverse expression of MAP1B in various cancers. Of these, CNS tumor has highest MAP1B expression; bladder tumor has moderate expression. In our present results and using a published transcriptome dataset (GSE31684), we first found that MAP1B was significantly upregulated in UC and associated with more advanced pT status and metastatic disease in UBUC. Next, we found using immunohistochemistry that MAP1B overexpression markedly correlated with disease status in affected patients. In patients with UTUC, MAP1B overexpression was positively associated with synchronous multiple tumors, advanced pathological tumor stage, positive lymph node metastasis, the presence of vascular invasion, and an increased mitotic rate. However, in patients with UBUC, MAP1B overexpression was associated with advanced pathological tumor stage, positive lymph node metastasis, high histological tumor grade, the presence of vascular invasion, and an increased mitotic rate. Furthermore, using survival analysis, we demonstrated an association between MAP1B and aggressive clinical progression, whereby MAP1B overexpression independently predicted poor DSS and MFS rates for all patients with UC. These findings indicate that standard clinical practices may benefit from evaluating the MAP1B status to improve the risk stratification of patients with UC.
Different MAP1B interactors can be grouped into seven different categories, including signaling, cytoskeleton, transmembrane proteins, RNA-binding proteins, apoptosis, neurodegeneration-linked proteins, and neurotransmitter receptors [19]. MAP1B is translated as a precursor polypeptide that undergoes proteolytic processing to cleave into an N-terminal heavy chain (MAP1B HC) and a C-terminal light chain (MAP1B LC1). MAP1B LC1 overexpression, which can generate protein aggregates, has been observed in endoplasmic reticulum-related stress-induced cell apoptosis. This effect is blocked by DJ-1, a Parkinson’s disease–related protein that has been proposed to act like a molecular chaperone, and inhibits α-synuclein aggregation [20]. However, in contrast to the proapoptotic effects caused by LC1 overexpression, MAP1B overexpression is not related to cell death related to p53, a tumor-suppressor gene; in fact, MAP1B overexpression reduces p53 transcriptional activity and inhibits doxorubicin-induced apoptosis [21]. In addition, we found that the percentages of cells in the early and late stages of apoptosis were significantly increased between shLacZ controls and shMAP1B-treated cells. Further in vivo studies are warranted to confirm our findings and to determine whether such results may lead to new therapeutic targets for UC.
Recent studies have found that changes in the expression of MAPs are associated with chemotherapy resistance and cancer progression [14,22]. For example, stathmin plays a role in regulating neuroblastoma cell migration and invasion [22]. Silencing stathmin expression using RNAi gene silencing significantly reduced lung metastasis in neuroblastoma in vivo. Similarly, we demonstrated using UC cell lines with high endogenous MAP1B expression that silencing by MAP1B shRNA significantly reduced cell proliferation, migration, and invasion ability. Based on these findings, we posit that MAP1B may be a clinically valuable diagnostic marker for early cancer detection and a promising prognostic marker.
Further, MAP1B interacts with several other proteins associated with cancer. For example, Ras-association domain family 1 isoform A (RASSF1A), a tumor suppressor whose inactivation is implicated in the development of many human cancers, interacts with MAP1B to influence microtubule dynamics in the cell cycle and is involved in the inhibition of cancer cell growth [23]. Through distinct bifunctional structural domains, C19ORF5, a sequence homolog of MAP1B, mediates the communication between the microtubular cytoskeleton and mitochondria in the control of cell death and defective genome destruction. In addition, it has been proposed that the accumulation of C19ORF5 results in microtubule hyperstability, which may be involved in the tumor suppression activity of RASSF1A [24]. In the mammary cancer susceptibility 1 (Mcs1) region in chromosome 2 (a region that expresses centromeric proteins), Laes et al. analyzed candidate genes in the region and found that MAP1B was expressed in the mammary glands of rats [25]. Interactions with other proteins not related to its role in stabilizing microtubules suggest that MAP1B may be part of a “signaling protein” that regulates molecular pathways [19]. We propose that MAP1B has multiple functions, and whether the main function of MAP1B is microtubule stabilization or whether it has many cellular functions warrants further investigation.
A recent study that focused on kidney glomerular development and function found that MAP1B was specifically expressed in podocytes in human and murine adult kidney tissues [26]. In a mouse model, MAP1B was not essential for glomerular filtration function but may play a role in the development and differentiation of the kidney tubular system. The authors hypothesize that MAP1B may be related to either stress maintenance or the aging process in the kidney. It is clear that the overall effects of MAP1B on UC are complex, with reports of associations between MAP1B and survival and metastasis. Research aimed at decoding the functional consequences of MAP1B and signaling cross-talk with other proteins in different cancers is needed in the future. However, due to a slight predominance toward females, it is unclear if the results can easily be transferred to the rest of the world.

4. Materials and Methods

4.1. Data Mining of GSE31684 to Identify Altered Gene Expression in UC

The transcriptome dataset GSE31684 (http://www.ncbi.nlm.nih.gov/geo/query/acc.cgi?acc=GSE31684), which includes 93 patients with UBUC who underwent radical cystectomy, was obtained from the Gene Expression Omnibus repository at the National Center for Biotechnology Information. Raw data were imported by Nexus Expression 3 (BioDiscovery, EI Segundo, CA, USA) to quantify the gene expression level. No pre-selection or filtering was conducted during the analysis of the data for all probes. Comparative analyses were performed to determine the significant differences in the expressed genes by comparing the primary tumor (pT) status (high-stage to low-stage) and the presence or absence of metastatic events.

4.2. Patients and Tumor Specimens

Between 1996 and 2004, 340 patients with UTUC and 295 with UBUC who underwent surgery with curative intent at the Chi Mei Medical Center were enrolled. This study was reviewed and approved by the institutional review board (105-01-005). Informed patient consent was obtained from all participants. Demographic characteristics and clinical information including pathological features, oncological follow-up, and cause of mortality were retrospectively collected. Patients who underwent neoadjuvant chemotherapy or radiotherapy; who had concurrent muscle-invasive bladder tumor, acute blood disorders, or bone marrow diseases; and those with incomplete clinical information were excluded from our study. The tumor stage was defined in accordance with the 2002 American Joint Committee Cancer (AJCC)’s Tumor, Node, Metastasis system. Two pathologists reviewed tumor tissues and reclassified then as low- or high-grade using the seventh edition of the AJCC staging system. As a rule, all patients were treated initially by surgery with curative intent. All UBUC patients with pT3 or pT4 diseases or with nodal involvement received cisplatin-based adjuvant chemotherapy. However, of the 106 UTUC patients with pT3 or pT4 and nodal positive diseases, only 29 received cisplatin-based adjuvant chemotherapy. One expert pathologist (CFL) re-evaluated the hematoxylin and eosin–stained sections of all cases. To determine the MAP1B transcript level, a pilot batch of 30 UTUC and 30 UBUC snap-frozen tissues with a high tumor percentage (> 70%) was retrieved. Each group included 10 tumor tissues of the pTa stage, 10 of the pT1 stage, and 10 that were muscle-invasive (pT2–pT4).

4.3. Immunohistochemical Staining

Immunohistochemistry was conducted to detect MAP1B protein expression in 340 UTUC and 295 UBUC cases. One representative slide of a tumor with most invasive area was evaluated by two pathologists manually. Tumor tissue slide preparation was performed as described in our previous study [27]. Slides were incubated with the primary antibody against MAP1B (1:100, clone AA6; Millipore, Beverly, MA, USA). We quantified MAP1B protein expression levels by combining the intensity and percentage of immunostaining in the cytoplasm of UC cells to generate an H score using the following equation: H score = ΣPi (i + 1), where Pi is the percentage of stained tumor cells (0–100%) and i represents the intensity of immunoreactivity (0–3+). The resulting scores ranged from 100 to 400 points, where a score of 100 points indicated that 100% of cancer cells were nonreactive and a score of 400 points meant that 100% of the cancer cells examined were strongly immunoreactive (3+).

4.4. Real-Time Reverse-Transcription Polymerase Chain Reaction (RT-PCR) to Assess the Transcription Levels of MAP1B in Cell Lines and UC Samples

We calculated the fold change in MAP1B gene expression of UC tumors relative to that of normal tissues as previously described [27]. We extracted total RNA from cell lines and a pilot batch of cases consisting of 30 UTUCs and 30 UBUCs to quantify the transcription level of MAP1B using real-time RT-PCR. Predesigned TaqMan assay reagents (Applied Biosystems, Waltham, MA, USA) were used to assess the mRNA abundance of MAP1B (Hs00195485_m1) using the ABI StepOnePlus™ system (Applied Biosystems, Waltham, MA, USA), for which POLR2A (Hs01108291_m1) was used as the internal control for normalization.

4.5. Cell Culture

The cell lines RT4, TCCSUP, J82, and HUC were purchased from the American Type Culture Collection (Manassas, VA, USA). The cell lines BFTC 909, and BFTC 905 were obtained from the Food Industry Research and Development Institute (Hsinchu, Taiwan). RTCC1 cells were kindly provided by Professor Lien-Chai Chiang at Kaohsiung Medical University [28]. Short-tandem repeat profiling cell authentication had been performed in all cell lines (Mission Biotech, Taipei, Taiwan).

4.6. RNA Interference

The lentiviral vectors pLKO.1-shLacZ (TRCN0000072223: 5′-TGTTCGCATTATCCGAACCAT-3′) and pLKO.1-shMAP1B (#1, TRCN0000116621: 5′-GCCTGGAATAAACAGCATGTT-3′; #2, TRCN0000290688: 5′- CCCTGACTTAGGAGTTGTATT-3′) were obtained from the Taiwan National RNAi Core Facility (Taipei, Taiwan) and used to establish stable MAP1B-silenced clones of RTCC1 and J82 cell lines using shRNAs against MAP1B (shMAP1B).Viruses were produced by transfecting HEK293 cells with the above three vectors using Lipofectamine 2000 (Thermo Fisher Scientific, Waltham, MA, USA) [29]. For viral infection, 3 × 10⁶ RTCC1 and J82 cells were incubated with 8 mL of lentivirus in the presence of polybrene, followed by puromycin selection of the stable clones of lentivirus-transduced cells.

4.7. Western Blotting

Our previously published western blotting assay procedure was used to evaluate endogenous MAP1B expression and the MAP1B-knockdown efficiency in RTCC1 and J82 cell lines using primary antibodies against MAP1B (1:500, clone AA6; Millipore, Beverly, MA, USA) and glyceraldehyde 3-phosphate dehydrogenase (GADPH) (6C5, 1:10,000; Millipore, Beverly, MA, USA). Cell lysates with 25 μg of protein were separated using a 4% to 12% gradient NuPAGE gel (Invitrogen, Carlsbad, CA, USA), then transferred onto polyvinylidene difluoride membranes (Amersham Biosciences, Buckinghamshire, UK) for the immobilization of proteins. Membranes were incubated with tris-buffered saline containing Tween 20 (TBST) buffer and 5% skimmed milk at room temperature for one hour for blocking, followed by exposure to primary antibodies at 4 °C overnight against MAP1B (1:500, clone AA6; Millipore, Beverly, MA, USA) using GADPH as a loading control (6C5, 1:10,000; Millipore, Beverly, MA, USA). Membranes were incubated with the secondary antibody at room temperature for 1.5 h, and proteins were detected using a chemiluminescence system (Amersham Biosciences, Buckinghamshire, UK).

4.8. Bromodeoxyuridine (BrdU) Assay to Assess DNA Synthesis

DNA synthesis was measured using an enzyme-linked immunosorbent assay (ELISA)-based and colorimetric bromodeoxyuridine (BrdU) assay (Roche Holding AG, Basel, Switzerland). MAP1B-knockdown or shLacA control RTCC1 and J82 cell lines were plated into a 96-well plate at a density of 3000 cells per well. At 24, 48, and 72 h, we measured the amount of DNA synthesis. The labeling medium was removed after three hours of incubation with BrdU at 37 °C under 5% CO2, followed by fixation and a final incubation with an anti-BrdU-POD solution. An ELISA reader (Promega Corp., Madison, WI, USA) was used to measure the absorbance at 450 nm, and the reference was set at an absorbance of 690 nm.

4.9. Pharmacological Assays

The colorimetric 2,3-bis-(2-methoxy-4-nitro-5-sulfophenyl)-2H-tetrazolium-5-carboxanilide (XTT) assay (Sigma-Aldrich, St. Louis, MO, USA) was used to assess cell viability as previously described [30]. Vinblastine sulfate (Hospira UK Ltd., Maidenhead, UK) was obtained and suspended in normal saline. RTCC1 and J82 cells were seeded in 96-well plates at a density of 5 × 10³ cells per well the day before treatment at the indicated time points with vehicle control (0.9% saline) or increasing concentrations of vinblastine sulfate. The length of treatment interval was 72 h. After incubation with XTT reaction mixture for three hours at 37 °C under 5% CO2, the absorbance of the samples was determined using an ELISA reader (Promega Corp., Madison, WI, USA) at 450 nm, with the absorbance set at 630 nm as reference.

4.10. Migration and Invasion Assays

Cell migration assay was performed using Falcon HTS FluoroBlok 24-well inserts (BD Biosciences, Franklin Lakes, NJ, USA) and the cell invasion assay was performed using the 24-well Collagen-based Cell Invasion Assay (Millipore, Beverly, MA, USA). Briefly, we added serum-free medium to rehydrate each insert, then replaced it with a serum-free suspension with equal numbers of cells in the upper chamber, followed by a 12- to 24-h incubation period to allow cells to migrate toward (i.e., invade) the lower chamber, which contained medium with 10% fetal bovine serum. After removal of the noninvading cells in the upper chamber, cells that invaded through the inserts were stained, lysed in extraction buffer, and transferred to 96-well plates for colorimetric readings at 560 nm.

4.11. Flow Cytometry Analysis of Cell-Cycle Kinetics

Stable pools of MAP1B knockdown versus the corresponding shLacZ control of the RTCC1 and J82 cell lines were pelleted and fixed overnight in 75% cold ethanol at −20 °C. The cells were washed twice using cold phosphate-buffered saline with 10 mg/mL of DNase-free RNase. Next, the cells were labeled with 0.05 mg/mL of propidium iodide and analyzed using a NovoCyte flow cytometer (ACEA Biosciences, San Diego, CA, USA) to determine the different proportions of cells at each phase of the cell cycle. Our lower limit of the number of sorted cells after gating out fixation artifacts and cell debris was 104 cells for all experiments.

4.12. Flow Cytometry Analysis of Apoptosis

Cell apoptosis was evaluated by plating RTCC1 and J82 cells (105 cells each) with shLacZ or shMAP1B for 24 h, followed by 15 min of incubation using an Annexin V-FITC kit (BD Biosciences, Franklin Lakes, NJ, USA) that contained propidium iodide. The percentages of cells at late apoptosis were calculated from three independent experiments.

4.13. Mutation Analysis

To explore potential MAP1B mutation in UC, we randomly selected 15 UTUC and 15 UBUC cases (Table S1) with high protein expressions of MAP1B for mutation analysis. Mutation analyses were performed by using an ABI3100 sequencer targeting eight pathogenic point mutations occurring in other cancer types according to the database of COSMIC repository (https://cancer.sanger.ac.uk/cosmic/gene/analysis?ln=HSD11B1#variants). Validated MAP1B mutations and primers sets are shown in Table S2. The PCR amplification started with an initial denaturation step at 95 °C for 15 min, followed by 35 cycles of 95 °C for 30 s, 58 °C for 30 s, and 72 °C for 30 s, and a final extension step at 72 °C for 10 min. Then, these amplicons generated in individual PCR reactions were analyzed by direct sequencing.

4.14. Postoperative Adjuvant Chemotherapy in UBUC

To evaluate the role of MAP1B expression in the response to adjuvant chemotherapy in UBUC patients, an independent cohort containing 70 patients with pT3 or pT4 disease or with nodal involvement received cisplatin-based adjuvant chemotherapy combined with vinblastine and were enrolled for further survival analysis (Table S3).

4.15. Statistical Analyses

The Statistical Package for the Social Sciences version 12.0 software program (IBM Corp., Armonk, NY, USA) was used for all statistical analyses. Differences between categorical parameters were assessed using the chi-squared or Fisher’s exact test. The median H scores of MAP1B immunoreactivity were used as cutoff values to separate UTUC and UBUC into two subgroups of high and low MAP1B expression. Pearson’s chi-squared test was used to compare the association between MAP1B expression and clinicopathological parameters. The Kaplan–Meier method was applied to estimate the effect of MAP1B expression on DSS and MFS. The survival curves were compared using the log-rank test. We used a Cox proportional-hazards model to identify independent predictors for DSS and MFS. In all figure legend, continuous parameters (such as MAP1B transcript expression in Figure 1, mitotic activity in Figure 2, MAP1B mRNA expression, relative proliferation, migration and invasion in Figure 4, apoptosis rate in Figure 6) were assessed using a t-test or Mann–Whitney–Wilcoxon test. Survival analysis (DSS and MFS) were performed using Kaplan-Meier plots and compared by the log-rank test. Statistical significance was set at p < 0.05.

5. Conclusions

In summary, the present study demonstrated that MAP1B overexpression was not only an indicator of unfavorable clinicopathological parameters, but also an independent prognostic factor able to predict poor DSS and MFS rates in patients with UTUC or UBUC. Additional studies must be conducted to elucidate the details of the biological significance of MAP1B and its encoded protein in UC oncogenesis for exploring possible MAP1B-targeted therapy for both kinds of UC.

Supplementary Materials

The following are available online at https://www.mdpi.com/2072-6694/12/3/630/s1, Table S1: Urothelial carcinoma enrolled to explore potential MAP1B mutation, Table S2: MAP1B mutations validated and primer sets, Table S3: Characters of independent UBUC patient cohorts receiving postoperative adjuvant chemotherapy.

Author Contributions

Conceptualization, T.-M.C., S.K.-H.H., W.-J.W., C.-F.L.; Methodology, B.-W.Y.; Formal analysis, T.-C.C.; Data curation, T.-C.C., S.K.-H.H., W.-J.W., C.-F.L.; Writing—original draft preparation, T.-M.C.; Writing—review and editing, C.-N.H.; Supervision, W.-M.L., C.-C.L.; Project administration, C.-F.L. All authors have read and agreed to the published version of the manuscript.

Funding

This study was supported by Kaohsiung Medical University "Aim for the Top Universities,” grant nos. KMU-TP104E31, KMU-TP105G00, KMU-TP105G01, and KMU-TP105G02; the Health and Welfare Surcharge of Tobacco Products, Ministry of Health and Welfare, grant no. MOHW105-TDU-B-212-134007l the Ministry of Science and Technology, grant no. MOST103-2314-B-037-067-MY3; Kaohsiung Medical University Hospital, grant nos. KMUH101-1R47 and KMUH102-2R42. KMU-KI109002 to WM.Li, WJ. Wu and CF. Li.

Acknowledgments

The authors gratefully acknowledge the assistance of all the members in our group and the BioBank of Chi Mei Medical center. The authors would like to thank Enago (www.enago.tw) for the English language review.

Conflicts of Interest

The authors declare no conflict of interest.

References

  1. Torre, L.A.; Bray, F.; Siegel, R.L.; Ferlay, J.; Lortet-Tieulent, J.; Jemal, A. Global cancer statistics, 2012. CA Cancer J. Clin. 2015, 65, 87–108. [Google Scholar] [CrossRef] [PubMed] [Green Version]
  2. Lynch, C.F.; Davila, J.A.; Platz, C.E. Cancer of the urinary bladder. In SEER Survival Monograph: Cancer Survival Among Adults: US SEER Program, 1988–2001, Patient and Tumor Characteristics, National; Ries, Y.J., Keel, G.E., Eisner, M.P., Eds.; Cancer Institute, SEER Program: Bethesda, MD, USA, 2007; pp. 193–202. [Google Scholar]
  3. Margulis, V.; Shariat, S.F.; Matin, S.F.; Kamat, A.M.; Zigeuner, R.; Kikuchi, E.; Lotan, Y.; Weizer, A.; Raman, J.D.; Wood, C.G. Outcomes of radical nephroureterectomy: A series from the Upper Tract Urothelial Carcinoma Collaboration. Cancer 2009, 115, 1224–1233. [Google Scholar] [CrossRef] [PubMed]
  4. Lai, M.N.; Wang, S.M.; Chen, P.C.; Chen, Y.Y.; Wang, J.D. Population-based case-control study of Chinese herbal products containing aristolochic acid and urinary tract cancer risk. J. Natl. Cancer Inst. 2010, 102, 179–186. [Google Scholar] [CrossRef] [Green Version]
  5. Li, C.C.; Chang, T.H.; Wu, W.J.; Ke, H.L.; Huang, S.P.; Tsai, P.C.; Chang, S.J.; Shen, J.T.; Chou, Y.H.; Huang, C.H. Significant predictive factors for prognosis of primary upper urinary tract cancer after radical nephroureterectomy in Taiwanese patients. Eur. Urol. 2008, 54, 1127–1134. [Google Scholar] [CrossRef] [PubMed]
  6. Ploussard, G.; Xylinas, E.; Lotan, Y.; Novara, G.; Margulis, V.; Rouprêt, M.; Matsumoto, K.; Karakiewicz, P.I.; Montorsi, F.; Remzi, M.; et al. Conditional survival after radical nephroureterectomy for upper tract carcinoma. Eur. Urol. 2015, 67, 803–812. [Google Scholar] [CrossRef] [PubMed]
  7. Raman, J.D.; Scherr, D.S. Management of patients with upper urinary tract transitional cell carcinoma. Nat. Clin. Pract. Urol. 2007, 4, 432–443. [Google Scholar] [CrossRef] [PubMed]
  8. Knowles, M.A. What we could do now: Molecular pathology of bladder cancer. Mol. Pathol. 2001, 54, 215–221. [Google Scholar] [CrossRef] [PubMed]
  9. McConkey, D.J.; Lee, S.; Choi, W.; Tran, M.; Majewski, T.; Lee, S.; Siefker-Radtke, A.; Dinney, C.; Czerniak, B. Molecular genetics of bladder cancer: Emerging mechanisms of tumor initiation and progression. Urol. Oncol. 2010, 28, 429–440. [Google Scholar] [CrossRef] [Green Version]
  10. Amin, M.B. Histological variants of urothelial carcinoma: Diagnostic, therapeutic and prognostic implications. Mod. Pathol. 2009, 22 (Suppl. 2), S96–S118. [Google Scholar] [CrossRef]
  11. Zhang, Z.; Furge, K.A.; Yang, X.J.; Teh, B.T.; Hansel, D.E. Comparative gene expression profiling analysis of urothelial carcinoma of the renal pelvis and bladder. BMC Med. Genom. 2010, 3, 58. [Google Scholar] [CrossRef] [Green Version]
  12. Halpain, S.; Dehmelt, L. The MAP1 family of microtubule-associated proteins. Genome Biol. 2006, 76, 224. [Google Scholar] [CrossRef] [PubMed]
  13. Dehmelt, L.; Halpain, S. The MAP2/Tau family of microtubule-associated proteins. Genome Biol. 2005, 6, 204. [Google Scholar] [CrossRef] [PubMed] [Green Version]
  14. Bhat, K.M.; Setaluri, V. Microtubule-associated proteins as targets in cancer chemotherapy. Clin. Cancer Res. 2007, 13, 2849–2854. [Google Scholar] [CrossRef] [PubMed] [Green Version]
  15. Parker, A.L.; Kavallaris, M.; McCarroll, J.A. Microtubules and their role in cellular stress in cancer. Front. Oncol. 2014, 4, 153. [Google Scholar] [CrossRef] [PubMed] [Green Version]
  16. Niegisch, G.; Lorch, A.; Droller, M.J.; Lavery, H.J.; Stensland, K.D.; Albers, P. Neoadjuvant chemotherapy in patients with muscle-invasive bladder cancer: Which patients benefit? Eur. Urol. 2013, 64, 355–357. [Google Scholar] [CrossRef] [PubMed]
  17. Adibi, M.; Youssef, R.; Shariat, S.F.; Lotan, Y.; Wood, C.G.; Sagalowsky, A.I.; Zigeuner, R.; Montorsi, F.; Bolenz, C.; Margulis, V. Oncological outcomes after radical nephroureterectomy for upper tract urothelial carcinoma: Comparison over the three decades. Int. J. Urol. 2012, 19, 1060–1066. [Google Scholar] [CrossRef] [PubMed] [Green Version]
  18. Altmann, K.H. Preclinical Pharmacology and Structure-Activity Studies of Epothilones. In The Epothilones: An Outstanding Family of Anti-Tumor Agents. Fortschritte der Chemie Organischer Naturstoffe/Progress in the Chemistry of Organic Natural Products; Springer: Vienna, Austria, 2009; Volume 90. [Google Scholar] [CrossRef]
  19. Villarroel-Campos, D.; Gonzalez-Billault, C. The MAP1B case: An old MAP that is new again. Dev. Neurobiol. 2014, 74, 953–971. [Google Scholar] [CrossRef]
  20. Wang, Z.; Zhang, Y.; Zhang, S.; Guo, Q.; Tan, Y.; Wang, X.; Xiong, R.; Ding, J.; Chen, S. DJ-1 can inhibit microtubule associated protein 1 B formed aggregates. Mol. Neurodegener. 2011, 6, 38. [Google Scholar] [CrossRef] [Green Version]
  21. Lee, S.Y.; Kim, J.W.; Jeong, M.H.; An, J.H.; Jang, S.M.; Song, K.H.; Choi, K.H. Microtubule-associated protein 1B light chain (MAP1B-LC1) negatively regulates the activity of tumor suppressor p53 in neuroblastoma cells. FEBS Lett. 2008, 582, 2826–2832. [Google Scholar] [CrossRef] [Green Version]
  22. Byrne, F.L.; Yang, L.; Phillips, P.A.; Hansford, L.M.; Fletcher, J.I.; Ormandy, C.J.; McCarroll, J.A.; Kavallaris, M. RNAi-mediated stathmin suppression reduces lung metastasis in an orthotopic neuroblastoma mouse model. Oncogene 2014, 33, 882–890. [Google Scholar] [CrossRef]
  23. Dallol, A.; Agathanggelou, A.; Fenton, S.L.; Ahmed-Choudhury, J.; Hesson, L.; Vos, M.D.; Clark, G.J.; Downward, J.; Maher, E.R.; Latif, F. RASSF1A interacts with microtubule-associated proteins and modulates microtubule dynamics. Cancer Res. 2004, 64, 4112–4116. [Google Scholar] [CrossRef] [Green Version]
  24. Liu, L.; Vo, A.; Liu, G.; McKeehan, W.L. Distinct Structural Domains within C19ORF5 Support Association with Stabilized Microtubules and Mitochondrial Aggregation and Genome Destruction. Cancer Res. 2005, 65, 4191–4201. [Google Scholar] [CrossRef] [PubMed] [Green Version]
  25. Laes, J.F.; Quan, X.; Ravoet, M.; Stieber, D.; Van Vooren, P.; Van Reeth, T.; Szpirer, J.; Szpirer, C. Analysis of candidate genes included in the mammary cancer susceptibility 1 (Mcs1) region. Mamm. Genome 2001, 12, 199–206. [Google Scholar] [CrossRef] [PubMed]
  26. Gödel, M.; Temerinac, D.; Grahammer, F.; Hartleben, B.; Kretz, O.; Riederer, B.M.; Propst, F.; Kohl, S.; Huber, T.B. Microtubule associated protein 1b (MAP1B) is a marker of the microtubular cytoskeleton in podocytes but is not essential for the function of the kidney filtration barrier in mice. PLoS ONE 2015, 10, e0140116. [Google Scholar] [CrossRef] [PubMed] [Green Version]
  27. Fan, E.W.; Li, C.C.; Wu, W.J.; Huang, C.N.; Li, W.M.; Ke, H.L.; Yeh, H.C.; Wu, T.F.; Liang, P.I.; Ma, L.J.; et al. FGF7 Over expression is an independent prognosticator in patients with urothelial carcinoma of the upper urinary tract and bladder. J. Urol. 2015, 194, 223–229. [Google Scholar] [CrossRef] [PubMed]
  28. Chiang, L.C.; Chiang, W.; Chang, L.L.; Wu, W.J.; Huang, C.H. Characterization of a new human transitional cell carcinoma cell line from the renal pelvis, RTCC-1/KMC. Kaohsiung J. Med. Sci. 1996, 12, 448–452. [Google Scholar] [PubMed]
  29. Li, C.F.; Chen, L.T.; Lan, J.; Chou, F.F.; Lin, C.Y.; Chen, Y.Y.; Chen, T.J.; Li, S.H.; Yu, S.; Fang, F.M.; et al. AMACR amplification and overexpression in primary imatinib-naïve gastrointestinal stromal tumors: A driver of cell proliferation indicating adverse prognosis. Oncotarget 2014, 5, 11588–11630. [Google Scholar] [CrossRef] [Green Version]
  30. Li, C.F.; Fang, F.M.; Chen, Y.Y.; Chen, Y.Y.; Liu, T.T.; Chan, T.C.; Yu, S.C.; Chen, L.T.; Huang, H.Y. Overexpressed fatty acid synthase in gastrointestinal stromal tumors: Targeting a progression-associated metabolic driver enhances the antitumor effect of imatinib. Clin. Cancer Res. 2017, 23, 4908–4918. [Google Scholar] [CrossRef] [Green Version]
Figure 1. Analysis of gene expression in urinary bladder urothelial carcinoma (UBUC) using a published transcriptome dataset (GSE31684). (A) Cluster analysis of genes focusing on the GO microtubule bundle formation class (GO:0001578) revealed that MAP1B was one of the most significantly upregulated genes associated with more advanced pT status and metastatic disease. Tissue specimens from cancers with a distinct pT status are illustrated at the top of the heat map, and the expression levels of upregulated and downregulated genes are represented as a continuum of brightness of red or green, respectively. Specimens with no change in messenger RNA (mRNA) expression are shown in black. (B) Kaplan–Meier plots showing the prognostic significance of MAP1B expression for the survival of UBUC. Using a QuantiGene assay, MAP1B mRNA expression was significantly increased in both (C) upper tract urothelial carcinoma (UTUC) and (D) UBUC at advanced primary pT stages.
Cancers 12 00630 g001
Figure 2. Representative sections of MAP1B immunostaining. Note the stepwise increments in MAP1B immunoreactivity from the nontumoral urothelial epithelium (inlet) and (A) noninvasive papillary UCs to (B) non–muscle-invasive (pT1), and (C) muscle-invasive (pT2–pT4) UCs. A comparison of mitotic activity showed significantly higher mitotic rates in (D) UTUC and (E) UBUC cells with increased MAP1B expression than in cells with low expression.
Cancers 12 00630 g002
Figure 3. Kaplan–Meier survival analysis showing the prognostic significance of MAP1B expression for the DSS and MFS outcomes of UTUC (A and B) and UBUC (C and D).
Cancers 12 00630 g003
Figure 4. MAP1B expression promotes the growth of UC cells in vitro. (A) As compared with RT4 cells, endogenous MAP1B mRNA (upper) and protein (lower) expressions were increased in cells from the J82 and RTCC1 cell lines. (B) The two cell lines with high endogenous MAP1B expression were stably silenced against MAP1B expression by a lentiviral vector bearing one of the two clones of MAP1B shRNA with different sequences for both RTCC1 (left panel) and J82 (right panel) cells. Using an ELISA-based colorimetric assay to assess the rate of BrdU uptake, cell proliferation was significantly reduced in stable MAP1B-knockdown (C1) RTCC1 and (C2) J82 cell lines compared with that in the corresponding shLacZ controls. Similar trends were found for cell migration and invasion among cells from the (C3 and C5) RTCC1 and (C4 and C6) J82 cell lines. (* p<0.05). More details of western blot, please view at the supplementary materials.
Cancers 12 00630 g004
Figure 5. Stable MAP1B knockdown increases the sub-G1 population with significantly altered cell-cycle progression. Cell-cycle analysis as conducted by flow cytometry identified a remarkable increment of sub-G1 population indicating cell death in MAP1B-knockdown RTCC1 (upper panel) and J82 (lower panel) cells.
Cancers 12 00630 g005
Figure 6. MAP1B knockdown induces apoptosis. Flow cytometric analysis of annexin V/propidium iodide-stained RTCC1 (upper panel) and J82 (lower panel) cell lines disclosed MAP1B knockdown significantly increased percentage of apoptosis. (* p < 0.05).
Cancers 12 00630 g006
Figure 7. Stable MAP1B knockdown increased vinblastine-induced apoptosis. Flow cytometric analysis of vinblastine-treated RTCC1 (upper panel) and J82 (lower panel) cell lines disclosed that MAP1B knockdown significantly increased the sub-G1 population, indicating induced cell apoptosis.
Cancers 12 00630 g007
Figure 8. Stable MAP1B knockdown increase vinblastine-induced apoptosis. Flow cytometric analysis of annexin V/propidium iodide-stained RTCC1 (upper panel) and J82 (lower panel) cell lines demonstrated MAP1B knockdown significantly increased percentage of vinblastine-induced apoptosis. (* p < 0.05).
Cancers 12 00630 g008
Figure 9. Kaplan–Meier survival analysis of MAP1B expression for the DFS of the UBUC patient cohort receiving adjuvant chemotherapy. Kaplan–Meier survival analysis showing the prognostic significance of MAP1B expression for the DFS of the UBUC patient cohort receiving adjuvant chemotherapy.
Cancers 12 00630 g009
Table 1. Summary of differentially expressed genes associated with microtubule bundle formation (GO: 0001578) and showing positive associations to cancer invasiveness and metastasis in the transcriptome of UBUC (GSE31684).
Probe Title 1Comparing T2-4 to Ta-T1Comparing Meta. to Non-Meta. #Gene SymbolGene TitleBiological ProcessMolecular Function
Log ratiop-ValueLog ratiop-Value
214577_at0.37730.00290.3943<0.0001MAP1BMicrotubule-associated protein 1BDendrite development, microtubule bundle formationProtein binding, structural molecule activity
221560_at−0.34360.0058−0.01150.9048MARK4MAP/microtubule affinity-regulating kinase 4G1/S transition of mitotic cell cycle, G2/M transition of mitotic cell cycle, Wnt receptor signaling pathway, microtubule bundle formation, microtubule cytoskeleton organization and biogenesis, nervous system development, positive regulation of cell proliferation, positive regulation of programmed cell death, protein amino acid phosphorylationATP binding, gamma-tubulin binding, kinase activity, microtubule-binding, nucleotide-binding, protein-binding, protein kinase activity, protein serine/threonine kinase activity, protein-tyrosine kinase activity, tau-protein kinase activity, transferase activity, ubiquitin-binding
226084_at1.2832<0.00010.9436<0.0001MAP1BMicrotubule-associated protein 1BDendrite development, microtubule bundle formationProtein-binding, structural molecule activity
#, Meta., distal metastasis developed during follow-up; Non-Meta.: no metastatic event developed.
Table 2. Correlations between MAP1B expression and other important clinicopathological parameters in UCs.
ParameterCategoryUpper Urinary Tract Urothelial CarcinomaUrinary Bladder Urothelial Carcinoma
Case no.MAP1B Expressionp-valueCase no.MAP1B Expressionp-value
LowHighLowHigh
Gender &Male15879791.0002161031130.223
Female1829191 794435
Age (years) # 34065.2+/−9.8765.9+/−9.920.40929565.76+/−12.0266.33+/−12.440.759
Tumor locationRenal pelvis14164770.023 *----
Ureter1508763 ----
Renal pelvis & ureter491930 ----
Multifocality&Single2781441340.160----
Multifocal622636 ----
Primary tumor (T) &Ta8954350.005 *845628<0.001 *
T1925`41 884543
T21596594 1234677
Nodal metastasis &Negative (N0)3121641480.002 *2661391270.012 *
Positive (N1–N2)28622 29821
Histological grade &Low grade5634220.0795636200.016 *
High grade284136148 239111128
Vascular invasion &Absent234132102<0.001 *2461291170.045 *
Present1063868 491831
Perineural invasion &Absent3211621590.4792751401350.169
Present19811 20713
&, Chi-squared test; #, Mann–Whitney U test; * Statistically significant.
Table 3. Univariate log-rank and multivariate analyses for DSS and MFS in UTUC.
ParameterCategoryCase No.Disease-Specific SurvivalMetastasis-Free Survival
Univariate AnalysisMultivariate AnalysisUnivariate AnalysisMultivariate Analysis
No. of Eventp-valueR.R.95% C.I.p-valueNo. of Eventp-valueR.R.95% C.I.p-value
GenderMale158280.8730---320.8307---
Female18233 ---38 ---
Age (years)<65138260.9728---300.8667---
≥6520235 ---40 ---
Tumor sideRight177340.7188---380.3903---
Left15426 ---32 ---
Bilateral91 ---0 ---
Tumor locationRenal pelvis141240.0100 *1-0.562310.0752---
Ureter15022 1.1670.618–2.203 25 ---
Renal pelvis & ureter4915 1.2610.345–4.615 14 --
MultifocalitySingle273480.0031 *1-0.050 *520.0144 *1-0.001 *
Multifocal6218 2.2380.998–5.017 18 2.6481.496–4.687
Primary tumor (T)Ta892<0.0001 *1-0.008 *4<0.0001 *1-0.036 *
T1929 2.6410.561–12.419 15 2.6430.563–12.410
T2–T415950 5.6671.250–25.699 51 5.5381.236–24.817
Nodal metastasisNegative (N0)31242<0.0001 *1-<0.001 *55<0.0001 *1-<0.001 *
Positive (N1–N2)2819 4.1882.244–7.819 15 4.4212.415–8.094
Histological gradeLow5640.0177 *1-0.008 *30.0022 *1-0.008 *
High28457 4.7461.514–14.881 67 4.7701.509–15.077
Vascular invasionAbsent23424<0.0001 *1-0.13926<0.0001 *1-0.147
Present10637 1.5710.863–2.859 44 1.5650.855–2.868
Perineural invasionAbsent32150<0.0001 *1-<0.001 *61<0.0001 *1-<0.001 *
Present1911 4.7682.251–10.102-9 4.8652.294–10.318
Mitotic rate (per 10 high power fields)<10173270.1442---300.0739---
≥1016734 ---40 ---
MAP1B expressionLow17011<0.0001 *1-0.001 *17<0.0001 *1-<0.001 *
High17050 4.1152.077–8.154 53 3.9622.022–7.763
* Statistically significant.
Table 4. Univariate log-rank and multivariate analyses for DSS and MFS in UBUC.
ParameterCategoryCase No.Disease-Specific SurvivalMetastasis-Free Survival
Univariate AnalysisMultivariate AnalysisUnivariate AnalysisMultivariate Analysis
No. of Eventp-valueR.R.95% C.I.p-valueNo. of Eventp-valueR.R.95% C.I.p-value
GenderMale216410.4404---600.2786---
Female7911 ---16 ---
Age (years)<65121170.1010---310.6285---
≥6517435 ---45
Primary tumor (T)Ta841<0.0001 *1-<0.001 *4<0.0001 *1-<0.001 *
T1889 6.4930.696–60.560 23 5.0441.469–17.327
T2–T412342 27.7833.011–256.370 49 7.8452.239–27.484
Nodal metastasisNegative (N0)266410.0001 *1-0.72961<0.0001 *1-0.100
Positive (N1–N2)2911 1.1320.560–2.288 15 1.6850.905–3.137
Histological gradeLow grade5620.0010 *1-0.71450.0005*1-0.572
High grade23950 0.7440.153–3.610 71 0.7290.244–2.179
Vascular invasionAbsent246370.0017 *1-0.174540.0001 *1-0.798
Present4915 0.6240.316–1.231 22 1.0830.590–1.985
Perineural invasionAbsent27544<0.0001 *1-0.099660.0006 *1-0.339
Present208 2.9900.878–4.510 10 1.4220.690–2.930
Mitotic rate (per 10 high power fields)<1013912<0.0001 *1-0.021 *23<0.0001 *1-0.045 *
≥1015640 2.1841.124–4.246 53 1.6971.012–2.846
MAP1B expressionLow1477<0.0001 *1-<0.001 *16<0.0001 *1-<0.001 *
High14845 5.5512.466–12.498 60 3.7702.146–6.622
* Statistically significant.

