Multi-Reader Multi-Case Study for Performance Evaluation of High-Risk Thyroid Ultrasound with Computer-Aided Detection

 , and
, and
Abstract
1. Introduction
2. Materials and Methods
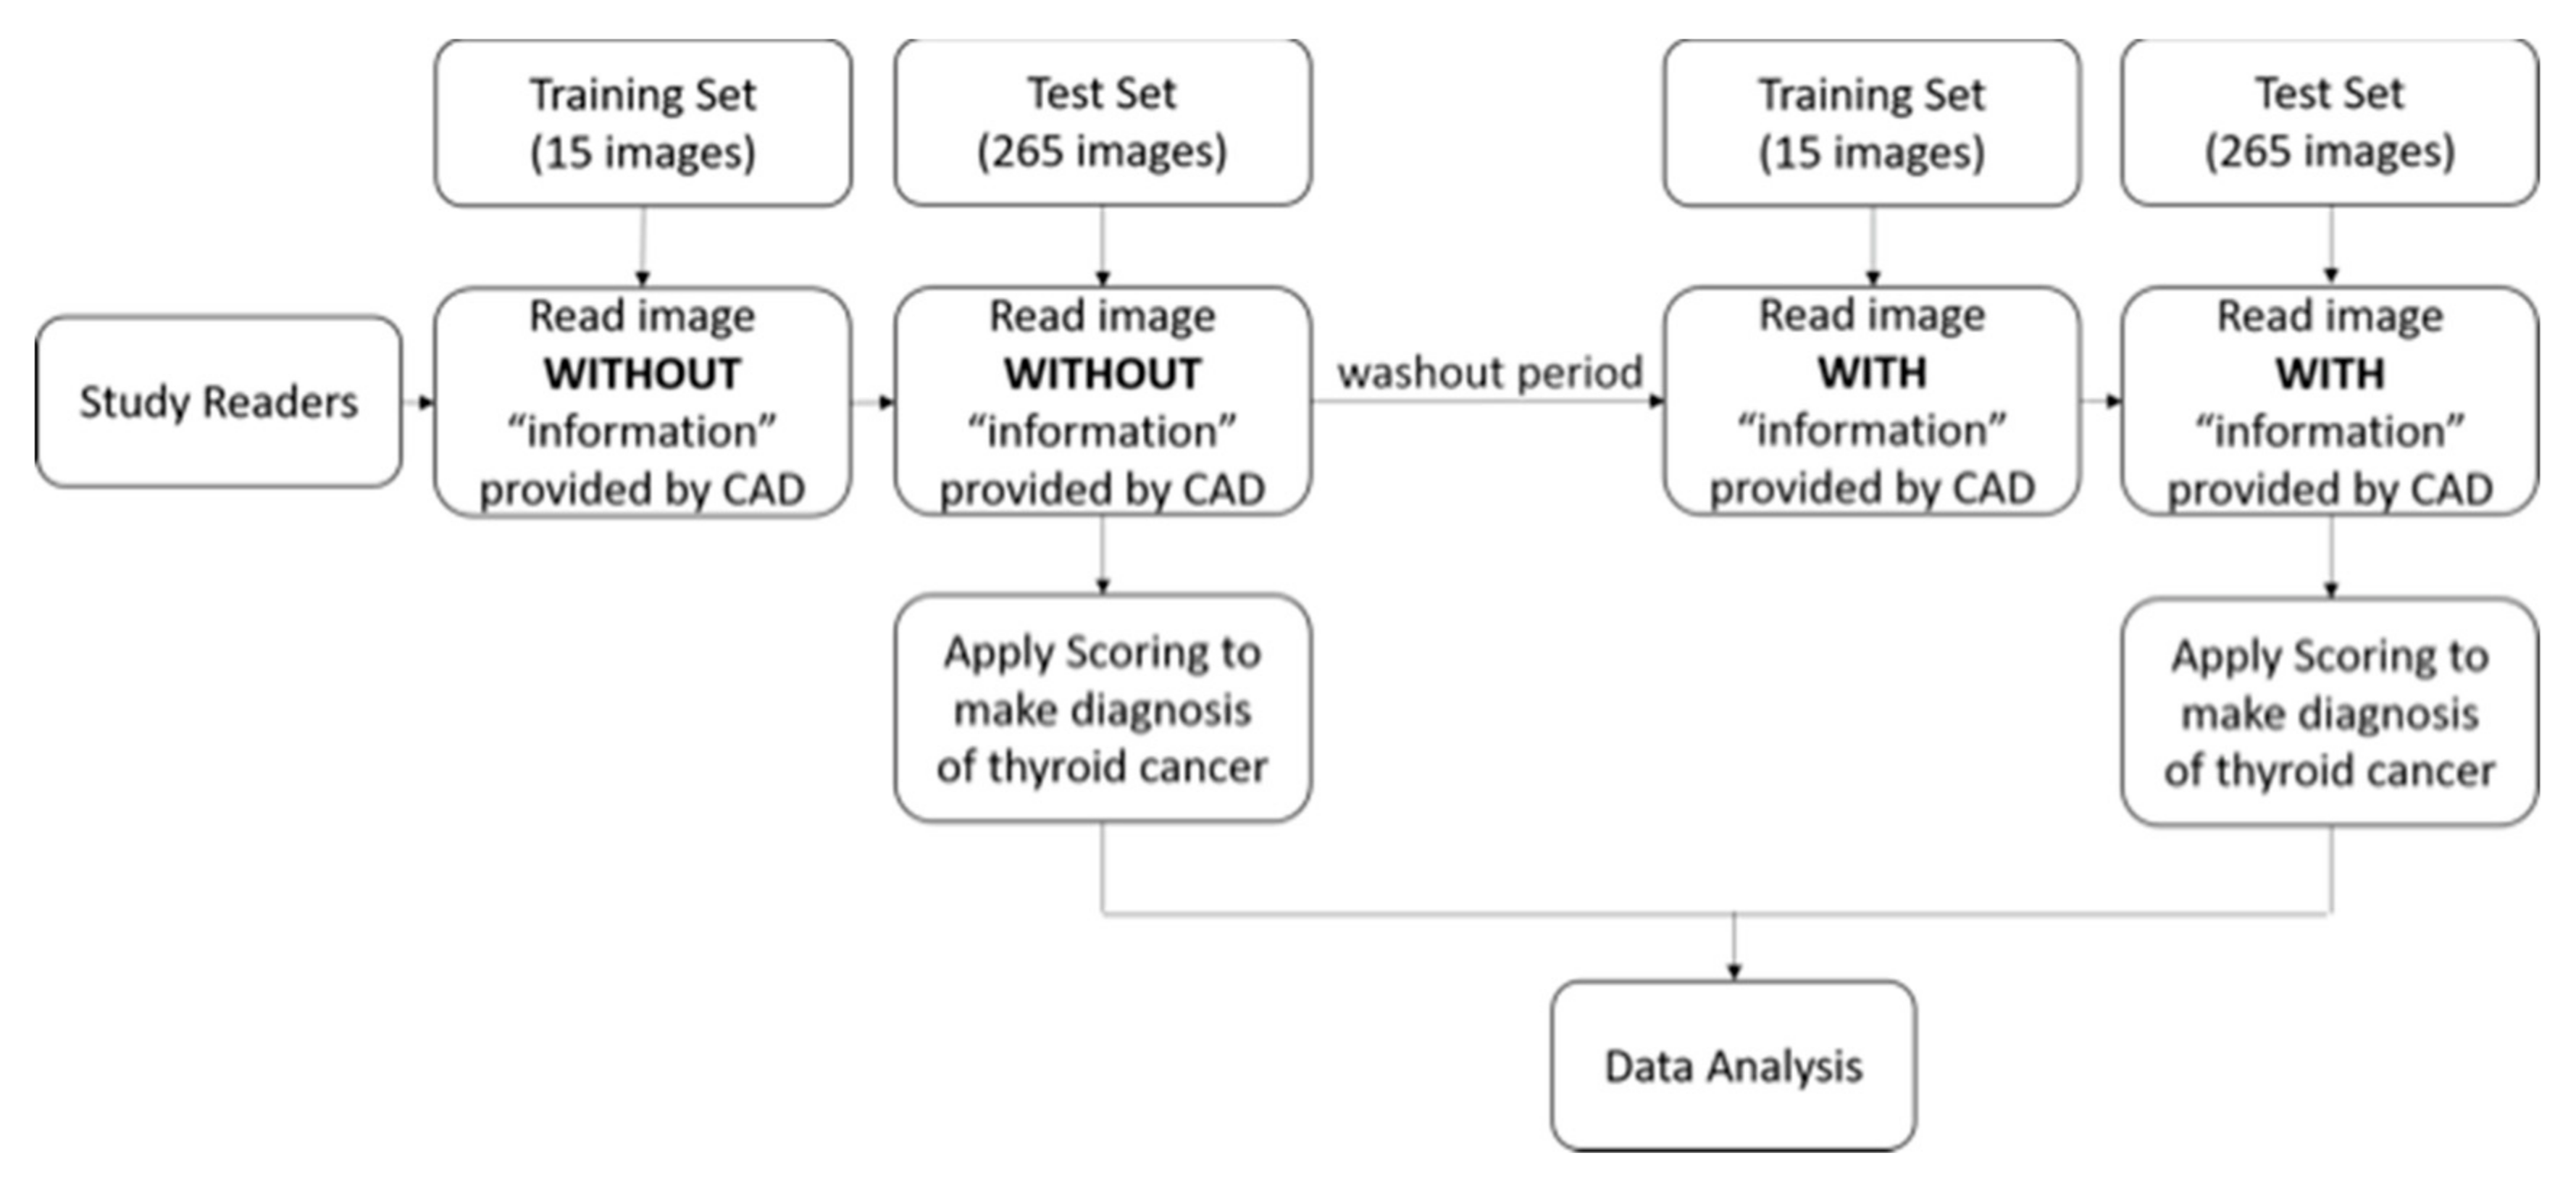
2.1. Study Design
2.2. Analysis
3. Results
3.1. Quality of CAD Nodule Segmentation
3.2. Performance of Observers Without and With CAD
3.3. Interobserver Variability Analysis
3.4. Observer Performance: Sensitivity and Specificity
4. Discussion
5. Conclusions
Author Contributions
Funding
Acknowledgments
Conflicts of Interest
References
- American Thyroid Association Guidelines Taskforce on Thyroid Nodules and Differentiated Thyroid Cancer; Cooper, D.S.; Doherty, G.M.; Haugen, B.R.; Kloos, R.T.; Lee, S.L.; Mandel, S.J.; Mazzaferri, E.L.; McIver, B.; Pacini, F.; et al. Revised American Thyroid Association management guidelines for patients with thyroid nodules and differentiated thyroid cancer. Thyroid 2009, 19, 1167–1214. [Google Scholar] [CrossRef] [PubMed]
- Rau, J.V.; Fosca, M.; Graziani, V.; Taffon, C.; Rocchia, M.; Caricato, M.; Pozzilli, P.; Onetti Muda, A.; Crescenzi, A. Proof-of-concept Raman spectroscopy study aimed to differentiate thyroid follicular patterned lesions. Sci. Rep. 2017, 7, 14970. [Google Scholar] [CrossRef] [PubMed]
- Duraipandian, S.; Zheng, W.; Ng, J.; Low, J.J.; Ilancheran, A.; Huang, Z. Near-infrared-excited confocal Raman spectroscopy advances in vivo diagnosis of cervical precancer. J. Biomed. Opt. 2013, 18, 067007. [Google Scholar] [CrossRef][Green Version]
- Depciuch, J.; Stanek-Widera, A.; Skrzypiec, D.; Lange, D.; Biskup-Fruzynska, M.; Kiper, K.; Stanek-Tarkowska, J.; Kula, M.; Cebulski, J. Spectroscopic identification of benign (follicular adenoma) and cancerous lesions (follicular thyroid carcinoma) in thyroid tissues. J. Pharm. Biomed. Anal. 2019, 170, 321–326. [Google Scholar] [CrossRef] [PubMed]
- Gharib, H.; Papini, E.; Paschke, R.; Duick, D.S.; Valcavi, R.; Hegedus, L.; Vitti, P.; AACE/AME/ETA Task Force on Thyroid Nodules. American Association of Clinical Endocrinologists, Associazione Medici Endocrinologi, and European Thyroid Association medical guidelines for clinical practice for the diagnosis and management of thyroid nodules: Executive summary of recommendations. J. Endocrinol. Investig. 2010, 33, 51–56. [Google Scholar] [CrossRef] [PubMed]
- Haugen, B.R.; Alexander, E.K.; Bible, K.C.; Doherty, G.M.; Mandel, S.J.; Nikiforov, Y.E.; Pacini, F.; Randolph, G.W.; Sawka, A.M.; Schlumberger, M.; et al. 2015 American Thyroid Association Management Guidelines for Adult Patients with Thyroid Nodules and Differentiated Thyroid Cancer: The American Thyroid Association Guidelines Task Force on Thyroid Nodules and Differentiated Thyroid Cancer. Thyroid 2016, 26, 1–133. [Google Scholar] [CrossRef]
- Peccin, S.; de Castsro, J.A.; Furlanetto, T.W.; Furtado, A.P.; Brasil, B.A.; Czepielewski, M.A. Ultrasonography: Is it useful in the diagnosis of cancer in thyroid nodules? J. Endocrinol. Investig. 2002, 25, 39–43. [Google Scholar] [CrossRef]
- Wienke, J.R.; Chong, W.K.; Fielding, J.R.; Zou, K.H.; Mittelstaedt, C.A. Sonographic features of benign thyroid nodules: Interobserver reliability and overlap with malignancy. J. Ultrasound Med. 2003, 22, 1027–1031. [Google Scholar] [CrossRef]
- Iannuccilli, J.D.; Cronan, J.J.; Monchik, J.M. Risk for malignancy of thyroid nodules as assessed by sonographic criteria: The need for biopsy. J. Ultrasound Med. 2004, 23, 1455–1464. [Google Scholar] [CrossRef]
- Frates, M.C.; Benson, C.B.; Charboneau, J.W.; Cibas, E.S.; Clark, O.H.; Coleman, B.G.; Cronan, J.J.; Doubilet, P.M.; Evans, D.B.; Goellner, J.R.; et al. Management of thyroid nodules detected at US: Society of Radiologists in Ultrasound consensus conference statement. Radiology 2005, 237, 794–800. [Google Scholar] [CrossRef]
- Frates, M.C.; Benson, C.B.; Doubilet, P.M.; Kunreuther, E.; Contreras, M.; Cibas, E.S.; Orcutt, J.; Moore, F.D., Jr.; Larsen, P.R.; Marqusee, E.; et al. Prevalence and distribution of carcinoma in patients with solitary and multiple thyroid nodules on sonography. J. Clin. Endocrinol. Metab. 2006, 91, 3411–3417. [Google Scholar] [CrossRef] [PubMed]
- Tessler, F.N.; Middleton, W.D.; Grant, E.G.; Hoang, J.K.; Berland, L.L.; Teefey, S.A.; Cronan, J.J.; Beland, M.D.; Desser, T.S.; Frates, M.C.; et al. ACR Thyroid Imaging, Reporting and Data System (TI-RADS): White Paper of the ACR TI-RADS Committee. J. Am. Coll. Radiol. 2017, 14, 587–595. [Google Scholar] [CrossRef] [PubMed]
- Slapa, R.Z.; Slowinska-Srzednicka, J.; Szopinski, K.T.; Jakubowski, W. Gray-scale three-dimensional sonography of thyroid nodules: Feasibility of the method and preliminary studies. Eur. Radiol. 2006, 16, 428–436. [Google Scholar] [CrossRef]
- Park, S.H.; Kim, S.J.; Kim, E.K.; Kim, M.J.; Son, E.J.; Kwak, J.Y. Interobserver agreement in assessing the sonographic and elastographic features of malignant thyroid nodules. Am. J. Roentgenol. 2009, 193, W416–W423. [Google Scholar] [CrossRef] [PubMed]
- Choi, S.H.; Kim, E.K.; Kwak, J.Y.; Kim, M.J.; Son, E.J. Interobserver and intraobserver variations in ultrasound assessment of thyroid nodules. Thyroid 2010, 20, 167–172. [Google Scholar] [CrossRef] [PubMed]
- Park, C.S.; Kim, S.H.; Jung, S.L.; Kang, B.J.; Kim, J.Y.; Choi, J.J.; Sung, M.S.; Yim, H.W.; Jeong, S.H. Observer variability in the sonographic evaluation of thyroid nodules. J. Clin. Ultrasound 2010, 38, 287–293. [Google Scholar] [CrossRef]
- Kim, H.G.; Kwak, J.Y.; Kim, E.K.; Choi, S.H.; Moon, H.J. Man to man training: Can it help improve the diagnostic performances and interobserver variabilities of thyroid ultrasonography in residents? Eur. J. Radiol. 2012, 81, e352–356. [Google Scholar] [CrossRef]
- Hoang, J.K.; Middleton, W.D.; Farjat, A.E.; Teefey, S.A.; Abinanti, N.; Boschini, F.J.; Bronner, A.J.; Dahiya, N.; Hertzberg, B.S.; Newman, J.R.; et al. Interobserver Variability of Sonographic Features Used in the American College of Radiology Thyroid Imaging Reporting and Data System. Am. J. Roentgenol. 2018, 211, 162–167. [Google Scholar] [CrossRef] [PubMed]
- Tee, Y.Y.; Lowe, A.J.; Brand, C.A.; Judson, R.T. Fine-needle aspiration may miss a third of all malignancy in palpable thyroid nodules: A comprehensive literature review. Ann. Surg. 2007, 246, 714–720. [Google Scholar] [CrossRef]
- Grani, G.; Lamartina, L.; Cantisani, V.; Maranghi, M.; Lucia, P.; Durante, C. Interobserver agreement of various thyroid imaging reporting and data systems. Endocr Connect 2018, 7, 1–7. [Google Scholar] [CrossRef]
- Chen, K.Y.; Chen, C.N.; Wu, M.H.; Ho, M.C.; Tai, H.C.; Huang, W.C.; Chung, Y.C.; Chen, A.; Chang, K.J. Computerized detection and quantification of microcalcifications in thyroid nodules. Ultrasound Med. Biol. 2011, 37, 870–878. [Google Scholar] [CrossRef] [PubMed]
- Wu, M.H.; Chen, C.N.; Chen, K.Y.; Ho, M.C.; Tai, H.C.; Chung, Y.C.; Lo, C.P.; Chen, A.; Chang, K.J. Quantitative analysis of dynamic power Doppler sonograms for patients with thyroid nodules. Ultrasound Med. Biol. 2013, 39, 1543–1551. [Google Scholar] [CrossRef] [PubMed]
- Chen, K.Y.; Chen, C.N.; Wu, M.H.; Ho, M.C.; Tai, H.C.; Kuo, W.H.; Huang, W.C.; Wang, Y.H.; Chen, A.; Chang, K.J. Computerized quantification of ultrasonic heterogeneity in thyroid nodules. Ultrasound Med. Biol. 2014, 40, 2581–2589. [Google Scholar] [CrossRef] [PubMed]
- Wu, M.H.; Chen, C.N.; Chen, K.Y.; Ho, M.C.; Tai, H.C.; Wang, Y.H.; Chen, A.; Chang, K.J. Quantitative analysis of echogenicity for patients with thyroid nodules. Sci. Rep. 2016, 6, 35632. [Google Scholar] [CrossRef]
- Hillis, S.L.; Berbaum, K.S. Power estimation for the Dorfman-Berbaum-Metz method. Acad. Radiol. 2004, 11, 1260–1273. [Google Scholar] [CrossRef]
- Cesana, B.M.; Antonelli, P.; Chiumello, D. Statistical methods for evidence-based medicine: The diagnostic test. Part I. Minerva Anestesiol. 2008, 74, 431–437. [Google Scholar] [PubMed]
- Wong, K.T.; Ahuja, A.T. Ultrasound of thyroid cancer. Cancer Imaging 2005, 5, 157–166. [Google Scholar] [CrossRef]
- Frates, M.C.; Benson, C.B.; Charboneau, J.W.; Cibas, E.S.; Clark, O.H.; Coleman, B.G.; Cronan, J.J.; Doubilet, P.M.; Evans, D.B.; Goellner, J.R.; et al. Management of thyroid nodules detected at US: Society of Radiologists in Ultrasound consensus conference statement. Ultrasound Q. 2006, 22. [Google Scholar] [CrossRef]
- Yuan, W.H.; Chiou, H.J.; Chou, Y.H.; Hsu, H.C.; Tiu, C.M.; Cheng, C.Y.; Lee, C.H. Gray-scale and color Doppler ultrasonographic manifestations of papillary thyroid carcinoma: Analysis of 51 cases. Clin. Imaging 2006, 30, 394–401. [Google Scholar] [CrossRef]
- Cappelli, C.; Castellano, M.; Pirola, I.; Cumetti, D.; Agosti, B.; Gandossi, E.; Agabiti Rosei, E. The predictive value of ultrasound findings in the management of thyroid nodules. Mon. J. Assoc. Physicians 2007, 100, 29–35. [Google Scholar] [CrossRef]
- Bonavita, J.A.; Mayo, J.; Babb, J.; Bennett, G.; Oweity, T.; Macari, M.; Yee, J. Pattern recognition of benign nodules at ultrasound of the thyroid: Which nodules can be left alone? Am. J. Roentgenol. 2009, 193, 207–213. [Google Scholar] [CrossRef] [PubMed]
- Kwong, N.; Medici, M.; Angell, T.E.; Liu, X.; Marqusee, E.; Cibas, E.S.; Krane, J.F.; Barletta, J.A.; Kim, M.I.; Larsen, P.R.; et al. The Influence of Patient Age on Thyroid Nodule Formation, Multinodularity, and Thyroid Cancer Risk. J. Clin. Endocrinol. Metab. 2015, 100, 4434–4440. [Google Scholar] [CrossRef] [PubMed]
- Beiden, S.V.; Wagner, R.F.; Doi, K.; Nishikawa, R.M.; Freedman, M.; Lo, S.C.; Xu, X.W. Independent versus sequential reading in ROC studies of computer-assist modalities: Analysis of components of variance. Acad. Radiol. 2002, 9, 1036–1043. [Google Scholar] [CrossRef]
- Horsch, K.; Giger, M.L.; Vyborny, C.J.; Venta, L.A. Performance of computer-aided diagnosis in the interpretation of lesions on breast sonography. Acad. Radiol. 2004, 11, 272–280. [Google Scholar] [CrossRef]
- Van Riel, S.J.; Ciompi, F.; Winkler Wille, M.M.; Dirksen, A.; Lam, S.; Scholten, E.T.; Rossi, S.E.; Sverzellati, N.; Naqibullah, M.; Wittenberg, R.; et al. Malignancy risk estimation of pulmonary nodules in screening CTs: Comparison between a computer model and human observers. PLoS ONE 2017, 12, e0185032. [Google Scholar] [CrossRef]
- Choi, Y.J.; Baek, J.H.; Park, H.S.; Shim, W.H.; Kim, T.Y.; Shong, Y.K.; Lee, J.H. A Computer-Aided Diagnosis System Using Artificial Intelligence for the Diagnosis and Characterization of Thyroid Nodules on Ultrasound: Initial Clinical Assessment. Thyroid 2017, 27, 546–552. [Google Scholar] [CrossRef]
- Roe, C.A.; Metz, C.E. Dorfman-Berbaum-Metz method for statistical analysis of multireader, multimodality receiver operating characteristic data: Validation with computer simulation. Acad. Radiol. 1997, 4, 298–303. [Google Scholar] [CrossRef]
- Shin, J.H.; Baek, J.H.; Chung, J.; Ha, E.J.; Kim, J.H.; Lee, Y.H.; Lim, H.K.; Moon, W.J.; Na, D.G.; Park, J.S.; et al. Ultrasonography Diagnosis and Imaging-Based Management of Thyroid Nodules: Revised Korean Society of Thyroid Radiology Consensus Statement and Recommendations. Korean J. Radiol. 2016, 17, 370–395. [Google Scholar] [CrossRef]
- Brauer, V.F.; Eder, P.; Miehle, K.; Wiesner, T.D.; Hasenclever, H.; Paschke, R. Interobserver variation for ultrasound determination of thyroid nodule volumes. Thyroid 2005, 15, 1169–1175. [Google Scholar] [CrossRef]
- Moon, W.J.; Jung, S.L.; Lee, J.H.; Na, D.G.; Baek, J.H.; Lee, Y.H.; Kim, J.; Kim, H.S.; Byun, J.S.; Lee, D.H.; et al. Benign and malignant thyroid nodules: US differentiation--multicenter retrospective study. Radiology 2008, 247, 762–770. [Google Scholar] [CrossRef]
- Jeong, E.Y.; Kim, H.L.; Ha, E.J.; Park, S.Y.; Cho, Y.J.; Han, M. Computer-aided diagnosis system for thyroid nodules on ultrasonography: Diagnostic performance and reproducibility based on the experience level of operators. Eur. Radiol. 2018. [Google Scholar] [CrossRef] [PubMed]
- De Hoop, B.; Gietema, H.; van Ginneken, B.; Zanen, P.; Groenewegen, G.; Prokop, M. A comparison of six software packages for evaluation of solid lung nodules using semi-automated volumetry: What is the minimum increase in size to detect growth in repeated CT examinations. Eur. Radiol. 2009, 19, 800–808. [Google Scholar] [CrossRef] [PubMed]
- Kim, H.; Park, C.M.; Lee, S.M.; Lee, H.J.; Goo, J.M. A comparison of two commercial volumetry software programs in the analysis of pulmonary ground-glass nodules: Segmentation capability and measurement accuracy. Korean J. Radiol. 2013, 14, 683–691. [Google Scholar] [CrossRef] [PubMed]


| No. of Matches | Excellent (%) | Satisfactory (%) | Poor (%) |
|---|---|---|---|
| All | 67 (25.3%) | 156 (58.9%) | 42 (15.8%) |
| Benign | 37 (22.4%) | 98 (59.4%) | 30 (18.2%) |
| Malignancy | 30 (30%) | 58 (58%) | 12 (12%) |
| p-value * | 0.006 | ||
| Reader ID | AUROC | p-Value | |
|---|---|---|---|
| Without CAD | With CAD | ||
| Reader 1 | 0.703 | 0.776 | 0.0233 |
| Reader 2 | 0.728 | 0.814 | 0.0004 |
| Reader 3 | 0.617 | 0.695 | 0.5538 |
| Reader 4 | 0.706 | 0.765 | 0.1471 |
| Reader 5 | 0.673 | 0.825 | <0.0001 |
| Reader 6 | 0.777 | 0.820 | 0.1737 |
| Reader 7 | 0.793 | 0.815 | 0.2197 |
| Reader 8 | 0.766 | 0.774 | 0.7525 |
| Reader 9 | 0.715 | 0.819 | 0.0001 |
| Reader 10 | 0.771 | 0.809 | 0.1209 |
| Reader 11 | 0.734 | 0.817 | 0.0021 |
| Reader 12 | 0.741 | 0.773 | 0.2704 |
| Reader 13 | 0.753 | 0.804 | 0.0664 |
| Reader 14 | 0.757 | 0.767 | 0.7296 |
| Reader 15 | 0.773 | 0.824 | 0.1045 |
| Reader 16 | 0.742 | 0.793 | 0.0326 |
| Reader 17 | 0.677 | 0.741 | 0.2194 |
| Reader 18 | 0.639 | 0.807 | <0.0001 |
| Reader 19 | 0.763 | 0.820 | 0.0249 |
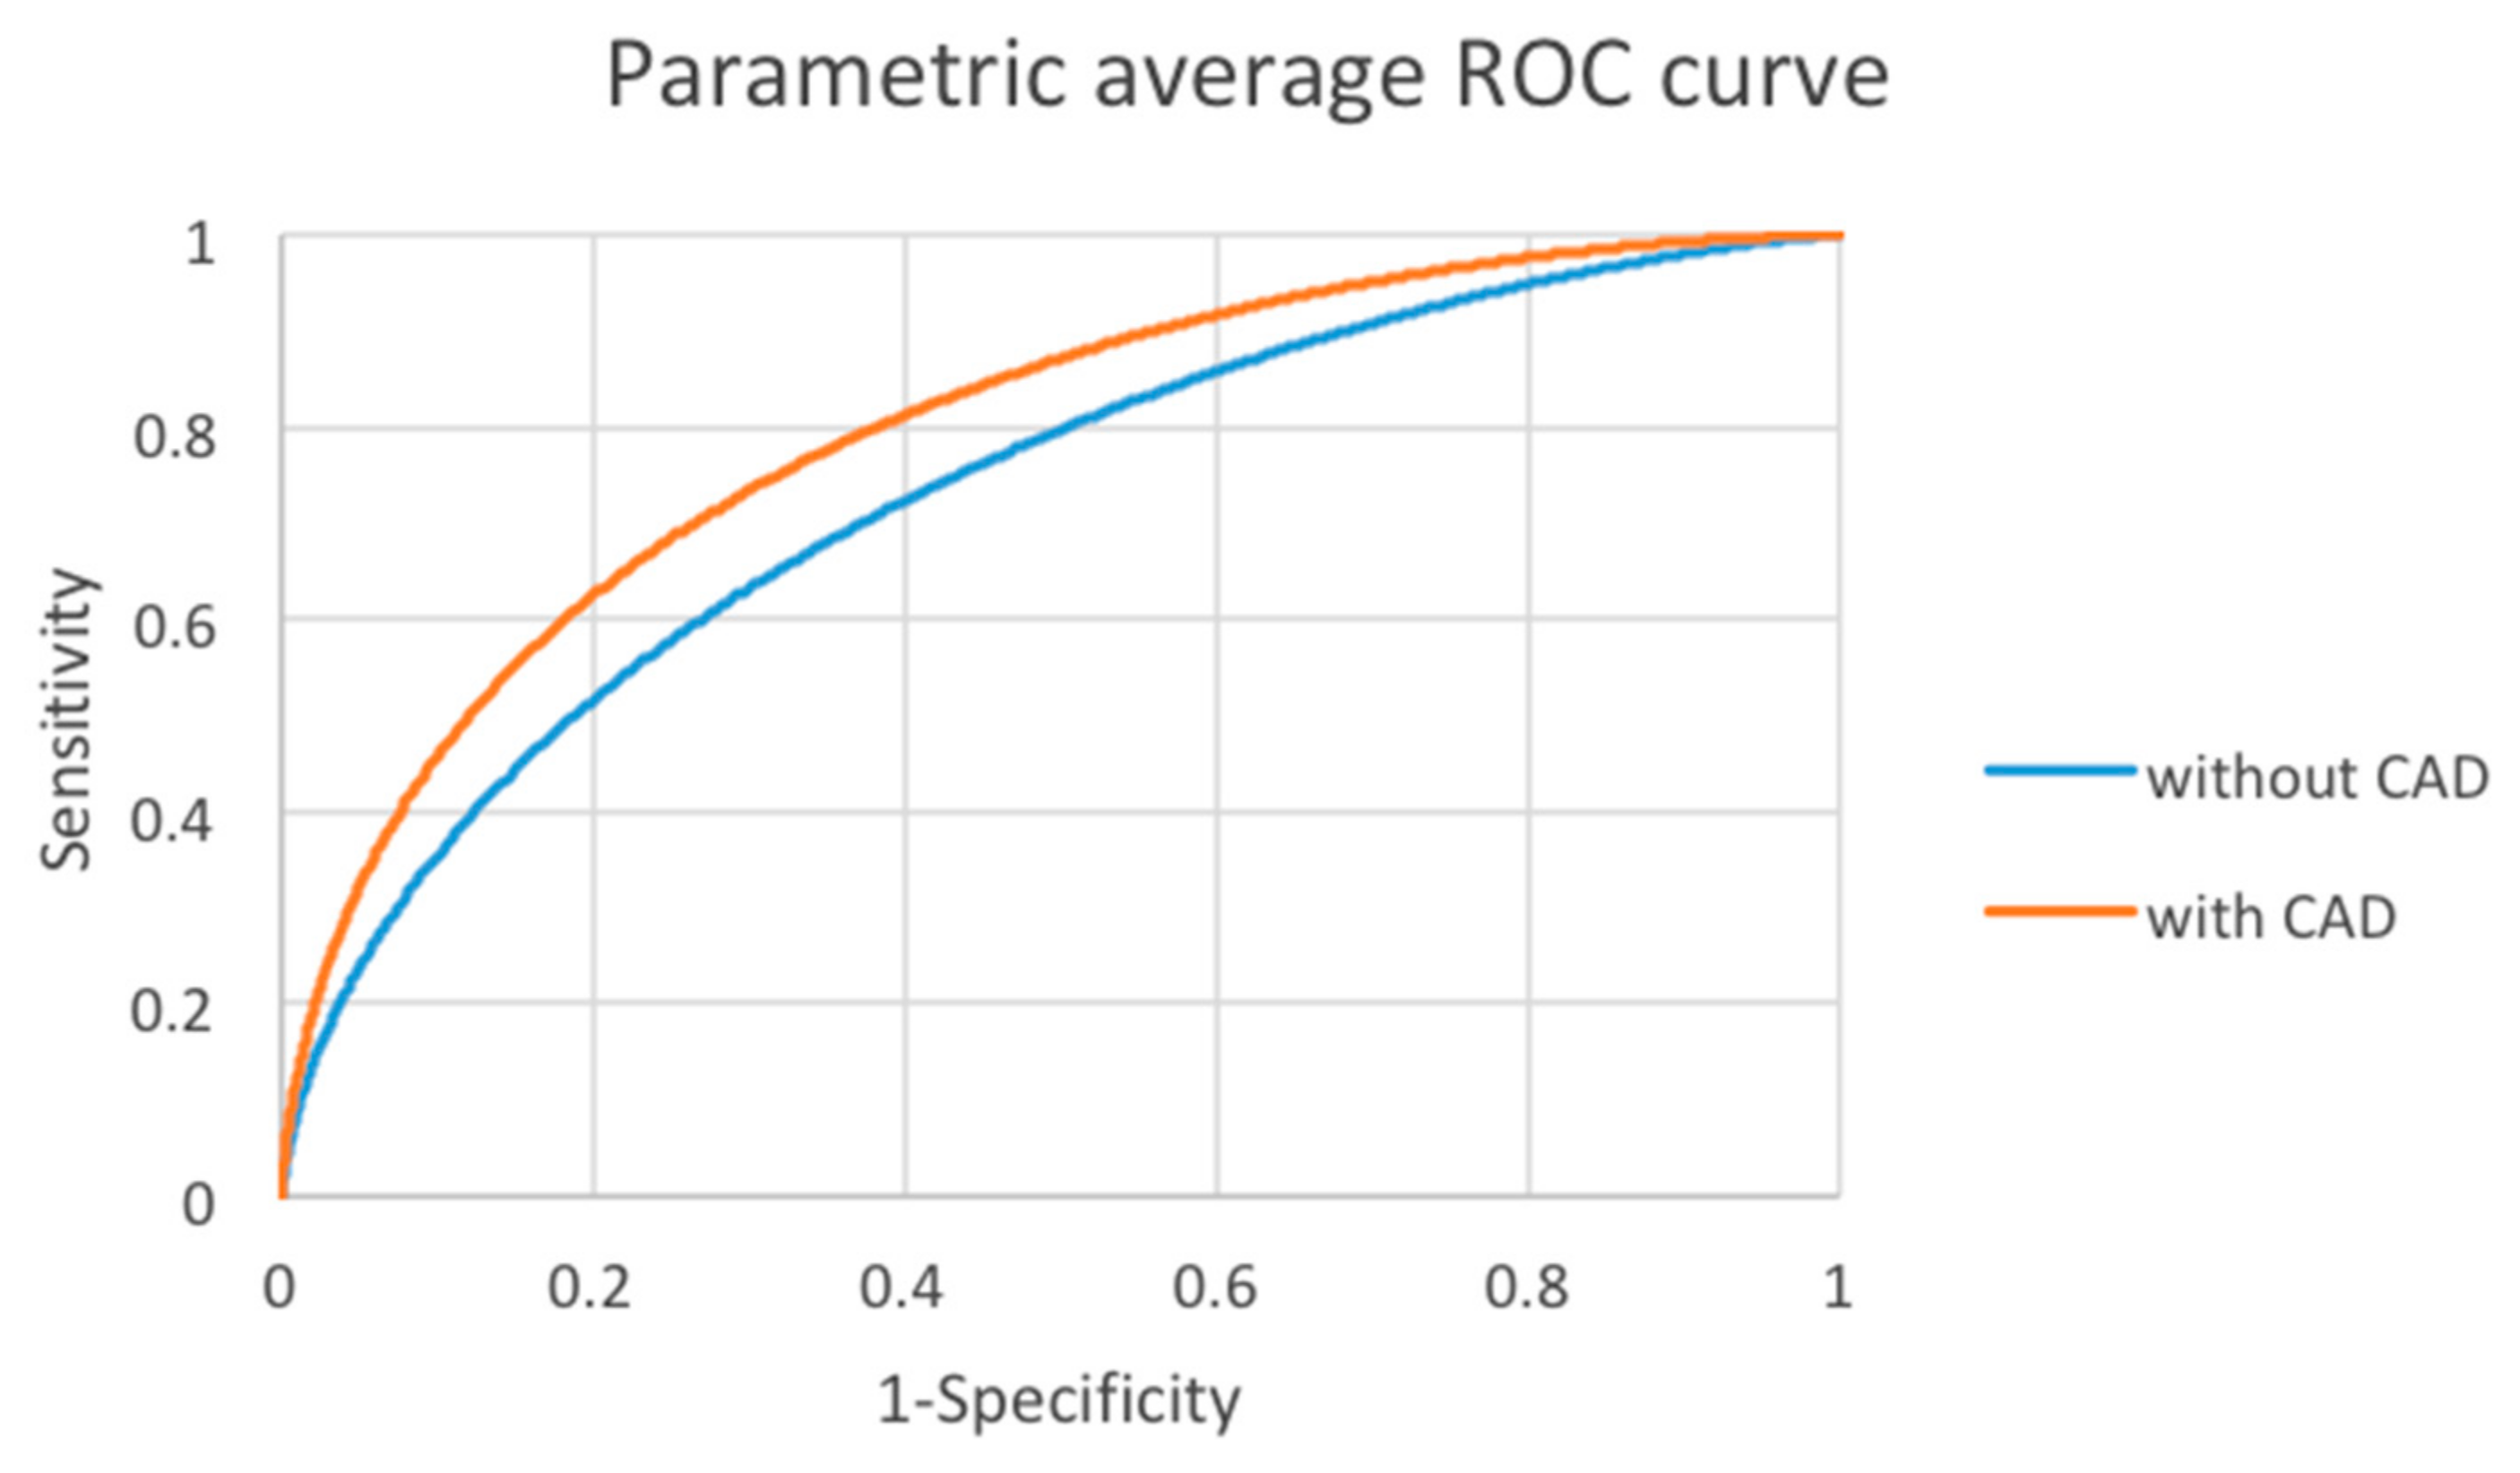
| Average | Without CAD (CI) | With CAD (CI) | Difference (CI) | p-Value |
|---|---|---|---|---|
| AUROC | 0.728 (0.679, 0.776) | 0.792 (0.751, 0.834) | 0.065 (0.037,0.092) | <0.0001 |
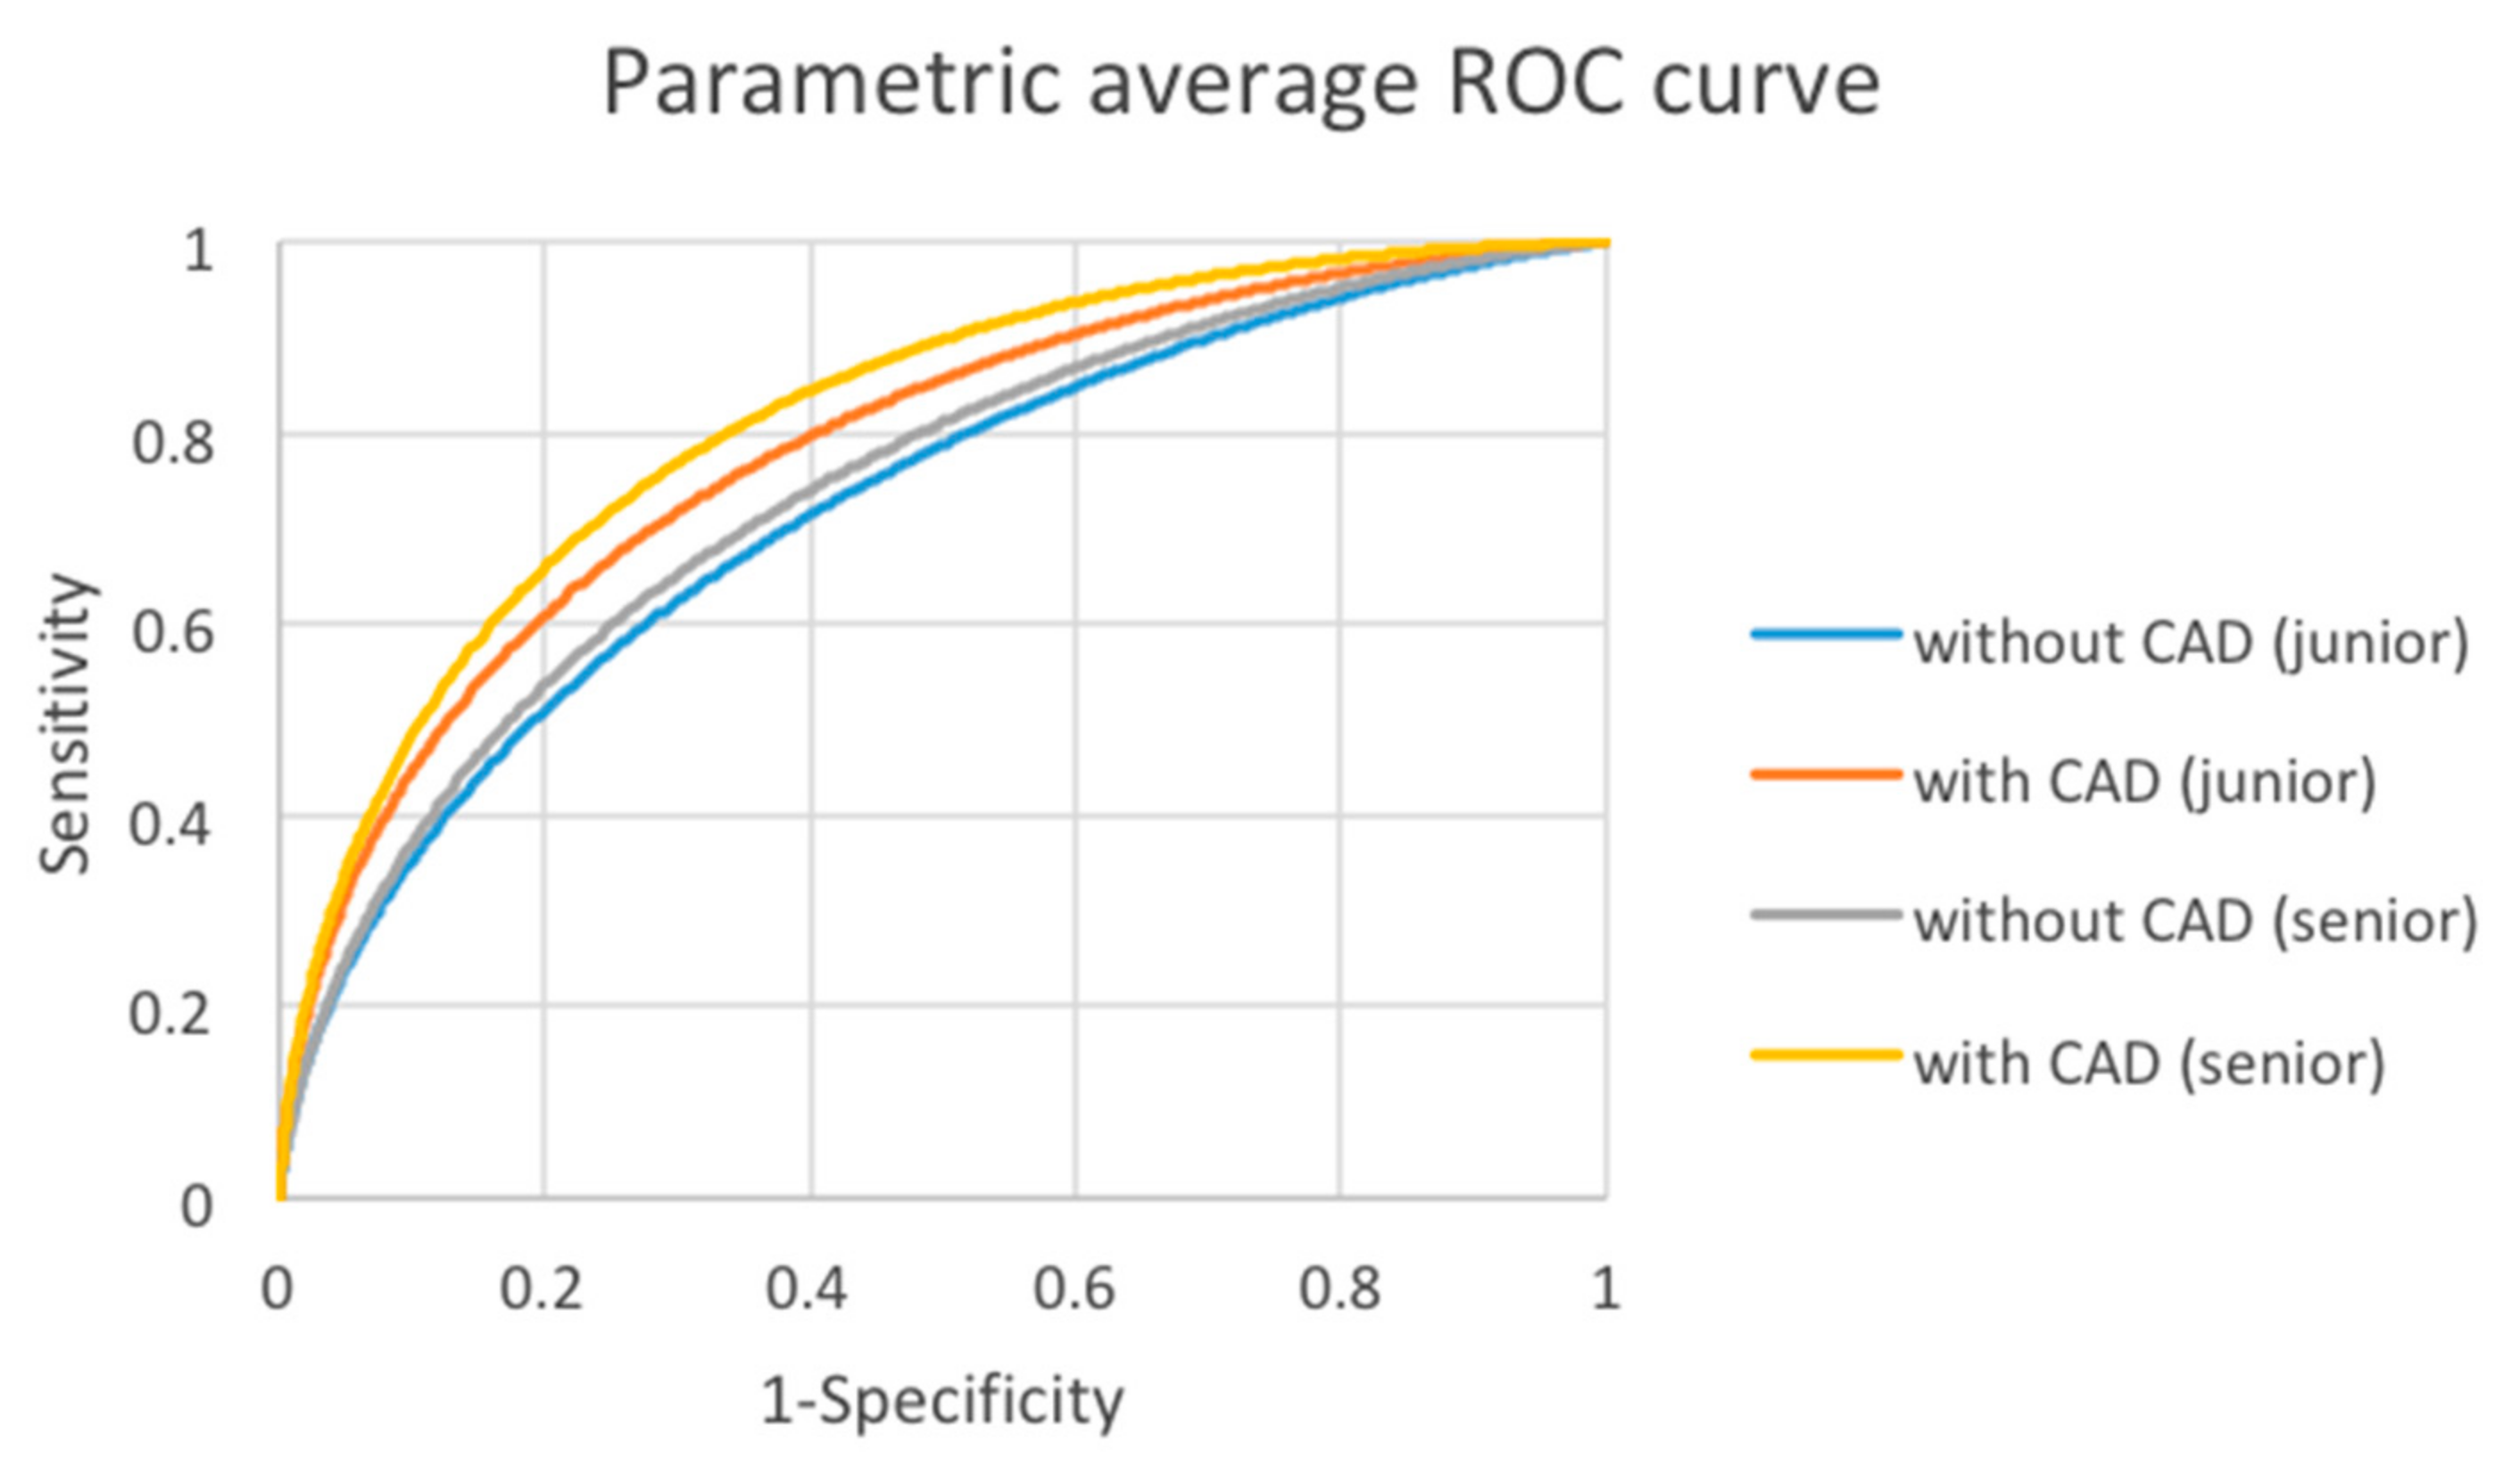
| AUROC | Without CAD (CI) | With CAD (CI) | Difference (CI) | p-Value |
|---|---|---|---|---|
| Junior | 0.722 (0.666, 0.777) | 0.781 (0.737, 0.825) | 0.059 (0.025,0.094) | 0.0012 |
| Senior | 0.739 (0.690, 0.787) | 0.812 (0.772, 0.853) | 0.074 (0.032,0.115) | 0.0025 |
| p-value | 0.65 | 0.016 |
| Cases | Without CAD (CI) | With CAD (CI) | Difference (CI) | p-Value |
|---|---|---|---|---|
| All | 18.97 (18.38, 19.47) | 16.29 (15.69, 16.95) | 2.38 (1.70, 3.07) | <0.0001 |
| Benign | 18.88 (18.20, 19.67) | 16.20 (15.54, 16.97) | 2.45 (1.62, 3.30) | <0.0001 |
| Malignancy | 19.10 (17.88, 19.86) | 16.38 (15.65, 17.86) | 2.26 (1.14, 3.44) | 0.0001 |
| Cases | Without CAD | With CAD | p-Value |
|---|---|---|---|
| Benign | 35.01 | 31.24 | 0.0074 |
| Malignancy | 54.92 | 55.14 | 0.9196 |
| Estimate | Without CAD (CI) | With CAD (CI) | Difference (CI) | p-Value |
|---|---|---|---|---|
| pAUC | 0.127 (0.106, 0.147) | 0.155 (0.133, 0.176) | 0.028 (0.015,0.040) | <0.0001 |
| Average | Without CAD (CI) | With CAD (CI) | Difference (CI) | p-Value |
|---|---|---|---|---|
| Specificity | 0.196 (0.121, 0.271) | 0.304 (0.211, 0.396) | 0.108 (0.050,0.166) | 0.0005 |
| Average | Without CAD (CI) | With CAD (CI) | Difference (CI) | p-Value |
|---|---|---|---|---|
| Sensitivity | 0.252 (0.186, 0.319) | 0.328 (0.247, 0.409) | 0.076 (0.027,0.124) | 0.0022 |
© 2020 by the authors. Licensee MDPI, Basel, Switzerland. This article is an open access article distributed under the terms and conditions of the Creative Commons Attribution (CC BY) license (http://creativecommons.org/licenses/by/4.0/).
Share and Cite
Wu, M.-H.; Chen, K.-Y.; Shih, S.-R.; Ho, M.-C.; Tai, H.-C.; Chang, K.-J.; Chen, A.; Chen, C.-N. Multi-Reader Multi-Case Study for Performance Evaluation of High-Risk Thyroid Ultrasound with Computer-Aided Detection. Cancers 2020, 12, 373. https://doi.org/10.3390/cancers12020373
Wu M-H, Chen K-Y, Shih S-R, Ho M-C, Tai H-C, Chang K-J, Chen A, Chen C-N. Multi-Reader Multi-Case Study for Performance Evaluation of High-Risk Thyroid Ultrasound with Computer-Aided Detection. Cancers. 2020; 12(2):373. https://doi.org/10.3390/cancers12020373
Chicago/Turabian StyleWu, Ming-Hsun, Kuen-Yuan Chen, Shyang-Rong Shih, Ming-Chih Ho, Hao-Chih Tai, King-Jen Chang, Argon Chen, and Chiung-Nien Chen. 2020. "Multi-Reader Multi-Case Study for Performance Evaluation of High-Risk Thyroid Ultrasound with Computer-Aided Detection" Cancers 12, no. 2: 373. https://doi.org/10.3390/cancers12020373
APA StyleWu, M.-H., Chen, K.-Y., Shih, S.-R., Ho, M.-C., Tai, H.-C., Chang, K.-J., Chen, A., & Chen, C.-N. (2020). Multi-Reader Multi-Case Study for Performance Evaluation of High-Risk Thyroid Ultrasound with Computer-Aided Detection. Cancers, 12(2), 373. https://doi.org/10.3390/cancers12020373