Abstract
Gastric cancer (GC) is the fifth most frequently diagnosed cancer and the third leading cause of cancer death. Approximately 15% of GC is associated with Epstein–Barr virus (EBV). GC is largely incurable with a dismal five-year survival rate. There is an urgent need to identify new therapeutic agents for the treatment of GC. Tenovin-6 was initially identified as a p53 activator, but it was later found to inhibit autophagy flux, and the protein deacetylase activity of sirtuins. Tenovin-6 shows promising therapeutic effect in various malignancies. However, it remains unknown whether Tenovin-6 is effective for GC. In this study, we found that EBV-positive and -negative GC cell lines were sensitive to Tenovin-6 but with different response times and doses. Tenovin-6 suppressed anchorage-independent growth of GC cells. Tenovin-6 induced different levels of apoptosis and phases of cell-cycle arrest depending on the cell lines with some manifesting gap 1 (G1) and others showing synthesis (S) phase cell-cycle arrest. Mechanistically, Tenovin-6 induced autophagy or p53 activation in GC cells depending on the status of TP53 gene. However, initiation of autophagy following treatment with Tenovin-6 conferred some protective effect on numerous cells. Combined treatment with Tenovin-6 and autophagy inhibitor chloroquine increased the cytotoxic effect by inducing microtubule-associated protein 1 light chain 3B (LC3B)-II accumulation, and by enhancing apoptosis and cell-cycle arrest. These results indicated that Tenovin-6 can be used as a potential therapeutic agent for GC, but the genetic background of the cancer cells might determine the response and mechanism of action. Treatment with Tenovin-6 alone or in combination with chloroquine could be a promising therapeutic approach for GC.
1. Introduction
Gastric cancer (GC) is the fifth most frequently diagnosed cancer and the third leading cause of cancer death. In 2018, there were 1,000,000 new cases and an estimated 783,000 deaths of GC [1]. Approximately 15% of GC is associated with Epstein–Barr virus (EBV) [2]. Early gastric cancer remains asymptomatic and lacks effective biomarkers for detection. Thus, most gastric cancer cases are diagnosed with distant metastasis at an advanced stage [3]. Advanced GC is largely incurable with a dismal five-year survival rate. Cisplatin and 5-fluorouracil remain the mainstay of treatment for people with advanced GC, both of which have high side effects [4]. There is an urgent need to explore new therapeutic agents for the treatment of GC.
Tenovin-6 was initially identified as a p53 activator, but it was later found to inhibit the protein deacetylase activity of metabolic sensors sirtuin 1 (SIRT1), SIRT2, and SIRT3 [5,6]. Numerous studies showed that Tenovin-6 initiates but subsequently impairs the autophagy flux by increasing the levels of microtubule-associated protein 1 light chain 3B (LC3B)-II and/or sequestosome-1 (SQSTM1)/p62 in diverse cell types [7,8,9,10]. Tenovin-6 was shown to have a promising anti-neoplastic effect in vitro and in vivo in various malignancies [6,7,8,11,12,13]. Tenovin-6 upregulated the death receptor 5 and enhanced the cytotoxic effects of 5-fluorouracil and oxaliplatin in colon cancer cells [14]. In gastric cell lines, Tenonvin-6 manifested an inhibitory effect on cell survival in part by upregulating the expression of death receptor 5 [13]. However, this effect was not detected in all the cell lines examined. Because of the diverse genetic heterogeneities of GC including the status of the TP53 gene and the presence of EBV infection in a subset of gastric cancer, it remains essential to further evaluate the therapeutic effect of Tenovin-6 for GC. In particular, whether initiation and impairment of the autophagy flux by Tenovin-6 is universal in GC cell lines, which could explain its inhibitory effect, remains unclear.
Chloroquine was initially used as an antimalarial drug, but it was later shown to be an effective anticancer drug [15,16]. Autophagy is an evolutionarily conserved cellular homeostatic process that is responsible for degrading damaged proteins or unnecessary cellular organelles and proteins [17]. The anticancer effect of chloroquine may partially be due to its inhibitory action on autophagy. Accumulating evidence indicates that chloroquine can sensitize cancer cells to radiation and other anticancer drugs [16]. Recent studies indicate that autophagy inhibition could enhance the efficacy of antitumor drugs in cancer therapy [18,19].
In this study, we demonstrated that numerous EBV-positive and -negative GC cell lines were sensitive to Tenovin-6 but with different response times and doses. Tenovin-6 suppressed anchorage-independent growth of GC cells. Tenovin-6 induced cell-cycle arrest and apoptosis depending on the cell lines with some manifesting gap 1 (G1) or synthesis (S) phase cell-cycle arrest and others showing apoptosis. Mechanistically, Tenovin-6 induced autophagy or p53 activation in GC cells depending on the genetic background. Initiation of autophagy following treatment with Tenovin-6 conferred some protective effect on numerous cells; however, combined treatment of Tenovin-6 and chloroquine increased the cytotoxic effect of Tenovin-6 by inducing LC3B-II accumulation, and by enhancing apoptosis and G1 cell-cycle arrest. These results indicate that Tenovin-6 could be a potential therapeutic agent for GC but the genetic background of the cancer cells might determine their response and mechanism of action. Treatment with Tenovin-6 alone or in combination with chloroquine could be a promising therapeutic approach for GC.
2. Results
2.1. Tenovin-6 Inhibits Cell Proliferation and Anchorage-Independent Growth of GC Cells
To test whether Tenovin-6 had a universal inhibitory effect on GC cells, we treated seven gastric cancer cell lines with different concentrations of Tenovin-6, including EBV-positive cell lines AGS-EBV and SNU-719, and EBV-negative cell lines AGS, HGC-27, N87, SNU-1, and KATO-III. AGS-EBV cells were obtained by infecting AGS cells with a recombinant EBV M81 [20], while SNU-719 cells was isolated from a GC patient [21,22]. Tenovin-6 potently inhibited cell proliferation in a dose- and time-dependent manner in all seven cell lines examined (Figure 1A); however, the sensitivities of these cell lines to Tenovin-6 varied. We calculated the half maximal inhibitory concentration (IC50) value to Tenovin-6 for each cell line at 72 h post treatment (Figure 1B). AGS and AGS-EBV cells were the most sensitive lines with IC50 values of 0.035 and 0.005 μmol/L, respectively, followed by HGC-27, SNU-1, N87, and KATO-III cells with IC50 values of 0.201, 0.322, 0.481, and 0.517 μmol/L, respectively (Figure 1B). SNU-719 cells were the least sensitive to Tenovin-6 with an IC50 value of 2.038 μmol/L (Figure 1B).
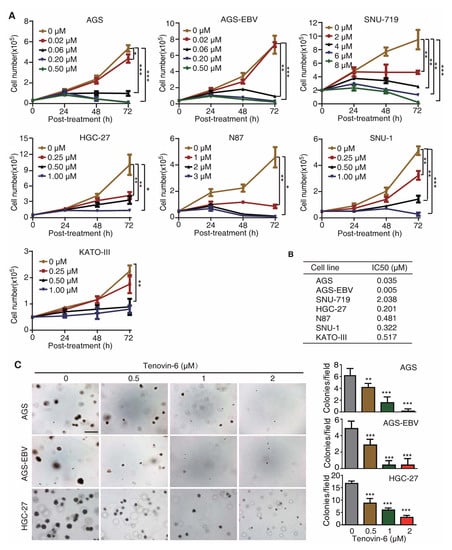
Figure 1.
Tenovin-6 inhibits cell proliferation and anchorage-independent growth of gastric cancer (GC) cells. (A) Examination of cell proliferation following treatment with Tenovin-6. Cells seeded at 2.5 × 10⁴ or 5 × 10⁴ cells/well were treated with the indicated concentrations of Tenovin-6 and counted at 24, 48, and 72 h post treatment. * p < 0.05, ** p < 0.01, *** p < 0.001. (B) The half maximal inhibitory concentration (IC50) values were calculated using SPSS software based on the relative cell numbers at 72 h post treatment in all GC cell lines. (C) Suppression of anchorage-independent growth of AGS, AGS-EBV, and HGC-27 cells by Tenovin-6. Representative pictures captured at 5× magnification are presented in the left panel. Colonies with diameter >50 μm were counted, and colony numbers in each field are presented in the right panel. * p < 0.05, ** p < 0.01, *** p < 0.001. Scale bar: 500 μm.
Of the seven GC cell lines, AGS, AGS-EBV, and HGC-27 cells were capable of anchorage-independent growth in soft agar. Tenovin-6 treatment significantly reduced the anchorage-independent growth efficiencies of AGS, AGS-EBV, and HGC-27 cells (Figure 1C).
Together, these results indicated that GC cell lines were susceptible to Tenovin-6, and the sensitivity of GC cell lines to Tenovin-6 depended on their genetic background rather than EBV status of these cell lines.
2.2. Tenovin-6 Induces Apoptosis and Cell-Cycle Arrest of GC Cells
We investigated whether Tenovin-6 inhibition of proliferation of GC cells was due to the induction of apoptosis. GC cells were treated with Tenovin-6 for 48 h except for HGC-27 cells, which were treated for 72 h to give an obvious cytotoxic effect, and they were then examined for apoptosis by annexin V and propidium iodide (AV/PI) staining. Tenovin-6 induced apoptosis in GC cells in a dose-dependent manner in all seven cell lines (Figure 2A). At higher doses of Tenovin-6, apoptosis was observed in 10%–15% of cells in most of the cell lines except for N87, which had over 30% apoptotic cells (Figure 2A). Although the highest concentration of Tenovin-6 was used for SNU-719 cells, these cells did not have a higher number of apoptotic cells compared to other cell lines, indicating that SNU-719 cells were the most resistant to Tenovin-6 (Figure 2A).
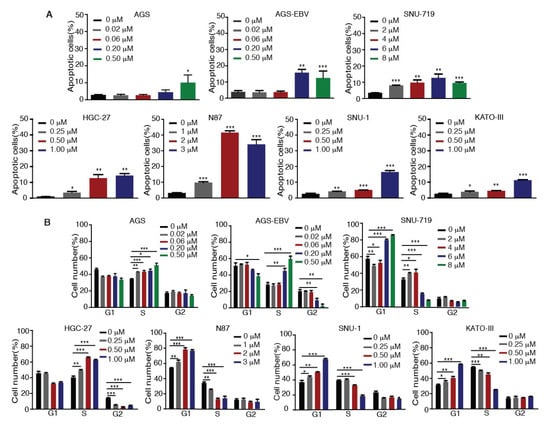
Figure 2.
Tenovin-6 induces apoptosis and cell-cycle arrest of GC cells. (A) Percentages of apoptotic cells in the indicated cell lines after Tenovin-6 treatment based on annexin V and propidium iodide (PI) staining. * p < 0.05, ** p < 0.01, *** p < 0.001. (B) Percentages of cells at gap 1 (G1), synthesis (S), and G2/mitotic (M) phases of the indicated cell lines after Tenovin-6 treatment based on PI staining. * p < 0.05, ** p < 0.01, *** p < 0.001.
We further investigated whether Tenovin-6 induced cell-cycle arrest. GC cells were treated with Tenovin-6 for 48 h except for HGC-27 cells, which were treated for 72 h. Tenovin-6 significantly increased the numbers of cells in G1 phase and decreased the numbers of cells in S phase in a dose-dependent manner in N87, SNU-1, and KATO-III cells (Figure 2B). In contrast, the numbers of cells in S phase were increased, while the numbers of cells in G1 and G2 phases were decreased in a dose-dependent manner in AGS, AGS-EBV, and HGC-27 cells by Tenovin-6 (Figure 2B). Interestingly, Tenovin-6 increased the numbers of cells in S phase and decreased the numbers of cells in G1 and G2 phases at lower doses (2 and 4 μM) in SNU-719 cells; however, at higher doses (6 and 8 μM), Tenovin-6 increased the numbers of cells in G1 phase and decreased the numbers of cells in S phase (Figure 2B).
These results indicated that Tenovin-6 inhibited cell proliferation by inducing apoptosis and cell-cycle arrest; however, the responses of different cell lines to Tenovin-6 varied with some manifesting G0/G1 or S phase cell-cycle arrest and others showing apoptosis; the results also indicated that these differential responses were not dependent on the EBV status.
2.3. Tenovin-6 Initiates But Blocks Autophagy Flux in Some GC Cell Lines
Autophagy is marked by the early induction of LC3B-II protein followed by subsequent degradation of p62 protein, while the inhibition of autophagy leads to p62 protein accumulation [23,24]. Tenovin-6 was shown to initiate autophagy by inducing LC3B-II protein in diverse cell types; however, the subsequent autophagy flux is blocked by Tenovin-6, resulting in unchanged or increased level of p62 [7,8,9,10]. We examined LC3B-II and p62 protein levels in GC cell lines following Tenovin-6 treatment. Tenovin-6 had no effect on LC3B-II and p62 protein levels in AGS and AGS-EBV cells, indicating that Tenovin-6 did not initiate or block autophagy in these cells (Figure 3 and Supplementary Figure S1). In contrast, Tenovin-6 treatment increased the level of LC3B-II protein in SNU-719, HGC-27, SNU-1, N87, and KATO-III cells; however, p62 protein level had either no change or a slight increase, indicating that Tenovin-6 blocked the autophagy flux in these cells (Figure 3).
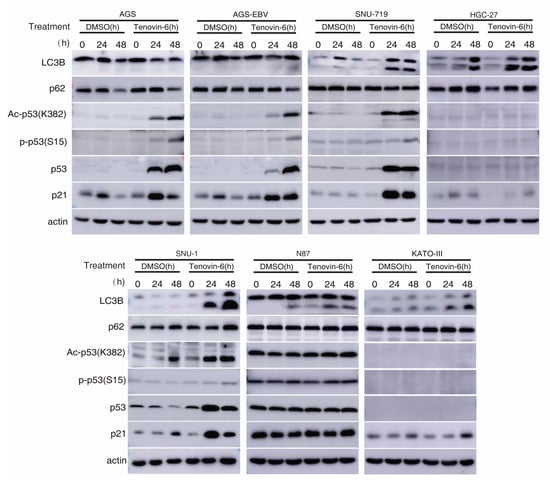
Figure 3.
Tenovin-6 induces p53 activation or initiated but failed to induce full program of autophagy in GC cells. The levels of microtubule-associated protein 1 light chain 3B (LC3B), sequestosome-1 (SQSTM1)/p62 (p62), acetylated-p53 (Ac-p53 (K382)), phospho-p53 (Ser15) (P-p53 (S15)), p53, and p21 were examined in GC cell lines following treatment with Tenovin-6 for 24 and 48 h. Tenovin-6 was used at 0.5 μM for AGS, AGS-EBV, and SNU-1 cells, 6 μM for SNU-719 cells, 1 μM for HGC-27 and KATO-III cells, and 2 μM for N87 cells.
2.4. Tenovin-6 Induces and Activates p53 in Some GC Cell Lines
Tenovin-6 was initially identified as a p53 activator [5,6], and p53 regulates the autophagic pathway, as well as cell cycle and apoptosis [25,26]. We examined p53 activation in GC cells. Among all the seven cell lines, the TP53 gene is wild-type in AGS, AGS-EBV, SNU-719, and SNU-1 cells, is mutated in HGC-27 and N87 cells, and is null in KATO-III cells (Table 1) [22,27,28,29,30,31,32]. In cell lines with wild-type TP53 gene, Tenovin-6 induced higher total and acetylated p53 (ac-p53) levels (Figure 3). However, robust phosphorylated p53 (p-p53) levels were only observed in AGS and AGS-EBV cells, while SNU-719 and SNU-1 cells only had weak increases in p-p53 levels (Figure 3). In cell lines with mutated or null TP53 gene, there was either no increase (N87) or no detectable (HGC-27 and KATO-III) p53, ac-p53, and p-p53 (Figure 3). In agreement with these results, Tenovin-6 increased the levels of p21 protein in AGS, AGS-EBV, SNU-719, and SNU-1 cells, indicating that all four cell lines had p53 activation; however, no increase of p21 protein was observed in HGC-27, N87, and KATO-III cells (Figure 3). By comparing the effect of Tenovin-6 on AGS and AGS-EBV cells, we did not observe any differences in autophagic response and p53 activation (Figure 3). Overall, we did not observe any correlation between autophagy initiation or the blockage of autophagy flux and p53 activation following Tenovin-6 treatment in these cell lines.

Table 1.
Summary of the effects of Tenovin-6 on gastric cancer cell lines.
Taken together, we concluded that individual GC cell lines had different responses to Tenovin-6 treatment with some manifesting p53 activation and others showing autophagy initiation and blockage of autophagy flux, which might explain their different responses in apoptosis and cell-cycle arrest (Table 1). In addition, none of these responses were correlated with the EBV status of the cell lines. Nevertheless, cell lines that had initiation and blockage of autophagy flux following treatment with Tenovin-6 (SNU-719, SNU-1, HGC-27, N87, and KATO-III cells) appeared to be protected from Tenovin-6 and, hence, were more resistant to Tenovin-6, regardless of their TP53 gene status (Table 1). For cell lines that did not have initiation and blockage of autophagy flux following treatment with Tenovin-6 (AGS and AGS-EBV cells), they were sensitive to Tenovin-6 and had high levels of p53 activation giving their wild-type TP53 gene status (Figure 3).
2.5. Tenovin-6 and Chloroquine Synergistically Inhibit Cell Proliferation in GC Cells
Recent studies revealed that autophagy has a cytoprotective effect, and that inhibition of autophagy could enhance the efficacy of anti-tumor drugs in cancer therapy [18,19,33]. Our results showed that Tenovin-6 initiated and then blocked the autophagy flux in SNU-719, HGC-27, N87, SNU-1, and KATO-III cells, which could be the reason for their relative resistance to Tenovin-6 compared to AGS and AGS-EBV, which did not have any autophagy responses (Figure 1 and Figure 3). Therefore, we explored if combined treatment with Tenovin-6 with another inhibitor chloroquine (CQ), a lysosome inhibitor blocking autophagy flux, could enhance the cytotoxic effect of Tenovin-6. We examined the combined effect of the two inhibitors on AGS and AGS-EBV cells that did not have any autophagy responses, and SNU-719 and SNU-1 cells that had autophagy responses (Figure 3). SNU-719 was also the least responsive cell line among all the GC cell lines examined (Figure 1A,B) and SNU-1 cells had the least induction of p-p53 following Tenovin-6 treatment (Figure 3). Chloroquine alone inhibited the proliferation of AGS, AGS-EBV, SNU-719, and SNU-1 cells as effectively as Tenovin-6 did (Figure 4), confirming that blockage of autophagy was essential for induction of cytotoxicity. Interestingly, combined treatment with both inhibitors further enhanced the cytotoxicity in all four cell lines (Figure 4). In fact, the inhibitory effect of combined treatment with lower doses of Tenovin-6 (0.2 μM) and chloroquine (25 μM) was at least as effective as a higher dose of single treatment of either Tenovin-6 (0.5 μM) or chloroquine (50 μM) (Figure 4). In agreement with these results, combined treatment with Tenovin-6 and chloroquine increased the numbers of apoptotic cells in all four cell lines (Figure 5A). While Tenovin-6 only induced S phase arrest but not G1 phase arrest in AGS and AGS-EBV cells (Figure 2B), combined treatment with Tenovin-6 and chloroquine led to G1 phase arrest in these cells (Figure 5B). Tenovin-6 alone was sufficient to induce G1 phase arrest in SNU-719 and SNU-1 cells (Figure 2B). Interestingly, combined treatment with both inhibitors further increased G1 phase arrest in these cells (Figure 5B). Thus, increased G1 phase arrest appeared to be essential for the cytotoxic and synergistic effects of the combined treatment.
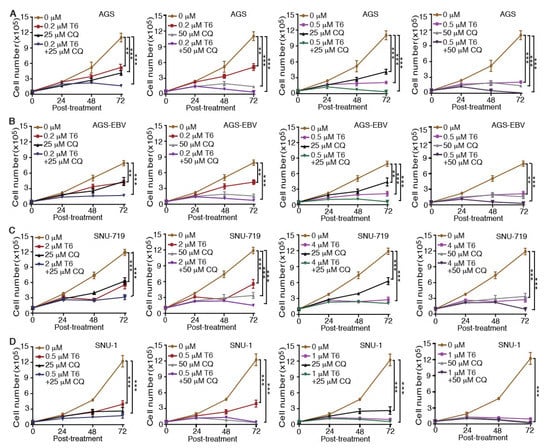
Figure 4.
Chloroquine (CQ) enhances the inhibitory effect of Tenovin-6 (T6) on cell proliferation in GC cells. (A–D) Examination of cell proliferation in AGS (A), AGS-EBV (B), SNU-719 (C), and SNU-1 (D) cells following treatment with different concentrations of T6 or CQ alone, or in combination. * p < 0.05, ** p < 0.01, *** p < 0.001.
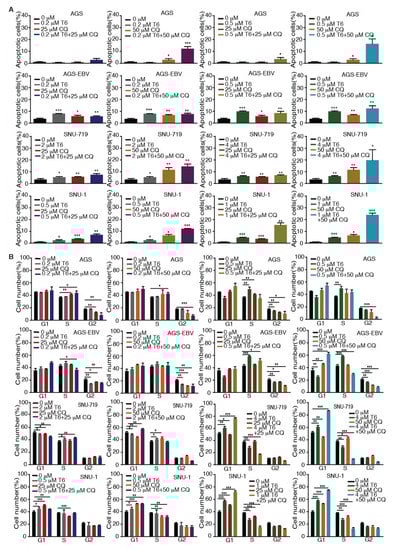
Figure 5.
Tenovin-6 (T6) and chloroquine (CQ) synergistically induce apoptosis and cell-cycle arrest in GC cells. (A) Examination of apoptotic cells by annexin V and propidium iodide (PI) staining in AGS, AGS-EBV, SNU-719, and SNU-1 cells following treatment with different concentrations of T6 or CQ alone or in combination. * p < 0.05, ** p < 0.01, *** p < 0.001. (B) Examination of cell-cycle phases in AGS, AGS-EBV, SNU-719, and SNU-1 cells following treatment with different concentrations of T6 or CQ alone or in combination. * p < 0.05, ** p < 0.01, *** p < 0.001.
To determine whether the enhanced cytotoxic effect of Tenovin-6 by chloroquine was due to the inhibitory effect of chloroquine on autophagy flux, we examined LC3B-II and p62 protein levels. While Tenovin-6 did not alter LC3B-II and p62 protein levels in AGS and AGS-EBV cells, chloroquine alone or in combination with Tenovin-6 indeed effectively induced LC3B-II protein in these cells; however, there was no change of p62 protein level, indicating the inhibition of autophagy flux, which likely contributed to the increased apoptosis and induction of G1 cell cycle arrest in these cells (Figure 6A,B and Supplementary Figure S1). While Tenovin-6 alone induced LC3B-II protein in SNU-719 and SNU-1 cells, chloroquine alone or in combination with Tenovin-6 further increased a higher level of LC3B-II protein; however, chloroquine or Tenovin-6 alone, or in combination did not alter the level of p62 protein, which might contribute to the enhanced cytotoxic effect of Tenovin-6 by chloroquine in these cells (Figure 6C,D).
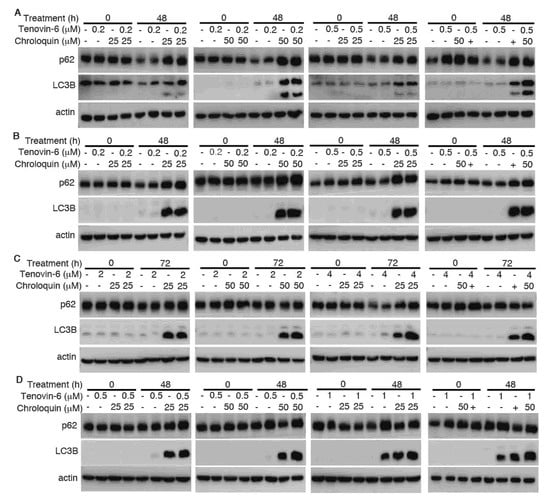
Figure 6.
Chloroquine induces microtubule-associated protein 1 light chain 3B (LC3B)-II but blocks autophagy flux to enhance cytotoxicity of Tenovin-6. (A–D) Examination of LC3B and sequestosome-1 (SQSTM1)/p62 (p62) protein levels following treatment with Tenovin-6 or chloroquine alone, or in combination for 48 h in AGS (A), AGS-EBV (B), SNU-719 (C), and SNU-1 (D) cells.
Together, these results indicated that the combined treatment of Tenovin-6 and chloroquine could effectively inhibit cell proliferation, and it synergistically induced apoptosis and cell-cycle arrest in different GC cell lines, including those with and without EBV infection. The autophagy inhibitory effect of chloroquine likely contributed to these synergistic effects.
3. Discussion
Epstein–Barr virus (EBV) is closely associated with several types of malignancies, including Burkitt lymphoma (BL), Hodgkin’s lymphoma (HL), nasopharyngeal carcinoma (NPC), and gastric cancer (GC) [34,35,36]. In different EBV-associated malignancies, the virus manifests distinct latency patterns, namely, type I, II, III, or Wp-restricted latency [35,36,37]. EBV-associated GC (EBVaGC) belongs to latency type I or II, expressing EBERs, EBNA-1, BARTs, and BART microRNAs (miRNAs), respectively [38,39]. Approximately half of EBVaGC cases also express LMP-2A [38,39]. In the present study, we compared the effect of Tenovin-6 on EBV-negative GC cell lines AGS, HGC-27, N87, SNU-1, and KATO-III, and EBV-positive GC cell lines AGS-EBV and SNU-719. All the GC cell lines were sensitive to Tenovin-6; however, SNU-719 was clearly the least sensitive cell line (IC50 value of 2.038 μmol/L for SNU-719), while the AGS and AGS-EBV cells were the most sensitive cell lines (0.005 and 0.035 μmol/L) (Figure 1A,B). A previous study determined that the IC50 values of six EBV-negative GC cell lines to Tenovin-6 were between 2.34 and 4.28 μmol/L [13]. While comparisons among cell lines were impossible because of their different genetic backgrounds, AGS and AGS-EBV had the same genetic background, thereby allowing assessing the effect of EBV. Surprisingly, AGS-EBV cells were more sensitive to Tenovin-6 than AGS cells, suggesting that the high resistance of SNU-719, an EBV-positive cell line, to Tenovin-6 was unlikely due to its EBV status.
One of the most commonly mutated genes in human cancer is tumor suppressor gene TP53 [40]. Approximately 50% of GCs have a TP53 gene mutation [41]. These mutations disrupt the transcriptional activation ability of p53 protein, including induction of genes associated with cell cycle, apoptosis, and DNA repair [42]. Among the seven cell lines examined in this study, four have wild-type TP53 (AGS, AGS-EBV, SNU-719 and SNU-1), two have mutated TP53 (HGC-27 and N87), and one has null TP53 (KATO-III) [22,27,28,29,30,31,32]. However, we did not observe any correlation of the sensitivity of these cell lines to Tenovin-6 with the status of TP53 gene alone.
We analyzed the potential mechanism of Tenovin-6 inhibition of cell proliferation in GC cells. It was reported that GC cells are sensitive to both apoptotic and autophagic cell death [43,44]. We found that the responses of different cell lines to Tenovin-6 varied with some manifesting G1 or S phase cell-cycle arrest and others showing apoptosis, and that these differential responses were not depend on the EBV status (Figure 2). Because Tenovin-6 was shown to initiate autophagy by inducing LC3B-II protein in diverse cell types, we examined its effect on LC3B-II and p62 protein levels in GC cell lines. Tenovin-6 was initially identified as a p53 activator [5,6], and p53 regulates the autophagic pathway as well as cell cycle and apoptosis [25,26]. Hence, we also examined p53 activation in GC cells. We found that p53 activation following Tenovin-6 treatment completely depended on the genetic status of the TP53 gene. p53 activation was detected in all four cell lines with wild-type TP53 gene. However, no p53 activation was detected in the three cell lines with either mutated or null TP53 gene (Figure 3). Interestingly, we did not find any correlation of p53 activation with autophagy initiation (Figure 3), which might explain the different responses in apoptosis and cell-cycle arrest of these cell lines (Table 1). In addition, none of these responses were correlated with the EBV status of the cell lines.
Induction of autophagy can either be a pro-survival mechanism protecting cells against stress-induced killing [45,46] or a cell death mechanism induced by various anti-cancer agents [43,44,47,48,49,50]. Our results showed that cells with initiation of autophagy were more resistant to Tenovin-6, although the autophagy flux was blocked (Figure 3), suggesting a protective role of autophagy in these cells. Results of extensive studies in tumor cells in culture and in animal models suggested that autophagy can be induced by antitumor drugs and can be targeted to overcome chemotherapeutic resistance. Some early clinical results suggested that autophagy inhibition in combination with anticancer drugs seems to be safe and can fortify the efficacies of various anticancer therapies in glioblastoma, melanoma, and multiple myeloma [51,52]. Combined treatments with autophagy inhibitors such as hydroxychloroquine and chloroquine and other drugs showed promising results in some clinical cases [51]. Indeed, our results showed that combined treatment with both Tenovin-6 and chloroquine had synergistic inhibitory effects by inhibiting autophagy flux, inducing G1 arrest and apoptosis (Figure 4, Figure 5 and Figure 6). Hence, Tenovin-6 is an excellent candidate for combined use with autophagy inhibitor. Firstly, Tenovin-6 alone showed a promising anti-neoplastic effect in vitro or in vivo on various malignancies [6,7,8,11,12,13,53,54,55,56]; secondly, Tenovin-6 seems to be safe in mice, since no obvious adverse effect is reported so far [6,53,55,56,57]; thirdly, our results showed that Tenovin-6 initiated autophagy, which conferred a protective effect, in numerous cell lines; fourthly, this study indeed demonstrated that combined treatment with Tenovin-6 and chloroquine enhanced the cytotoxicity and synergistically induced apoptosis and G1 cell-cycle arrest in different GC cell lines compared to the treatment with either inhibitor alone (Figure 4 and Figure 5). Thus, dual treatment with Tenovin-6 and chloroquine could be a viable therapeutic approach for GC.
In summary, we reported that EBV-positive and -negative GC cell lines were sensitive to Tenovin-6 but with different sensitivities. Tenovin-6 induced different levels of apoptosis and phases of cell-cycle arrest, with some manifesting G1 and others showing S phase cell-cycle arrest depending on the genetic background of the cell lines (Table 1). The cytotoxic effect of Tenovin-6 was likely through activation of p53 or inhibition of autophagy flux. Initiation of autophagy had some protective effect on the cells; however, combined treatment with Tenovin-6 and autophagy inhibitor chloroquine increased the cytotoxic effect by inducing LC3B-II accumulation, and by enhancing apoptosis and cell-cycle arrest.
4. Materials and Methods
4.1. Reagents and Antibodies
The following regents were used in this study: Tenovin-6 (BSCC-37, Agave Pharm, Seattle, WA, USA) and chloroquine diphosphate (C6628, Sigma, St. Louis, MO, USA). Antibodies specific to the following proteins were used: β-actin (RM001V, Beijing Ray Antibody Biotech, Beijing, China), p53 (#2527, Cell Signaling Technology, Danvers, MA, USA), Ac-p53 (ab75754, Abcam, Cambridge, MA,USA), p-p53 (#9284, Cell Signaling Technology, Danvers, MA, USA), p21 (#2947, Cell Signaling Technology, Danvers, MA, USA), L3B (sc-376404, Santa Cruz, Dallas, TX, USA), and p62 (18420-1-AP, Proteintech Group, Inc., Chicago, IL, USA).
4.2. Cell Culture
AGS (American Type Culture Collection) is an Epstein–Barr virus (EBV)-negative cell line. AGS-EBV cells were obtained by infecting AGS cells with recombinant EBV M81. SNU-719, a gift from Dr. Kang, is a GC cell line containing native EBV genomes isolated from a GC patient. HGC-27, N87, SNU-1, and KATO-III are EBV-negative GC cell lines obtained from the Cell Bank of the Chinese Academy of Sciences. GC cell lines were cultured in Roswell Park Memorial Institute (RPMI)-1640 medium supplemented with 10% fetal bovine serum (FBS), penicillin–streptomycin solution, and l-glutamine at 37 °C and 5% CO2.
4.3. Western-Blotting
Cells were lysed in sample buffer (Gbcbio Technologies Inc., Guangzhou, China) supplemented with proteinase inhibitors (50×) and phosphatase inhibitors (50×). Protein lysates were resolved by SDS-PAGE and transferred onto a polyvinylidene fluoride (PVDF) membrane. After blocking with 5% skim milk, the membrane was probed with primary and secondary antibodies, and visualized using the enhanced chemiluminescence (ECL) system (Gbcbio Technologies Inc., Guangzhou, China).
4.4. Cell Cycle and Apoptosis Assays
To examine cell cycle, cells were trypsinized and fixed in 70% cold ethanol at −20 °C overnight. After treatment with 100 μg/mL RNase A, cells were stained with 50 μg/mL propidium iodide (PI) for 30 min at 37 °C and subjected to cell-cycle analysis. To examine apoptosis, cells were trypsinized without ethylenediaminetetraacetic acid (EDTA). Apoptotic cells were monitored using the Annexin V-Alexa Fluor 647/PI Apoptosis Detection Kit (Beijing 4A Biotech Co., Ltd., Beijing, China). Flow cytometry was performed on the NovoCyte Flow Cytometer (ACEC Biosciences. Inc., San Diego, CA, USA).
4.5. Colony Formation in Soft Agar
A total of 104 cells suspended in 1 mL of 0.3% top agar (catalog no. A5431; Sigma-Aldrich, St. Louis, MO, USA) were plated onto one well of 0.5% base agar in six-well plates and maintained for 2–3 weeks. Colonies with a diameter of >50 μm were counted and photographed at 5× magnification using a microscope.
4.6. Statistical Analysis
Statistical analysis was performed using two-tailed t-tests, and statistical symbols *, **, and *** represent p values of <0.05, <0.01, and <0.001, respectively, while “NS” indicates “not significant”. Data are expressed as the mean ± SD of triplicate samples, and the reproducibility was confirmed in at least three independent experiments.
5. Conclusions
The current study provides experimental evidence demonstrating that Tenovin-6 has a promising anti-proliferative effect on GC cells in vitro. Furthermore, the combination of Tenovin-6 and chloroquine increased the cytotoxic effect by inducing LC3B-II accumulation, and by enhancing apoptosis and cell-cycle arrest. Treatment with Tenovin-6 alone or in combination with chloroquine could be a promising therapeutic approach for GC.
Supplementary Materials
The following are available online at https://www.mdpi.com/2072-6694/12/2/365/s1, Figure S1: Original western blots for Figure 3 and Figure 6.
Author Contributions
Conceptualization, S.-J.G.; investigation, X.K.; data curation, X.K.; formal analysis, X.K., T.D., Y.L., and S.-J.G.; validation, X.K. and Q.Q.; methodology, X.K. and Q.Q.; software, T.D. and Y.L.; visualization, X.K.; writing—original draft preparation, X.K.; writing—review and editing, X.K., Q.Q., and S.-J.G.; supervision, Q.Q.; project administration, X.K. and Q.Q.; funding acquisition, Q.Q. All authors have read and agreed to the published version of the manuscript.
Funding
This research was funded by the Department of Education of Guangdong province in China, grant number 2017KTSCX067, and the Natural Science Foundation of department of Science and Technology, Guangdong, China, grant number 2018A030307061 to Q.Q.
Acknowledgments
We would like to thank members of the Laboratory of Human Virology and Oncology (LHVO) for technical assistance and helpful discussions.
Conflicts of Interest
The authors declare no conflicts of interest.
References
- Bray, F.; Ferlay, J.; Soerjomataram, I.; Siegel, R.L.; Torre, L.A.; Jemal, A. Global cancer statistics 2018: Globocan estimates of incidence and mortality worldwide for 36 cancers in 185 countries. CA Cancer J. Clin. 2018, 68, 394–424. [Google Scholar] [CrossRef] [PubMed]
- Naseem, M.; Barzi, A.; Brezden-Masley, C.; Puccini, A.; Berger, M.D.; Tokunaga, R.; Battaglin, F.; Soni, S.; McSkane, M.; Zhang, W.; et al. Outlooks on epstein-barr virus associated gastric cancer. Cancer Treat. Rev. 2018, 66, 15–22. [Google Scholar] [CrossRef]
- Lazar, D.C.; Avram, M.F.; Romosan, I.; Cornianu, M.; Taban, S.; Goldis, A. Prognostic significance of tumor immune microenvironment and immunotherapy: Novel insights and future perspectives in gastric cancer. World J. Gastroenterol. 2018, 24, 3583–3616. [Google Scholar] [CrossRef]
- Wagner, A.D.; Syn, N.L.; Moehler, M.; Grothe, W.; Yong, W.P.; Tai, B.C.; Ho, J.; Unverzagt, S. Chemotherapy for advanced gastric cancer. Cochrane Database Syst. Rev. 2017, 8, CD004064. [Google Scholar] [CrossRef]
- McCarthy, A.R.; Pirrie, L.; Hollick, J.J.; Ronseaux, S.; Campbell, J.; Higgins, M.; Staples, O.D.; Tran, F.; Slawin, A.M.; Lain, S.; et al. Synthesis and biological characterisation of sirtuin inhibitors based on the tenovins. Bioorg Med. Chem. 2012, 20, 1779–1793. [Google Scholar] [CrossRef]
- Lain, S.; Hollick, J.J.; Campbell, J.; Staples, O.D.; Higgins, M.; Aoubala, M.; McCarthy, A.; Appleyard, V.; Murray, K.E.; Baker, L.; et al. Discovery, in vivo activity, and mechanism of action of a small-molecule p53 activator. Cancer Cell 2008, 13, 454–463. [Google Scholar] [CrossRef] [PubMed]
- MacCallum, S.F.; Groves, M.J.; James, J.; Murray, K.; Appleyard, V.; Prescott, A.R.; Drbal, A.A.; Nicolaou, A.; Cunningham, J.; Haydock, S.; et al. Dysregulation of autophagy in chronic lymphocytic leukemia with the small-molecule sirtuin inhibitor tenovin-6. Sci. Rep. 2013, 3, 1275. [Google Scholar] [CrossRef] [PubMed]
- Yuan, H.; He, M.; Cheng, F.; Bai, R.; da Silva, S.R.; Aguiar, R.C.; Gao, S.J. Tenovin-6 inhibits proliferation and survival of diffuse large b-cell lymphoma cells by blocking autophagy. Oncotarget 2017, 8, 14912–14924. [Google Scholar] [CrossRef]
- Groves, M.J.; Johnson, C.E.; James, J.; Prescott, A.R.; Cunningham, J.; Haydock, S.; Pepper, C.; Fegan, C.; Pirrie, L.; Westwood, N.J.; et al. P53 and cell cycle independent dysregulation of autophagy in chronic lymphocytic leukaemia. Br. J. Cancer 2013, 109, 2434–2444. [Google Scholar] [CrossRef]
- Yuan, H.; Tan, B.; Gao, S.J. Tenovin-6 impairs autophagy by inhibiting autophagic flux. Cell Death Dis. 2017, 8, e2608. [Google Scholar] [CrossRef]
- Jin, Y.; Cao, Q.; Chen, C.; Du, X.; Jin, B.; Pan, J. Tenovin-6-mediated inhibition of sirt1/2 induces apoptosis in acute lymphoblastic leukemia (all) cells and eliminates all stem/progenitor cells. BMC Cancer 2015, 15, 226. [Google Scholar] [CrossRef]
- He, M.; Tan, B.; Vasan, K.; Yuan, H.; Cheng, F.; Ramos da Silva, S.; Lu, C.; Gao, S.J. Sirt1 and ampk pathways are essential for the proliferation and survival of primary effusion lymphoma cells. J. Pathol. 2017, 242, 309–321. [Google Scholar] [CrossRef]
- Hirai, S.; Endo, S.; Saito, R.; Hirose, M.; Ueno, T.; Suzuki, H.; Yamato, K.; Abei, M.; Hyodo, I. Antitumor effects of a sirtuin inhibitor, tenovin-6, against gastric cancer cells via death receptor 5 up-regulation. PLoS ONE 2014, 9, e102831. [Google Scholar] [CrossRef] [PubMed]
- Ueno, T.; Endo, S.; Saito, R.; Hirose, M.; Hirai, S.; Suzuki, H.; Yamato, K.; Hyodo, I. The sirtuin inhibitor tenovin-6 upregulates death receptor 5 and enhances cytotoxic effects of 5-fluorouracil and oxaliplatin in colon cancer cells. Oncol. Res. 2013, 21, 155–164. [Google Scholar] [CrossRef]
- Sandosham, A.A.; Eyles, D.E.; Pull, J.H.; Seng, L.D. Chloroquine-resistant falciparum malaria in a semi-immune indigenous population in north malaya. Med. J. Malaya 1966, 21, 115–124. [Google Scholar]
- Kimura, T.; Takabatake, Y.; Takahashi, A.; Isaka, Y. Chloroquine in cancer therapy: A double-edged sword of autophagy. Cancer Res. 2013, 73, 3–7. [Google Scholar] [CrossRef] [PubMed]
- Singh, R. Autophagy and regulation of lipid metabolism. Results Probl. Cell Differ. 2010, 52, 35–46. [Google Scholar] [PubMed]
- Zanotto-Filho, A.; Braganhol, E.; Klafke, K.; Figueiro, F.; Terra, S.R.; Paludo, F.J.; Morrone, M.; Bristot, I.J.; Battastini, A.M.; Forcelini, C.M.; et al. Autophagy inhibition improves the efficacy of curcumin/temozolomide combination therapy in glioblastomas. Cancer Lett. 2015, 358, 220–231. [Google Scholar] [CrossRef]
- Zeng, X.; Zhao, H.; Li, Y.; Fan, J.; Sun, Y.; Wang, S.; Wang, Z.; Song, P.; Ju, D. Targeting hedgehog signaling pathway and autophagy overcomes drug resistance of bcr-abl-positive chronic myeloid leukemia. Autophagy 2015, 11, 355–372. [Google Scholar] [CrossRef]
- Molesworth, S.J.; Lake, C.M.; Borza, C.M.; Turk, S.M.; Hutt-Fletcher, L.M. Epstein-barr virus gh is essential for penetration of b cells but also plays a role in attachment of virus to epithelial cells. J. Virol. 2000, 74, 6324–6332. [Google Scholar] [CrossRef]
- Ku, J.L.; Kim, K.H.; Choi, J.S.; Kim, S.H.; Shin, Y.K.; Chang, H.J.; Bae, J.M.; Kim, Y.W.; Lee, J.H.; Yang, H.K.; et al. Establishment and characterization of six human gastric carcinoma cell lines, including one naturally infected with epstein-barr virus. Cell Oncol. (Dordr) 2012, 35, 127–136. [Google Scholar] [CrossRef] [PubMed]
- Park, J.G.; Yang, H.K.; Kim, W.H.; Chung, J.K.; Kang, M.S.; Lee, J.H.; Oh, J.H.; Park, H.S.; Yeo, K.S.; Kang, S.H.; et al. Establishment and characterization of human gastric carcinoma cell lines. Int. J. Cancer 1997, 70, 443–449. [Google Scholar] [CrossRef]
- Rusten, T.E.; Stenmark, H. P62, an autophagy hero or culprit? Nat. Cell Biol. 2010, 12, 207–209. [Google Scholar] [CrossRef] [PubMed]
- Islam, M.A.; Sooro, M.A.; Zhang, P. Autophagic regulation of p62 is critical for cancer therapy. Int. J. Mol. Sci. 2018, 19, 1405. [Google Scholar] [CrossRef] [PubMed]
- Maiuri, M.C.; Galluzzi, L.; Morselli, E.; Kepp, O.; Malik, S.A.; Kroemer, G. Autophagy regulation by p53. Curr. Opin. Cell Biol. 2010, 22, 181–185. [Google Scholar] [CrossRef] [PubMed]
- Tasdemir, E.; Maiuri, M.C.; Galluzzi, L.; Vitale, I.; Djavaheri-Mergny, M.; D’Amelio, M.; Criollo, A.; Morselli, E.; Zhu, C.; Harper, F.; et al. Regulation of autophagy by cytoplasmic p53. Nat. Cell Biol. 2008, 10, 676–687. [Google Scholar] [CrossRef]
- Sethi, N.; Kikuchi, O.; McFarland, J.; Zhang, Y.; Chung, M.; Kafker, N.; Islam, M.; Lampson, B.; Chakraborty, A.; Kaelin, W.G., Jr.; et al. Mutant p53 induces a hypoxia transcriptional program in gastric and esophageal adenocarcinoma. JCI Insight 2019, 4, e128439. [Google Scholar] [CrossRef]
- Yi, H.; Yan, X.; Luo, Q.; Yuan, L.; Li, B.; Pan, W.; Zhang, L.; Chen, H.; Wang, J.; Zhang, Y.; et al. A novel small molecule inhibitor of mdm2-p53 (apg-115) enhances radiosensitivity of gastric adenocarcinoma. J. Exp. Clin. Cancer Res. 2018, 37, 97. [Google Scholar] [CrossRef]
- Matozaki, T.; Sakamoto, C.; Matsuda, K.; Suzuki, T.; Konda, Y.; Nakano, O.; Wada, K.; Uchida, T.; Nishisaki, H.; Nagao, M.; et al. Missense mutations and a deletion of the p53 gene in human gastric cancer. Biochem. Biophys. Res. Commun. 1992, 182, 215–223. [Google Scholar] [CrossRef]
- Kubota, E.; Williamson, C.T.; Ye, R.; Elegbede, A.; Peterson, L.; Lees-Miller, S.P.; Bebb, D.G. Low atm protein expression and depletion of p53 correlates with olaparib sensitivity in gastric cancer cell lines. Cell Cycle 2014, 13, 2129–2137. [Google Scholar] [CrossRef]
- Kim, J.H.; Takahashi, T.; Chiba, I.; Park, J.G.; Birrer, M.J.; Roh, J.K.; De Lee, H.; Kim, J.P.; Minna, J.D.; Gazdar, A.F. Occurrence of p53 gene abnormalities in gastric carcinoma tumors and cell lines. J. Natl. Cancer Inst. 1991, 83, 938–943. [Google Scholar] [CrossRef] [PubMed]
- Tamura, G.; Sakata, K.; Nishizuka, S.; Maesawa, C.; Suzuki, Y.; Iwaya, T.; Terashima, M.; Saito, K.; Satodate, R. Inactivation of the e-cadherin gene in primary gastric carcinomas and gastric carcinoma cell lines. Jpn. J. Cancer Res. 1996, 87, 1153–1159. [Google Scholar] [CrossRef]
- Lefort, S.; Joffre, C.; Kieffer, Y.; Givel, A.M.; Bourachot, B.; Zago, G.; Bieche, I.; Dubois, T.; Meseure, D.; Vincent-Salomon, A.; et al. Inhibition of autophagy as a new means of improving chemotherapy efficiency in high-lc3b triple-negative breast cancers. Autophagy 2014, 10, 2122–2142. [Google Scholar] [CrossRef] [PubMed]
- Tao, Q.; Young, L.S.; Woodman, C.B.; Murray, P.G. Epstein-barr virus (ebv) and its associated human cancers—Genetics, epigenetics, pathobiology and novel therapeutics. Front. Biosci. 2006, 11, 2672–2713. [Google Scholar] [CrossRef] [PubMed]
- Young, L.S.; Rickinson, A.B. Epstein-barr virus: 40 years on. Nat. Rev. Cancer 2004, 4, 757–768. [Google Scholar] [CrossRef]
- Gulley, M.L. Molecular diagnosis of epstein-barr virus-related diseases. J. Mol. Diagn. 2001, 3, 1–10. [Google Scholar] [CrossRef]
- Hui, K.F.; Yeung, P.L.; Chiang, A.K. Induction of mapk- and ros-dependent autophagy and apoptosis in gastric carcinoma by combination of romidepsin and bortezomib. Oncotarget 2016, 7, 4454–4467. [Google Scholar] [CrossRef]
- Sugiura, M.; Imai, S.; Tokunaga, M.; Koizumi, S.; Uchizawa, M.; Okamoto, K.; Osato, T. Transcriptional analysis of epstein-barr virus gene expression in ebv-positive gastric carcinoma: Unique viral latency in the tumour cells. Br. J. Cancer 1996, 74, 625–631. [Google Scholar] [CrossRef]
- Luo, B.; Wang, Y.; Wang, X.F.; Liang, H.; Yan, L.P.; Huang, B.H.; Zhao, P. Expression of epstein-barr virus genes in ebv-associated gastric carcinomas. World J. Gastroenterol. 2005, 11, 629–633. [Google Scholar] [CrossRef]
- Busuttil, R.A.; Zapparoli, G.V.; Haupt, S.; Fennell, C.; Wong, S.Q.; Pang, J.M.; Takeno, E.A.; Mitchell, C.; Di Costanzo, N.; Fox, S.; et al. Role of p53 in the progression of gastric cancer. Oncotarget 2014, 5, 12016–12026. [Google Scholar] [CrossRef]
- Hollstein, M.; Sidransky, D.; Vogelstein, B.; Harris, C.C. P53 mutations in human cancers. Science 1991, 253, 49–53. [Google Scholar] [CrossRef] [PubMed]
- Mizuarai, S.; Yamanaka, K.; Kotani, H. Mutant p53 induces the gef-h1 oncogene, a guanine nucleotide exchange factor-h1 for rhoa, resulting in accelerated cell proliferation in tumor cells. Cancer Res. 2006, 66, 6319–6326. [Google Scholar] [CrossRef] [PubMed]
- Lim, S.C.; Parajuli, K.R.; Duong, H.Q.; Choi, J.E.; Han, S.I. Cholesterol induces autophagic and apoptotic death in gastric carcinoma cells. Int. J. Oncol. 2014, 44, 805–811. [Google Scholar] [CrossRef] [PubMed]
- Xu, M.Y.; Lee, D.H.; Joo, E.J.; Son, K.H.; Kim, Y.S. Akebia saponin pa induces autophagic and apoptotic cell death in ags human gastric cancer cells. Food Chem. Toxicol. 2013, 59, 703–708. [Google Scholar] [CrossRef]
- White, E.; Karp, C.; Strohecker, A.M.; Guo, Y.; Mathew, R. Role of autophagy in suppression of inflammation and cancer. Curr. Opin. Cell Biol. 2010, 22, 212–217. [Google Scholar] [CrossRef]
- Mathew, R.; Karantza-Wadsworth, V.; White, E. Role of autophagy in cancer. Nat. Rev. Cancer 2007, 7, 961–967. [Google Scholar] [CrossRef]
- Yang, C.; Pan, Y. Fluorouracil induces autophagy-related gastric carcinoma cell death through beclin-1 upregulation by mir-30 suppression. Tumour Biol. 2015, 37, 15489–15494. [Google Scholar] [CrossRef]
- Zhao, C.; She, T.; Wang, L.; Su, Y.; Qu, L.; Gao, Y.; Xu, S.; Cai, S.; Shou, C. Daucosterol inhibits cancer cell proliferation by inducing autophagy through reactive oxygen species-dependent manner. Life Sci. 2015, 137, 37–43. [Google Scholar] [CrossRef]
- Raha, S.; Yumnam, S.; Hong, G.E.; Lee, H.J.; Saralamma, V.V.; Park, H.S.; Heo, J.D.; Lee, S.J.; Kim, E.H.; Kim, J.A.; et al. Naringin induces autophagy-mediated growth inhibition by downregulating the pi3k/akt/mtor cascade via activation of mapk pathways in ags cancer cells. Int. J. Oncol. 2015, 47, 1061–1069. [Google Scholar] [CrossRef]
- Lim, S.C.; Han, S.I. Ursodeoxycholic acid effectively kills drug-resistant gastric cancer cells through induction of autophagic death. Oncol. Rep. 2015, 34, 1261–1268. [Google Scholar] [CrossRef]
- Wang, C.; Hu, Q.; Shen, H.M. Pharmacological inhibitors of autophagy as novel cancer therapeutic agents. Pharm. Res. 2016, 105, 164–175. [Google Scholar] [CrossRef] [PubMed]
- Ozpolat, B.; Benbrook, D.M. Targeting autophagy in cancer management—Strategies and developments. Cancer Manag. Res. 2015, 7, 291–299. [Google Scholar] [CrossRef] [PubMed]
- Yuan, H.; Wang, Z.; Li, L.; Zhang, H.; Modi, H.; Horne, D.; Bhatia, R.; Chen, W. Activation of stress response gene sirt1 by bcr-abl promotes leukemogenesis. Blood 2012, 119, 1904–1914. [Google Scholar] [CrossRef] [PubMed]
- Wang, Z.; Yuan, H.; Roth, M.; Stark, J.M.; Bhatia, R.; Chen, W.Y. Sirt1 deacetylase promotes acquisition of genetic mutations for drug resistance in cml cells. Oncogene 2013, 32, 589–598. [Google Scholar] [CrossRef] [PubMed]
- Li, L.; Wang, L.; Li, L.; Wang, Z.; Ho, Y.; McDonald, T.; Holyoake, T.L.; Chen, W.; Bhatia, R. Activation of p53 by sirt1 inhibition enhances elimination of cml leukemia stem cells in combination with imatinib. Cancer Cell 2012, 21, 266–281. [Google Scholar] [CrossRef]
- Li, L.; Osdal, T.; Ho, Y.; Chun, S.; McDonald, T.; Agarwal, P.; Lin, A.; Chu, S.; Qi, J.; Li, L.; et al. Sirt1 activation by a c-myc oncogenic network promotes the maintenance and drug resistance of human flt3-itd acute myeloid leukemia stem cells. Cell Stem Cell 2014, 15, 431–446. [Google Scholar] [CrossRef]
- Ma, L.; Maruwge, W.; Strambi, A.; D’Arcy, P.; Pellegrini, P.; Kis, L.; de Milito, A.; Lain, S.; Brodin, B. Sirt1 and sirt2 inhibition impairs pediatric soft tissue sarcoma growth. Cell Death Dis. 2014, 5, e1483. [Google Scholar] [CrossRef]


© 2020 by the authors. Licensee MDPI, Basel, Switzerland. This article is an open access article distributed under the terms and conditions of the Creative Commons Attribution (CC BY) license (http://creativecommons.org/licenses/by/4.0/).