Blockage of Squamous Cancer Cell Collective Invasion by FAK Inhibition Is Released by CAFs and MMP-2

 ,
, 
Abstract
:Simple Summary
Abstract

1. Introduction
2. Results
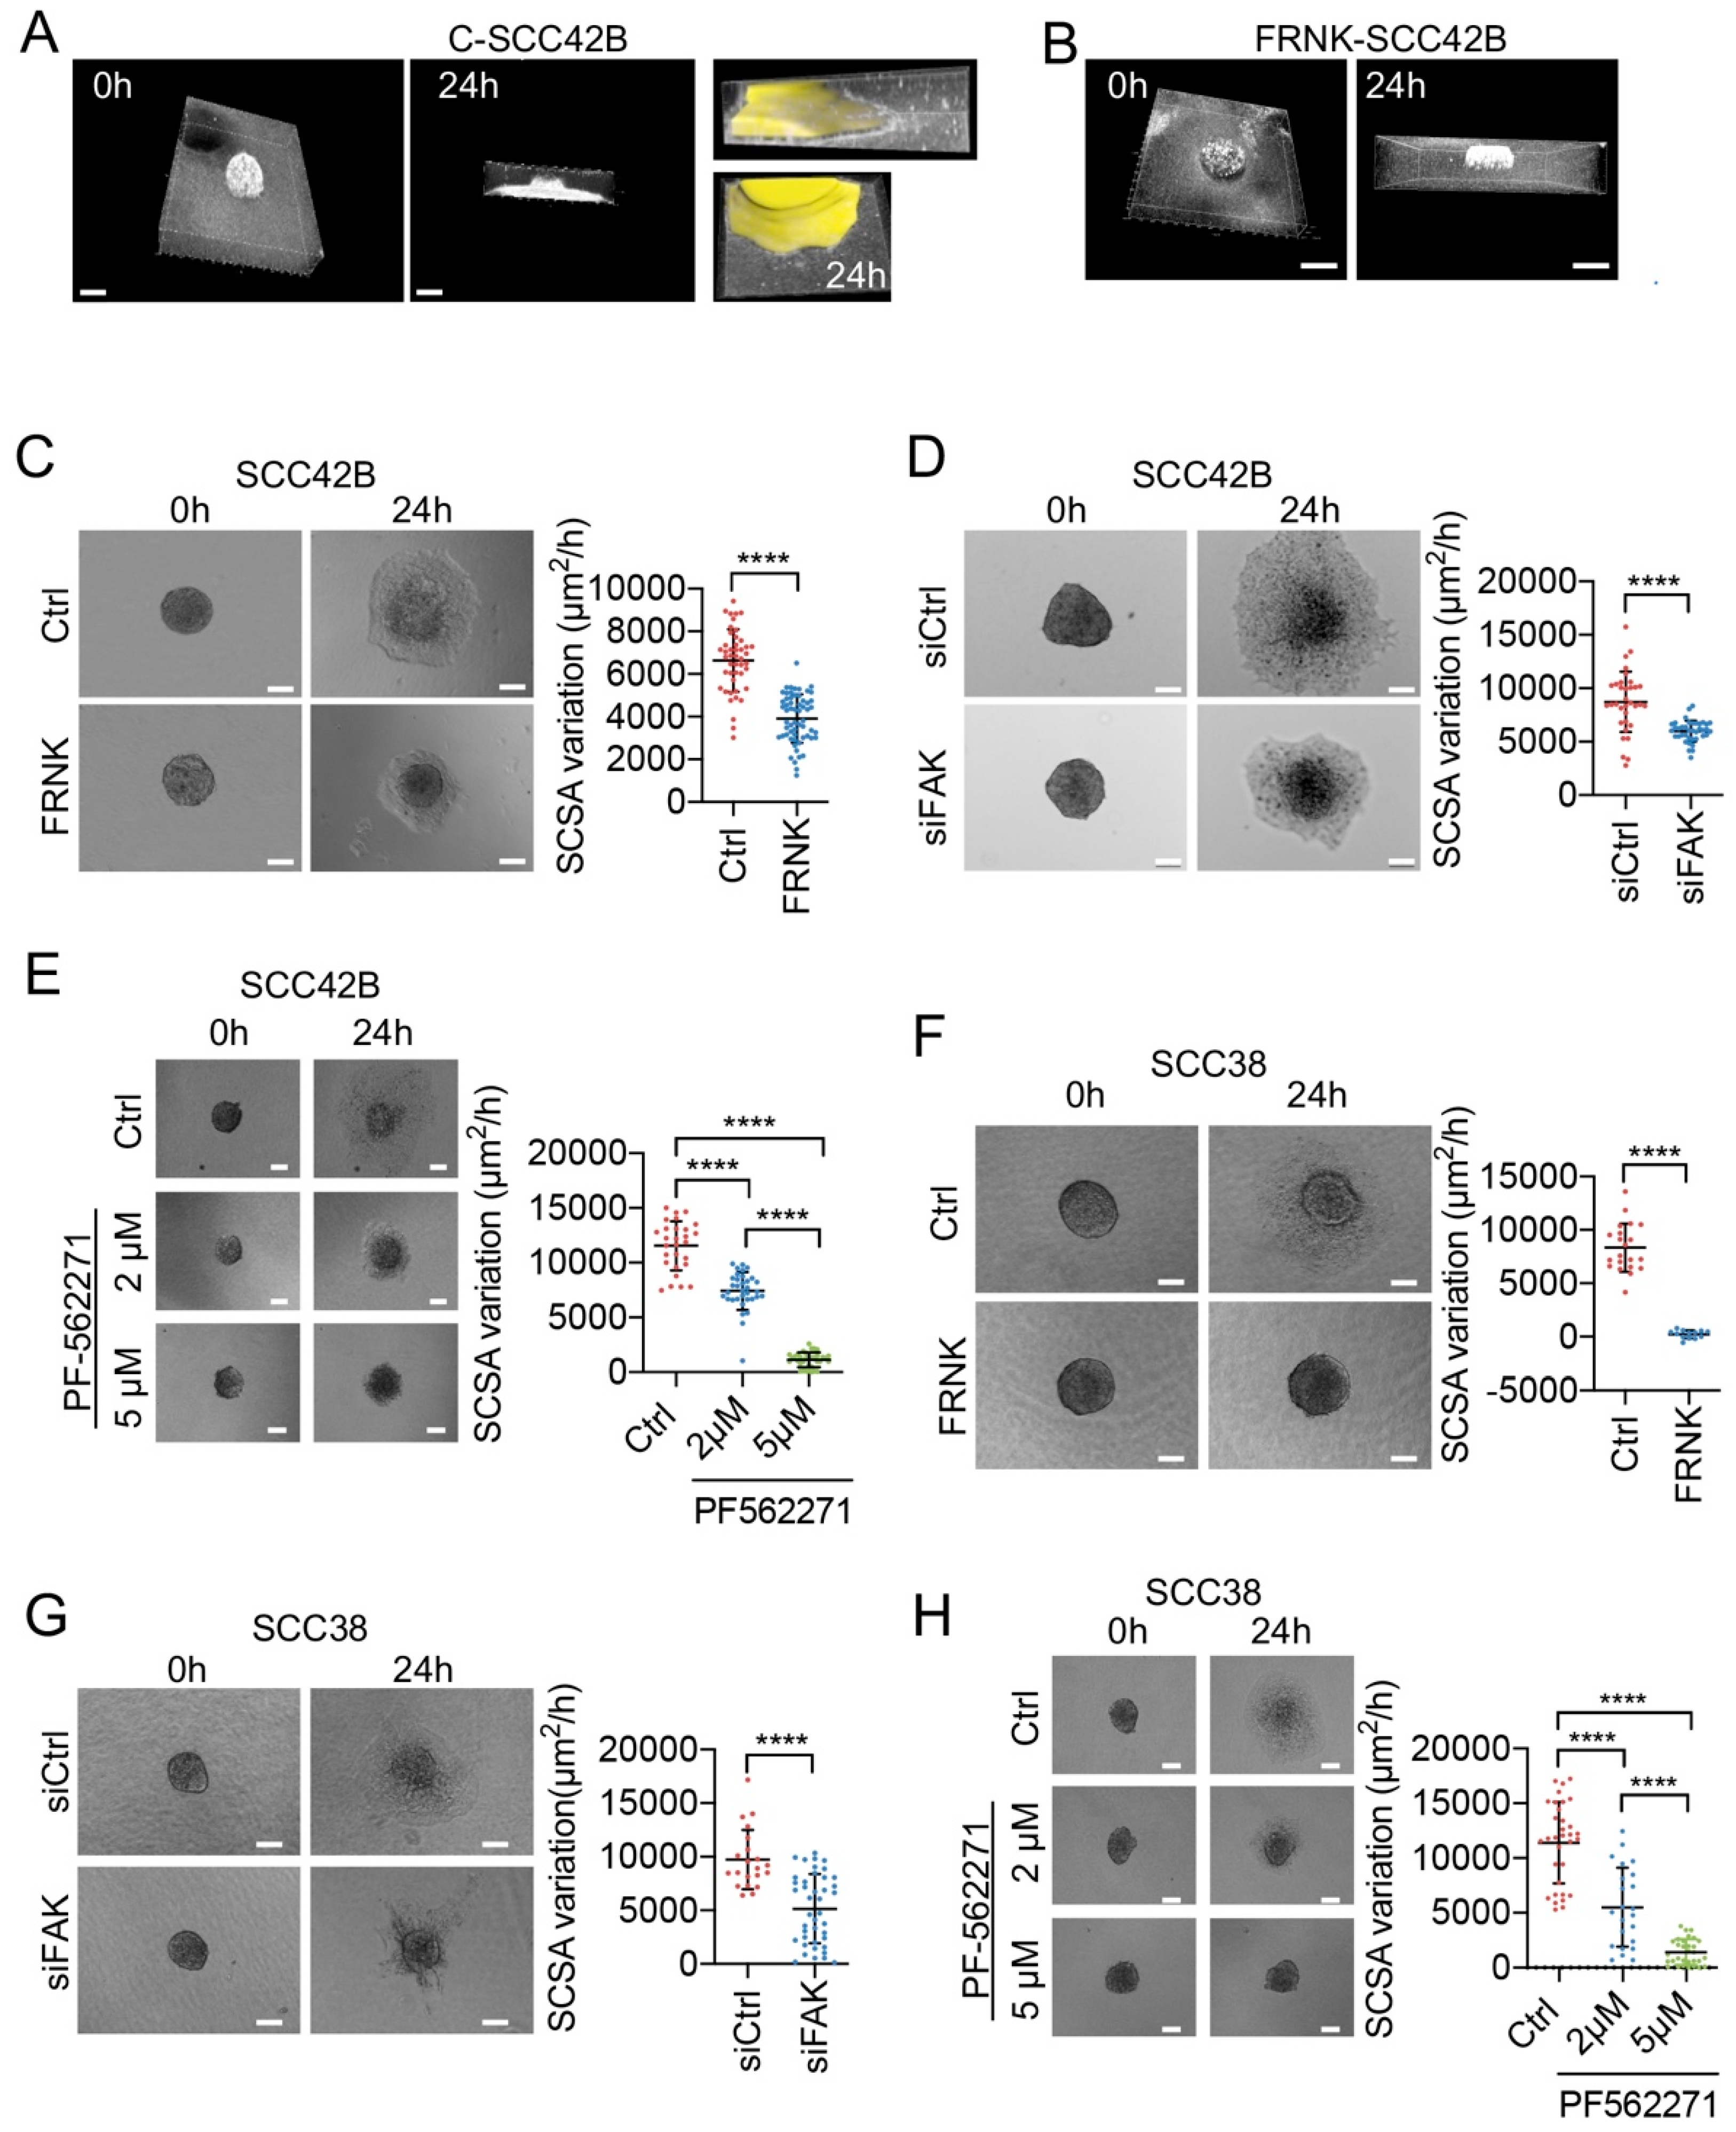
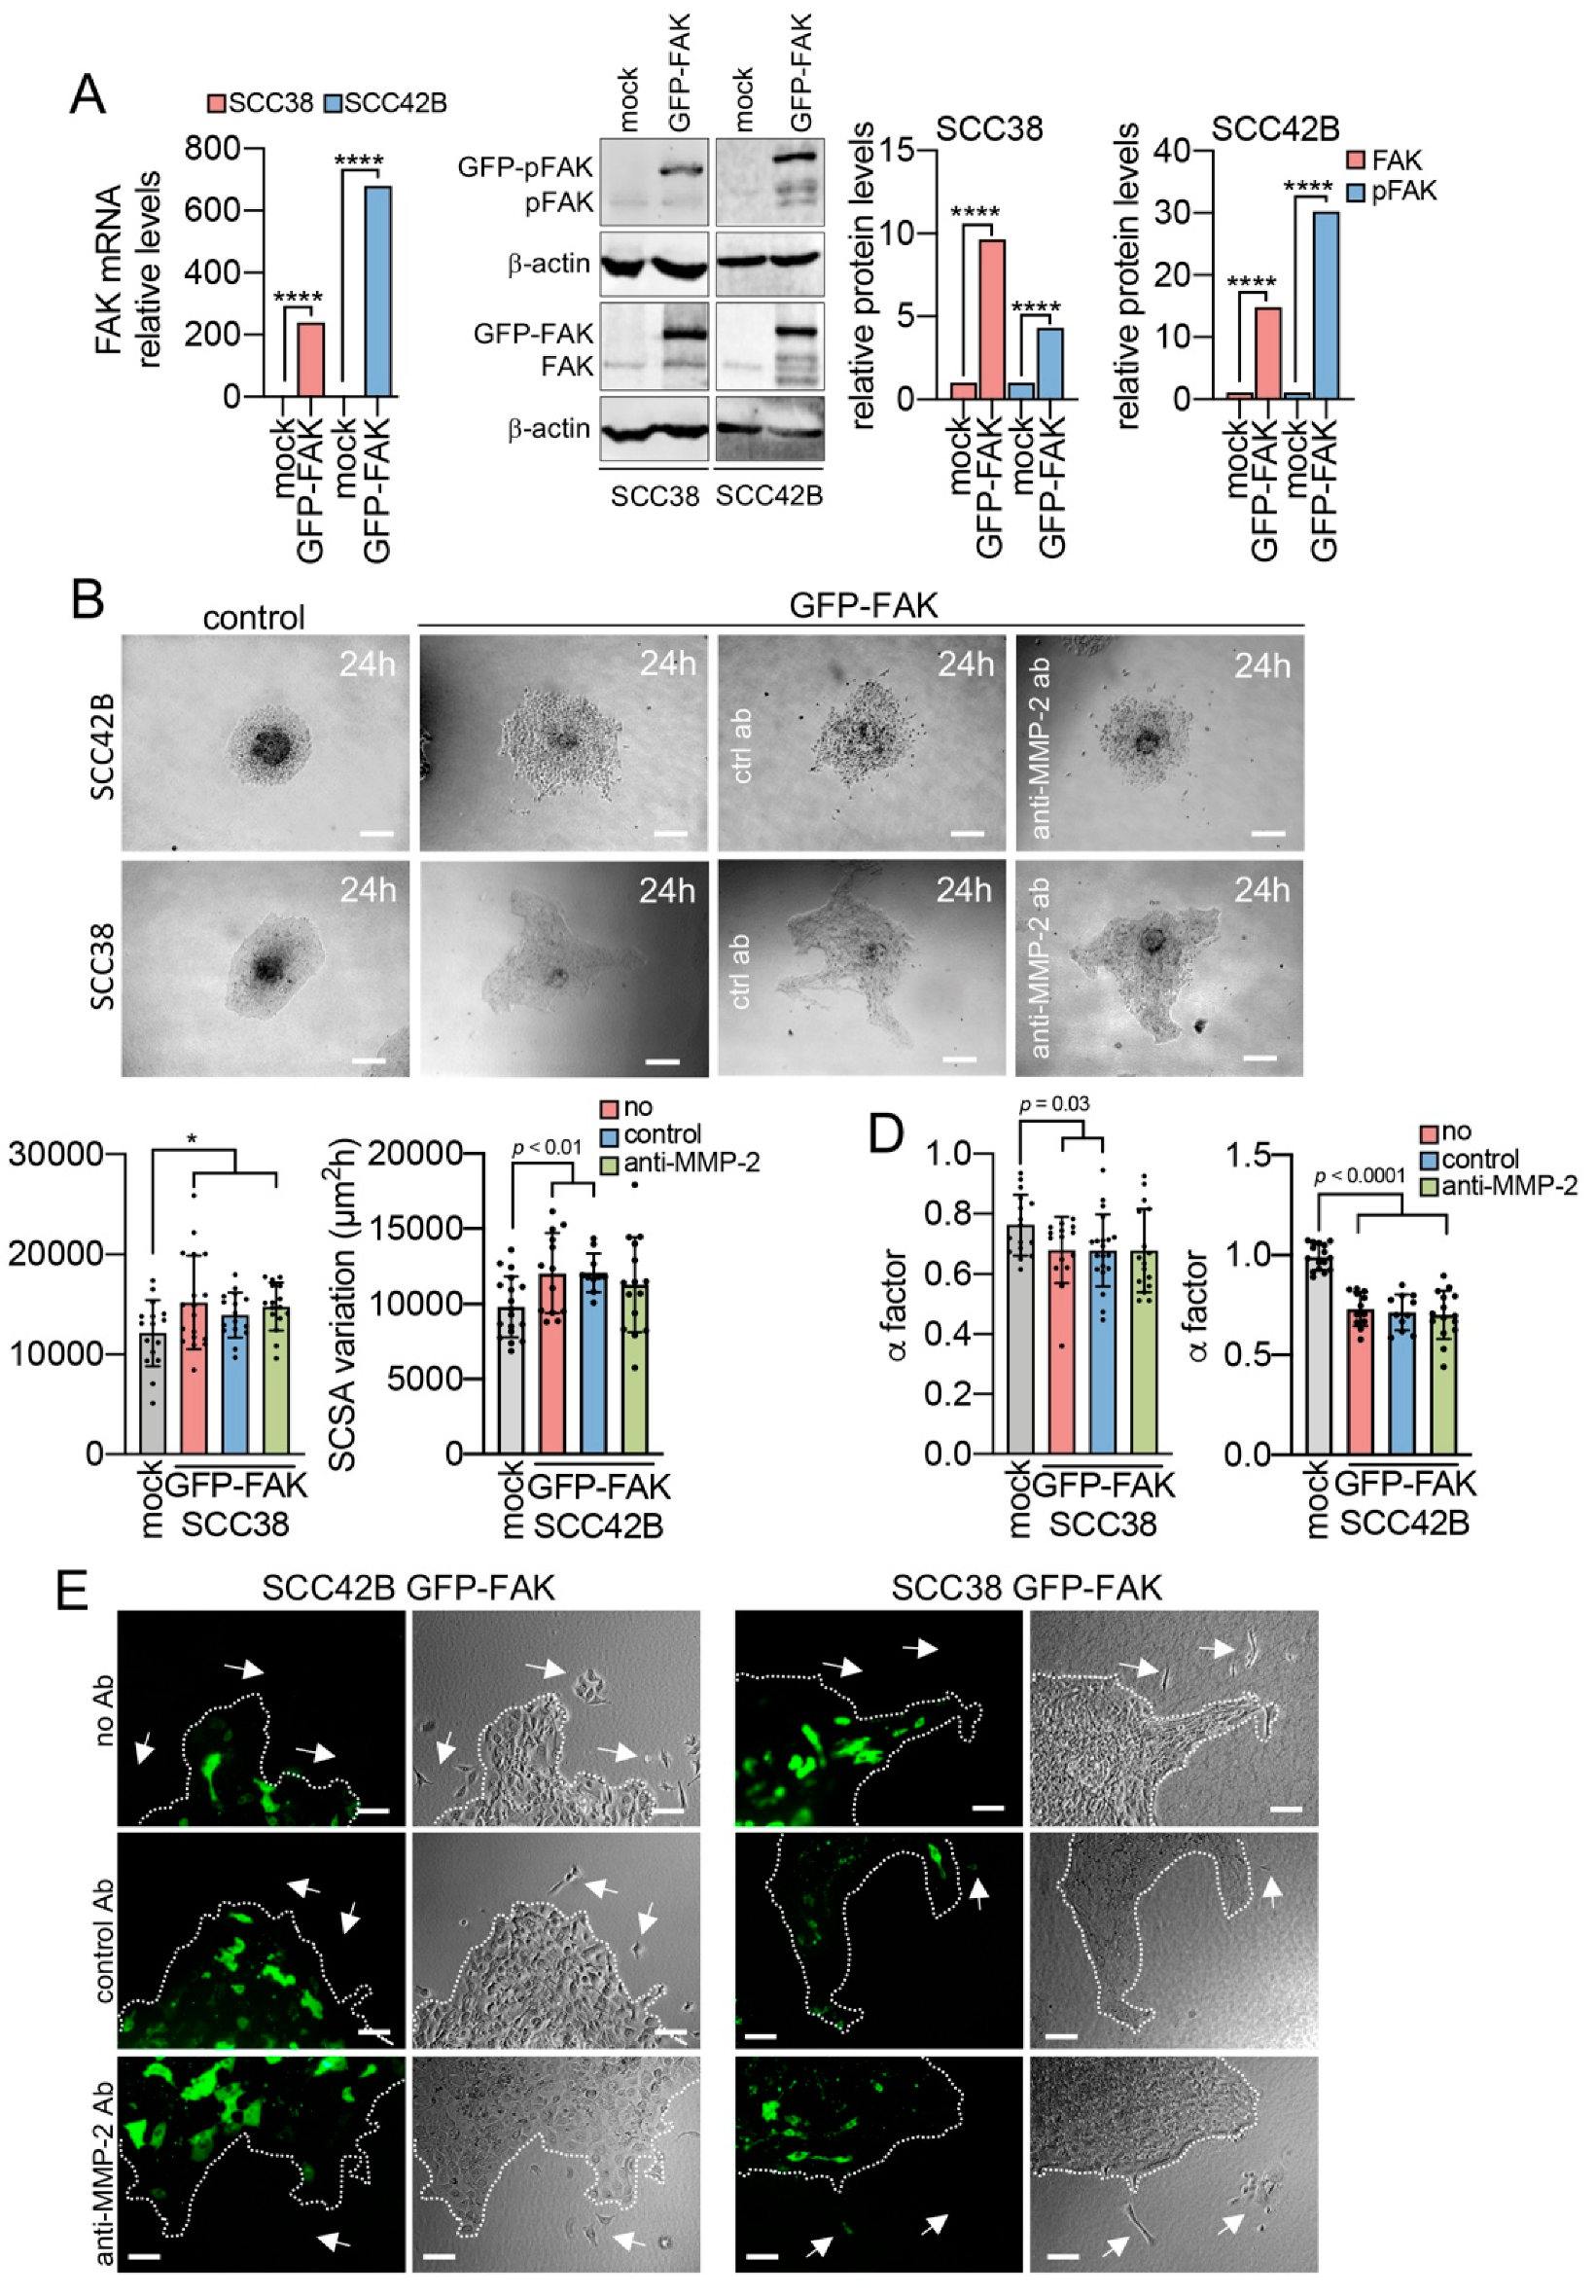
2.1. Modulation of Collective Cell Migration by Focal Adhesion Kinase
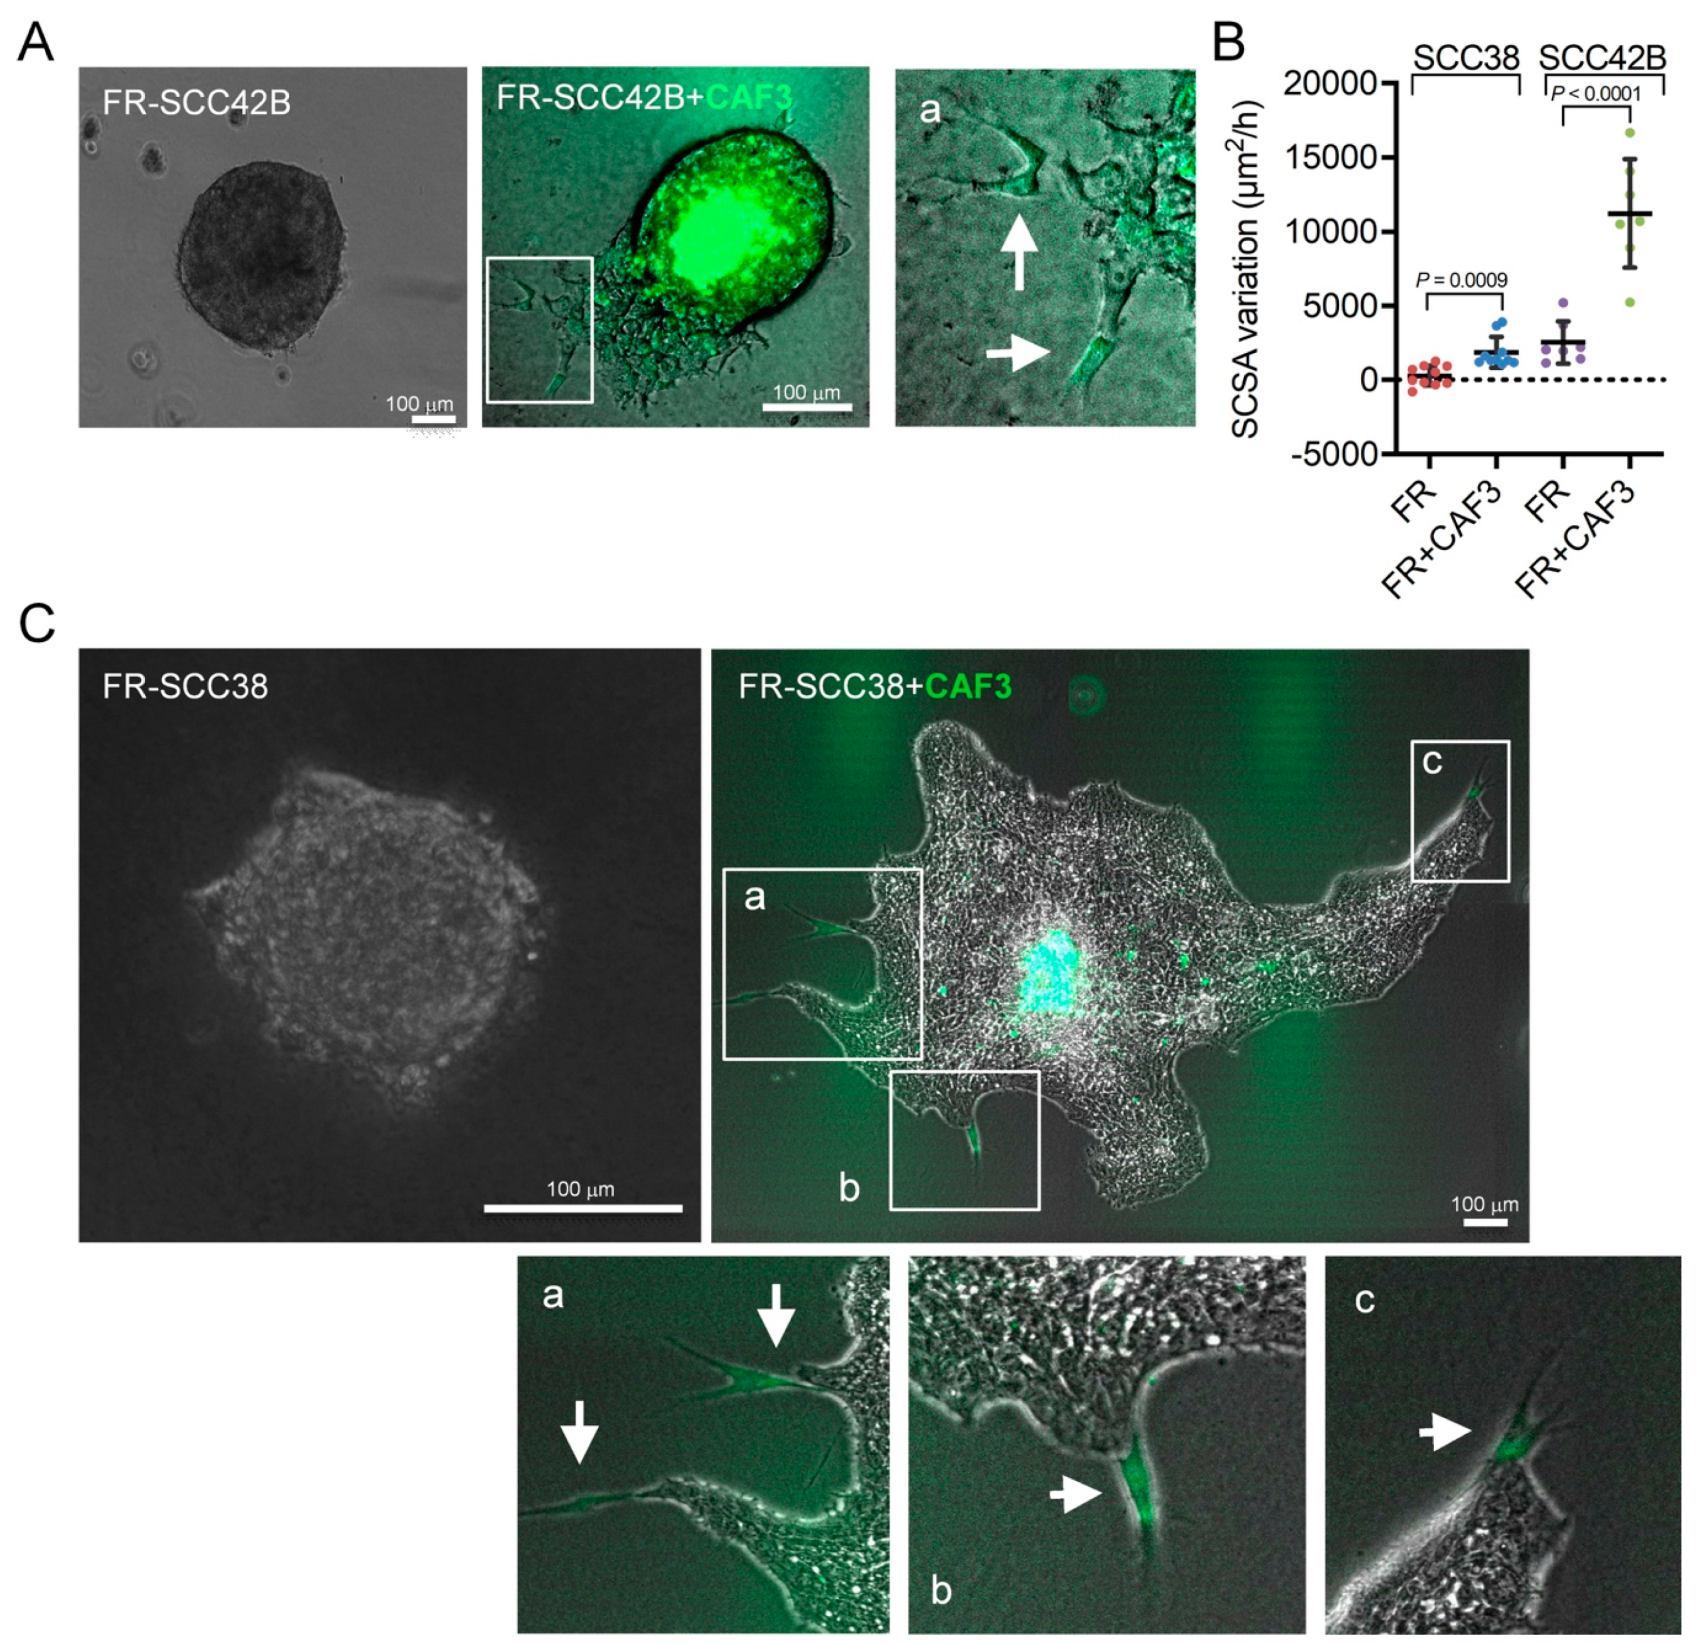
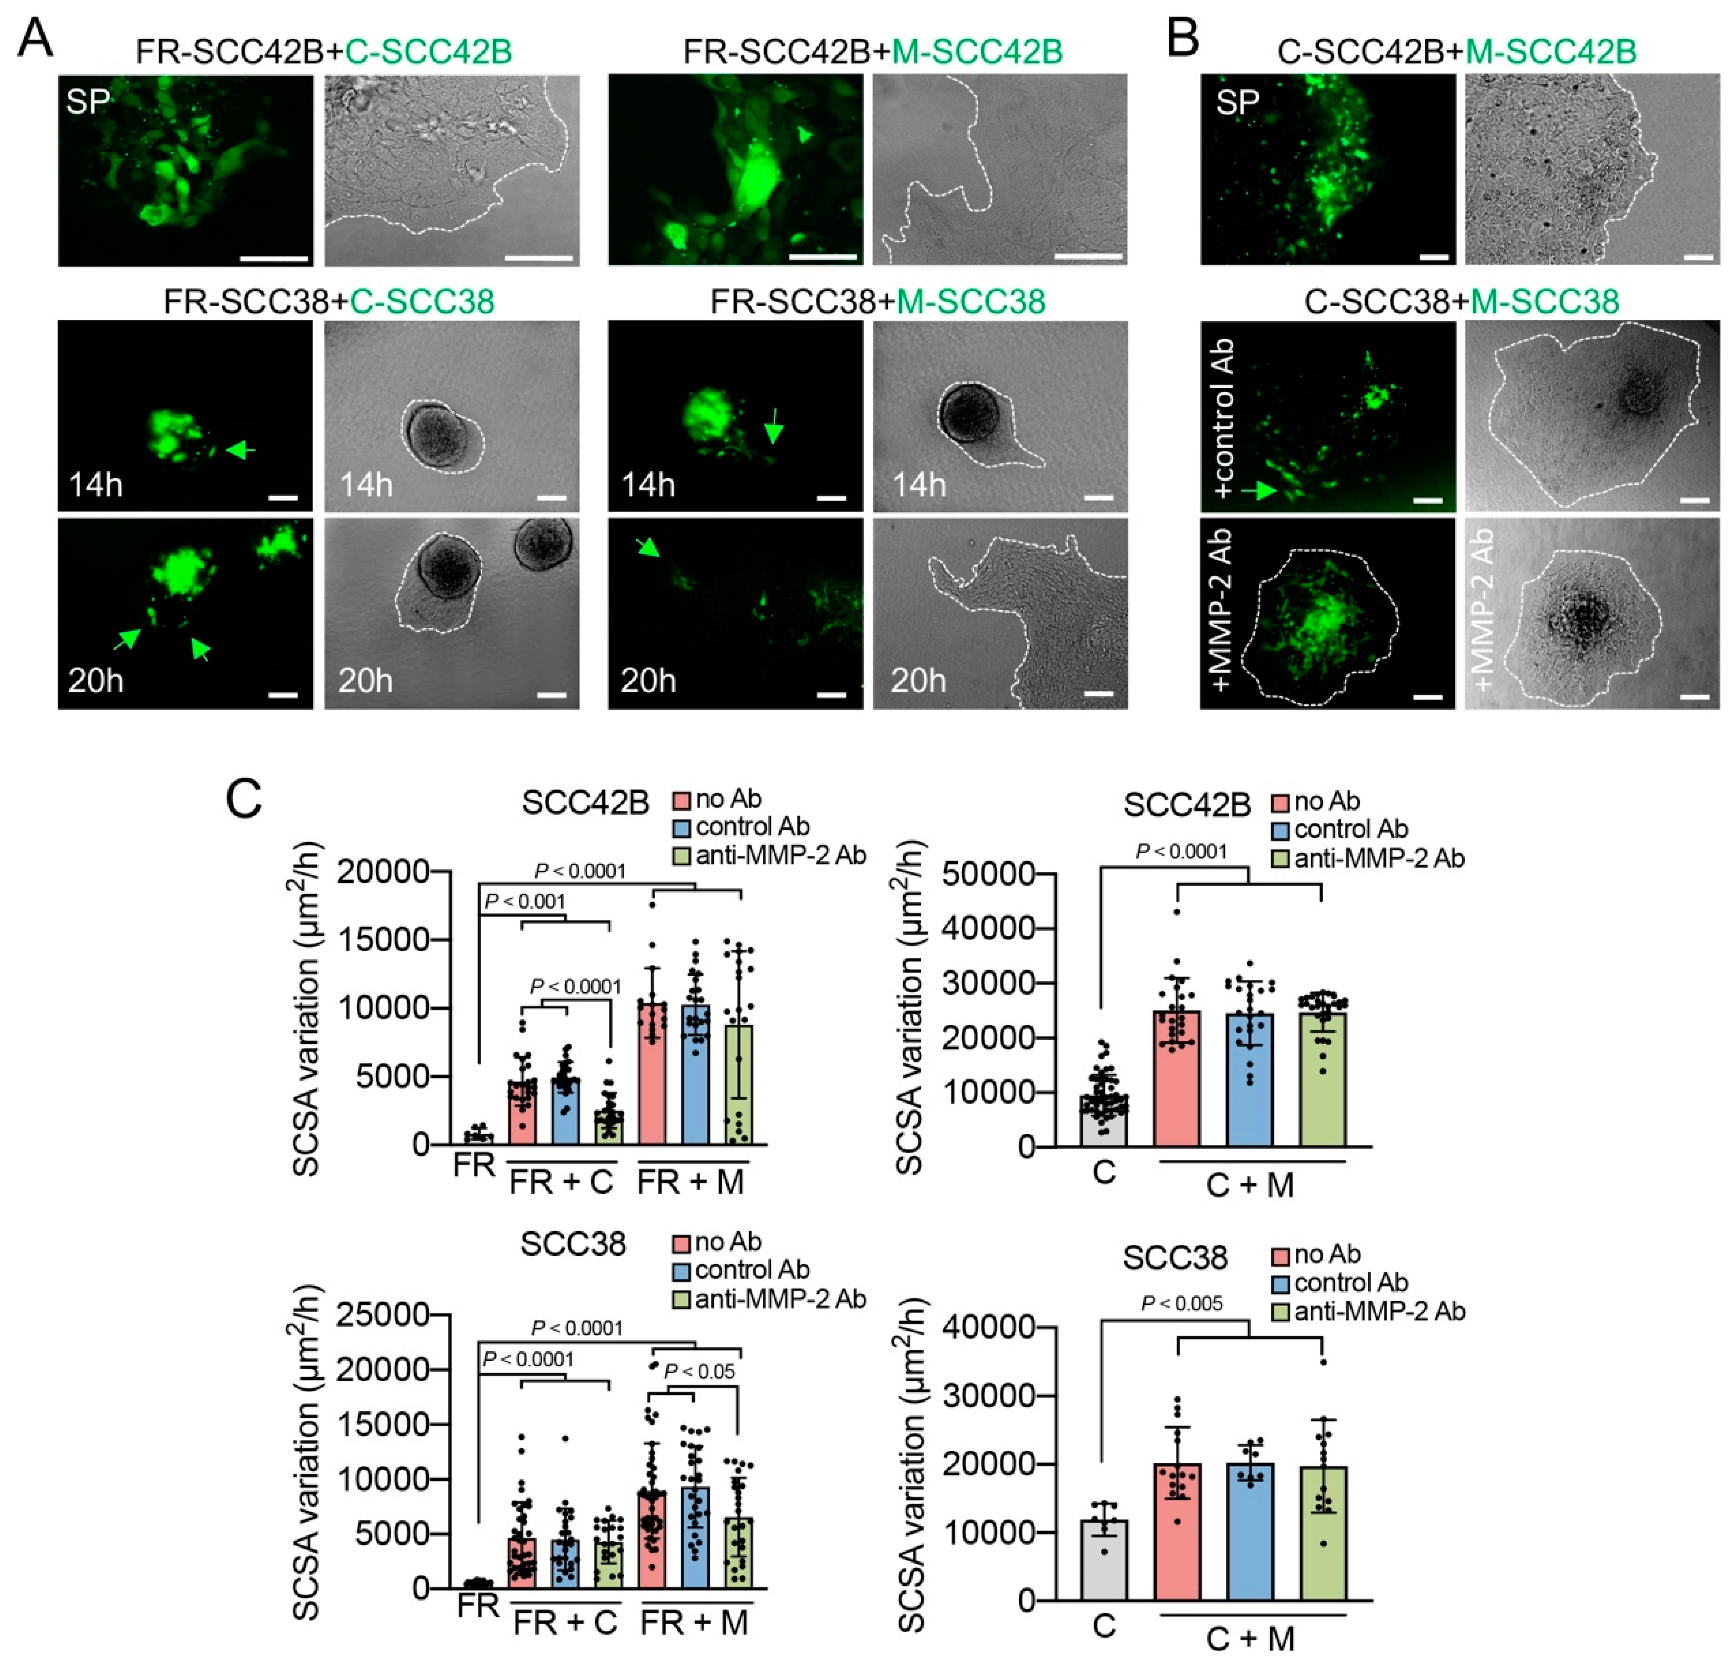
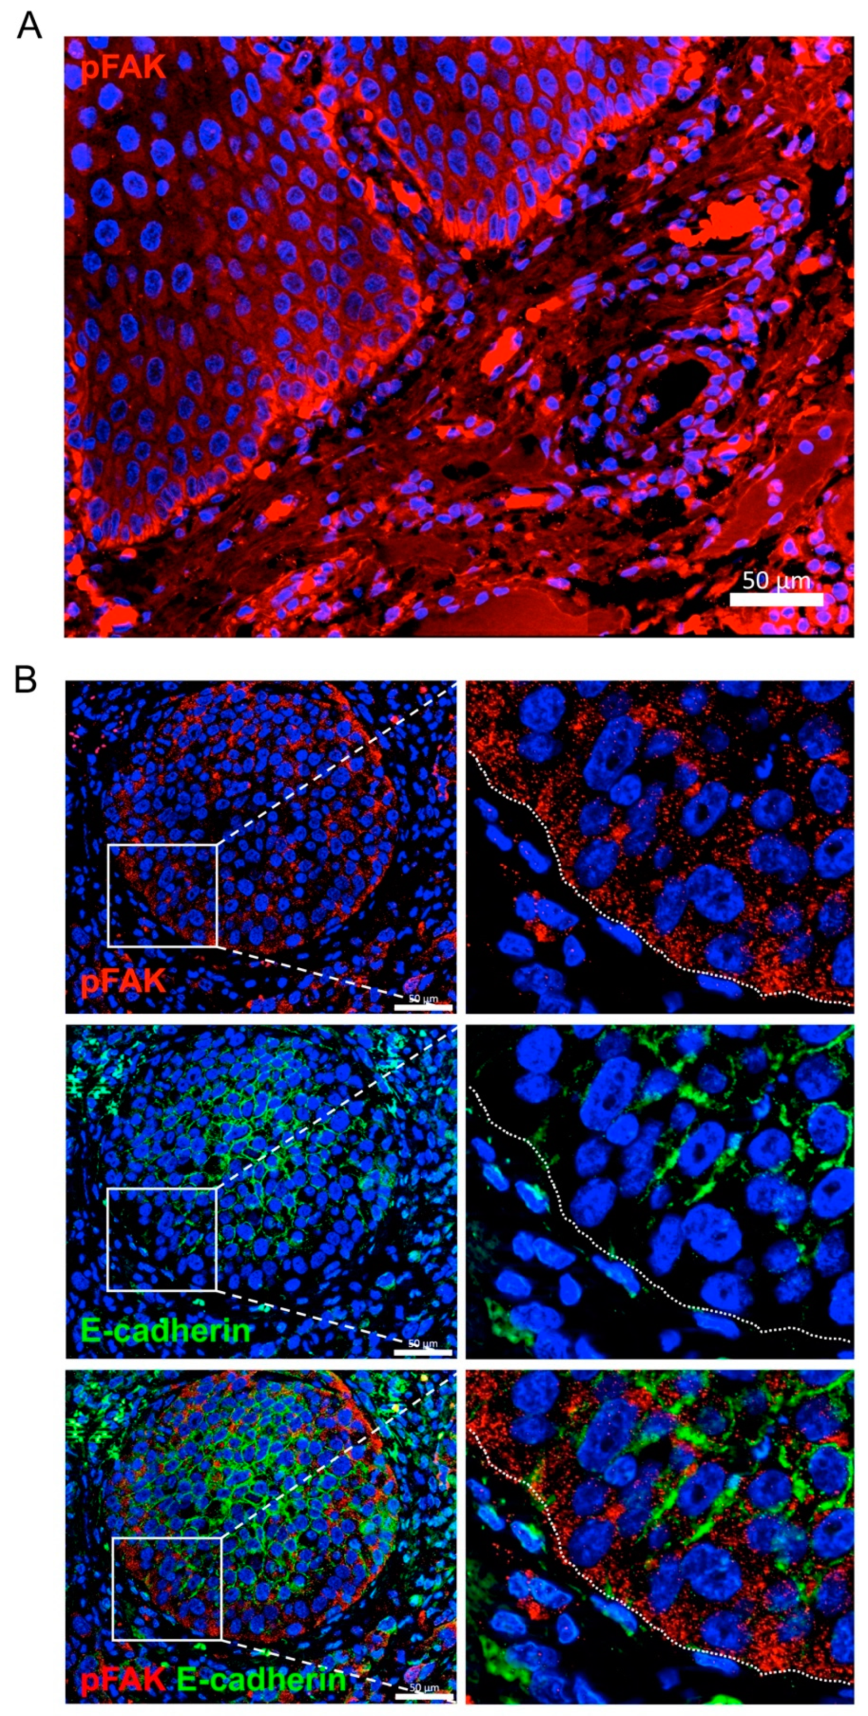
2.2. Cancer-Associated Fibroblasts Derived from Human SCCs Promote and Lead the Invasive Front of FAK-Deficient SCC Cells in an MMP-2 Independent Mode
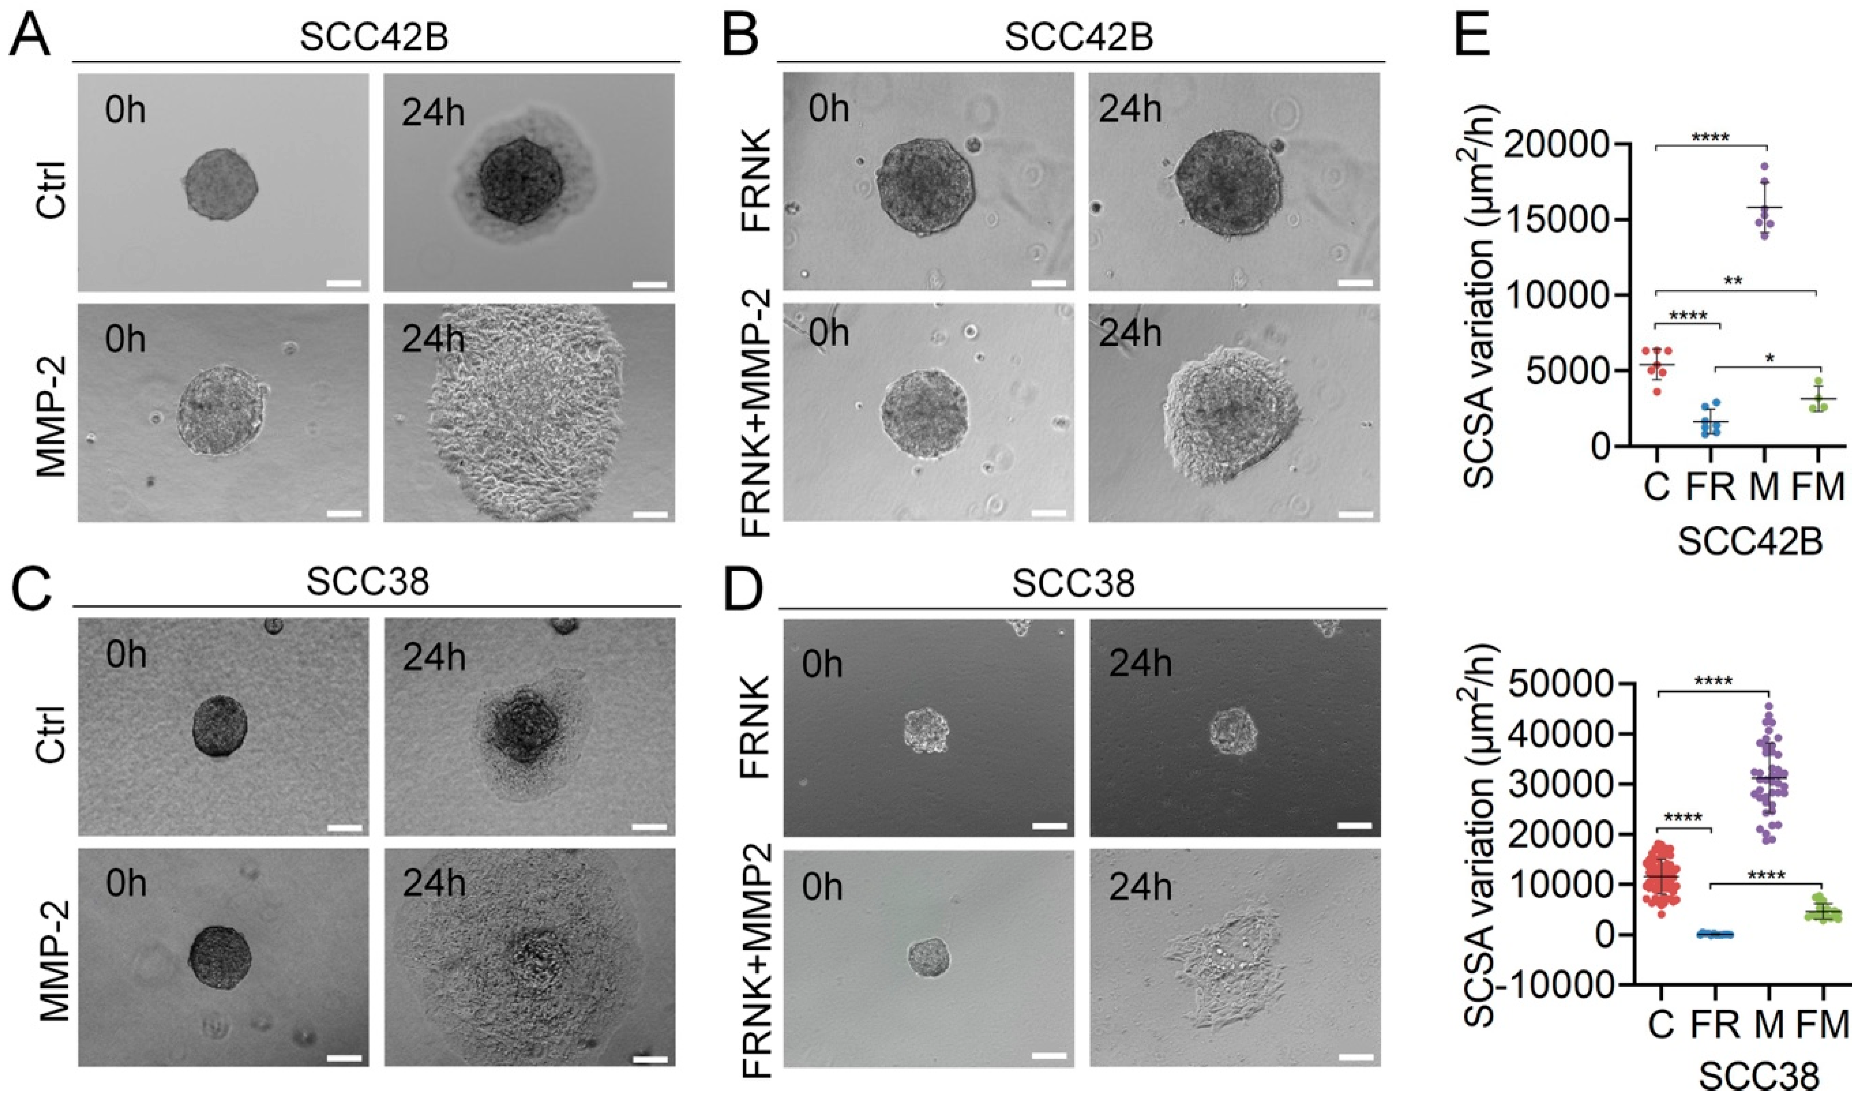
2.3. MMP-2 Promotes Collective Cell Invasion and Counteract the Effect of FAK Inhibition
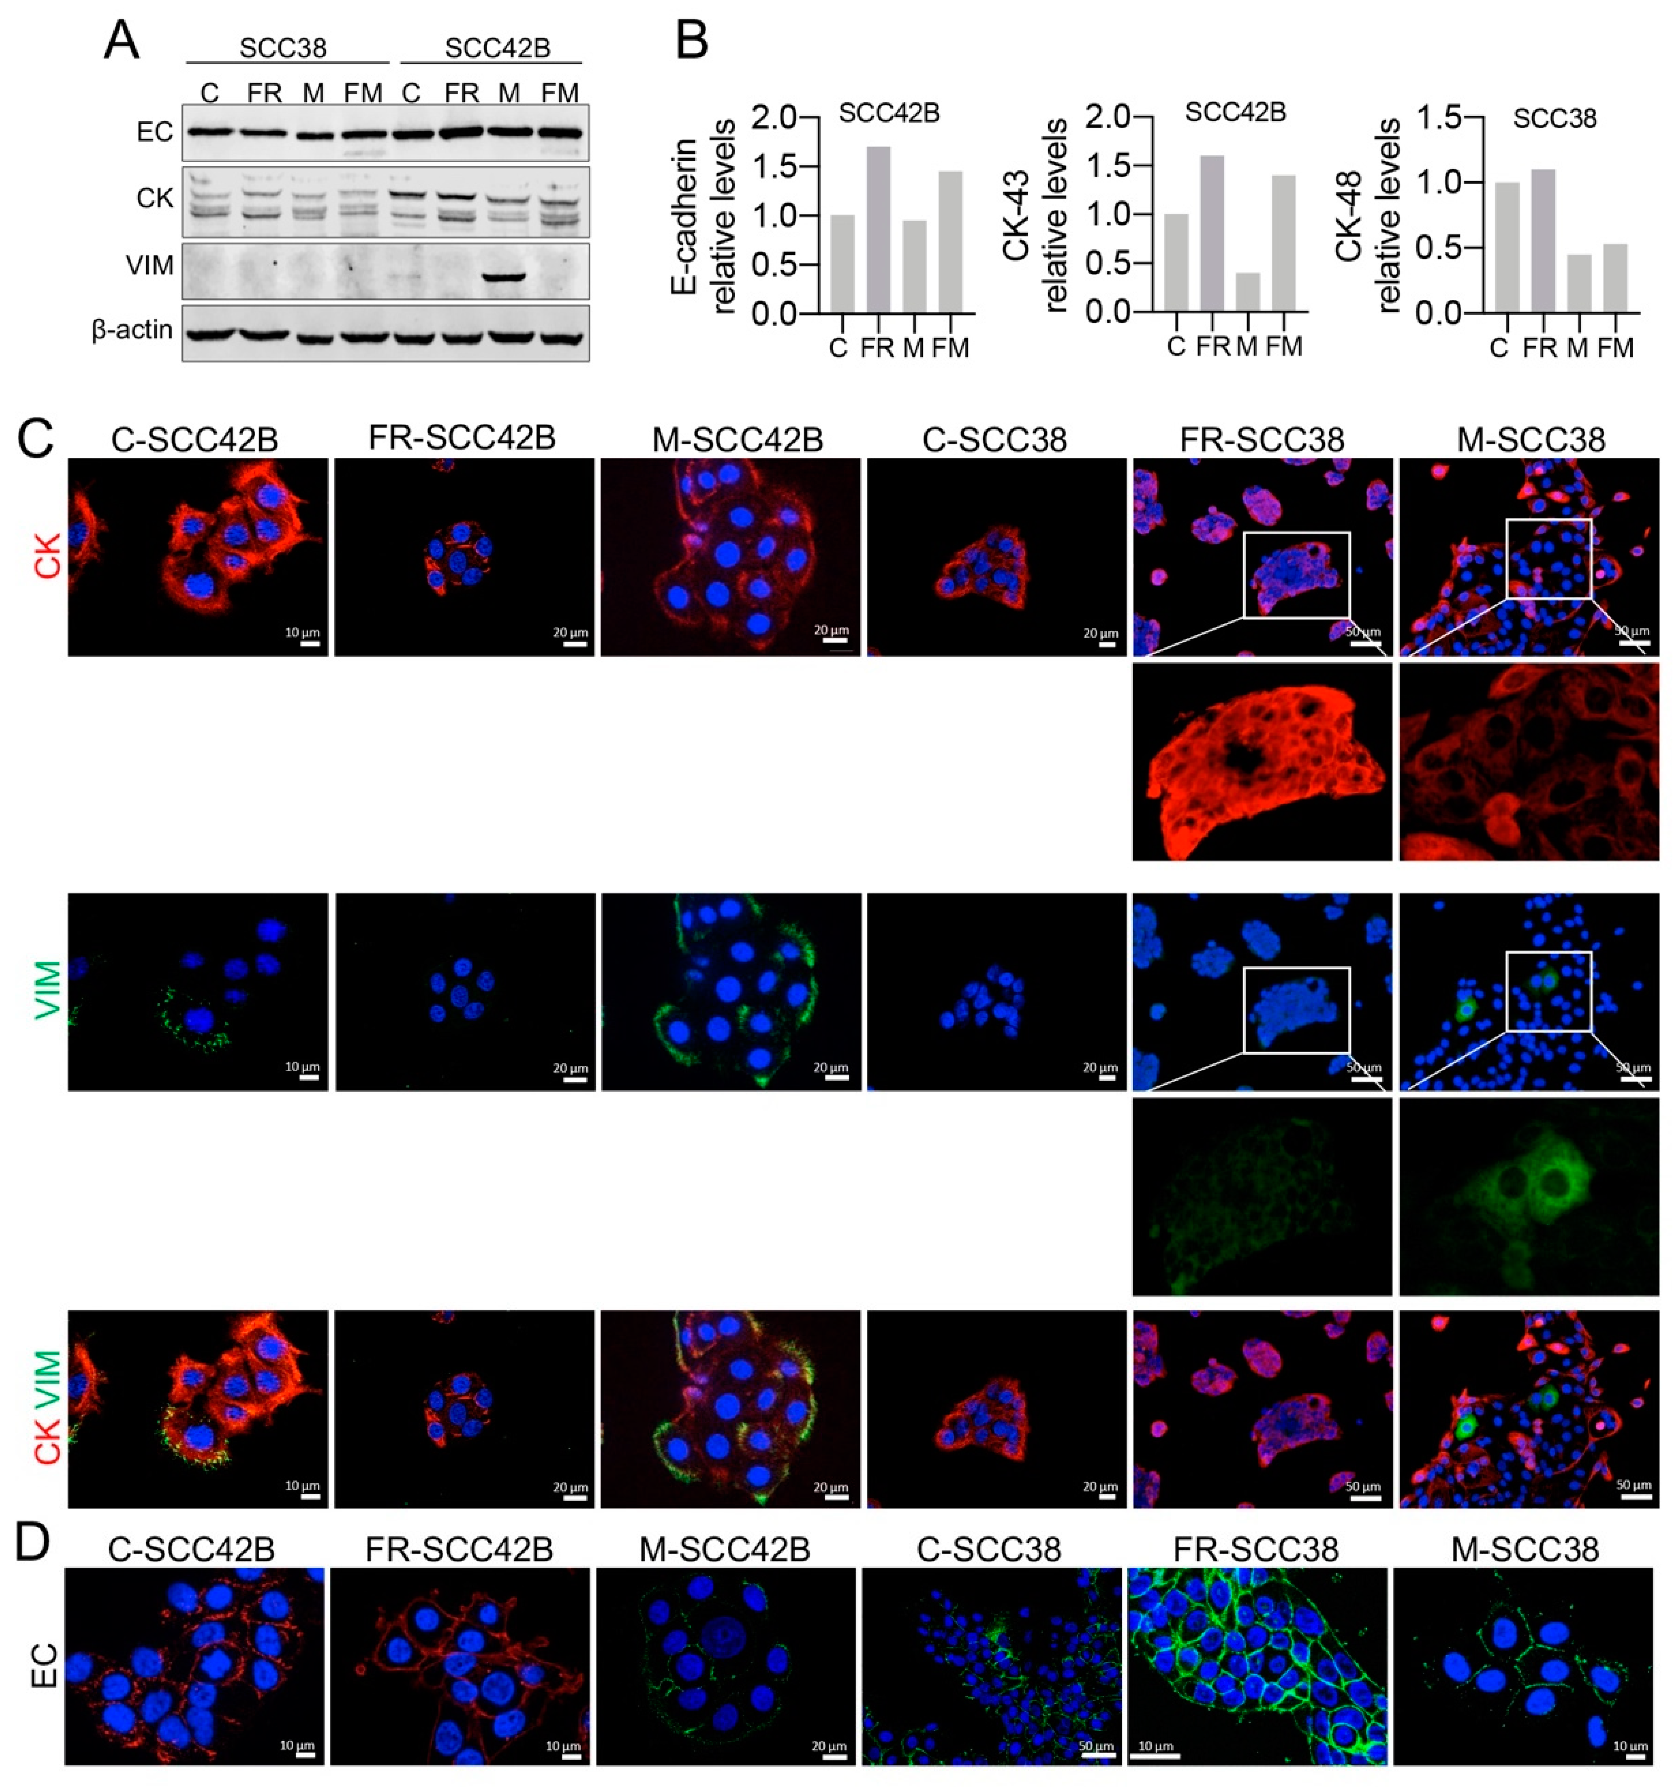
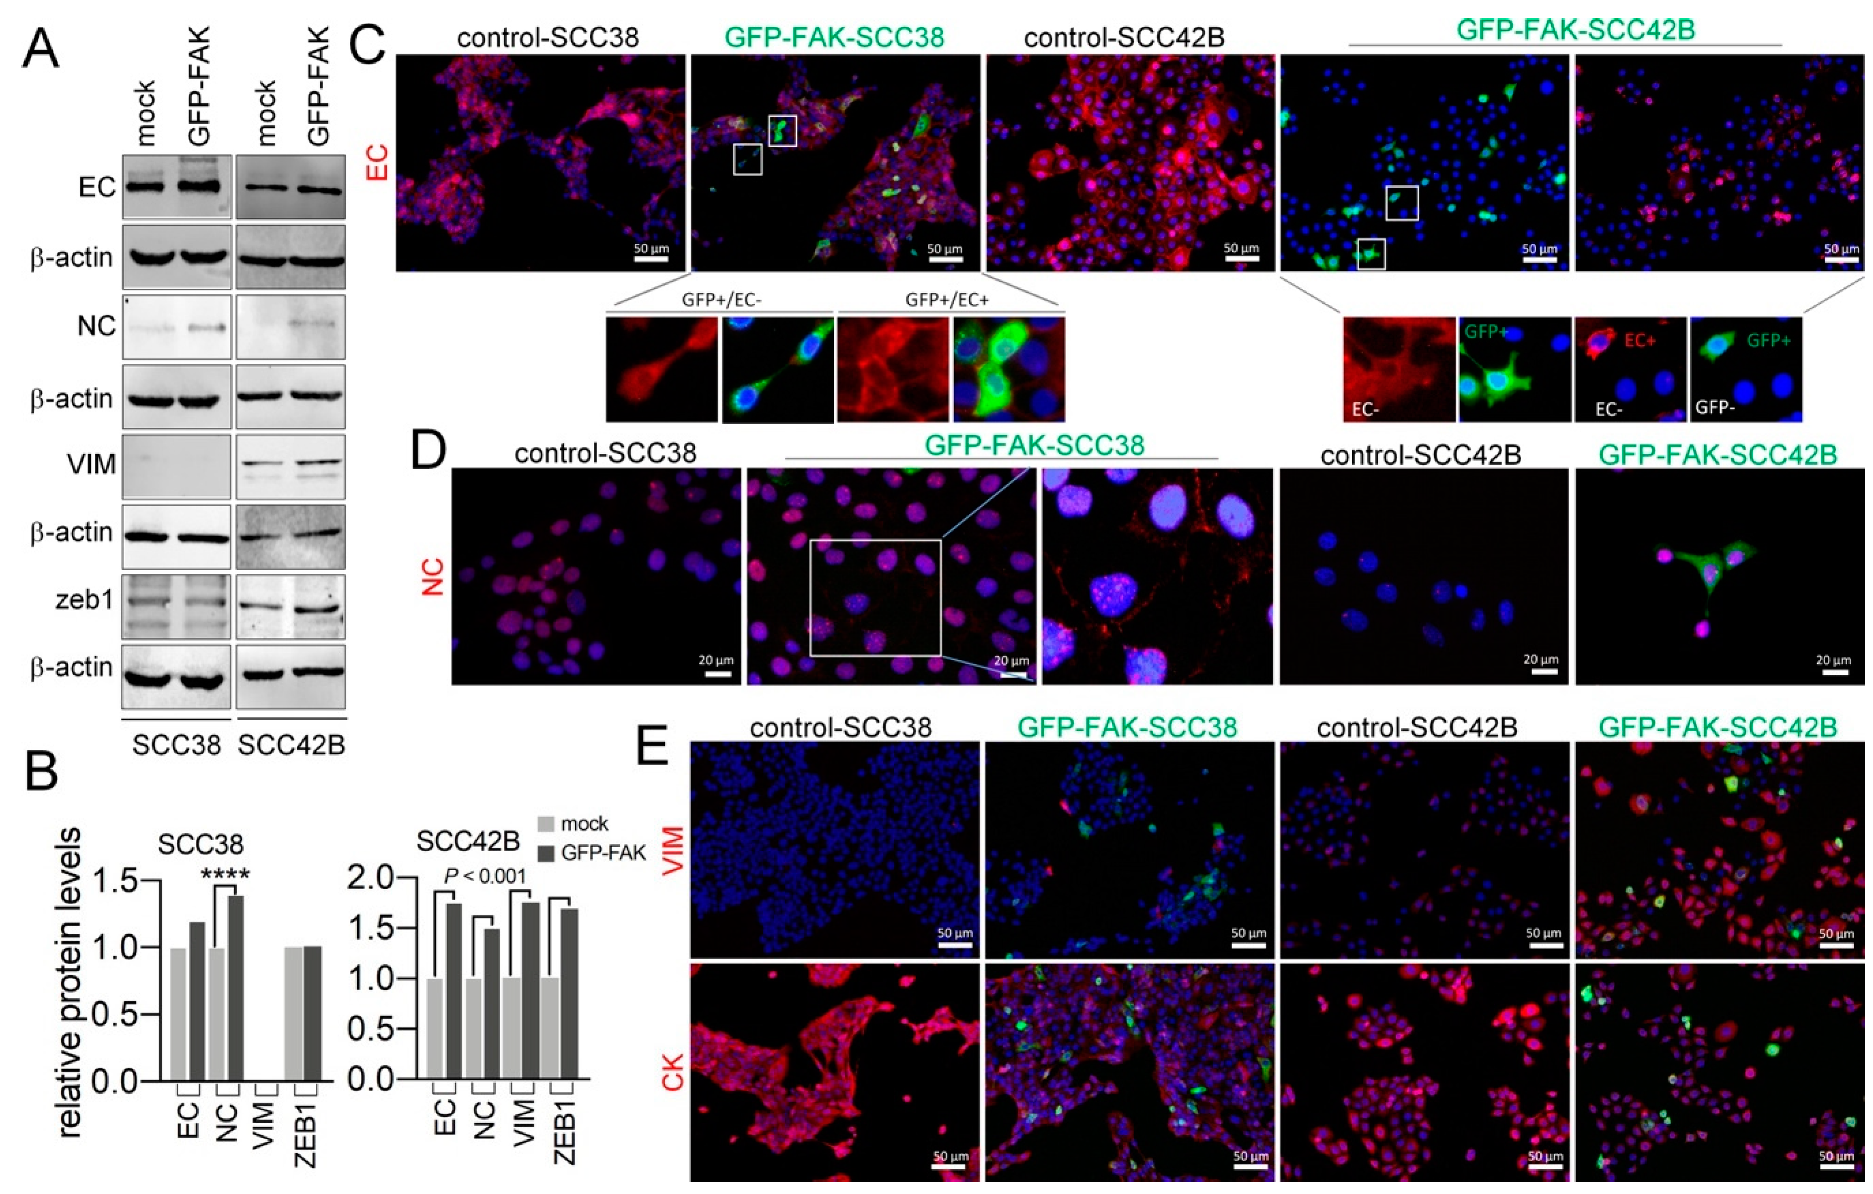
2.4. Cellular Phenotypic Plasticity Associated with FAK Overexpression in SCC Cells
2.5. EMT Plasticity Associated with FAK and MMP-2 Expression
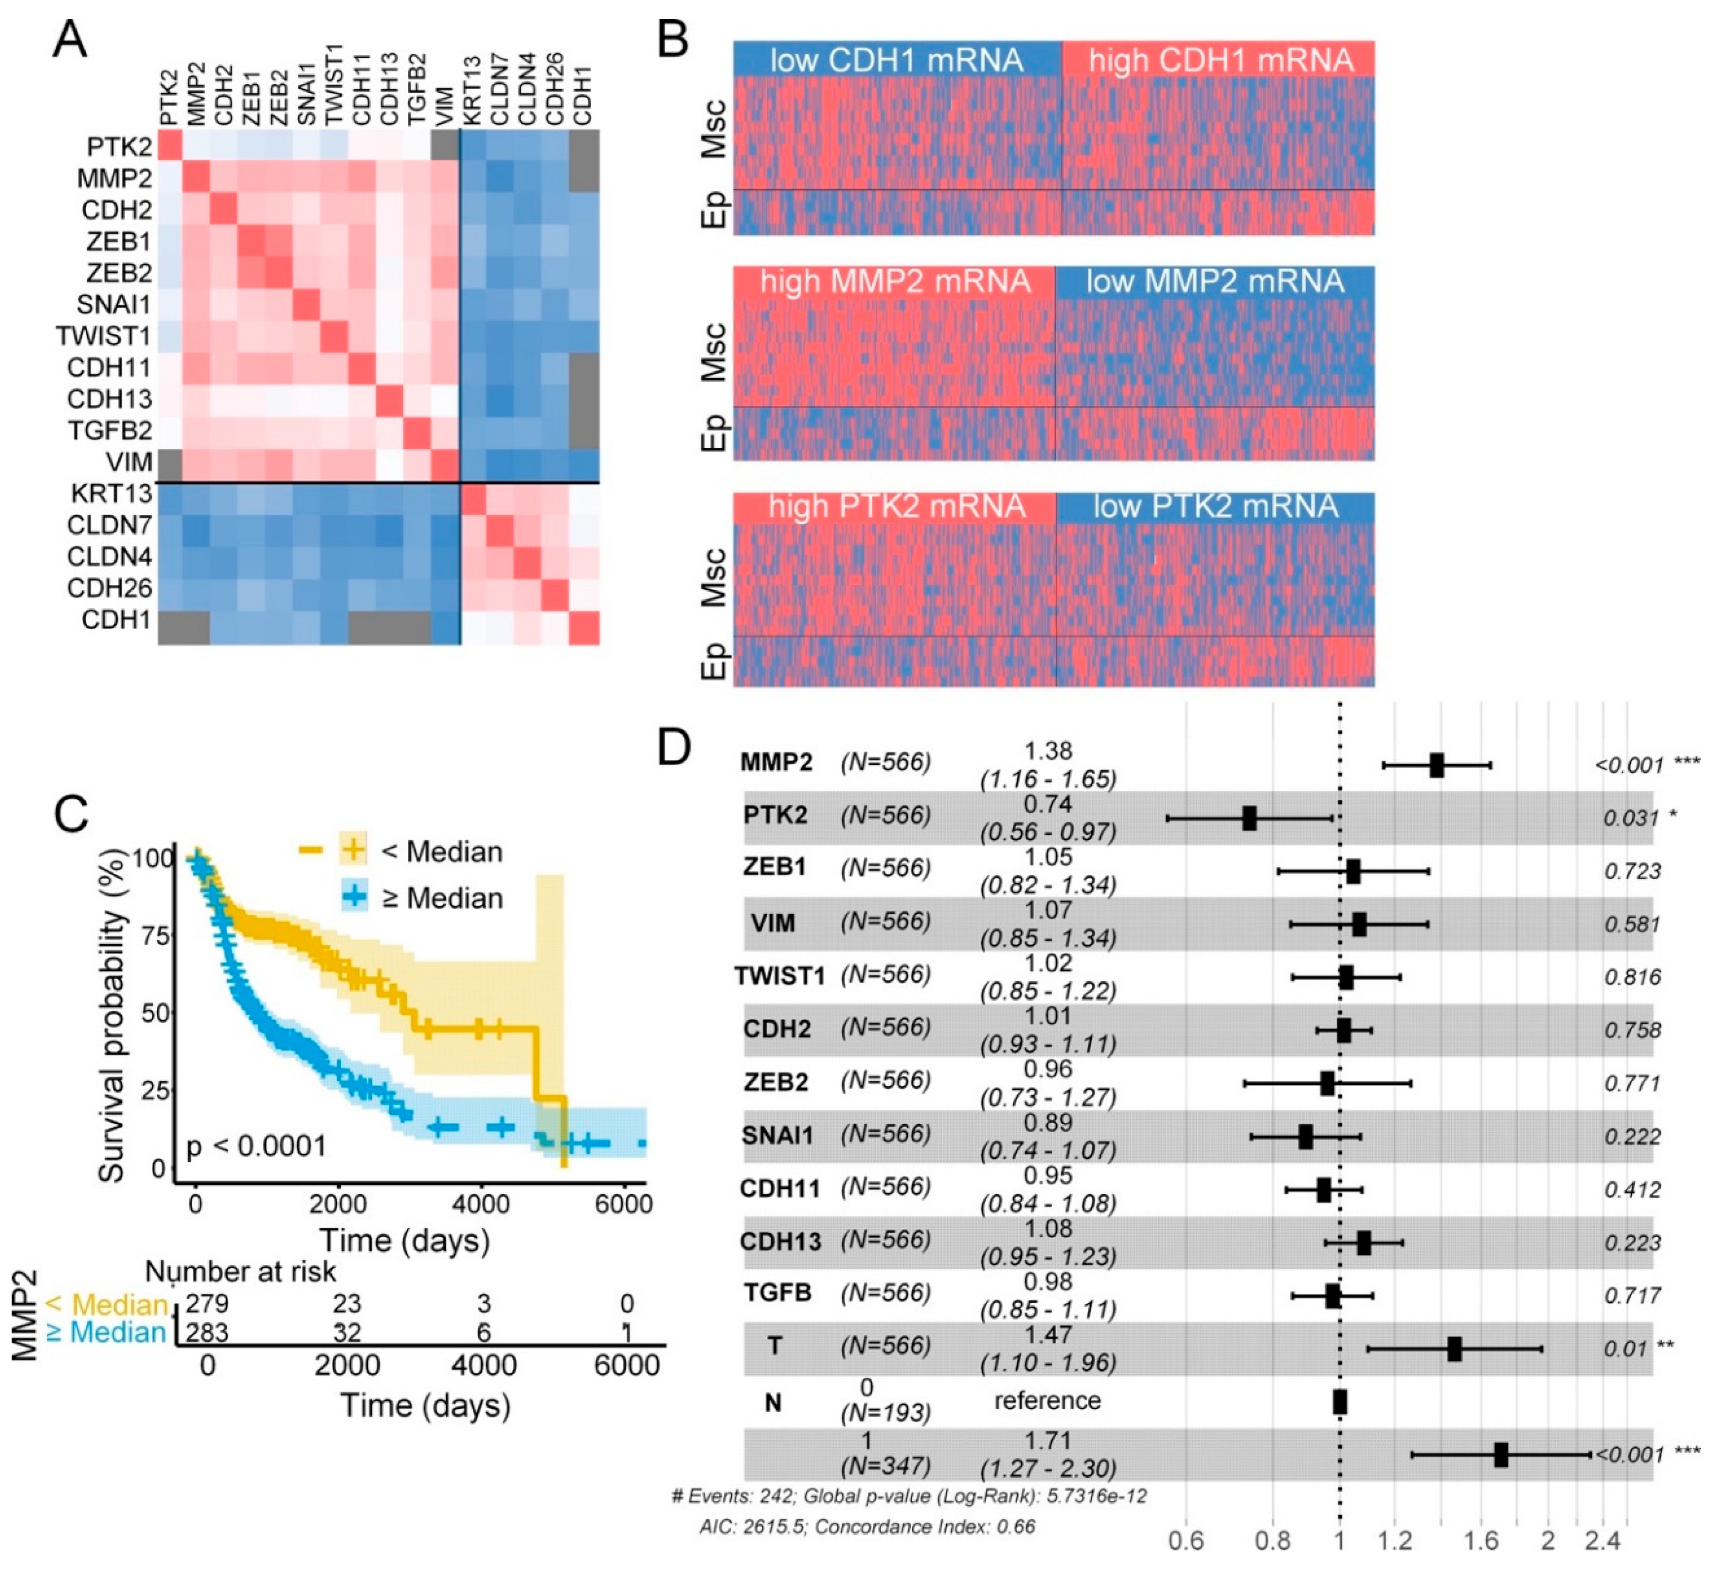
2.6. FAK and MMP-2 mRNA Expression in Head and Neck SCC and Clinicopathologic Variables
3. Discussion
4. Materials and Methods
4.1. Cell Culture, Transfections and Treatments
4.2. Reverse Transcription and qPCR
4.3. Multicellular-Spheres Generation and Migration Analysis
4.4. Immunohistochemistry and Immunofluorescence
4.5. Western Blot
4.6. Time-Lapse and Confocal Reflection Microscopy
4.7. Statistical Analysis
5. Conclusions
Supplementary Materials
Author Contributions
Funding
Acknowledgments
Conflicts of Interest
References
- Friedl, P.; Locker, J.; Sahai, E.; Segall, J.E. Classifying collective cancer cell invasion. Nat. Cell Biol. 2012, 14, 777–783. [Google Scholar] [CrossRef] [PubMed]
- Nieto, M.A.; Huang, R.Y.-J.; Jackson, R.A.; Thiery, J.P. EMT: 2016. Cell 2016, 166, 21–45. [Google Scholar] [CrossRef] [Green Version]
- Ilina, O.; Friedl, P. Mechanisms of collective cell migration at a glance. J. Cell Sci. 2009, 122, 3203–3208. [Google Scholar] [CrossRef] [PubMed] [Green Version]
- Friedl, P.; Mayor, R. Tuning collective cell migration by cell-cell junction regulation. Cold Spring Harb. Perspect. Biol. 2017, 9, a029199. [Google Scholar] [CrossRef] [Green Version]
- De Pascalis, C.; Etienne-Manneville, S. Single and collective cell migration: The mechanics of adhesions. Mol. Biol. Cell 2017, 28, 1833–1846. [Google Scholar] [CrossRef] [PubMed]
- Wolf, K.; Wu, Y.I.; Liu, Y.; Geiger, J.; Tam, E.; Overall, C.; Stack, M.S.; Friedl, P. Multi-step pericellular proteolysis controls the transition from individual to collective cancer cell invasion. Nat. Cell Biol. 2007, 9, 893–904. [Google Scholar] [CrossRef]
- Clark, A.G.; Vignjevic, D.M. Modes of cancer cell invasion and the role of the microenvironment. Curr. Opin. Cell Biol. 2015, 36, 13–22. [Google Scholar] [CrossRef] [Green Version]
- Kumar, S.; Kapoor, A.; Desai, S.; Inamdar, M.M.; Sen, S. Proteolytic and non-proteolytic regulation of collective cell invasion: Tuning by ECM density and organization. Sci. Rep. 2016, 6, 19905. [Google Scholar] [CrossRef] [Green Version]
- Kleinschmidt, E.G.; Schlaepfer, D.D. Focal adhesion kinase signaling in unexpected places. Curr. Opin. Cell Biol. 2017, 45, 24–30. [Google Scholar] [CrossRef] [Green Version]
- Nabeshima, K.; Inoue, T.; Shimao, Y.; Okada, Y.; Itoh, Y.; Seiki, M.; Koono, M. Front-cell-specific expression of membrane-type 1 matrix metalloproteinase and gelatinase A during cohort migration of colon carcinoma cells induced by hepatocyte growth factor/scatter factor. Cancer Res. 2000, 60, 3364–3369. [Google Scholar]
- Lim, Y.; Lim, S.T.; Tomar, A.; Gardel, M.; Bernard-Trifilo, J.A.; Chen, X.L.; Uryu, S.A.; Canete-Soler, R.; Zhai, J.; Lin, H.; et al. PyK2 and FAK connections to p190Rho guanine nucleotide exchange factor regulate RhoA activity, focal adhesion formation, and cell motility. J. Cell Biol. 2008, 180, 187–203. [Google Scholar] [CrossRef] [PubMed] [Green Version]
- Hauck, C.R.; Hsia, D.A.; Puente, X.S.; Cheresh, D.A.; Schlaepfer, D.D. FRNK blocks v-Src-stimulated invasion and experimental metastases without effects on cell motility or growth. EMBO J. 2002, 21, 6289–6302. [Google Scholar] [CrossRef] [PubMed] [Green Version]
- Canel, M.; Secades, P.; Garzón-Arango, M.; Allonca, E.; Suarez, C.; Serrels, A.; Frame, M.; Brunton, V.; Chiara, M.D. Involvement of focal adhesion kinase in cellular invasion of head and neck squamous cell carcinomas via regulation of MMP-2 expression. Br. J. Cancer 2008, 98, 1274–1284. [Google Scholar] [CrossRef] [PubMed] [Green Version]
- Bjerke, M.A.; Dzamba, B.J.; Wang, C.; DeSimone, D.W. FAK is required for tension-dependent organization of collective cell movements in Xenopus mesendoderm. Dev. Biol. 2014, 394, 340–356. [Google Scholar] [CrossRef] [PubMed] [Green Version]
- Li, X.Y.; Zhou, X.; Rowe, R.G.; Hu, Y.; Schlaepfer, D.D.; Ilić, D.; Dressler, G.; Park, A.; Guan, J.L.; Weiss, S.J. Snail1 controls epithelial-mesenchymal lineage commitment in focal adhesion kinase-null embryonic cells. J. Cell Biol. 2011, 195, 729–738. [Google Scholar] [CrossRef] [Green Version]
- Avizienyte, E.; Wyke, A.W.; Jones, R.J.; McLean, G.W.; Westhoff, M.A.; Brunton, V.G.; Frame, M.C. Src-induced de-regulation of E-cadherin in colon cancer cells requires integrin signalling. Nat. Cell Biol. 2002, 4, 632–638. [Google Scholar] [CrossRef]
- Cicchini, C.; Laudadio, I.; Citarella, F.; Corazzari, M.; Steindler, C.; Conigliaro, A.; Fantoni, A.; Amicone, L.; Tripodi, M. TGFβ-induced EMT requires focal adhesion kinase (FAK) signaling. Exp. Cell Res. 2008, 314, 143–152. [Google Scholar] [CrossRef]
- Avizienyte, E.; Frame, M.C. Src and FAK signalling controls adhesion fate and the epithelial-to-mesenchymal transition. Curr. Opin. Cell Biol. 2005, 17, 542–547. [Google Scholar] [CrossRef]
- Hegerfeldt, Y.; Tusch, M.; Bröcker, E.B.; Friedl, P. Collective cell movement in primary melanoma explants: Plasticity of cell-cell interaction, β1-integrin function, and migration strategies. Cancer Res. 2002, 62, 2125–2130. [Google Scholar]
- Yano, H.; Mazaki, Y.; Kurokawa, K.; Hanks, S.K.; Matsuda, M.; Sabe, H. Roles played by a subset of integrin signaling molecules in cadherin-based cell-cell adhesion. J. Cell Biol. 2004, 166, 283–295. [Google Scholar] [CrossRef] [Green Version]
- Wang, H.; Radjendirane, V.; Wary, K.K.; Chakrabarty, S. Transforming growth factor β regulates cell-cell adhesion through extracellular matrix remodeling and activation of focal adhesion kinase in human colon carcinoma Moser cells. Oncogene 2004, 23, 5558–5561. [Google Scholar] [CrossRef] [PubMed] [Green Version]
- Martinez-Rico, C.; Pincet, F.; Thiery, J.P.; Dufour, S. Integrins stimulate E-cadherin-mediated intercellular adhesion by regulating Src-kinase activation and actomyosin contractility. J. Cell Sci. 2010, 123, 712–722. [Google Scholar] [CrossRef] [Green Version]
- Siret, C.; Terciolo, C.; Dobric, A.; Habib, M.C.; Germain, S.; Bonnier, R.; Lombardo, D.; Rigot, V.; André, F. Interplay between cadherins and α2β1 integrin differentially regulates melanoma cell invasion. Br. J. Cancer 2015, 113, 1445–1453. [Google Scholar] [CrossRef] [PubMed] [Green Version]
- Friedl, P.; Noble, P.B.; Walton, P.A.; Laird, D.W.; Chauvin, P.J.; Tabah, R.J.; Black, M.; Zänker, K.S. Migration of coordinated cell clusters in mesenchymal and epithelial cancer explants in vitro. Cancer Res. 1995, 55, 4557–4560. [Google Scholar] [PubMed]
- Cabanillas, R.; Secades, P.; Rodrigo, J.P.; Astudillo, A.; Suárez, C.; Chiara, M.D. Orthotopic murine model of head and neck squamous cell carcinoma. Acta Otorrinolaringol. Esp. 2005, 56, 89–95. [Google Scholar] [CrossRef]
- Sáenz-de-Santa-María, I.; Celada, L.; Chiara, M.D. The Leader Position of Mesenchymal Cells Expressing N-Cadherin in the Collective Migration of Epithelial Cancer. Cells 2020, 9, 731. [Google Scholar] [CrossRef] [Green Version]
- Canel, M.; Secades, P.; Rodrigo, J.P.; Cabanillas, R.; Herrero, A.; Suarez, C.; Chiara, M.D. Overexpression of focal adhesion kinase in head and neck squamous cell carcinoma is independent of fak gene copy number. Clin. Cancer Res. 2006, 12, 3272–3279. [Google Scholar] [CrossRef] [Green Version]
- Rodrigo, J.P.; Dominguez, F.; Suárez, V.; Canel, M.; Secades, P.; Chiara, M.D. Focal adhesion kinase and E-cadherin as markers for nodal metastasis in laryngeal cancer. Arch. Otolaryngol. Head Neck Surg. 2007, 133, 145–150. [Google Scholar] [CrossRef] [Green Version]
- Schaller, M.D.; Borgman, C.A.; Parsons, J.T. Autonomous expression of a noncatalytic domain of the focal adhesion-associated protein tyrosine kinase pp125FAK. Mol. Cell. Biol. 1993, 13, 785–791. [Google Scholar] [CrossRef] [Green Version]
- Gaggioli, C.; Hooper, S.; Hidalgo-Carcedo, C.; Grosse, R.; Marshall, J.F.; Harrington, K.; Sahai, E. Fibroblast-led collective invasion of carcinoma cells with differing roles for RhoGTPases in leading and following cells. Nat. Cell Biol. 2007, 9, 1392–1400. [Google Scholar] [CrossRef]
- Labernadie, A.; Kato, T.; Brugués, A.; Serra-Picamal, X.; Derzsi, S.; Arwert, E.; Weston, A.; González-Tarragó, V.; Elosegui-Artola, A.; Albertazzi, L.; et al. A mechanically active heterotypic E-cadherin/N-cadherin adhesion enables fibroblasts to drive cancer cell invasion. Nat. Cell Biol. 2017, 19, 224–237. [Google Scholar] [CrossRef] [PubMed]
- Attieh, Y.; Clark, A.G.; Grass, C.; Richon, S.; Pocard, M.; Mariani, P.; Elkhatib, N.; Betz, T.; Gurchenkov, B.; Vignjevic, D.M. Cancer-associated fibroblasts lead tumor invasion through integrin-β3-dependent fibronectin assembly. J. Cell Biol. 2017, 216, 3509–3520. [Google Scholar] [CrossRef] [PubMed] [Green Version]
- Nguyen, E.V.; Pereira, B.A.; Lawrence, M.G.; Ma, X.; Rebello, R.J.; Chan, H.; Niranjan, B.; Wu, Y.; Ellem, S.; Guan, X.; et al. Proteomic profiling of human prostate cancer-associated fibroblasts (CAF) reveals LOXL2-dependent regulation of the tumor microenvironment. Mol. Cell. Proteomics 2019, 18, 1410–1427. [Google Scholar] [CrossRef] [Green Version]
- Anon, E.; Serra-Picamal, X.; Hersen, P.; Gauthier, N.C.; Sheetz, M.P.; Trepat, T.; Ladoux, B. Cell crawling mediates collective cell migration to close undamaged epithelial gaps. Proc. Natl. Acad. Sci. USA 2012, 109, 10891–10896. [Google Scholar] [CrossRef] [PubMed] [Green Version]
- Sáenz-de-Santa-María, I.; Bernardo-Castiñeira, C.; Enciso, E.; García-Moreno, I.; Chiara, J.L.; Suarez, C.; Chiara, M.D. Control of long-distance cell-to-cell communication and autophagosome transfer in squamous cell carcinoma via tunneling nanotubes. Oncotarget 2017, 8, 20939–20960. [Google Scholar] [CrossRef] [PubMed] [Green Version]
- Flores, A.P.C.; Dias, K.B.; Hildebrand, L.C.; Oliveira, M.G.; Lamers, M.L.; Sant’Ana Filho, M. Focal adhesion kinases in head and neck squamous cell carcinoma. J. Oral Pathol. Med. 2018, 47, 246–252. [Google Scholar] [CrossRef] [PubMed]
- Cordes, N.; Ney, M.; Beleites, T.; Aust, D.; Baretton, G.; Thames, H.; Baumann, M.; Krause, M.; Löck, S.; Appold, S. Retrospective investigation of the prognostic value of the β1 integrin expression in patients with head and neck squamous cell carcinoma receiving primary radio(chemo)therapy. PLoS ONE 2018, 13, e0209479. [Google Scholar] [CrossRef] [Green Version]
- Charras, G.; Yap, A.S. Tensile Forces and Mechanotransduction at Cell–Cell Junctions. Curr. Biol. 2018, 28, R445–R457. [Google Scholar] [CrossRef] [Green Version]
- Quang, B.A.T.; Mani, M.; Markova, O.; Lecuit, T.; Lenne, P.F. Principles of E-cadherin supramolecular organization in vivo. Curr. Biol. 2013, 23, 2197–2207. [Google Scholar]
- Gu, J.; Tamura, M.; Pankov, R.; Danen, E.H.; Takino, T.; Matsumoto, K.; Yamada, K.M. Shc and FAK differentially regulate cell motility and directionality modulated by PTEN. J. Cell Biol. 1999, 146, 389–403. [Google Scholar] [CrossRef] [Green Version]
- Goldman, M.; Craft, B.; Brooks, A.; Zhu, J.; Haussler, D. The UCSC Xena platform for public and private cancer genomics data visualization and interpretation. bioRxiv 2019, 326470. [Google Scholar] [CrossRef] [Green Version]


| PTK2 mRNA Levels | MMP2 mRNA Levels | ||||||
|---|---|---|---|---|---|---|---|
| N | Low | High | p | Low | High | p | |
| pT classification | |||||||
| T1–T2 | 209 | 111 | 98 | 0.094 | 124 | 85 | <0.0001 |
| T3–T4 | 334 | 152 | 182 | 141 | 193 | ||
| pN classification | |||||||
| N0 | 193 | 102 | 91 | 0.005 | 105 | 88 | 0.021 |
| N+ | 347 | 159 | 188 | 159 | 188 | ||
| Distant metastasis | |||||||
| M0 | 190 | 96 | 94 | 0.450 | 97 | 93 | 0.192 |
| M+ | 66 | 37 | 29 | 39 | 27 | ||
| Disease stage | |||||||
| I–II | 119 | 67 | 52 | 0.098 | 70 | 49 | 0.007 |
| III–IV | 374 | 178 | 196 | 167 | 207 | ||
Publisher’s Note: MDPI stays neutral with regard to jurisdictional claims in published maps and institutional affiliations. |
© 2020 by the authors. Licensee MDPI, Basel, Switzerland. This article is an open access article distributed under the terms and conditions of the Creative Commons Attribution (CC BY) license (http://creativecommons.org/licenses/by/4.0/).
Share and Cite
Sáenz-de-Santa-María, I.; Celada, L.; San José Martínez, A.; Cubiella, T.; Chiara, M.-D. Blockage of Squamous Cancer Cell Collective Invasion by FAK Inhibition Is Released by CAFs and MMP-2. Cancers 2020, 12, 3708. https://doi.org/10.3390/cancers12123708
Sáenz-de-Santa-María I, Celada L, San José Martínez A, Cubiella T, Chiara M-D. Blockage of Squamous Cancer Cell Collective Invasion by FAK Inhibition Is Released by CAFs and MMP-2. Cancers. 2020; 12(12):3708. https://doi.org/10.3390/cancers12123708
Chicago/Turabian StyleSáenz-de-Santa-María, Inés, Lucía Celada, Andrés San José Martínez, Tamara Cubiella, and María-Dolores Chiara. 2020. "Blockage of Squamous Cancer Cell Collective Invasion by FAK Inhibition Is Released by CAFs and MMP-2" Cancers 12, no. 12: 3708. https://doi.org/10.3390/cancers12123708
APA StyleSáenz-de-Santa-María, I., Celada, L., San José Martínez, A., Cubiella, T., & Chiara, M.-D. (2020). Blockage of Squamous Cancer Cell Collective Invasion by FAK Inhibition Is Released by CAFs and MMP-2. Cancers, 12(12), 3708. https://doi.org/10.3390/cancers12123708