LNX1 Modulates Notch1 Signaling to Promote Expansion of the Glioma Stem Cell Population during Temozolomide Therapy in Glioblastoma

 ,
,  , ,
, ,  , , ,
, , , 
Abstract
Simple Summary
Abstract
1. Introduction
2. Results
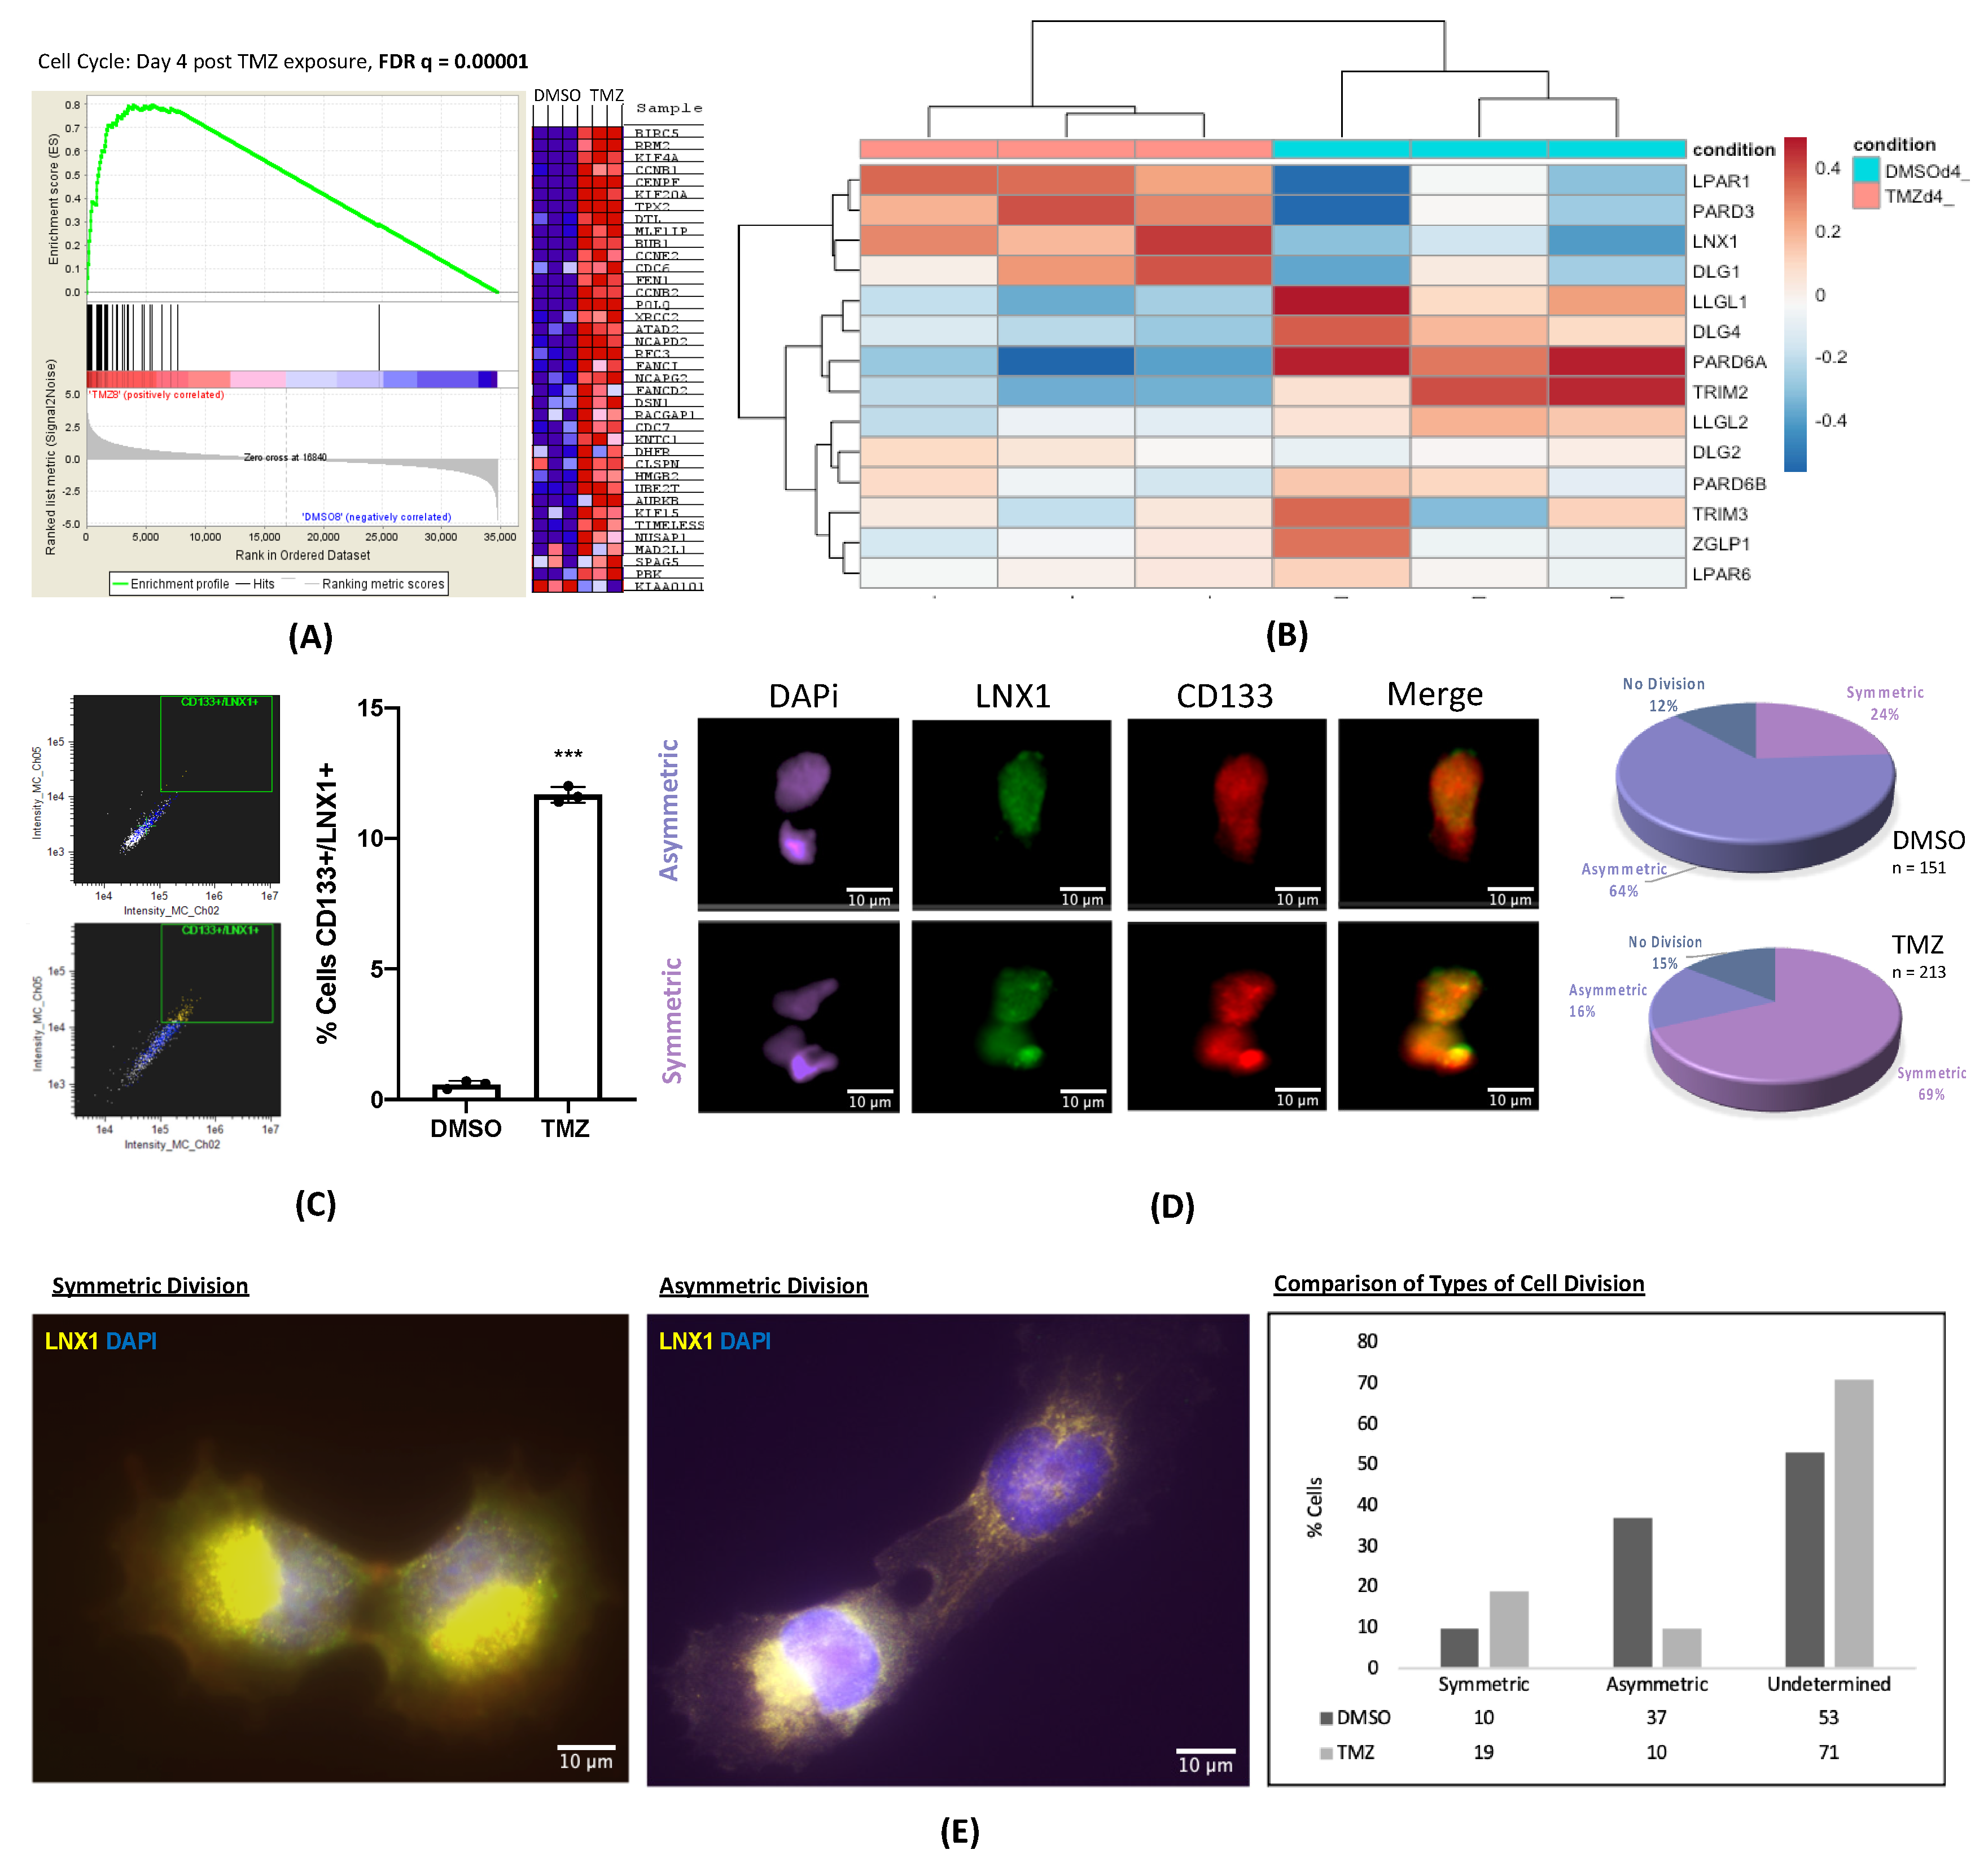
2.1. LNX1 Expression and Symmetric Cell Division Are Enriched after TMZ-Based Chemotherapy
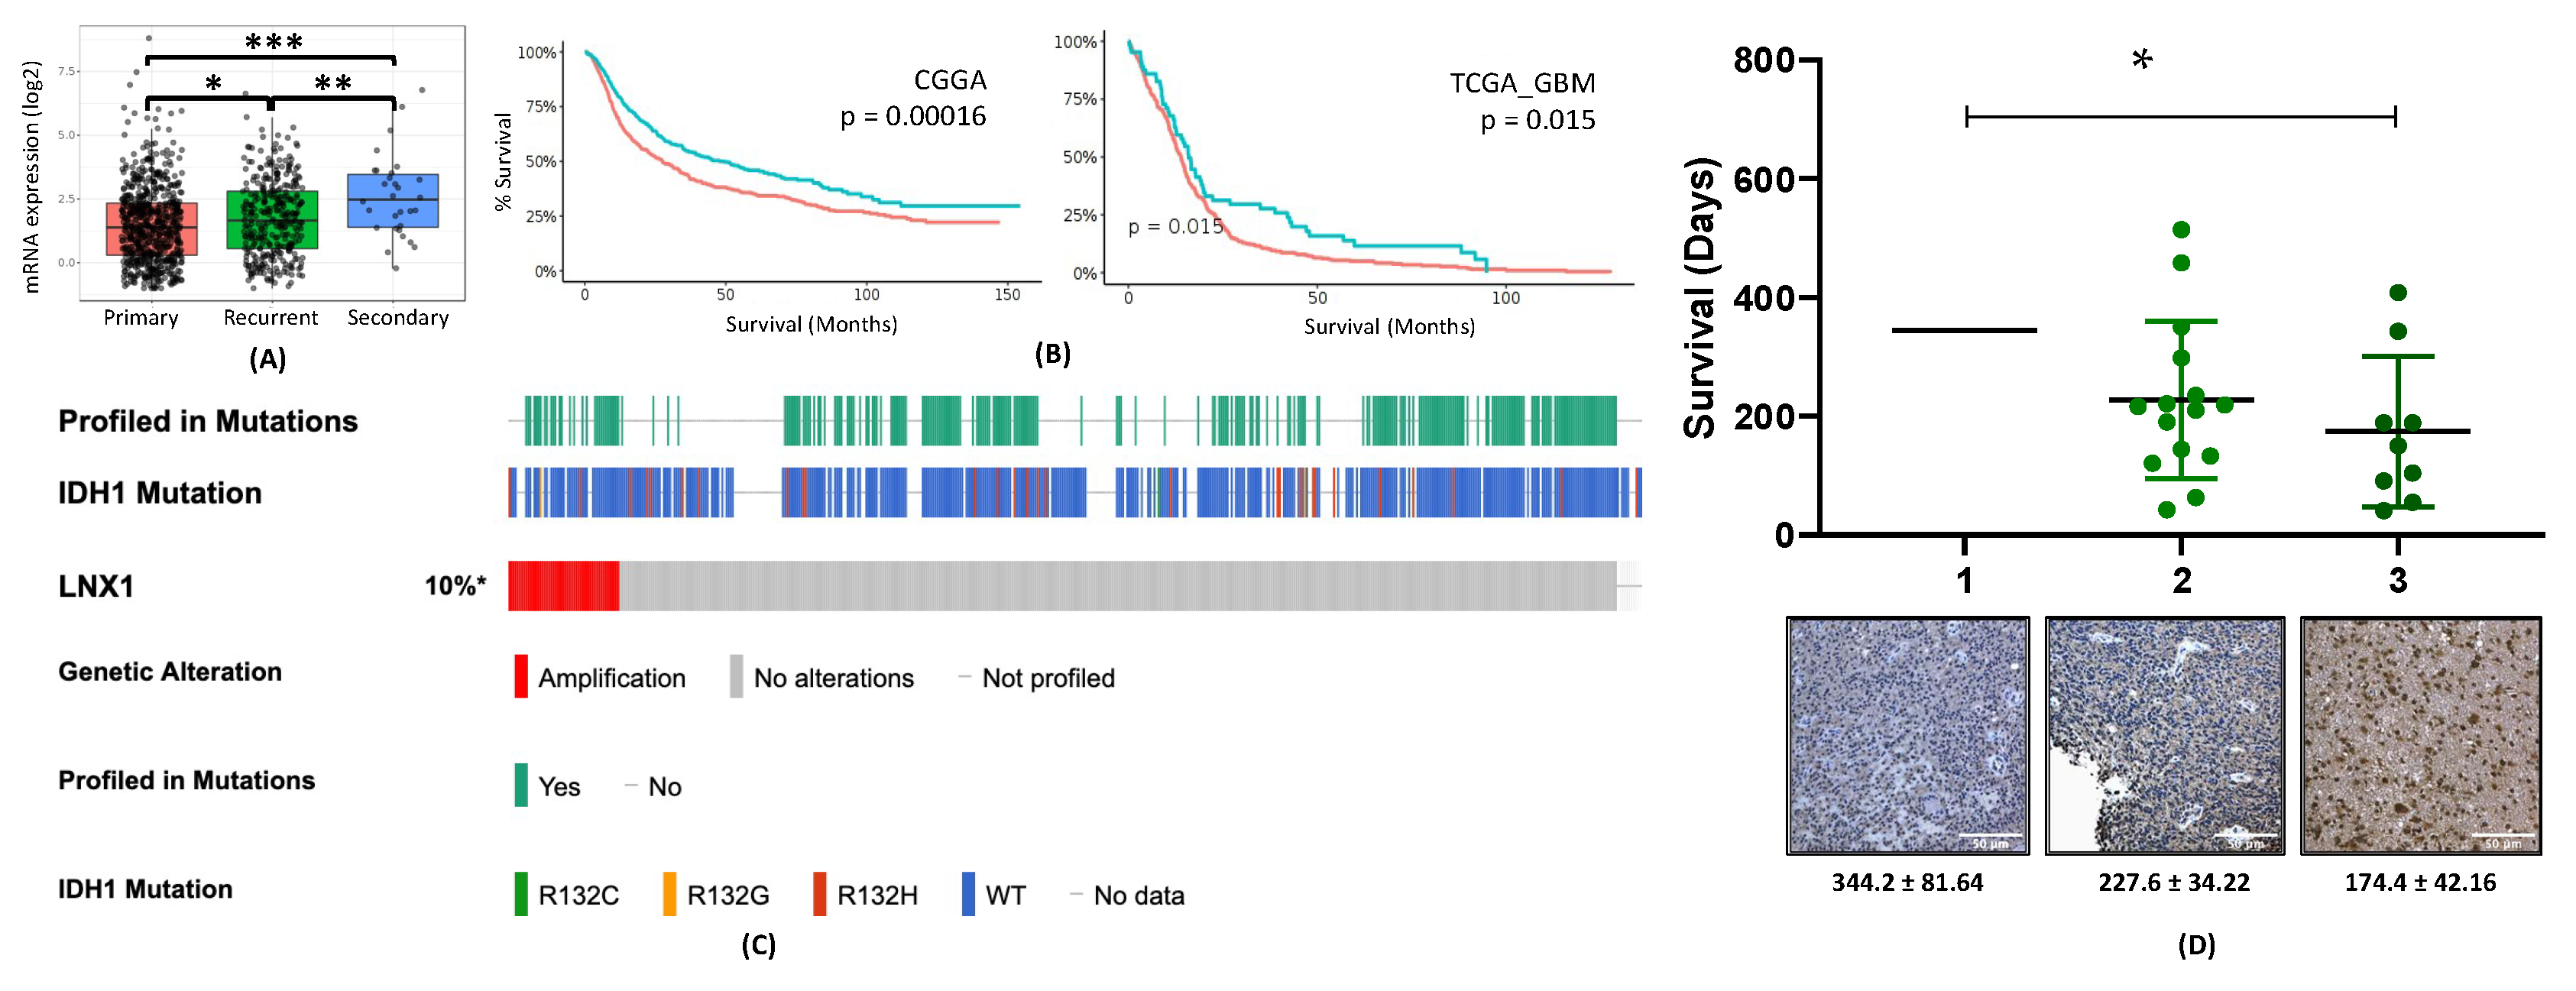
2.2. LNX1 Expression Is Elevated in Post-Therapy Recurrent GBM and Negatively Correlated with Survival with Patients with GBM
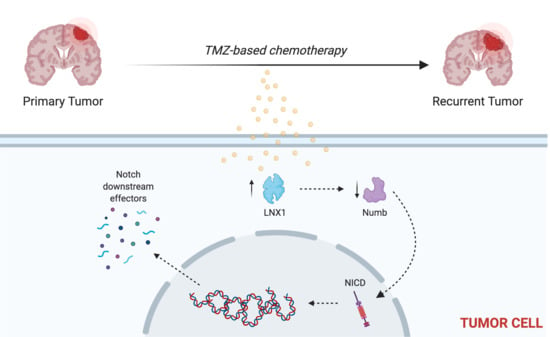
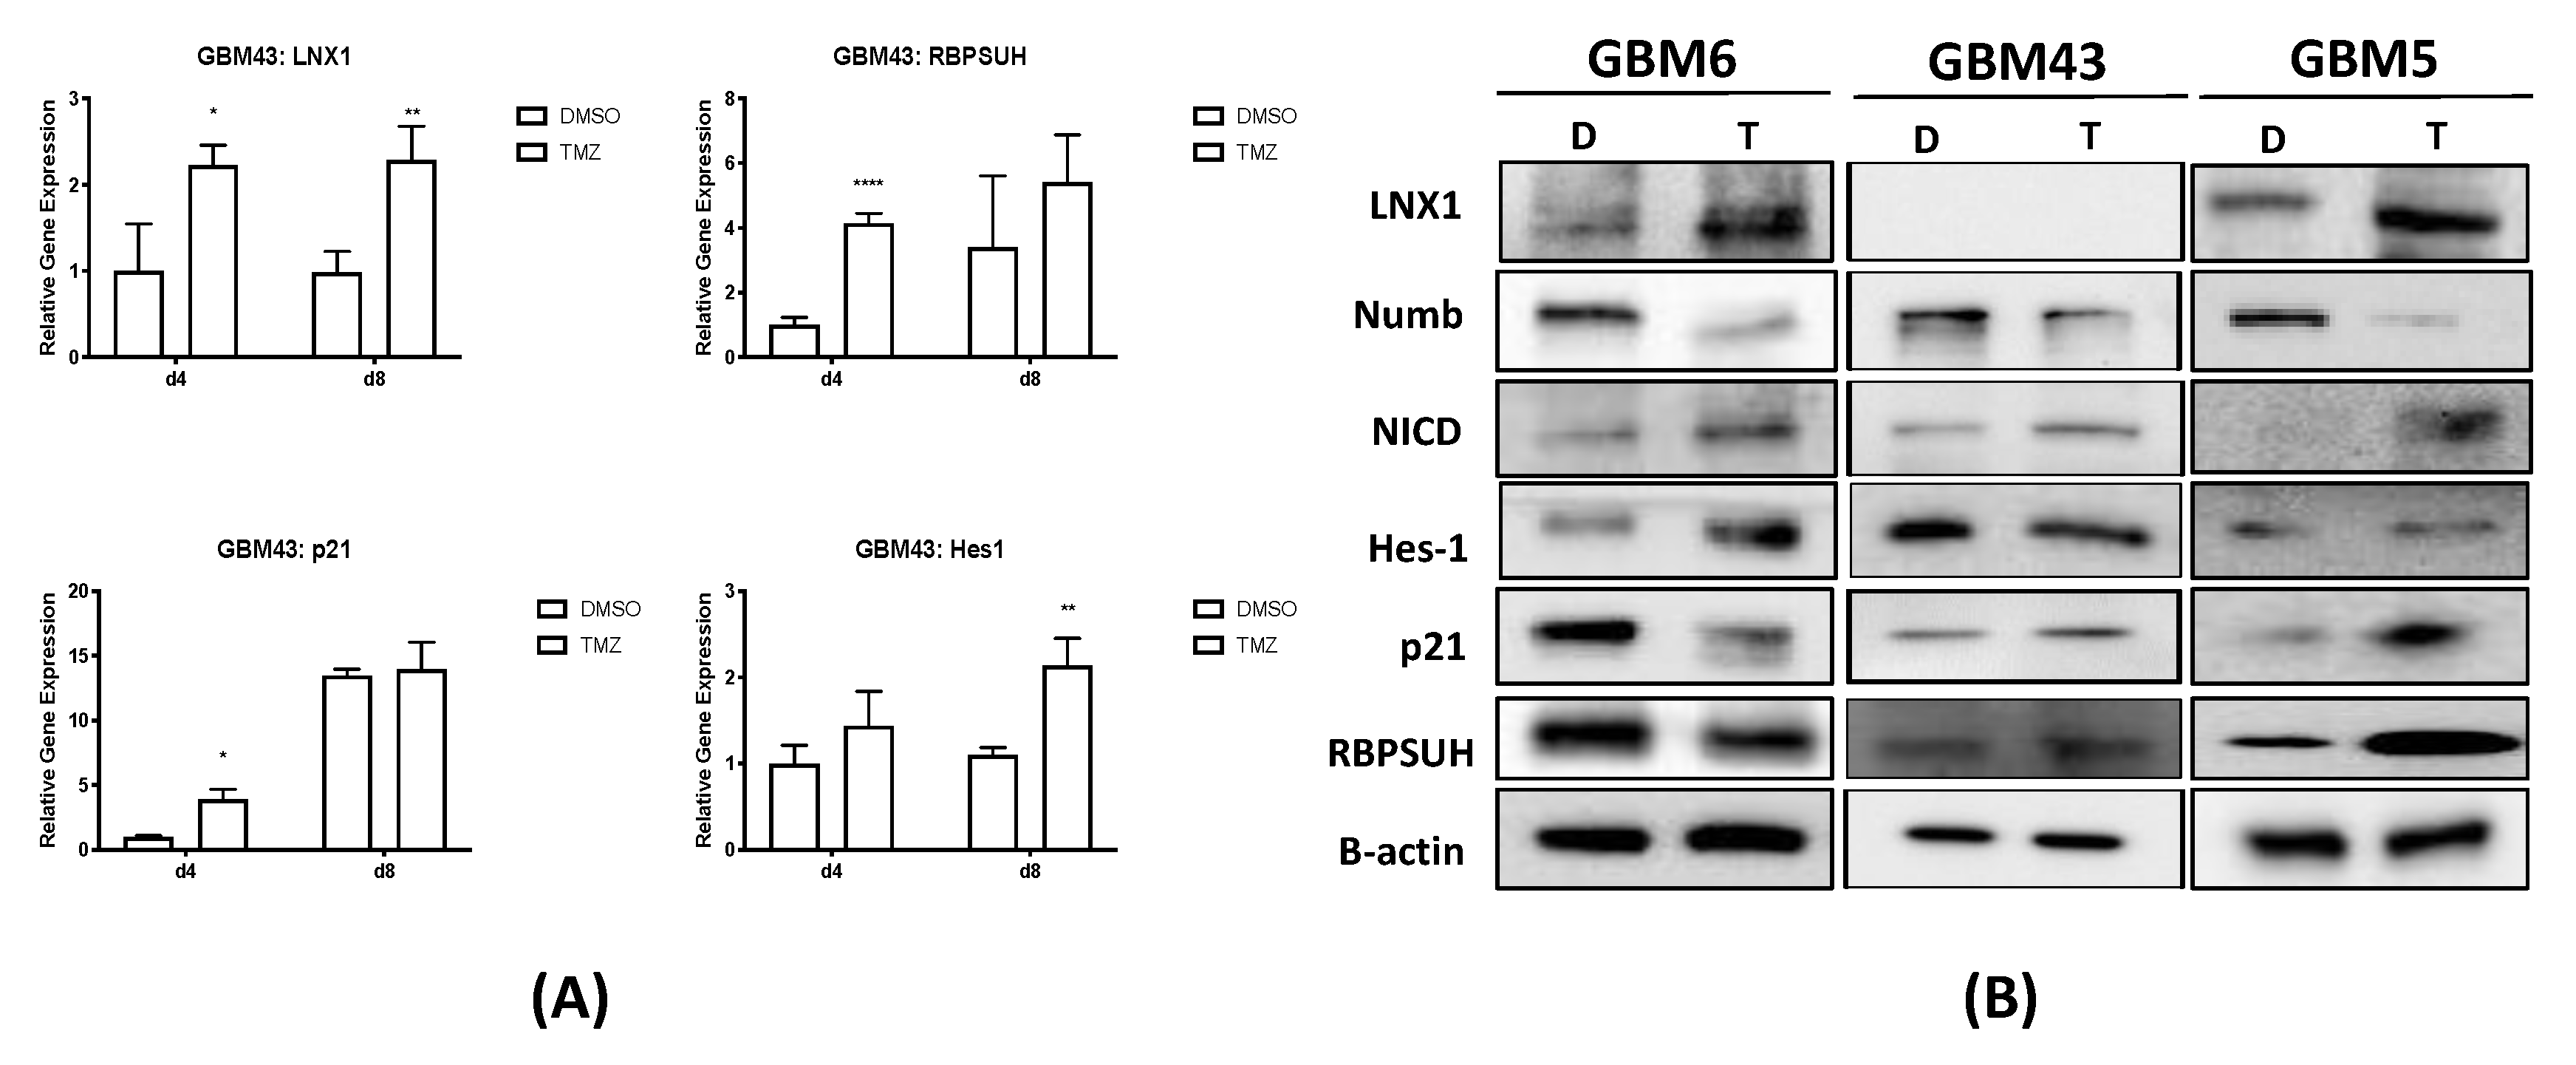
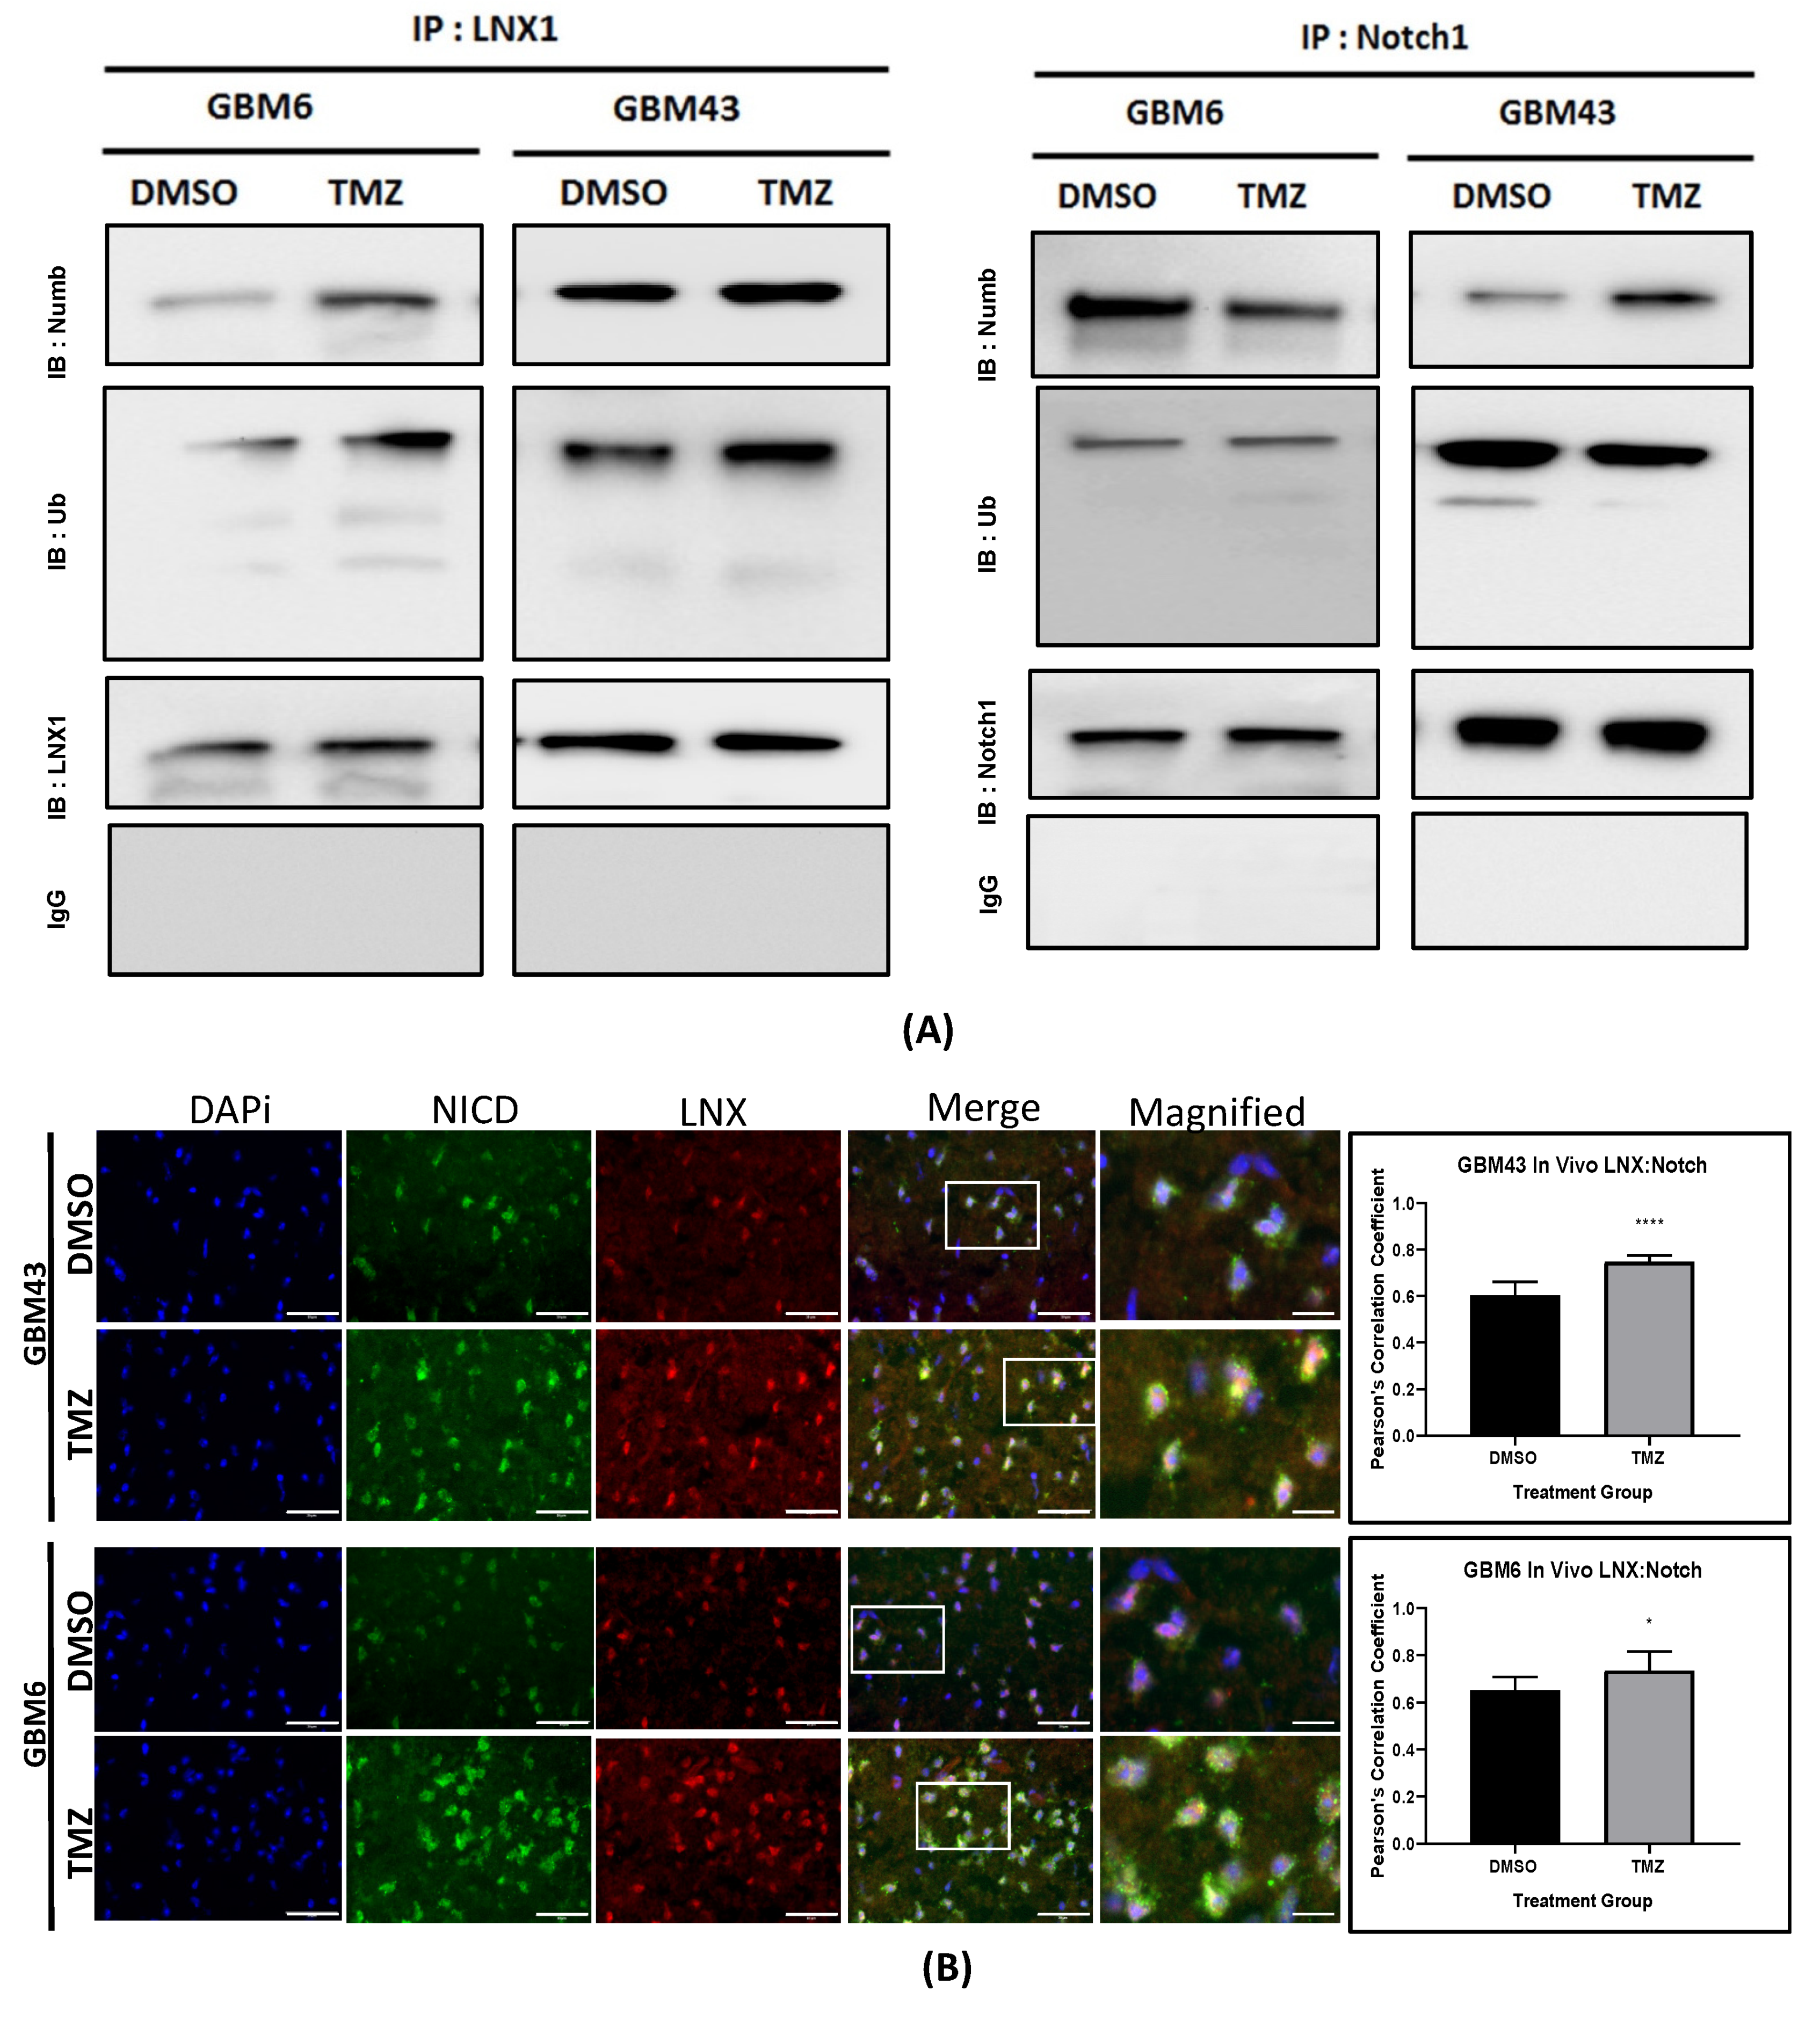
2.3. LNX1 Influences Notch1 Expression through an LNX1-Numb-Notch1 Axis during TMZ Therapy
2.4. LNX1 Interacts with Numb during TMZ Therapy
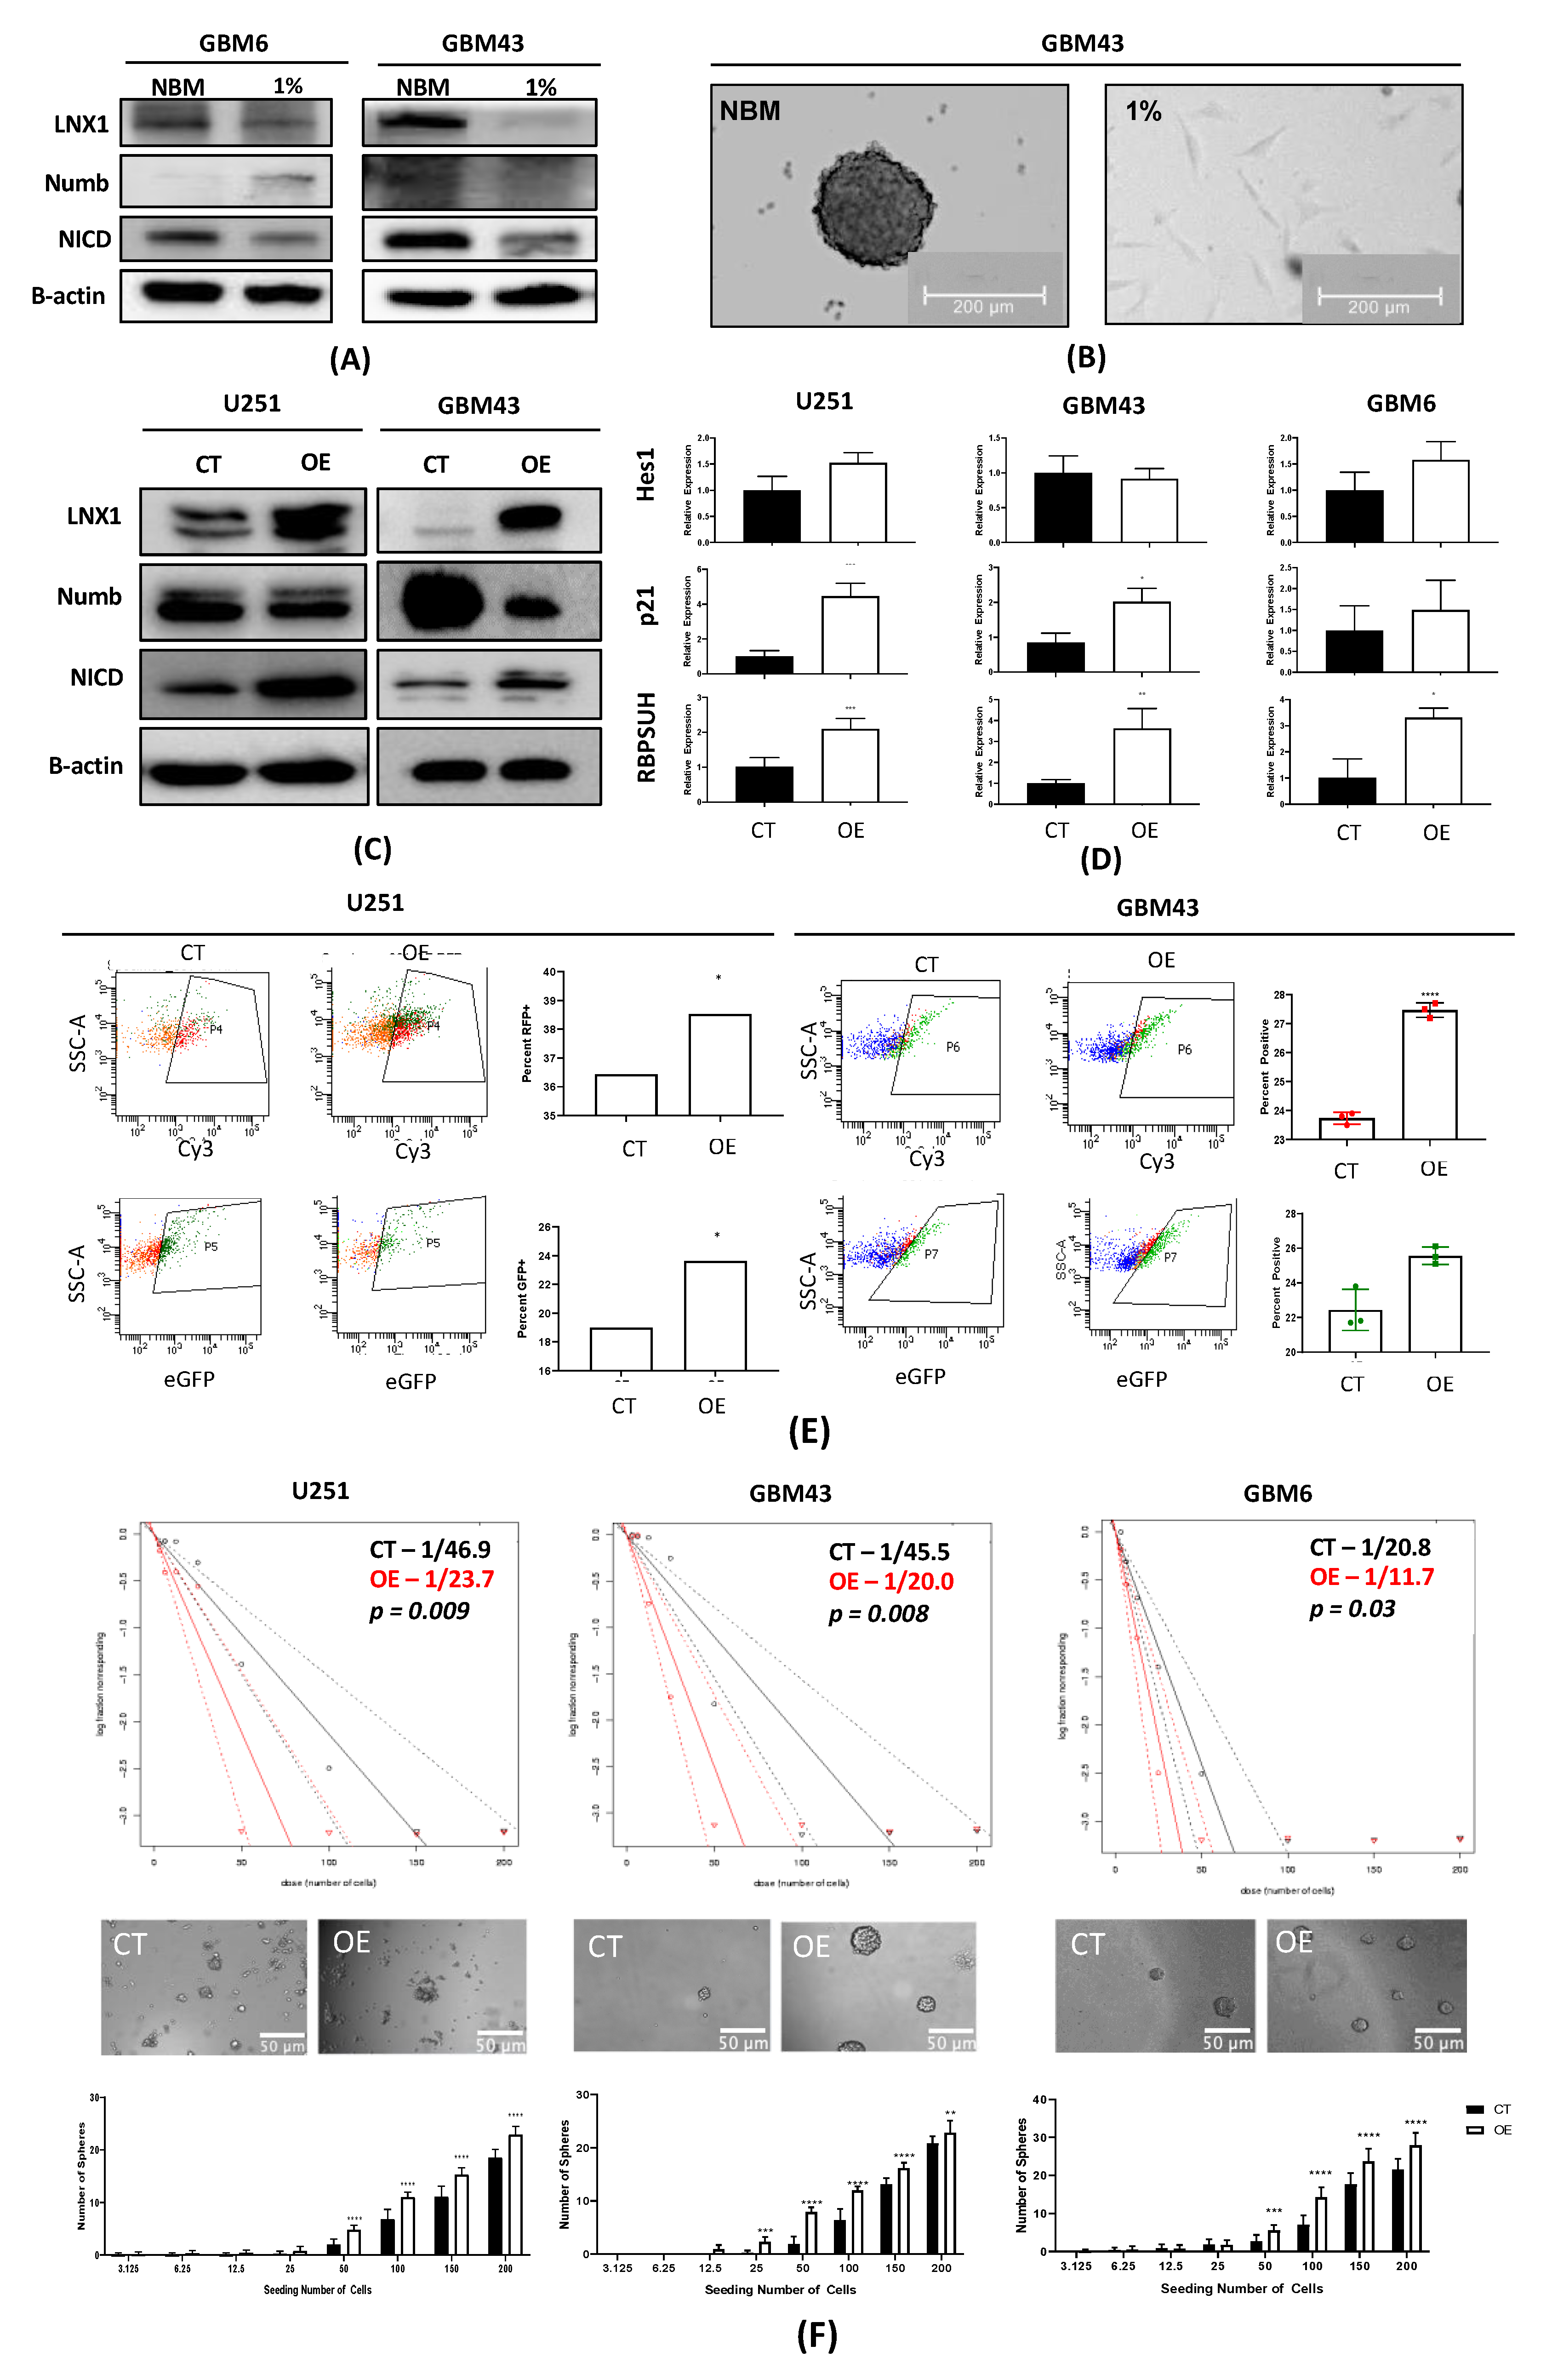
2.5. Induction of a Stem-Cell-Like State through LNX1 Overexpression Increases Notch1 Activity
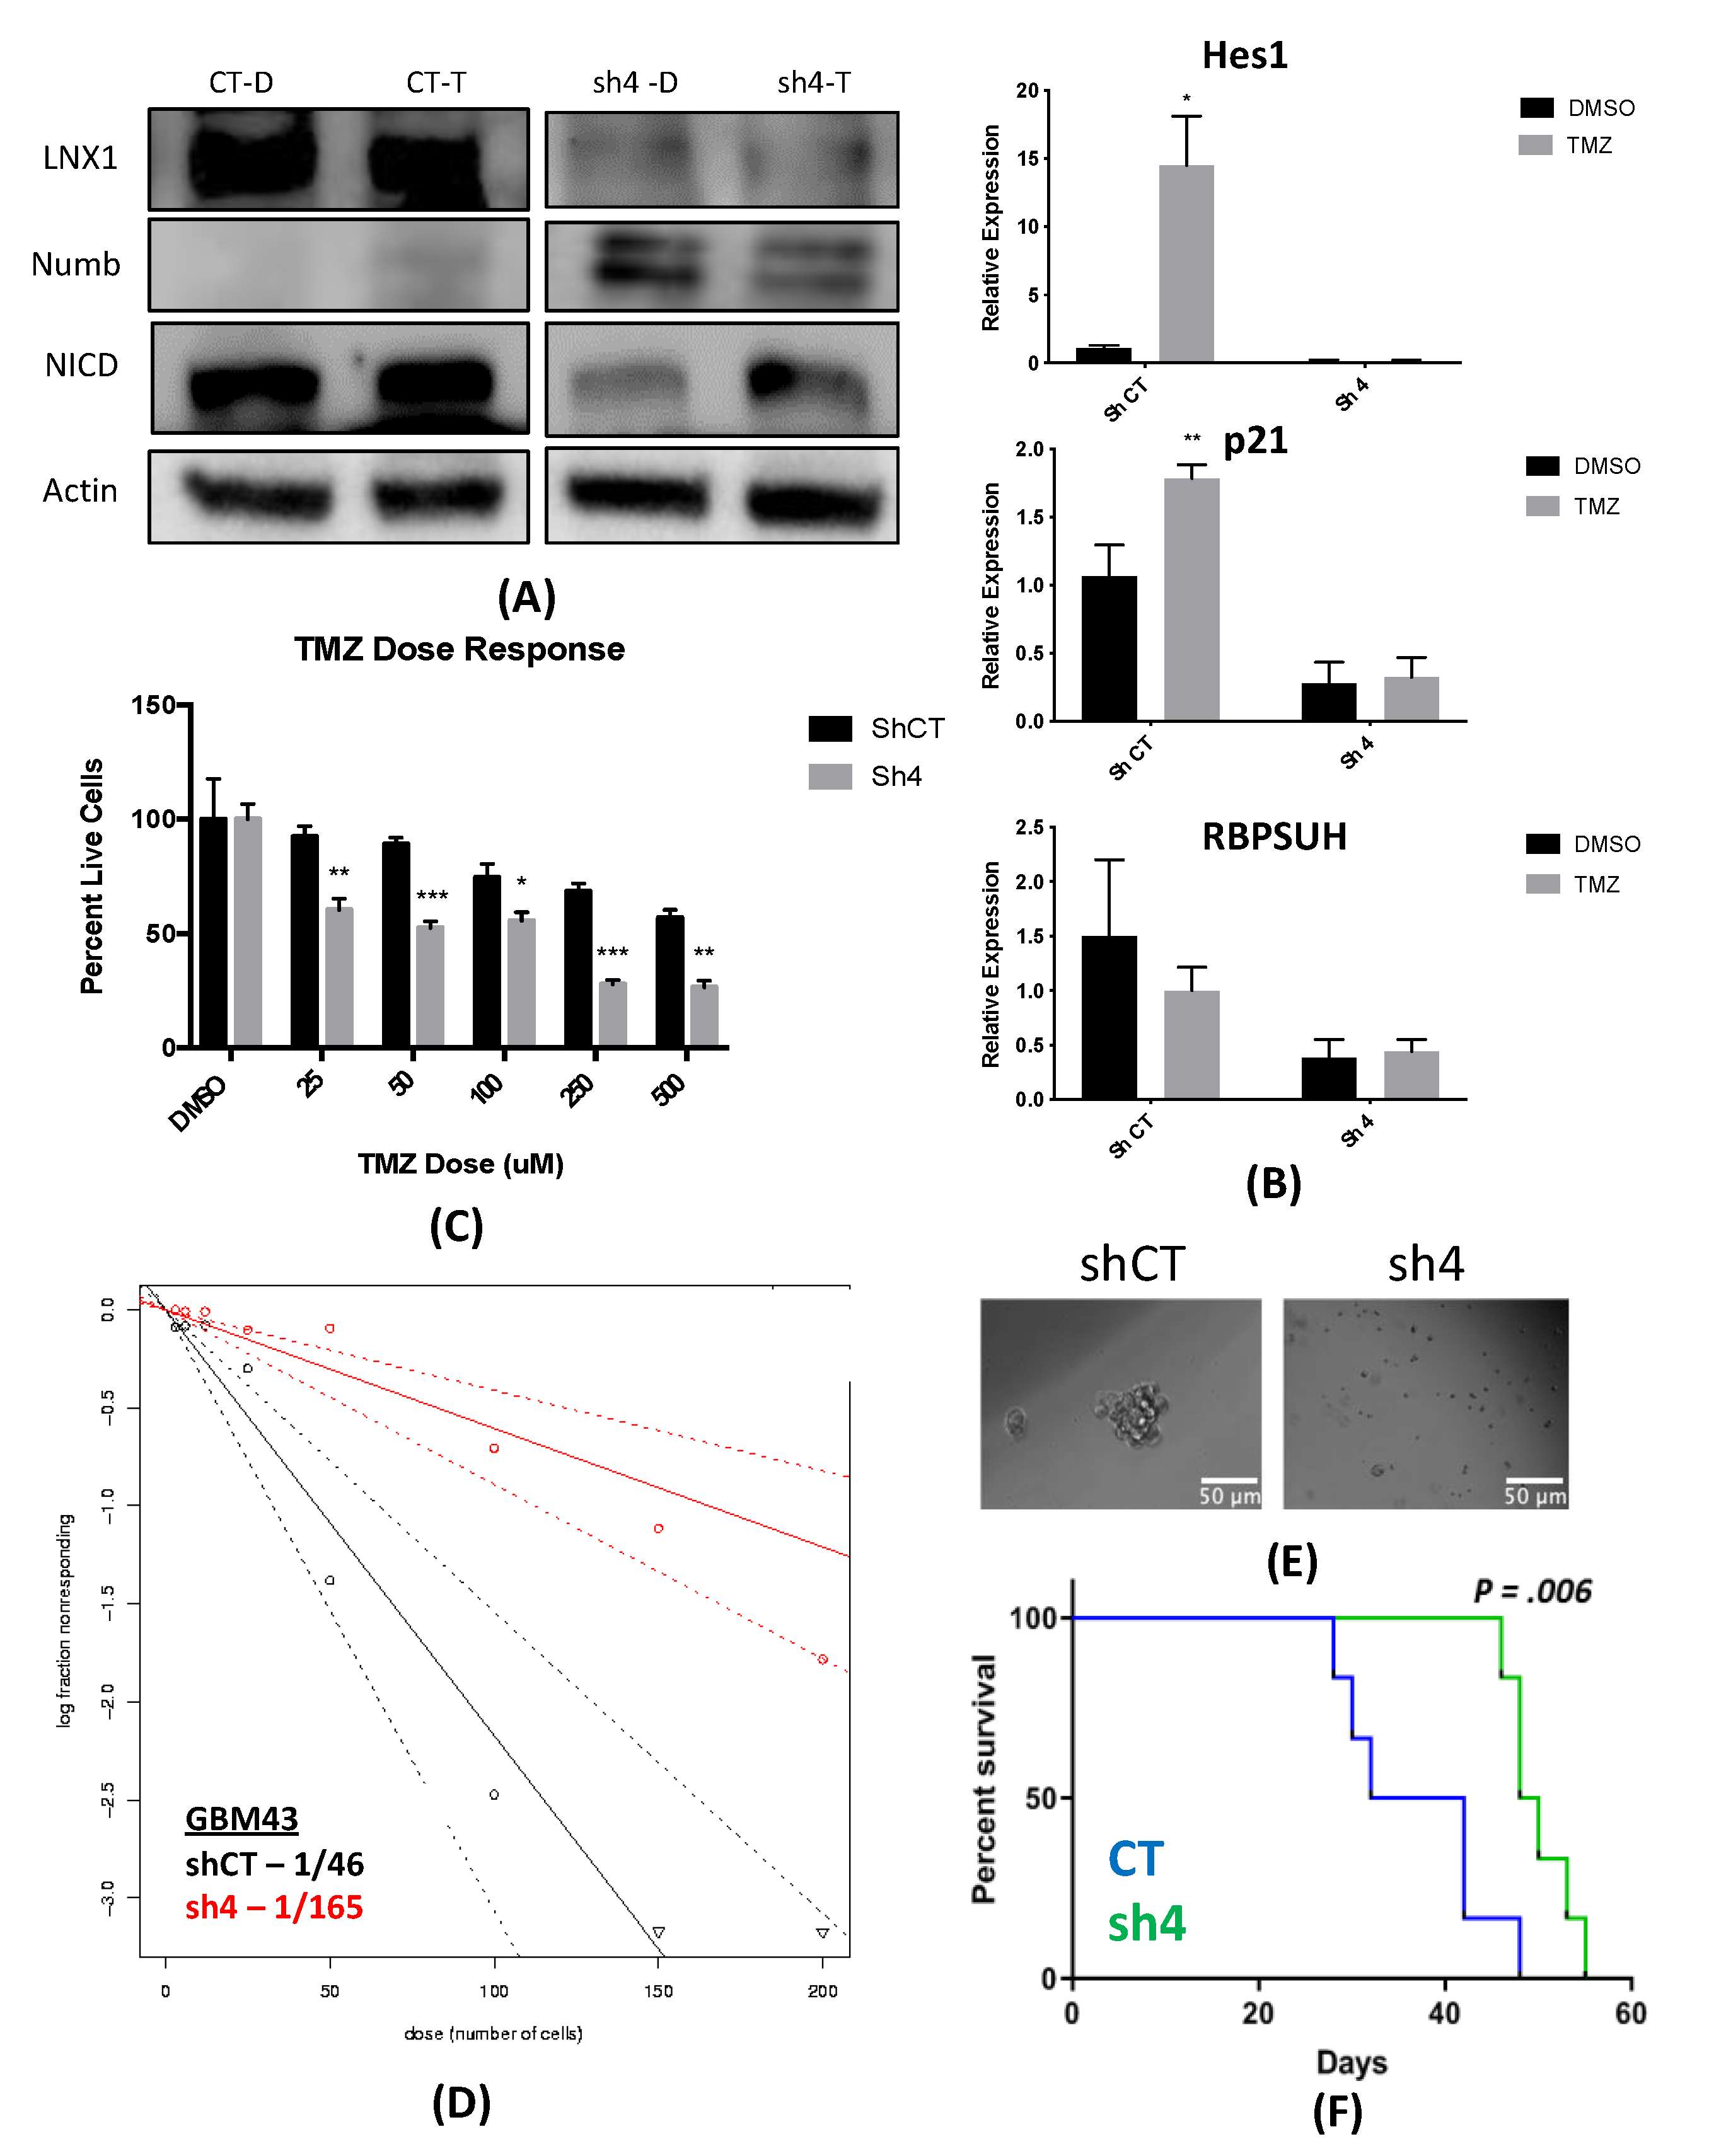
2.6. Knockdown of LNX1 Activity Results in Reduced Stemness and Increased Animal Survival
3. Discussion
4. Materials and Methods
4.1. Gene Expression Analysis
4.2. RNA-Seq Analysis
4.3. Cell Lines and Culture
4.4. Immunofluorescence Staining
4.5. Immunohistochemistry of Human Samples
4.6. Quantitative PCR
4.7. Western Blot
4.8. Neurosphere Assays and Extreme Limiting Dilution Analysis (ELDA)
4.9. Notch Reporter Transfection
4.10. Flow Cytometry
4.11. Viability Assays
4.12. Generation of Viral Particles
4.13. Transduction of Cell Lines with Lentiviral Particles
4.14. Animal Studies
4.15. Statistics
5. Conclusions
Supplementary Materials
Author Contributions
Funding
Acknowledgments
Conflicts of Interest
References
- Sasmita, O.A.; Wong, Y.P.; Ling, A.P.K. Biomarkers and therapeutic advances in glioblastoma multiforme. Asia Pac. J. Clin. Oncol. 2018, 14, 40–51. [Google Scholar] [CrossRef] [PubMed]
- Alifieris, C.; Trafalis, D.T. Glioblastoma multiforme: Pathogenesis and treatment. Pharmacol. Ther. 2015, 152, 63–82. [Google Scholar] [CrossRef] [PubMed]
- Zhu, P.; Zhu, J.-J. Tumor treating fields: A novel and effective therapy for glioblastoma: Mechanism, efficacy, safety and future perspectives. Chin. Clin. Oncol. 2017, 6, 41. [Google Scholar] [CrossRef] [PubMed]
- Stupp, R.; Taillibert, S.; Kanner, A.; Read, W.; Steinberg, D.M.; Lhermitte, B.; Toms, S.; Idbaih, A.; Ahluwalia, M.S.; Fink, K.; et al. Effect of Tumor-Treating Fields Plus Maintenance Temozolomide vs Maintenance Temozolomide Alone on Survival in Patients with Glioblastoma. JAMA 2017, 318, 2306–2316. [Google Scholar] [CrossRef] [PubMed]
- Burri, S.H.; Gondi, V.; Brown, D.P. The Evolving Role of Tumor Treating Fields in Managing Glioblastoma. Am. J. Clin.Oncol. 2017, 41, 191–196. [Google Scholar] [CrossRef]
- Hadjipanayis, C.G.; Van Meir, E.G. Tumor initiating cells in malignant gliomas: Biology and implications for therapy. J. Mol. Med. 2009, 87, 363–374. [Google Scholar] [CrossRef]
- Esparza, R.; Azad, T.D.; Feroze, A.H.; Mitra, S.S.; Cheshier, S.H. Glioblastoma stem cells and stem cell-targeting immunotherapies. J. Neuro Oncol. 2015, 123, 449–457. [Google Scholar] [CrossRef]
- Lathia, J.D.; Hitomi, M.; Gallagher, J.; Gadani, S.P.; Adkins, J.; Vasanji, A.; Liu, L.; Eyler, C.E.; Heddleston, J.M.; Wu, Q.; et al. Distribution of CD133 reveals glioma stem cells self-renew through symmetric and asymmetric cell divisions. Cell Death Dis. 2011, 2, e200. [Google Scholar] [CrossRef]
- Lathia, J.D.; Mack, S.C.; Mulkearns-Hubert, E.E.; Valentim, C.L.L.; Rich, J.N. Cancer stem cells in glioblastoma. Genes Dev. 2015, 29, 1203–1217. [Google Scholar] [CrossRef]
- Safa, A.R.; Saadatzadeh, M.R.; Cohen-Gadol, A.A.; Pollok, K.E.; Bijangi-Vishehsaraei, K. Glioblastoma stem cells (GSCs) epigenetic plasticity and interconversion between differentiated non-GSCs and GSCs. Genes Dis. 2015, 2, 152–163. [Google Scholar] [CrossRef]
- Auffinger, B.; Spencer, D.; Pytel, P.; Ahmed, A.U.; Lesniak, M.S. The role of glioma stem cells in chemotherapy resistance and glioblastoma multiforme recurrence. Exp. Rev. Neurother. 2015, 15, 741–752. [Google Scholar] [CrossRef] [PubMed]
- Auffinger, B.; Tobias, A.L.; Han, Y.; Lee, G.; Guo, D.; Dey, M.; Lesniak, M.S.; Ahmed, A.U. Conversion of differentiated cancer cells into cancer stem-like cells in a glioblastoma model after primary chemotherapy. Cell Death Differ. 2014, 21, 1119–1131. [Google Scholar] [CrossRef] [PubMed]
- Chen, G.; Kong, J.; Tucker-Burden, C.; Anand, M.; Rong, Y.; Rahman, F.; Moreno, C.S.; van Meir, E.G.; Hadjipanayis, C.G.; Brat, D.J. Human Brat ortholog TRIM3 is a tumor suppressor that regulates asymmetric cell division in glioblastoma. Cancer Res. 2014, 74, 4536–4548. [Google Scholar] [CrossRef] [PubMed]
- Sugiarto, S.; Persson, A.I.; Munoz, E.G.; Waldhuber, M.; Lamagna, C.; Andor, N.; Hanecker, P.; Ayers-Ringler, J.; Phillips, J.; Siu, J.; et al. Asymmetry-defective oligodendrocyte progenitors are glioma precursors. Cancer Cell 2011, 20, 328–340. [Google Scholar] [CrossRef]
- Allenspach, E.J.; Maillard, I.; Aster, J.C.; Pear, W.S. Notch signaling in cancer. Cancer Biol. Ther. 2002, 1, 466–476. [Google Scholar] [CrossRef]
- Miele, L.; Golde, T.; Osborne, B. Notch signaling in cancer. Curr. Mol. Med. 2006, 6, 905–918. [Google Scholar] [CrossRef]
- Rizzo, P.; Osipo, C.; Foreman, K.; Golde, T.; Osborne, B.; Miele, L. Rational targeting of Notch signaling in cancer. Oncogene 2008, 27, 5124–5131. [Google Scholar] [CrossRef]
- Lino, M.M.; Merlo, A.; Boulay, J.-L. Notch signaling in glioblastoma: A developmental drug target? BMC Med. 2010, 8, 72. [Google Scholar]
- Ying, M.; Wang, S.; Sang, Y.; Sun, P.; Lal, B.; Goodwin, C.R.; Guerrero-Cazares, H.; Quinones-Hinojosa, A.; Laterra, J.; Xia, S. Regulation of glioblastoma stem cells by retinoic acid: Role for Notch pathway inhibition. Oncogene 2011, 30, 3454–3467. [Google Scholar] [CrossRef]
- Pearson, J.R.D.; Regad, T. Targeting cellular pathways in glioblastoma multiforme. Signal Trans. Target. Ther. 2017, 2, 17040. [Google Scholar]
- Lee, G.; Auffinger, B.; Guo, D.; Hasan, T.; Deheeger, M.; Tobias, A.L.; Kim, J.Y.; Atashi, F.; Zhang, L.; Lesniak, M.S.; et al. Dedifferentiation of glioma cells to glioma stem-like cells by therapeutic stress-induced HIF signaling in the recurrent GBM model. Mol. Cancer Ther. 2016, 15, 3064–3076. [Google Scholar] [CrossRef] [PubMed]
- Dahan, P.; Gala, J.M.; Delmas, C.; Monferran, S.; Malric, L.; Zentkowski, D.; Lubrano, V.; Toulas, C.; Moyal, E.C.; Lemarie, A. Ionizing radiations sustain glioblastoma cell dedifferentiation to a stem-like phenotype through survivin: Possible involvement in radioresistance. Cell Death Dis. 2014, 5, e1543. [Google Scholar] [CrossRef]
- Egger, B.; Gold, K.S.; Brand, A.H. Notch regulates the switch from symmetric to asymmetric neural stem cell division in the Drosophila optic lobe. Development 2010, 137, 2981–2987. [Google Scholar] [CrossRef] [PubMed]
- Betschinger, J.; Knoblich, J.A. Dare to be different: Asymmetric cell division in Drosophila, C. elegans and vertebrates. Curr. Biol. 2004, 14, R674–R685. [Google Scholar] [CrossRef] [PubMed]
- Cayouette, M.; Raff, M. Asymmetric segregation of Numb: A mechanism for neural specification from Drosophila to mammals. Nat. Neurosci. 2002, 5, 1265–1269. [Google Scholar] [CrossRef] [PubMed]
- Bekri, A.; Liao, M.; Drapeau, P. Glycine regulates neural stem cell proliferation during development via Lnx1-dependent Notch signaling. Front. Mol. Neurosci. 2019, 12, 44. [Google Scholar] [CrossRef]
- Bowman, R.L.; Wang, Q.; Carro, A.; Verhaak, R.G.W.; Squatrito, M. GlioVis data portal for visualization and analysis of brain tumor expression datasets. Neuro Oncol. 2017, 19, 139–141. [Google Scholar] [CrossRef]
- Gao, J.; Aksoy, B.A.; Dogrusoz, U.; Dresdner, G.; Gross, B.; Sumer, S.O.; Sun, Y.; Jacobsen, A.; Sinha, R.; Larsson, E.; et al. Integrative analysis of complex cancer genomics and clinical profiles using the cBioPortal. Sci. Signal. 2013, 6, pl1. [Google Scholar] [CrossRef]
- Tomczak, K.; Czerwińska, P.; Wiznerowicz, M. The Cancer Genome Atlas (TCGA): An immeasurable source of knowledge. Contemp. Oncol. 2015, 19, A68. [Google Scholar] [CrossRef]
- Flores, A.N.; McDermott, N.; Meunier, A.; Marignol, L. NUMB inhibition of NOTCH signalling as a therapeutic target in prostate cancer. Nat. Rev. Urol. 2014, 11, 499–507. [Google Scholar] [CrossRef]
- Wang, R.; Chadalavada, K.; Wilshire, J.; Kowalik, U.; Hovinga, K.E.; Geber, A.; Fligelman, B.; Leversha, M.; Brennan, C.; Tabar, V. Glioblastoma stem-like cells give rise to tumour endothelium. Nature 2010, 468, 829–833. [Google Scholar] [CrossRef] [PubMed]
- Goldhoff, P.; Clarke, J.; Smirnov, I.; Berger, M.S.; Prados, M.D.; James, C.D.; Perry, A.; Phillips, J.J. Clinical Stratification of Glioblastoma Based on Alterations in Retinoblastoma Tumor Suppressor Protein (RB1) and Association with the Proneural Subtype. J. Neuropathol. Exp. Neurol. 2012, 71, 83–89. [Google Scholar] [CrossRef] [PubMed]
- Young, P.W. LNX1/LNX2 proteins: Functions in neuronal signalling and beyond. Neuronal Signal. 2018, 2, NS20170191. [Google Scholar] [CrossRef] [PubMed]
- Shi, J.; Walker, M.G. Gene set enrichment analysis (GSEA) for interpreting gene expression profiles. Curr. Bioinform. 2007, 2, 133–137. [Google Scholar] [CrossRef]
- Love, M.; Anders, S.; Huber, W. Differential analysis of count data–the DESeq2 package. Genome Biol. 2014, 15, 10–1186. [Google Scholar]
- Hodgson, J.G.; Yeh, R.; Ray, A.; Wang, N.J.; Smirnov, I.; Yu, M.; Hariono, S.; Silber, J.; Feiler, H.S.; Gray, J.W.; et al. Comparative analyses of gene copy number and mRNA expression in glioblastoma multiforme tumors and xenografts. Neuro Oncol. 2009, 11, 477–487. [Google Scholar] [CrossRef]
- Hofman, F. Immunohistochemistry. Curr. Protocols Immunol. 2002, 49, 21–24. [Google Scholar]
- Rasband, W.S. ImageJ; Montgomery: Bethesda, MD, USA, 1997. [Google Scholar]
- Broeke, J.; Pérez, J.M.M.; Pascau, J. Image Processing with Imagej; Packt Publishing Ltd.: Birmingham, UK, 2015. [Google Scholar]
- Supino, R. MTT assays. In In Vitro Toxicity Testing Protocols; Springer: Cham, Switzerland, 1995; pp. 137–149. [Google Scholar]


Publisher’s Note: MDPI stays neutral with regard to jurisdictional claims in published maps and institutional affiliations. |
© 2020 by the authors. Licensee MDPI, Basel, Switzerland. This article is an open access article distributed under the terms and conditions of the Creative Commons Attribution (CC BY) license (http://creativecommons.org/licenses/by/4.0/).
Share and Cite
Baisiwala, S.; Hall, R.R., III; Saathoff, M.R.; M. Shireman, J.; Park, C.; Budhiraja, S.; Goel, C.; Warnke, L.; Hardiman, C.; Wang, J.Y.; et al. LNX1 Modulates Notch1 Signaling to Promote Expansion of the Glioma Stem Cell Population during Temozolomide Therapy in Glioblastoma. Cancers 2020, 12, 3505. https://doi.org/10.3390/cancers12123505
Baisiwala S, Hall RR III, Saathoff MR, M. Shireman J, Park C, Budhiraja S, Goel C, Warnke L, Hardiman C, Wang JY, et al. LNX1 Modulates Notch1 Signaling to Promote Expansion of the Glioma Stem Cell Population during Temozolomide Therapy in Glioblastoma. Cancers. 2020; 12(12):3505. https://doi.org/10.3390/cancers12123505
Chicago/Turabian StyleBaisiwala, Shivani, Robert R. Hall, III, Miranda R. Saathoff, Jack M. Shireman, Cheol Park, Shreya Budhiraja, Chirag Goel, Louisa Warnke, Clare Hardiman, Jennifer Y. Wang, and et al. 2020. "LNX1 Modulates Notch1 Signaling to Promote Expansion of the Glioma Stem Cell Population during Temozolomide Therapy in Glioblastoma" Cancers 12, no. 12: 3505. https://doi.org/10.3390/cancers12123505
APA StyleBaisiwala, S., Hall, R. R., III, Saathoff, M. R., M. Shireman, J., Park, C., Budhiraja, S., Goel, C., Warnke, L., Hardiman, C., Wang, J. Y., McCortney, K., Horbinski, C. M., & Ahmed, A. U. (2020). LNX1 Modulates Notch1 Signaling to Promote Expansion of the Glioma Stem Cell Population during Temozolomide Therapy in Glioblastoma. Cancers, 12(12), 3505. https://doi.org/10.3390/cancers12123505