Is There a Causal Relationship between Childhood Obesity and Acute Lymphoblastic Leukemia? A Review


Abstract
Simple Summary
Abstract
1. Introduction
2. The Association of Childhood Obesity & Birth Weight with ALL
2.1. Obesity at Initial ALL Diagnosis
2.2. Birth Weight and ALL
3. Obesity in Childhood ALL Survivors and Its Effects on Outcomes
3.1. Obesity is Common Among Survivors of Childhood ALL
3.2. The Association of Obesity with Relapse Risk and Mortality in ALL
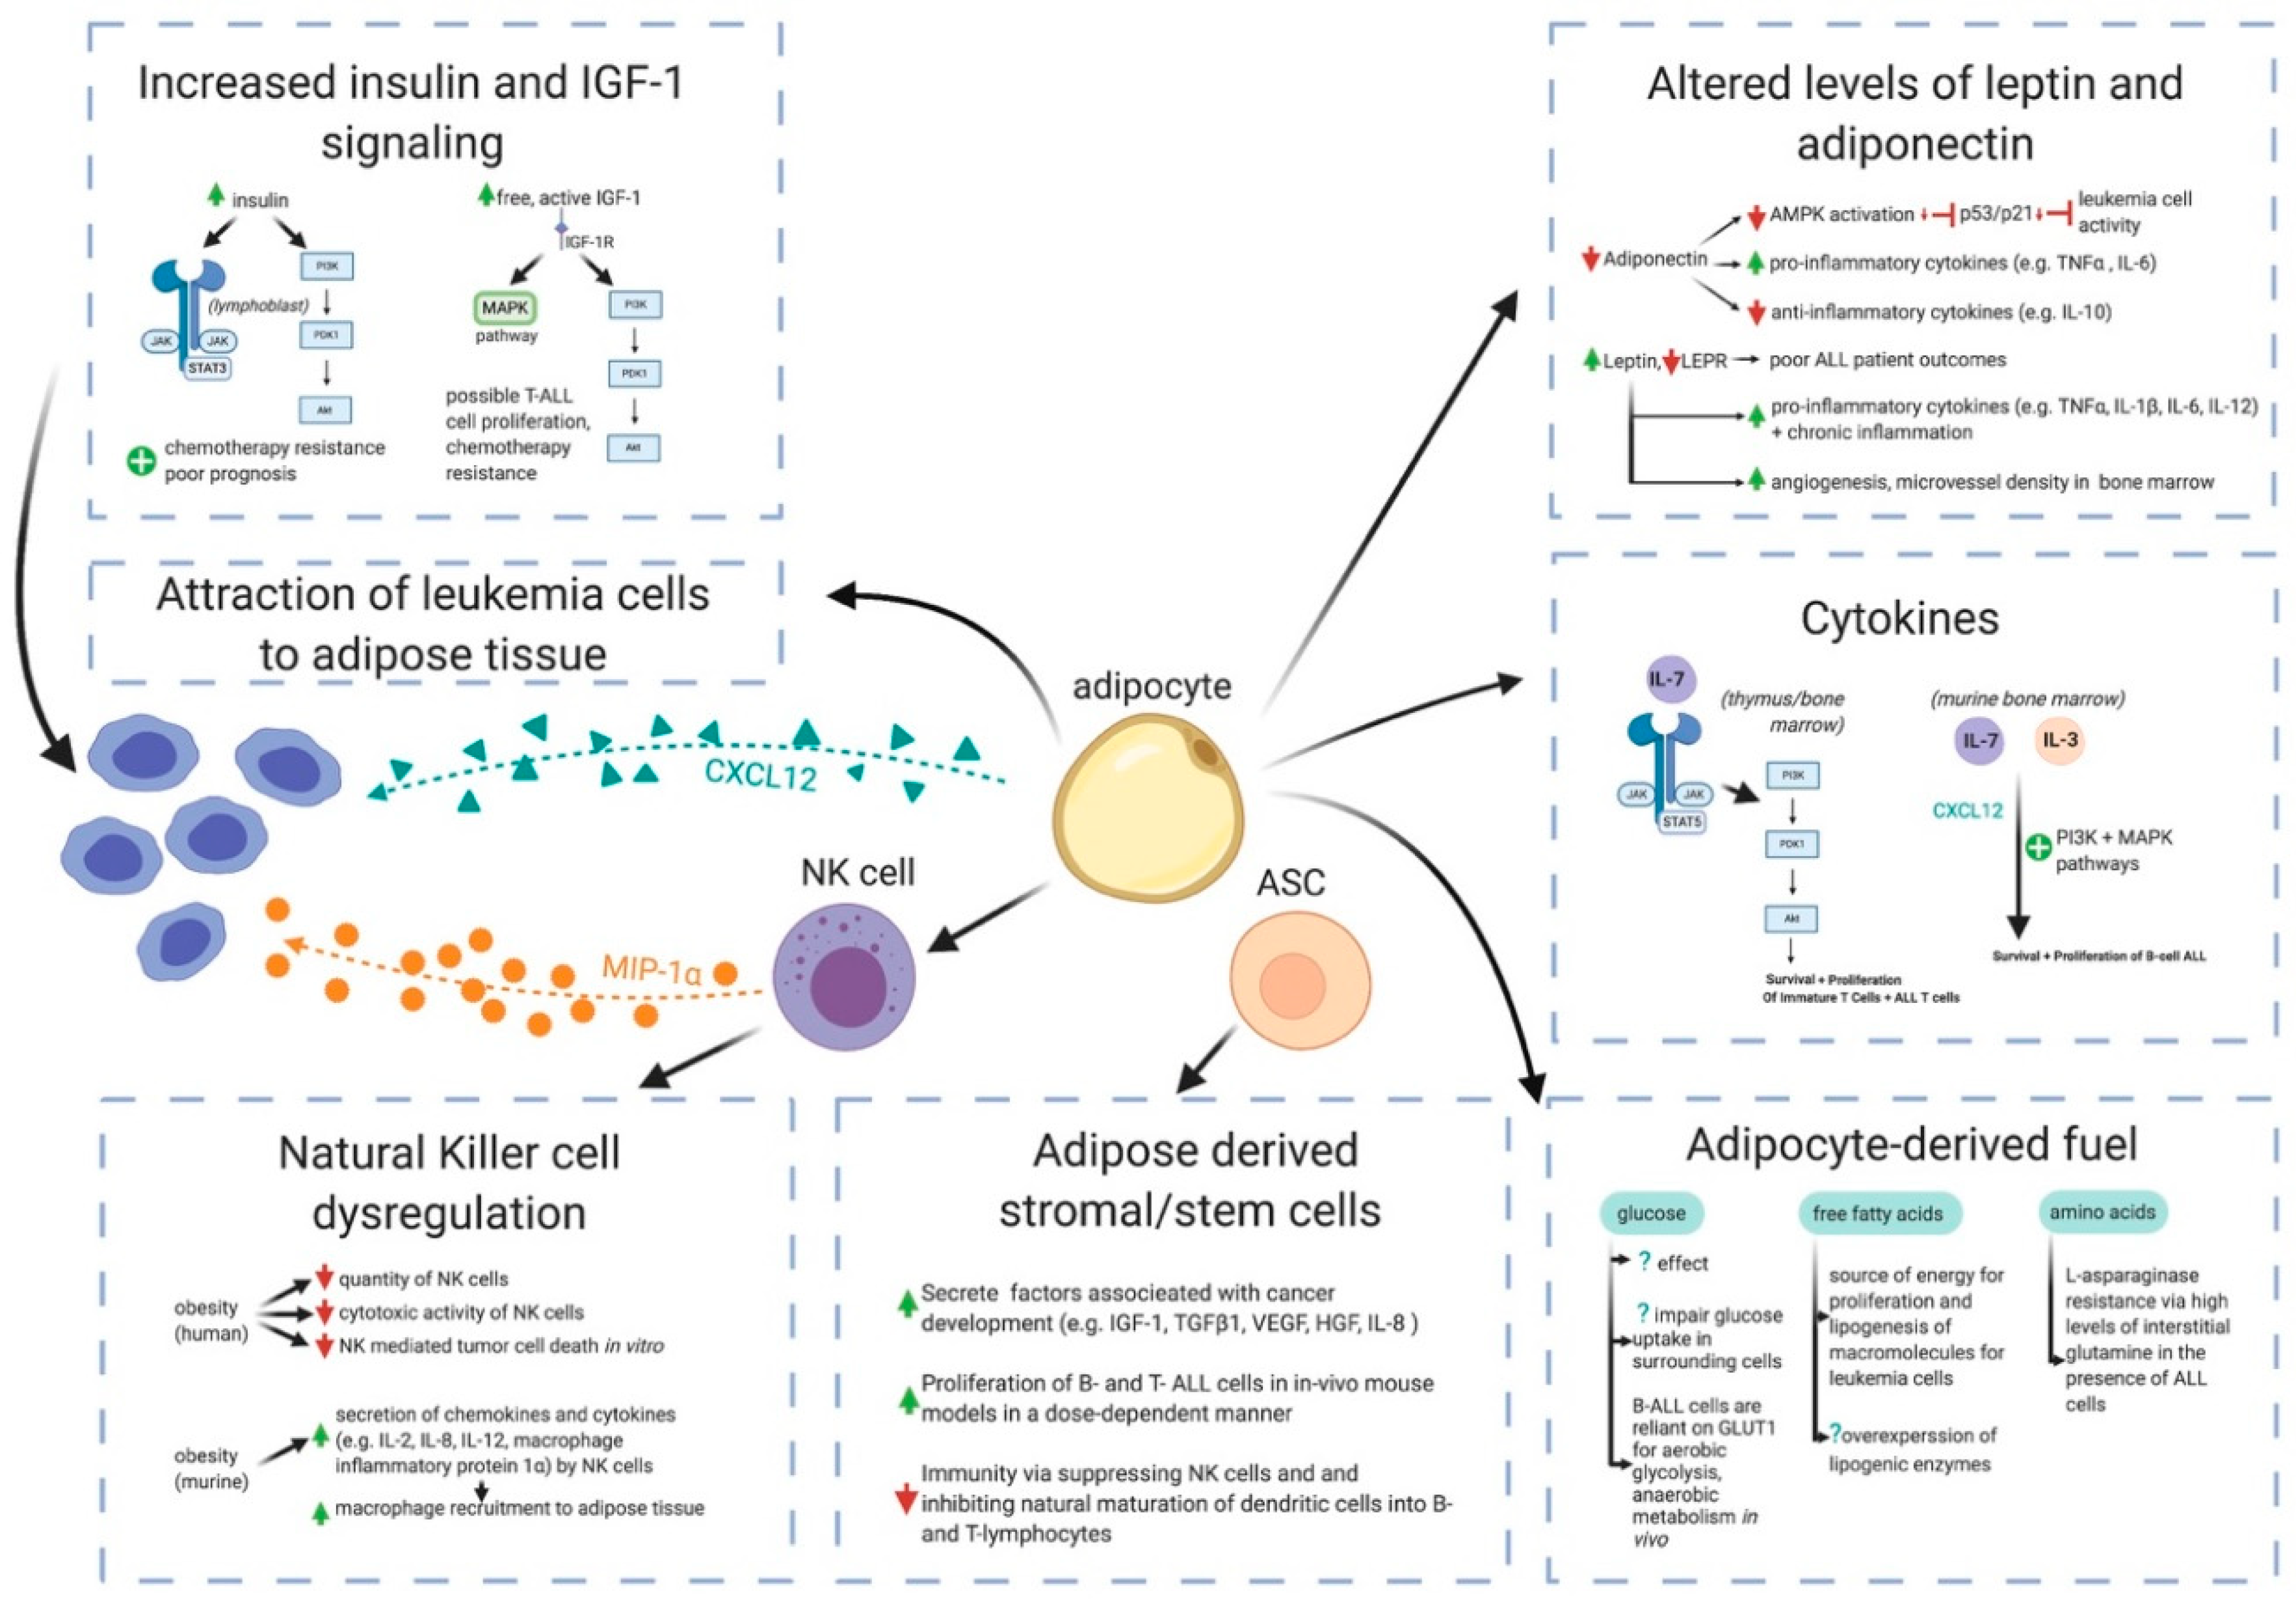
4. Potential Mechanisms by Which Obesity May Contribute to ALL Pathogenesis
4.1. White Adipose Tissue is Far More Than a Passive Calorie Sink in Obesity
4.2. Adipocytes Interference in Pharmacokinetics of ALL Chemotherapies
4.3. Cytokines
4.4. Adiponectin, Leptin, and Leptin Receptor
4.5. Insulin and Insulin-Like Growth Factor-1 (IGF-1)
4.6. Natural Killer Cell Dysregulation
4.7. Adipose-Derived Stem Cells
4.8. Glucose, Free Fatty Acids, and Amino Acids as Fuels for Leukemia Cells
5. Targeted Therapy for Obesity-Associated Acute Lymphoblastic Leukemia
6. Conclusions
Author Contributions
Funding
Conflicts of Interest
References
- Wabitsch, M.; Moss, A.; Kromeyer-Hauschild, K. Unexpected plateauing of childhood obesity rates in developed countries. BMC Med. 2014, 12, 1–5. [Google Scholar] [CrossRef]
- Lipnowski, S.; LeBlanc, C.M.A.; Bridger, T.L.; Houghton, K.; Philpott, J.F.; Templeton, C.G.; Warshawski, T.J.; Purcell, L.K. Healthy active living: Physical activity guidelines for children and adolescents. Paediatr. Child Health (Oxf.) 2012, 17, 209–210. [Google Scholar] [CrossRef]
- Skinner, A.C.; Ravanbakht, S.N.; Skelton, J.A.; Perrin, E.M.; Armstrong, S.C. Prevalence of obesity and severe obesity in US children, 1999-2016. Pediatrics 2018, 141. [Google Scholar] [CrossRef]
- Brown, C.L.; Halvorson, E.E.; Cohen, G.M.; Lazorick, S.; Skelton, J.A. Addressing Childhood Obesity. Opportunities for Prevention. Pediatr. Clin. N. Am. 2015, 62, 1241–1261. [Google Scholar] [CrossRef]
- Ho, M.; Garnett, S.P.; Baur, L.; Burrows, T.; Stewart, L.; Neve, M.; Collins, C. Effectiveness of lifestyle interventions in child obesity: Systematic review with meta-analysis. Pediatrics 2012, 130, e1647–e1671. [Google Scholar] [CrossRef]
- The, N.S.; Suchindran, C.; North, K.E.; Popkin, B.M.; Gordon-Larsen, P. Association of adolescent obesity with risk of severe obesity in adulthood. JAMA 2010, 304, 2042–2047. [Google Scholar] [CrossRef]
- Smith, J.D.; Fu, E.; Kobayashi, M.A. Prevention and Management of Childhood Obesity and Its Psychological and Health Comorbidities. Annu. Rev. Clin. Psychol. 2020, 16, 351–378. [Google Scholar] [CrossRef]
- Singhal, A. Early Life Origins of Obesity and Related Complications. Indian J. Pediatrics 2018, 85, 472–477. [Google Scholar] [CrossRef]
- Sagar, R.; Gupta, T. Psychological Aspects of Obesity in Children and Adolescents. Indian J. Pediatrics 2018, 85, 554–559. [Google Scholar] [CrossRef]
- Koves, I.H.; Roth, C. Genetic and Syndromic Causes of Obesity and its Management. Indian J. Pediatrics 2018, 85, 478–485. [Google Scholar] [CrossRef]
- Vikram, N.K. Cardiovascular and Metabolic Complications–Diagnosis and Management in Obese Children. Indian J. Pediatrics 2018, 85, 535–545. [Google Scholar] [CrossRef]
- Afshin, A.; Forouzanfar, M.H.; Reitsma, M.B.; Sur, P.; Estep, K.; Lee, A.; Marczak, L.; Mokdad, A.H.; Moradi-Lakeh, M.; Naghavi, M.; et al. Health effects of overweight and obesity in 195 countries over 25 years. N. Engl. J. Med. 2017, 377, 13–27. [Google Scholar] [CrossRef]
- Zolotarjova, J.; ten Velde, G.; Vreugdenhil, A.C.E. Effects of multidisciplinary interventions on weight loss and health outcomes in children and adolescents with morbid obesity. Obes. Rev. 2018, 19, 931–946. [Google Scholar] [CrossRef]
- Aggarwal, B.; Jain, V. Obesity in Children: Definition, Etiology and Approach. Indian J. Pediatrics 2018, 85, 463–471. [Google Scholar] [CrossRef]
- Lauby-Secretan, B.; Scoccianti, C.; Loomis, D. Body Fatness and Cancer—Viewpoint of the IARC Working Group. N. Engl. J. Med. 2016, 375, 794–798. [Google Scholar] [CrossRef]
- Murphy, T.K.; Calle, E.E.; Rodriguez, C.; Kahn, H.S.; Thun, M.J. Body mass index and colon cancer mortality in a large prospective study. Am. J. Epidemiol. 2000, 152, 847–854. [Google Scholar] [CrossRef]
- Li, S.D.; Mobarhan, S. Association between body mass index and adenocarcinoma of the esophagus and gastric cardia. Nutr. Rev. 2000, 58, 54–59. [Google Scholar] [CrossRef]
- Chow, W.-H.; Gridley, G.; Fraumeni, J.F.; Järvholm, B. Obesity, Hypertension, and the Risk of Kidney Cancer in Men. N. Engl. J. Med. 2000, 343, 1305–1311. [Google Scholar] [CrossRef]
- Chen, Y.; Liu, L.; Wang, X.; Wang, J.; Yan, Z.; Cheng, J.; Gong, G.; Li, G. Body mass index and risk of gastric cancer:a meta-analysis of a population with more than ten million from 24 prospective studies. Cancer Epidemiol. Biomark. Prev. 2013, 22, 1395–1408. [Google Scholar] [CrossRef]
- World Cancer Research Fund. Diet, Nutrition, Physical Activity and Gallbladder Cancer, 2015 (Revised 2018). World Cancer Research Fund International. Available online: https://www.wcrf.org/sites/default/files/Gallbladder-cancer-report.pdf (accessed on 1 January 2020).
- Genkinger, J.M.; Spiegelman, D.; Anderson, K.E.; Bernstein, L.; Van Den Brandt, P.A.; Calle, E.E.; English, D.R.; Folsom, A.R.; Freudenheim, J.L.; Fuchs, C.S.; et al. A pooled analysis of 14 cohort studies of anthropometric factors and pancreatic cancer risk. Int. J. Cancer 2011, 129, 1708–1717. [Google Scholar] [CrossRef]
- Beral, V.; Hermon, C.; Peto, R.; Reeves, G.; Brinton, L.; Marchbanks, P.; Negri, E.; Ness, R.; Peeters, P.H.M.; Vessey, M.; et al. Ovarian cancer and body size: Individual participant meta-analysis including 25,157 women with ovarian cancer from 47 epidemiological studies. PLoS Med. 2012, 9. [Google Scholar] [CrossRef]
- Kitahara, C.M.; Mccullough, M.L.; Franceschi, S.; Rinaldi, S.; Wolk, A.; Neta, G.; Adami, H.O.; Anderson, K.; Andreotti, G.; Freeman, L.E.B.; et al. Anthropometric factors and thyroid cancer risk by histological subtype: Pooled analysis of 22 prospective studies. Natl. Cancer Inst. 2015, 1–50. [Google Scholar] [CrossRef] [PubMed]
- Arnold, M.; Renehan, A.G.; Colditz, G.A. Excess weight as a risk factor common to many cancer sites: Words of caution when interpreting meta-analytic evidence. Cancer Epidemiol. Biomark. Prev. 2017, 26, 663–665. [Google Scholar] [CrossRef] [PubMed]
- Teras, L.R.; Kitahara, C.M.; Birmann, B.M.; Hartge, P.A.; Wang, S.S.; Robien, K.; Patel, A.V.; Adami, H.O.; Weiderpass, E.; Giles, G.G.; et al. Body size and multiple myeloma mortality: A pooled analysis of 20 prospective studies. Br. J. Haematol. 2014, 166, 667–676. [Google Scholar] [CrossRef]
- Colditz, G.A.; Lindsay, L. Obesity and cancer: Evidence, impact, and future directions. Clin. Chem. 2018, 64, 154–162. [Google Scholar] [CrossRef]
- Genkinger, J.M.; Kitahara, C.M.; Bernstein, L.; Berrington de Gonzalez, A.; Brotzman, M.; Elena, J.W.; Giles, G.G.; Hartge, P.; Singh, P.N.; Stolzenberg-Solomon, R.Z.; et al. Central adiposity, obesity during early adulthood, and pancreatic cancer mortality in a pooled analysis of cohort studies. Ann. Oncol. 2015, 26, 2257–2266. [Google Scholar] [CrossRef]
- Zhang, X.; Wu, K.; Giovannucci, E.L.; Ma, J.; Colditz, G.A.; Fuchs, C.S.; Willett, W.C.; Stampfer, M.J.; Nimptsch, K.; Ogino, S.; et al. Early life body fatness and risk of colorectal cancer in U.S. women and men-results from two large cohort studies. Cancer Epidemiol. Biomark. Prev. 2015, 24, 690–697. [Google Scholar] [CrossRef]
- Hunger, S.P.; Mullighan, C.G. Acute lymphoblastic leukemia in children. N. Engl. J. Med. 2015, 373, 1541–1552. [Google Scholar] [CrossRef]
- Malvi, P.; Chaube, B.; Singh, S.V.; Mohammad, N.; Vijayakumar, M.V.; Singh, S.; Chouhan, S.; Bhat, M.K. Elevated circulatory levels of leptin and resistin impair therapeutic efficacy of dacarbazine in melanoma under obese state. Cancer Metab. 2018, 6, 1–14. [Google Scholar] [CrossRef]
- Malvi, P.; Chaube, B.; Singh, S.V.; Mohammad, N.; Pandey, V.; Vijayakumar, M.V.; Radhakrishnan, R.M.; Vanuopadath, M.; Nair, S.S.; Nair, B.G.; et al. Weight control interventions improve therapeutic efficacy of dacarbazine in melanoma by reversing obesity-induced drug resistance. Cancer Metab. 2016, 4. [Google Scholar] [CrossRef]
- Shields, M. Overweight and obesity among children and youth. Health Rep. 2006, 17, 27–42. [Google Scholar]
- Smith, M.A.; Seibel, N.L.; Altekruse, S.F.; Ries, L.A.G.; Melbert, D.L.; O’Leary, M.; Smith, F.O.; Reaman, G.H. Outcomes for children and adolescents with cancer: Challenges for the twenty-first century. J. Clin. Oncol. 2010, 28, 2625–2634. [Google Scholar] [CrossRef] [PubMed]
- Van Dongen-Melman, J.E.W.M.; Hokken-Koelega, A.C.S.; Hâhlen, K.; De Groot, A.; Tromp, C.G.; Egeler, R.M. Obesity after successful treatment of acute lymphoblastic leukemia in childhood. Pediatric Res. 1995, 38, 86–90. [Google Scholar] [CrossRef] [PubMed]
- Withycombe, J.S.; Post-White, J.E.; Meza, J.L.; Hawks, R.G.; Smith, L.M.; Sacks, N.; Seibel, N.L. Weight patterns in children with higher risk ALL: A report from the Children’s Oncology Group (COG) for CCG 1961. Bone 2009, 53, 1249–1254. [Google Scholar] [CrossRef] [PubMed]
- Breene, R.A.L.; Williams, R.M.; Hartle, J.; Gattens, M.; Acerini, C.L.; Murray, M.J. Auxological changes in UK survivors of childhood acute lymphoblastic leukaemia treated without cranial irradiation. Br. J. Cancer 2011, 104, 746–749. [Google Scholar] [CrossRef] [PubMed]
- Razzouk, B.I.; Rose, S.R.; Hongeng, S.; Wallace, D.; Smeltzer, M.P.; Zacher, M.; Pui, C.H.; Hudson, M.M. Obesity in survivors of childhood acute lymphoblastic leukemia and lymphoma. J. Clin. Oncol. 2007, 25, 1183–1189. [Google Scholar] [CrossRef] [PubMed]
- Ghosh, T.; Richardson, M.; Ryder, J.; Spector, L.; Turcotte, L. Obesity as a Risk Factor for Pediatric Acute Lymphoblastic Leukemia: A Report from the Children’s Oncology Group; American Association for Cancer Research: Philadelphia, PA, USA, 2019. [Google Scholar]
- Foster, K.L.; Kern, K.D.; Chambers, T.M.; Lupo, P.J.; Kamdar, K.Y.; Scheurer, M.E.; Brown, A.L. Weight trends in a multiethnic cohort of pediatric acute lymphoblastic leukemia survivors: A longitudinal analysis. PLoS ONE 2019, 14, 1–11. [Google Scholar] [CrossRef]
- Didi, M.; Didcock, E.; Davies, H.A.; Ogilvy-Stuart, A.L.; Wales, J.K.H.; Shalet, S.M. High incidence of obesity in young adults after treatment of acute lymphoblastic leukemia in childhood. J. Pediatrics 1995, 127, 63–67. [Google Scholar] [CrossRef]
- Craig, F.; Leiper, A.D.; Stanhope, R.; Brain, C.; Meller, S.T.; Nussey, S.S. Sexually dimorphic and radiation dose dependent effect of cranial irradiation on body mass index. Arch. Dis. Child. 1999, 81, 500–504. [Google Scholar] [CrossRef][Green Version]
- Odame, I.; Reilly, J.J.; Gibson, B.E.S.; Donaldson, M.D.C. Patterns of obesity in boys and girls after treatment for acute lymphoblastic leukaemia. Arch. Dis. Child. 1994, 71, 147–149. [Google Scholar] [CrossRef][Green Version]
- Hjalgrim, L.L.; Westergaard, T.; Rostgaard, K.; Schmiegelow, K.; Melbye, M.; Hjalgrim, H.; Engels, E.A. Birth weight as a risk factor for childhood leukemia: A meta-analysis of 18 epidemiologic studies. Am. J. Epidemiol. 2003, 158, 724–735. [Google Scholar] [CrossRef] [PubMed]
- Caughey, R.W.; Michels, K.B. Birth weight and childhood leukemia: A meta-analysis and review of the current evidence. Int. J. Cancer 2009, 124, 2658–2670. [Google Scholar] [CrossRef] [PubMed]
- Milne, E.; Royle, J.A.; De Klerk, N.H.; Blair, E.; Bailey, H.; Cole, C.; Attia, J.; Scott, R.J.; Armstrong, B.K. Fetal growth and risk of childhood acute lymphoblastic leukemia: Results from an australian case-control study. Am. J. Epidemiol. 2009, 170, 221–228. [Google Scholar] [CrossRef]
- Jiménez-Hernández, E.; Fajardo-Gutiérrez, A.; Núñez-Enriquez, J.C.; Martín-Trejo, J.A.; Espinoza-Hernández, L.E.; Flores-Lujano, J.; Arellano-Galindo, J.; Medina-Sanson, A.; Paredes-Aguilera, R.; Merino-Pasaye, L.E.; et al. A greater birthweight increases the risk of acute leukemias in Mexican children—experience from the Mexican Interinstitutional Group for the Identification of the Causes of Childhood Leukemia (MIGICCL). Cancer Med. 2018, 7, 1528–1536. [Google Scholar] [CrossRef]
- Sprehe, M.R.; Barahmani, N.; Cao, Y.; Wang, T.; Forman, M.R.; Bondy, M.; Okcu, M.F. Comparison of Birth Weight Corrected for Gestational Age and Birth Weight Alone in Prediction of Development of Childhood Leukemia and Central Nervous System Tumors. Pediatrics Blood Cancer 2010, 54, 242–249. [Google Scholar] [CrossRef] [PubMed]
- Wiemels, J.L.; Cazzaniga, G.; Daniotti, M.; Eden, O.B.; Addison, G.M.; Masera, G.; Saha, V.; Biondi, A.; Greaves, M.F. Prenatal origin of acute lymphoblastic leukaemia in children. Lancet 1999, 354, 1499–1503. [Google Scholar] [CrossRef]
- Hjalgrim, L.L.; Madsen, H.O.; Melbye, M.; Jørgensen, P.; Christiansen, M.; Andersen, M.T.; Pallisgaard, N.; Hokland, P.; Clausen, N.; Schmiegelow, K.; et al. Presence of clone-specific markers at birth in children with acute lymphoblastic leukaemia. Br. J. Cancer 2002, 87, 994–999. [Google Scholar] [CrossRef]
- Greaves, M.F.; Wiemels, J. Origins of chromosome translocations in childhood leukaemia. Nat. Rev. Cancer 2003, 3, 639–649. [Google Scholar] [CrossRef]
- Eden, T. Aetiology of childhood leukaemia. Cancer Treat. Rev. 2010, 36, 286–297. [Google Scholar] [CrossRef]
- Zee, P.; Chen, C.-H. Prevalence of Obesity in Children After Therapy for Acute Lymphoblastic Leukemia. J. Pediatrics Hematol. Oncol. 1986, 8, 294–299. [Google Scholar] [CrossRef]
- Garmey, E.G.; Liu, Q.; Sklar, C.A.; Meacham, L.R.; Mertens, A.C.; Stovall, M.A.; Yasui, Y.; Robison, L.L.; Oeffinger, K.C. Longitudinal changes in obesity and body mass index among adult survivors of childhood acute lymphoblastic leukemia: A report from the childhood cancer survivor study. J. Clin. Oncol. 2008, 26, 4639–4645. [Google Scholar] [CrossRef] [PubMed]
- Baillargeon, J.; Langevin, A.-M.; Lewis, M.; Estrada, J.; Grady, J.J.; Mullins, J.; Pitney, A.; Pollock, B.H. Demographic correlates of body size changes in children undergoing treatment for acute lymphoblastic leukemia. Pediatrics Blood Cancer 2007, 49, 793–796. [Google Scholar] [CrossRef] [PubMed]
- Chow, E.J.; Pihoker, C.; Hunt, K.; Wilkinson, K.; Friedman, D.L. Obesity and hypertension among children after treatment for acute lymphoblastic leukemia. Cancer 2007, 110, 2313–2320. [Google Scholar] [CrossRef] [PubMed]
- Zhang, F.F.; Kelly, M.J.; Saltzman, E.; Must, A.; Roberts, S.B.; Parsons, S.K. Obesity in pediatric ALL survivors: A meta-analysis. Pediatrics 2014, 133, e704–e715. [Google Scholar] [CrossRef]
- Saenz, A.M.; Stapleton, S.; Hernandez, R.G.; Hale, G.A.; Goldenberg, N.A.; Schwartz, S.; Amankwah, E.K. Body Mass Index at Pediatric Leukemia Diagnosis and the Risks of Relapse and Mortality: Findings from a Single Institution and Meta-analysis. J. Obes. 2018, 2018, 1–8. [Google Scholar] [CrossRef] [PubMed]
- Orgel, E.; Genkinger, J.M.; Aggarwal, D.; Sung, L.; Nieder, M.; Ladas, E.J. Association of body mass index and survival in pediatric leukemia: A meta-analysis. Am. J. Clin. Nutr. 2016, 103, 808–817. [Google Scholar] [CrossRef]
- Orgel, E.; Tucci, J.; Alhushki, W.; Malvar, J.; Sposto, R.; Fu, C.H.; Freyer, D.R.; Abdel-Azim, H.; Mittelman, S.D. Obesity is associated with residual leukemia following induction therapy for childhood B-precursor acute lymphoblastic leukemia. Blood 2014, 124, 3932–3938. [Google Scholar] [CrossRef]
- Meenan, C.K.; Kelly, J.A.; Wang, L.; Ritchey, A.K.; Maurer, S.H. Obesity in pediatric patients with acute lymphoblastic leukemia increases the risk of adverse events during pre-maintenance chemotherapy. Pediatr. Blood Cancer 2019, 66, 1–7. [Google Scholar] [CrossRef]
- Gelelete, C.B.; Pereira, S.H.; Azevedo, A.M.B.; Thiago, L.S.; Mundim, M.; Land, M.G.P.; Costa, E.S. Overweight as a prognostic factor in children with acute lymphoblastic leukemia. Obesity 2011, 19, 1908–1911. [Google Scholar] [CrossRef]
- Butturini, A.M.; Dorey, F.J.; Lange, B.J.; Henry, D.W.; Gaynon, P.S.; Fu, C.; Franklin, J.; Siegel, S.E.; Seibel, N.L.; Rogers, P.C.; et al. Obesity and outcome in pediatric acute lymphoblastic leukemia. J. Clin. Oncol. 2007, 25, 2063–2069. [Google Scholar] [CrossRef]
- Amankwah, E.K.; Saenz, A.M.; Hale, G.A.; Brown, P.A. Association between body mass index at diagnosis and pediatric leukemia mortality and relapse: A systematic review and meta-analysis. Leuk. Lymphoma 2016, 57, 1140–1148. [Google Scholar] [CrossRef] [PubMed]
- Pramanik, R.; Sheng, X.; Ichihara, B.; Heisterkamp, N.; Mittelman, S.D. Adipose tissue attracts and protects acute lymphoblastic leukemia cells from chemotherapy. Leuk Res. 2013, 37, 503–509. [Google Scholar] [CrossRef] [PubMed]
- Fasshauer, M.; Blüher, M. Adipokines in health and disease. Trends Pharmacol. Sci. 2015, 36, 461–470. [Google Scholar] [CrossRef] [PubMed]
- Polyzos, S.A.; Kountouras, J.; Mantzoros, C.S. Adipokines in nonalcoholic fatty liver disease. Metabolism. 2016, 65, 1062–1079. [Google Scholar] [CrossRef] [PubMed]
- Himbert, C.; Delphan, M.; Scherer, D.; Bowers, L.W.; Hursting, S.; Ulrich, C.M. Signals from the adipose microenvironment and the obesity-cancer link-a systematic review. Cancer Prev. Res. 2017, 10, 494–506. [Google Scholar] [CrossRef] [PubMed]
- Weihrauch-Blüher, S.; Schwarz, P.; Klusmann, J.H. Childhood obesity: Increased risk for cardiometabolic disease and cancer in adulthood. Metabolism 2019, 92, 147–152. [Google Scholar] [CrossRef]
- Kershaw, E.E.; Flier, J.S. Adipose tissue as an endocrine organ. J. Clin. Endocrinol. Metab. 2004, 89, 2548–2556. [Google Scholar] [CrossRef]
- Skurk, T.; Alberti-Huber, C.; Herder, C.; Hauner, H. Relationship between adipocyte size and adipokine expression and secretion. J. Clin. Endocrinol. Metab. 2007, 92, 1023–1033. [Google Scholar] [CrossRef]
- Kern, p.A.; Saghizadeh, M.; Ong, J.M.; Bosch, R.J.; Deem, R.; Simsolo, R.B. The expression of tumor necrosis factor in human adipose tissue: Regulation by obesity, weight loss, and relationship to lipoprotein lipase. J. Clin. Invest. 1995, 95, 2111–2119. [Google Scholar] [CrossRef]
- Yun, J.P.; Behan, J.W.; Heisterkamp, N.; Butturini, A.; Klemm, L.; Ji, L.; Groffen, J.; Müschen, M.; Mittelman, S.D. Diet-induced obesity accelerates acute lymphoblastic leukemia progression in two murine models. Cancer Prev. Res. 2010, 3, 1259–1264. [Google Scholar] [CrossRef]
- Hotamisligil, G.S.; Arner, P.; Caro, J.F.; Atkinson, R.L.; Spiegelman, B.M. Increased adipose tissue expression of tumor necrosis factor-α in human obesity and insulin resistance. J. Clin. Invest. 1995, 95, 2409–2415. [Google Scholar] [CrossRef] [PubMed]
- Bruun, J.M.; Pedersen, S.B.; Richelsen, B. Regulation of interleukin 8 production and gene expression in human adipose tissue in vitro. J. Clin. Endocrinol. Metab. 2001, 86, 1267–1273. [Google Scholar] [CrossRef] [PubMed]
- Hauner, H.; Bender, M.; Haastert, B.; Hube, F. Plasma concentrations of soluble TNF-alpha receptors in obese subjects. Int. J. Obes. 1998, 22, 1239–1243. [Google Scholar] [CrossRef]
- Mohamed-Ali, V.; Goodrick, S.; Rawesh, A.; Katz, D.R.; Miles, J.M.; Yudkin, J.S.; Klein, S.; Coppack, S.W. Subcutaneous adipose tissue releases interleukin-6, but not tumor necrosis factor-α, in vivo. J. Clin. Endocrinol. Metab. 1997, 82, 4196–4200. [Google Scholar] [CrossRef]
- Cawthorn, W.P.; Scheller, E.L.; Learman, B.S.; Parlee, S.D.; Simon, B.R.; Mori, H.; Ning, X.; Bree, A.J.; Schell, B.; Broome, T.; et al. Bone marrow adipose tissue is an endocrine organ that contributes to increased circulating adiponectin during caloric restriction. Cell Metab. 2015, 20, 368–375. [Google Scholar] [CrossRef]
- Strong, A.L.; Burow, M.E.; Gimble, J.M.; Bunnell, B.A. Concise review: The obesity cancer paradigm: Exploration of the interactions and crosstalk with adipose stem cells. Stem Cells 2015, 33, 318–326. [Google Scholar] [CrossRef]
- Ibrahim, M.M. Subcutaneous and visceral adipose tissue: Structural and functional differences. Obes. Rev. 2010, 11, 11–18. [Google Scholar] [CrossRef] [PubMed]
- Rittig, K.; Hieronimus, A.; Thamer, C.; Machann, J.; Peter, A.; Stock, J.; Schick, F.; Fritsche, A.; Stefan, N.; Häring, H.U.; et al. Reducing visceral adipose tissue mass is essential for improving endothelial function in type 2 diabetes prone individuals. Atherosclerosis 2010, 212, 575–579. [Google Scholar] [CrossRef] [PubMed]
- Tam, C.S.; Heilbronn, L.K.; Henegar, C.; Wong, M.; Cowell, C.T.; Cowley, M.J.; Kaplan, W.; Clément, K.; Baur, L.A. An early inflammatory gene profile in visceral adipose tissue in children. Int. J. Pediatrics Obes. 2011, 6, e360–e363. [Google Scholar] [CrossRef] [PubMed]
- Wajchenberg, B.L.; Giannella-Neto, D.; Da Silva, M.E.R.; Santos, R.F. Depot-specific hormonal characteristics of subcutaneous and visceral adipose tissue and their relation to the metabolic syndrome. Horm. Metab. Res. 2002, 34, 616–621. [Google Scholar] [CrossRef] [PubMed]
- Lopes, H.F.; Corrêa-Giannella, M.L.; Consolim-Colombo, F.M.; Egan, B.M. Visceral adiposity syndrome. Diabetol. Metab. Syndr. 2016, 8, 1–8. [Google Scholar] [CrossRef]
- West, D.B.; Prinz, W.A.; Francendese, A.A.; Greenwood, M.R.C. Adipocyte blood flow is decreased in obse Zucker rats. Am. J. Physiol. Regul. Integr. Comp. Physiol. 1987, 253, 228–233. [Google Scholar] [CrossRef] [PubMed]
- Trayhurn, P. Hypoxia and adipose tissue function and dysfunction in obesity. Physiol. Rev. 2013, 93, 1–21. [Google Scholar] [CrossRef]
- Pecht, T.; Gutman-Tirosh, A.; Bashan, N.; Rudich, A. Peripheral blood leucocyte subclasses as potential biomarkers of adipose tissue inflammation and obesity subphenotypes in humans. Obes. Rev. 2014, 15, 322–337. [Google Scholar] [CrossRef] [PubMed]
- Evans, J.; Goedecke, J.H.; Söderström, I.; Burén, J.; Alvehus, M.; Blomquist, C.; Jonsson, F.; Hayes, P.M.; Adams, K.; Dave, J.A.; et al. Depot- and ethnic-specific differences in the relationship between adipose tissue inflammation and insulin sensitivity. Clin. Endocrinol. (Oxf.) 2011, 74, 51–59. [Google Scholar] [CrossRef]
- Kitade, H.; Sawamoto, K.; Nagashimada, M.; Inoue, H.; Yamamoto, Y.; Sai, Y.; Takamura, T.; Yamamoto, H.; Miyamoto, K.I.; Ginsberg, H.N.; et al. CCR5 plays a critical role in obesity-induced adipose tissue inflammation and insulin resistance by regulating both macrophage recruitment and M1/M2 status. Diabetes 2012, 61, 1680–1690. [Google Scholar] [CrossRef]
- Suganami, T.; Tanaka, M.; Ogawa, Y. Adipose tissue inflammation and ectopic lipid accumulation. Endocr. J. 2012, 59, 849–857. [Google Scholar] [CrossRef]
- Samaan, M.C. The macrophage at the intersection of immunity and metabolism in obesity. Diabetol. Metab. Syndr. 2011, 3, 29. [Google Scholar] [CrossRef]
- Behan, J.W.; Yun, J.P.; Proektor, M.P.; Ehsanipour, E.A.; Arutyunyan, A.; Moses, A.S.; Avramis, V.I.; Louie, S.G.; Butturini, A.; Heisterkamp, N.; et al. Adipocytes impair leukemia treatment in mice. Cancer Res. 2009, 69, 7867–7874. [Google Scholar] [CrossRef] [PubMed]
- Sheng, X.; Mittelman, S.D. The role of adipose tissue and obesity in causing treatment resistance of acute lymphoblastic leukemia. Front. Pediatrics 2014, 2, 1–8. [Google Scholar] [CrossRef]
- Zuccaro, P.; Guandalini, S.; Pacifici, R.; Simona, P.; Di, L.M.; Guiducci, M.; Giuliano, M.; Di Tullio, M.T.; Mantovani, M.P. Fat body mass and pharmacokinetics of oral 6-mercaptopurine in children with acute lymphoblastic leukemia. Ther. Drug Monit. 1991, 13, 37–41. [Google Scholar] [CrossRef] [PubMed]
- Sheng, X.; Parmentier, J.H.; Tucci, J.; Pei, H.; Cortez-Toledo, O.; Dieli-Conwright, C.M.; Oberley, M.J.; Neely, M.; Orgel, E.; Louie, S.G.; et al. Adipocytes sequester and metabolize the chemotherapeutic daunorubicin. Mol. Cancer Res. 2017, 15, 1704–1713. [Google Scholar] [CrossRef] [PubMed]
- De Lourdes Perim, A.; Amarante, M.K.; Guembarovski, R.L.; De Oliveira, C.E.C.; Watanabe, M.A.E. CXCL12/CXCR4 axis in the pathogenesis of acute lymphoblastic leukemia (ALL): A possible therapeutic target. Cell. Mol. Life Sci. 2015, 72, 1715–1723. [Google Scholar] [CrossRef]
- Orgel, E.; Sea, J.L.; Mittelman, S.D. Mechanisms by which obesity impacts survival from acute lymphoblastic leukemia. JNCI Monogr. 2019, 2019, 152–156. [Google Scholar] [CrossRef]
- Chen, J. Multiple signal pathways in obesity-associated cancer. Obes. Rev. 2011, 12, 1063–1070. [Google Scholar] [CrossRef] [PubMed]
- Beksaç, M.; Ertürk, S.; Akan, H.; Koç, H.; Ilhan, O. The clinical correlations of serum tumor necrosis factor-alpha in acute leukemias: A predictor of response and relapse? Leukemia 1993, 7, 1773–1776. [Google Scholar] [PubMed]
- Eisenkraft, A.; Keidan, I.; Bielorai, B.; Keller, N.; Toren, A.; Paret, G. MCP-1 in the cerebrospinal fluid of children with acute lymphoblastic leukemia. Leuk. Res. 2006, 30, 1259–1261. [Google Scholar] [CrossRef]
- Protas, P.T.; Holownia, A.; Muszynska-Roslan, K.; Wielgat, P.; Krawczuk-Rybak, M.; Braszko, J.J. Cerebrospinal fluid IL-6, TNF-α and MCP-1 in children with acute lymphoblastic leukaemia during chemotherapy. Neuropediatrics 2011, 42, 254–256. [Google Scholar] [CrossRef]
- Jaime-Pérez, J.C.; Gamboa-Alonso, C.M.; Jiménez-Castillo, R.A.; López-Silva, L.J.; Pinzón-Uresti, M.A.; Gómez-De León, A.; Gómez-Almaguer, D. TNF-α increases in the CSF of children with acute lymphoblastic leukemia before CNS relapse. Blood Cells Mol. Dis. 2017, 63, 27–31. [Google Scholar] [CrossRef]
- Zenatti, P.P.; Ribeiro, D.; Li, W.; Zuurbier, L.; Silva, M.C.; Paganin, M.; Tritapoe, J.; Hixon, J.A.; Silveira, A.B.; Cardoso, B.A.; et al. Oncogenic IL7R gain-of-function mutations in childhood T-cell acute lymphoblastic leukemia. Nat. Genet. 2011, 43, 932–941. [Google Scholar] [CrossRef]
- Ribeiro, D.; Melão, A.; Barata, J.T. IL-7R-mediated signaling in T-cell acute lymphoblastic leukemia. Adv. Biol. Regul. 2013, 53, 211–222. [Google Scholar] [CrossRef]
- Peschon, J.J.; Morrissey, P.J.; Grabstein, K.H.; Ramsdell, F.J.; Maraskovsky, E.; Gliniak, B.C.; Park, L.S.; Ziegler, S.F.; Williams, D.E.; Ware, C.B.; et al. Early lymphocyte expansion is severely impaired in interleukin 7 receptor-deficient mice. J. Exp. Med. 1994, 180, 1955–1960. [Google Scholar] [CrossRef] [PubMed]
- Puel, A.; Ziegler, S.F.; Buckley, R.H.; Leonard, W.J. Defective IL7R expression in T-B+NK+ severe combined immunodeficiency. Nat. Genet. 1998, 20, 394–397. [Google Scholar] [CrossRef] [PubMed]
- Ramanathan, S.; Gagnon, J.; Leblanc, C.; Rottapel, R.; Ilangumaran, S. Suppressor of Cytokine Signaling 1 Stringently Regulates Distinct Functions of IL-7 and IL-15 In Vivo during T Lymphocyte Development and Homeostasis. J. Immunol. 2006, 176, 4029–4041. [Google Scholar] [CrossRef]
- Juarez, J.; Baraz, R.; Gaundar, S.; Bradstock, K.; Bendall, L. Interaction of interleukin-7 and interleukin-3 with the CXCL12-induced proliferation of B-cell progenitor acute lymphoblastic leukemia. Haematologica 2007, 92, 450–459. [Google Scholar] [CrossRef] [PubMed]
- Chiarini, F.; Lonetti, A.; Evangelisti, C.; Buontempo, F.; Orsini, E.; Evangelisti, C.; Cappellini, A.; Neri, L.M.; McCubrey, J.A.; Martelli, A.M. Advances in understanding the acute lymphoblastic leukemia bone marrow microenvironment: From biology to therapeutic targeting. Biochim. Biophys. Acta Mol. Cell Res. 2016, 1863, 449–463. [Google Scholar] [CrossRef] [PubMed]
- Juarez, J.; Bradstock, K.F.; Gottlieb, D.J.; Bendall, L.J. Effects of inhibitors of the chemokine receptor CXCR4 on acute lymphoblastic leukemia cells in vitro. Leukemia 2003, 17, 1294–1300. [Google Scholar] [CrossRef] [PubMed]
- Housa, D.; Housová, J.; Vernerová, Z.; Haluzík, M. Adipocytokines and cancer. Physiol. Res. 2006, 55, 233–244. [Google Scholar]
- Aref, S.; Ibrahim, L.; Azmy, E.; Al Ashary, R. Impact of serum adiponectin and leptin levels in acute leukemia. Hematology 2013, 18, 198–203. [Google Scholar] [CrossRef]
- Wang, Z.V.; Scherer, P.E. Adiponectin, the past two decades. J. Mol. Cell Biol. 2016, 8, 93–100. [Google Scholar] [CrossRef]
- El-Baz, H.A.; Mosa, T.E.; Elabd, E.M.; Ramadan, A.; Elharoun, A.S.; Elmorsy, E.A.; Fouda, M.I. Serum adiponectin and resistin levels in de novo and relapsed acute lymphoblastic leukemia children patients. Iran. J. Public Health 2013, 42, 504–510. [Google Scholar] [PubMed]
- Leclerc, G.M.; Leclerc, G.J.; Kuznetsov, J.N.; DeSalvo, J.; Barredo, J.C. Metformin Induces Apoptosis through AMPK-Dependent Inhibition of UPR Signaling in ALL Lymphoblasts. PLoS ONE 2013, 8, 1–10. [Google Scholar] [CrossRef] [PubMed]
- Dalamaga, M.; Diakopoulos, K.N.; Mantzoros, C.S. The role of adiponectin in cancer: A review of current evidence. Endocr. Rev. 2012, 33, 547–594. [Google Scholar] [CrossRef] [PubMed]
- Dalamaga, M.; Christodoulatos, G.S. Adiponectin as a biomarker linking obesity and adiposopathy to hematologic malignancies. Horm. Mol. Biol. Clin. Investig. 2015, 23, 5–20. [Google Scholar] [CrossRef]
- Zhang, Y.; Proenca, R.; Maffei, M.; Barone, M.; Leopold, L.; Friedman, J.M. Positional cloning of the mouse obese gene and its human homologue. Nature 1994, 372, 425–432. [Google Scholar] [CrossRef]
- Park, J.; Scherer, P.E. Leptin and cancer: From cancer stem cells to metastasis. Endocr. Relat. Cancer 2011, 18, 25–29. [Google Scholar] [CrossRef]
- Considine, R.V.; Sinha, M.K.; Heiman, M.L.; Kriauciunas, A.; Stephens, T.W.; Nyce, M.R.; Ohannesian, J.P.; Marco, C.C.; McKee, L.J.; Bauer, T.L.; et al. Serum Immunoreactive-Leptin Concentrations in Normal-Weight and Obese Humans. N. Engl. J. Med. 1996, 334, 292–295. [Google Scholar] [CrossRef]
- Lu, Z.; Xie, J.; Wu, G.; Shen, J.; Collins, R.; Chen, W.; Kang, X.; Luo, M.; Zou, Y.; Huang, L.J.-S.; et al. Fasting selectively blocks development of acute lymphoblastic leukemia via leptin-receptor upregulation. Nat. Med. 2017, 23, 79–90. [Google Scholar] [CrossRef]
- Myers, M.G.; Leibel, R.L.; Seeley, R.J.; Schwartz, M.W. Obesity and leptin resistance: Distinguishing cause from effect. Trends Endocrinol. Metab. 2010, 21, 643–651. [Google Scholar] [CrossRef]
- Carbone, F.; La Rocca, C.; Matarese, G. Immunological functions of leptin and adiponectin. Biochimie 2012, 94, 2082–2088. [Google Scholar] [CrossRef]
- Perez-Atayde, A.R.; Sallan, S.E.; Tedrow, U.; Connors, S.; Allred, E.; Folkman, J. Spectrum of tumor angiogenesis in the bone marrow of children with acute lymphoblastic leukemia. Am. J. Pathol. 1997, 150, 815–821. [Google Scholar] [PubMed]
- Iversen, P.O.; Drevon, C.A.; Reseland, J.E. Prevention of leptin binding to its receptor suppresses rat leukemic cell growth by inhibiting angiogenesis. Blood 2002, 100, 4123–4128. [Google Scholar] [CrossRef] [PubMed]
- Ho, M.; Garnett, S.P.; Baur, L.A. Childhood Obesity and Insulin Resistance: How Should It Be Managed? Curr. Treat. Options Cardiovasc Med. 2014, 16. [Google Scholar] [CrossRef]
- Frohnert, B.I.; Jacobs, D.R.; Steinberger, J.; Moran, A.; Steffen, L.M.; Sinaiko, A.R. Relation between serum free fatty acids and adiposity, insulin resistance, and cardiovascular risk factors from adolescence to adulthood. Diabetes 2013, 62, 3163–3169. [Google Scholar] [CrossRef] [PubMed]
- Sciacca, L.; Cassarino, M.F.; Genua, M.; Vigneri, P.; Giovanna Pennisi, M.; Malandrino, P.; Squatrito, S.; Pezzino, V.; Vigneri, R. Biological Effects of Insulin and Its Analogs on Cancer Cells With Different Insulin Family Receptor Expression. J. Cell. Physiol. 2014, 229, 1817–1821. [Google Scholar] [CrossRef]
- Steelman, L.S.; Abrams, S.L.; Whelan, J.; Bertrand, F.E.; Ludwig, D.E.; Bäsecke, J.; Libra, M.; Stivala, F.; Milella, M.; Tafuri, A.; et al. Contributions of the Raf/MEK/ERK, PI3K/PTEN/Akt/mTOR and Jak/STAT pathways to leukemia. Leukemia 2008, 22, 686–707. [Google Scholar] [CrossRef]
- Pan, J.; Chen, C.; Jin, Y.; Fuentes-Mattei, E.; Velazquez-Tores, G.; Benito, J.M.; Konopleva, M.; Andreeff, M.; Lee, M.H.; Yeung, S.C.J. Differential impact of structurally different anti-diabetic drugs on proliferation and chemosensitivity of acute lymphoblastic leukemia cells. Cell Cycle 2012, 11, 2314–2326. [Google Scholar] [CrossRef]
- Wang, J.; Xue, H.M.; Chen, Y.R.; Xu, H.G.; Lin, S.F.; Tang, X.K.; Chen, C. Evaluation of Insulin-mediated Regulation of AKT Signaling in Childhood Acute Lymphoblastic Leukemia. J. Pediatric Hematol. Oncol. 2019, 41, 96–104. [Google Scholar] [CrossRef]
- Adamaki, M.; Tsotra, M.; Vlahopoulos, S.; Zampogiannis, A.; Papavassiliou, A.G.; Moschovi, M. STAT transcript levels in childhood acute lymphoblastic leukemia: STAT1 and STAT3 transcript correlations. Leuk. Res. 2015, 39, 1285–1291. [Google Scholar] [CrossRef]
- Morishita, N.; Tsukahara, H.; Chayama, K.; Ishida, T.; Washio, K.; Miyamura, T.; Yamashita, N.; Oda, M.; Morishima, T. Activation of Akt is associated with poor prognosis and chemotherapeutic resistance in pediatric B-precursor acute lymphoblastic leukemia. Pediatric Blood Cancer 2012, 59, 83–89. [Google Scholar] [CrossRef]
- Weroha, S.J.; Haluska, P. The Insulin-Like Growth Factor System in Cancer. Endocrinol. Metab. Clin. North. Am. 2012, 41, 335–350. [Google Scholar] [CrossRef] [PubMed]
- Orgel, E.; Mittelman, S.D. The links between insulin resistance, diabetes, and cancer. Curr. Diab. Rep. 2013, 13, 213–222. [Google Scholar] [CrossRef] [PubMed]
- Medyouf, H.; Gusscott, S.; Wang, H.; Tseng, J.C.; Wai, C.; Nemirovsky, O.; Trumpp, A.; Pflumio, F.; Carboni, J.; Gottardis, M.; et al. High-level IGF1R expression is required for leukemia-initiating cell activity in T-ALL and is supported by Notch signaling. J. Exp. Med. 2011, 208, 1809–1822. [Google Scholar] [CrossRef] [PubMed]
- Gusscott, S.; Jenkins, C.E.; Lam, S.H.; Giambra, V.; Pollak, M.; Weng, A.P. IGF1R derived PI3K/AKT signaling maintains growth in a subset of human T-cell acute lymphoblastic leukemias. PLoS ONE 2016, 11, 1–23. [Google Scholar] [CrossRef]
- O’Shea, D.; Hogan, A.E. Dysregulation of natural killer cells in obesity. Cancers 2019, 11, 573. [Google Scholar] [CrossRef]
- Lynch, L.A.; O’Connell, J.M.; Kwasnik, A.K.; Cawood, T.J.; O’Farrelly, C.; O’Shea, D.B. Are natural killer cells protecting the metabolically healthy obese patient? Obesity 2009, 17, 601–605. [Google Scholar] [CrossRef]
- Michelet, X.; Dyck, L.; Hogan, A.; Loftus, R.M.; Duquette, D.; Wei, K.; Beyaz, S.; Tavakkoli, A.; Foley, C.; Donnelly, R.; et al. Metabolic reprogramming of natural killer cells in obesity limits antitumor responses. Nat. Immunol. 2018, 19, 1330–1340. [Google Scholar] [CrossRef]
- O’Shea, D.; Cawood, T.J.; O’Farrelly, C.; Lynch, L. Natural killer cells in obesity: Impaired function and increased susceptibility to the effects of cigarette smoke. PLoS ONE 2010, 5, 1–8. [Google Scholar] [CrossRef]
- Tobin, L.M.; Mavinkurve, M.; Carolan, E.; Kinlen, D.; O’Brien, E.C.; Little, M.A.; Finlay, D.K.; Cody, D.; Hogan, A.E.; O’Shea, D. NK cells in childhood obesity are activated, metabolically stressed, and functionally deficient. JCI Insight 2017, 2, e94939. [Google Scholar] [CrossRef]
- Viel, S.; Besson, L.; Charrier, E.; Marçais, A.; Disse, E.; Bienvenu, J.; Walzer, T.; Dumontet, C. Alteration of Natural Killer cell phenotype and function in obese individuals. Clin. Immunol. 2017, 177, 12–17. [Google Scholar] [CrossRef]
- Wensveen, F.M.; Jelenčić, V.; Valentić, S.; Šestan, M.; Wensveen, T.T.; Theurich, S.; Glasner, A.; Mendrila, D.; Štimac, D.; Wunderlich, F.T.; et al. NK cells link obesity-induced adipose stress to inflammation and insulin resistance. Nat. Immunol. 2015, 16, 376–385. [Google Scholar] [CrossRef] [PubMed]
- Zuk, P.A.; Zhu, M.; Mizuno, H.; Huang, J.; Futrell, J.W.; Katz, A.J.; Benhaim, P.; Lorenz, H.P.; Hedrick, M.H. Multilineage cells from human adipose tissue: Implications for cell-based therapies. Tissue Eng. 2001, 7, 211–228. [Google Scholar] [CrossRef] [PubMed]
- Gimble, J.M.; Guilak, F. Adipose-derived adult stem cells: Isolation, characterization, and differentiation potential. Cytotherapy 2003, 5, 362–369. [Google Scholar] [CrossRef]
- Zuk, P.A.; Zhu, M.; Ashjian, P.; De Ugarte, D.A.; Huang, J.I.; Mizuno, H.; Alfonso, Z.C.; Fraser, J.K.; Benhaim, P.; Hedrick, M.H. Human Adipose Tissue Is a Source of Multipotent Stem Cells. Mol. Biol. Cell 2002, 13, 4279–4295. [Google Scholar] [CrossRef]
- Trayhurn, P.; Beattie, J.H. Physiological role of adipose tissue: White adipose tissue as an endocrine and secretory organ. Proc. Nutr. Soc. 2001, 60, 329–339. [Google Scholar] [CrossRef]
- Rehman, J.; Traktuev, D.; Li, J.; Merfeld-Clauss, S.; Temm-Grove, C.J.; Bovenkerk, J.E.; Pell, C.L.; Johnstone, B.H.; Considine, R.V.; March, K.L. Secretion of Angiogenic and Antiapoptotic Factors by Human Adipose Stromal Cells. Circulation 2004, 109, 1292–1298. [Google Scholar] [CrossRef] [PubMed]
- Nakagami, H.; Morishita, R.; Maeda, K.; Kikuchi, Y.; Ogihara, T.; Kaneda, Y. Adipose tissue-derived stromal cells as a novel option for regenerative cell therapy. J. Atheroscler. Thromb. 2006, 13, 77–81. [Google Scholar] [CrossRef] [PubMed]
- Wang, M.; Crisostomo, P.R.; Herring, C.; Meldrum, K.K.; Meldrum, D.R. Human progenitor cells from bone marrow or adipose tissue produce VEGF, HGF, and IGF-I in response to TNF by a p38 MAPK-dependent mechanism. Am. J. Physiol. Regul. Integr. Comp. Physiol. 2006, 291, 880–884. [Google Scholar] [CrossRef] [PubMed]
- Kilroy, G.E.; Foster, S.J.; Wu, X.; Ruiz, J.; Sherwood, S.; Heifetz, A.; Ludlow, J.W.; Stricker, D.M.; Potiny, S.; Green, P.; et al. Cytokine profile of human adipose-derived stem cells: Expression of angiogenic, hematopoietic, and pro-inflammatory factors. J. Cell. Physiol. 2007, 212, 702–709. [Google Scholar] [CrossRef]
- Lee, M.W.; Park, Y.J.; Kim, D.S.; Park, H.J.; Jung, H.L.; Lee, J.W.; Sung, K.W.; Koo, H.H.; Yoo, K.H. Human Adipose Tissue Stem Cells Promote the Growth of Acute Lymphoblastic Leukemia Cells in NOD/SCID Mice. Stem Cell Rev. Rep. 2018, 14, 451–460. [Google Scholar] [CrossRef]
- Lee, M.W.; Ryu, S.; Kim, D.S.; Lee, J.W.; Sung, K.W.; Koo, H.H.; Yoo, K.H. Mesenchymal stem cells in suppression or progression of hematologic malignancy: Current status and challenges. Leukemia 2019, 33, 597–611. [Google Scholar] [CrossRef] [PubMed]
- Joe, A.W.B.; Lin, Y.; Even, Y.; Vogl, A.W.; Rossi, F.M.V. Depot-specific differences in adipogenic progenitor abundance and proliferative response to high-fat diet. Stem Cells 2009, 27, 2563–2570. [Google Scholar] [CrossRef] [PubMed]
- Maumus, M.; Sengenès, C.; Decaunes, P.; Zakaroff-Girard, A.; Bourlier, V.; Lafontan, M.; Galitzky, J.; Bouloumie, A. Evidence of in situ proliferation of adult adipose tissue-derived progenitor cells: Influence of fat mass microenvironment and growth. J. Clin. Endocrinol. Metab. 2008, 93, 4098–4106. [Google Scholar] [CrossRef]
- Zhang, Y.; Daquinag, A.C.; Amaya-Manzanares, F.; Sirin, O.; Tseng, C.; Kolonin, M.G. Stromal progenitor cells from endogenous adipose tissue contribute to pericytes and adipocytes that populate the tumor microenvironment. Cancer Res. 2012, 72, 5198–5208. [Google Scholar] [CrossRef]
- Strong, A.L.; Semon, J.A.; Strong, T.A.; Santoke, T.T.; Zhang, S.; McFerrin, H.E.; Gimble, J.M.; Bunnell, B.A. Obesity-associated dysregulation of calpastatin and MMP-15 in adipose-derived stromal cells results in their enhanced invasion. Stem Cells 2012, 30, 2774–2783. [Google Scholar] [CrossRef] [PubMed]
- DelaRosa, O.; Sánchez-Correa, B.; Morgado, S.; Ramírez, C.; Del Río, B.; Menta, R.; Lombardo, E.; Tarazona, R.; Casado, J.G. Human adipose-derived stem cells impair natural killer cell function and exhibit low susceptibility to natural killer-mediated lysis. Stem Cells Dev. 2012, 21, 1333–1343. [Google Scholar] [CrossRef]
- Bochev, I.; Elmadjian, G.; Kyurkchiev, D.; Tzvetanov, L.; Altankova, I.; Tivchev, P.; Kyurkchiev, S. Mesenchymal stem cells from human bone marrow or adipose tissue differently modulate mitogen-stimulated B-cell immunoglobulin production in vitro. Cell Biol. Int. 2008, 32, 384–393. [Google Scholar] [CrossRef]
- Wang, Y.C.; Chen, R.F.; Brandacher, G.; Lee, W.P.A.; Kuo, Y.R. The suppression effect of dendritic cells maturation by adipose-derived stem cells through TGF-β1 related pathway. Exp. Cell Res. 2018, 370, 708–717. [Google Scholar] [CrossRef]
- Vicente López, Á.; Vázquez García, M.N.; Melen, G.J.; Entrena Martínez, A.; Cubillo Moreno, I.; García-Castro, J.; Ramírez Orellana, M.; Zapata González, A.G. Mesenchymal stromal cells derived from the bone marrow of acute lymphoblastic leukemia patients show altered BMP4 production: Correlations with the course of disease. PLoS ONE 2014, 9, 1–11. [Google Scholar] [CrossRef]
- Luo, G.; He, Y.; Yu, X. Bone Marrow Adipocyte: An intimate partner with tumor cells in bone metastasis. Front. Endocrinol. (Lausanne) 2018, 9, 1–14. [Google Scholar] [CrossRef]
- Boag, J.M.; Beesley, A.H.; Firth, M.J.; Freitas, J.R.; Ford, J.; Hoffmann, K.; Cummings, A.J.; de Klerk, N.H.; Kees, U.R. Altered glucose metabolism in childhood pre-B acute lymphoblastic leukaemia. Leukemia 2006, 20, 1731–1737. [Google Scholar] [CrossRef]
- Liu, T.; Kishton, R.J.; Macintyre, A.N.; Gerriets, V.A.; Xiang, H.; Liu, X.; Abel, E.D.; Rizzieri, D.; Locasale, J.W.; Rathmell, J.C. Glucose transporter 1-mediated glucose uptake is limiting for B-cell acute lymphoblastic leukemia anabolic metabolism and resistance to apoptosis. Cell Death Dis. 2014, 5, 1–13. [Google Scholar] [CrossRef]
- Ye, H.; Adane, B.; Khan, N.; Alexeev, E.; Nusbacher, N.; Minhajuddin, M.; Stevens, B.M.; Winters, A.C.; Lin, X.; Ashton, J.M.; et al. Subversion of Systemic Glucose Metabolism as a Mechanism to Support the Growth of Leukemia Cells. Cancer Cell 2018, 34, 659–673.e6. [Google Scholar] [CrossRef] [PubMed]
- Roberson, J.R.; Spraker, H.L.; Shelso, J.; Zhou, Y.; Inaba, H.; Metzger, M.L.; Rubnitz, J.E.; Ribeiro, R.C.; Sandlund, J.T.; Jeha, S.; et al. Clinical consequences of hyperglycemia during remission induction therapy for pediatric acute lymphoblastic leukemia. Leukemia 2009, 23, 245–250. [Google Scholar] [CrossRef] [PubMed]
- Shafat, M.S.; Oellerich, T.; Mohr, S.; Robinson, S.D.; Edwards, D.R.; Marlein, C.R.; Piddock, R.E.; Fenech, M.; Zaitseva, L.; Abdul-Aziz, A.; et al. Leukemic blasts program bone marrow adipocytes to generate a protumoral microenvironment. Blood 2017, 129, 1320–1332. [Google Scholar] [CrossRef] [PubMed]
- Van’t Veer, M.B.; Brooijmans, A.M.; Langerak, A.W.; Verhaaf, B.; Goudswaard, C.S.; Graveland, W.J.; Van Lom, K.; Valk, P.J.M. The predictive value of lipoprotein lipase for survival in chronic lymphocytic leukemia. Haematologica 2006, 91, 56–63. [Google Scholar]
- Tabe, Y.; Yamamoto, S.; Saitoh, K.; Sekihara, K.; Monma, N.; Ikeo, K.; Mogushi, K.; Shikami, M.; Ruvolo, V.; Ishizawa, J.; et al. Bone marrow adipocytes facilitate fatty acid oxidation activating AMPK and a transcriptional network supporting survival of acute monocytic leukemia cells. Cancer Res. 2017, 77, 1453–1464. [Google Scholar] [CrossRef] [PubMed]
- Tucci, J.; Sheng, X.; Mittelman, S.D. Acute lymphoblastic leukemia cells stimulate adipocyte lipolysis and utilize adipocyte-derived free-fatty acids for proliferation. In Proceedings of the Molecular and Cellular Biology, San Diego, CA, USA, 5–9 April 2014; American Association for Cancer Research: Philadelphia, PA, USA; p. 4339. [Google Scholar]
- Oettgen, H.F.; Old, L.J.; Boyse, E.A.; Campbell, H.A.; Philips, F.S.; Clarkson, B.D.; Tallal, L.; Leeper, R.D.; Schwartz, M.K.; Kim, J.H. Inhibition of leukemias in man by L-asparaginase. Cancer Res. 1967, 27, 2619–2631. [Google Scholar]
- Ehsanipour, E.A.; Sheng, X.; Behan, J.W.; Wang, X.; Butturini, A.; Avramis, V.I.; Mittelman, S.D. Adipocytes cause leukemia cell resistance to l-asparaginase via release of glutamine. Cancer Res. 2013, 73, 2998–3006. [Google Scholar] [CrossRef]
- Tucci, J.; Alhushki, W.; Chen, T.; Sheng, X.; Kim, Y.-M.; Mittelman, S.D. Switch to low-fat diet improves outcome of acute lymphoblastic leukemia in obese mice. Cancer Metab. 2018, 6, 6–13. [Google Scholar] [CrossRef]
- Wang, K.W.; Ladhani, S.; Empringham, B.; Portwine, C.; Fleming, A.; Banfield, L.; Balakumaran, J.; Sarpong, L.; Sims, E.D.; Popa, A.N.; et al. Bariatric interventions in obesity treatment and prevention in pediatric acute lymphoblastic leukemia: A systematic review and meta-analysis. Cancer Metastasis Rev. 2020, 39, 79–90. [Google Scholar] [CrossRef]
- Zhou, G.; Goodyear, L.J.; Moller, D.E.; Zhou, G.; Myers, R.; Li, Y.; Chen, Y.; Shen, X.; Fenyk-melody, J.; Wu, M.; et al. Role of AMP-activated protein kinase in mechanism of metformin action. J. Clin. Invest. 2001, 108, 1167–1174. [Google Scholar] [CrossRef] [PubMed]
- Grimaldi, C.; Chiarini, F.; Tabellini, G.; Ricci, F.; Tazzari, P.L.; Battistelli, M.; Falcieri, E.; Bortul, R.; Melchionda, F.; Iacobucci, I.; et al. AMP-dependent kinase/mammalian target of rapamycin complex 1 signaling in T-cell acute lymphoblastic leukemia: Therapeutic implications. Leukemia 2012, 26, 91–100. [Google Scholar] [CrossRef] [PubMed]
- Trucco, M.; Barredo, J.C.; Goldberg, J.; Leclerc, G.M.; Hale, G.A.; Gill, J.; Setty, B.; Smith, T.; Lush, R.; Lee, J.K.; et al. A phase I window, dose escalating and safety trial of metformin in combination with induction chemotherapy in relapsed refractory acute lymphoblastic leukemia: Metformin with induction chemotherapy of vincristine, dexamethasone, PEG-asparaginase, and doxo. Pediatric Blood Cancer 2018, 65, e27224. [Google Scholar] [CrossRef] [PubMed]


| Author (Reference) | Study Design | Populations | Protocols | Findings |
|---|---|---|---|---|
| Van Dongen-Melman et al. [34] | RCR | n = 113 Age: 0.5–15 years | Overweight/obese patients (>90th BMI percentile) constituted 7.9% (n = 9) of the sample at diagnosis. At the end of therapy, 30% (n = 34) were overweight/obese. At four years after treatment completion, 23.9% (n = 27) were overweight/obese. Radiotherapy was not associated with obesity. Patients who received a combination of dexamethasone and prednisone were at the highest risk of being obese (44%). Higher cumulative steroid dose did not contribute to more obesity. | |
| Withycombe et al. [35] | RCR | n = 1638 Age: 2–20 years | COG (CCG 1961) | Obesity rates in children with high risk ALL were 14% at baseline and 23% at the end of treatment. Females, Black or Hispanic, and age 5–9-year-old, but not cranial irradiation, were risk factors. The highest increase in BMI% was between maintenance phases 1–3, 9–12 months postdiagnosis. (Induction BMI% 7.2, BMI% 12.6 by maintenance phase 3). |
| Breene et al. [36] | RCR | n = 77 Age: 1–16 years | MRC UKALL97 protocol | Whole group: Patients received only chemotherapy and no CRT. Thirty patients (39%) received prednisolone, and 47 (61%) got dexamethasone. Weight gain was not linked to steroids. There was a significant rise in BMI-SDS from diagnosis (0.35, 95% CI 0.20–0.50) to the end of treatment (1.29, 95% CI 1.13–1.45, p < 0.0001), and at three-year follow-up (1.04, 95% CI 0.85–1.22, p <0.0001). More survivors were overweight or obese at three years post treatment (25/53, 47.20%) when compared to diagnosis (23/77, 29.90%), (p-value 0.01) Female subgroup: Significant rise in BMI-SDS from diagnosis (0.46, 95% CI 0.27–0.64), at end of treatment (1.46, 95% CI 1.26–1.66, p < 0.0001) and at three-year follow-up (1.24, 95% CI 1.03–1.45, p < 0.0001) Male subgroup: Significant rise in BMI-SDS from diagnosis (0.24, 95% CI 0.01–0.46), to end of treatment (1.11, 95% CI 0.85–1.36, p < 0.0001) and at three-year follow-up (0.77, 95% CI 0.43–1.10, p < 0.0001) |
| Razzouk et al. [37] | RCS | n = 248 Age < 19 years At diagnosis, 13.2–30 years at the latest assessment | Chemotherapy-Total Therapy Study X protocol | The prevalence of overweight/obesity in 0–6-year-old (6%) was lower than that in the 13–19-year-old group (19%) at diagnosis. At adult height attainment, the prevalence of overweight/obese in 0-6 years of age at diagnosis was 41%, versus 13–19 years of age at 35%. These rates are close to the USA’s general population. Those <6 years of age (OR 2.3, 95% CI 1.2–4.2, p-value 0.01), male (OR 0.50, 95% CI 0.28–0.91, p-value 0.02), and being overweight/obese at diagnosis (OR 14.00, 95% CI 5.00–39.00, p-value < 0.0001) were predictors of obesity at adult height attainment. CRT (24 Gy) led to an increase in BMI trajectory, but this was not different from the 18 Gy CRT group. |
| Ghosh et al. [38] * | RCS | n = 4775 Age: 2–30 years Age, sex, and ethnicity-matched controls from NHANES | COG AALL17D2 | Newly diagnosed had overweight rates of 17% and obesity rates of 20%. 58% had an average weight, and 5% were underweight. Males, Hispanics, and B-cell ALL were associated with obesity. Obesity was associated with CNS disease. |
| Foster et al. [39] | RCS | n = 121 Age: 2–15 years | COG AALL0232, AALL0331, AALL0932, AALL1131, POG 9904, POG9905 | 15% of patients were overweight and 15% of patients were obese at the time of diagnosis of ALL. At 5-year follow-up, 22% of patients were overweight and 35% of patients were obese. Start of treatment BMI z-score 0.25 (95% CI 0.01–0.49) Five-year follow-up BMI z-score 0.99 (95% CI 0.79–1.19; p-value < 0.0001) |
| Didi et al. [40] | PCS | n = 114 Age: 2–16 years | MRC UKALL protocol | 23/51 male (45%) and 30/63 female (47%) patients were obese at final height attainment. Female patients: Girls’ obesity occurred from start to end of treatment then plateaued. Start of treatment BMI z-score 0.05 (95% CI −2.2, 2.0) End of treatment BMI z-score 1.2, 95% CI 0.3–2.8; p-value 0.0002) Male patients: Boys gained weight from the start of treatment, and weight gain continued post-treatment completion. Start of treatment BMI z -score 0.10 (95% CI −1.1, 1.3); End of treatment BMI z-score 0.6 (95% CI −0.4, 4.9; p-value 0.001) |
| Craig et al. [41] # | CSS | n = 213 radiotherapy, n = 85 no radiotherapy Age: 0–16 years | Unirradiated: MRC UKALL XI or infant ALL protocol Irradiated:
| Female 18–20 Gy CRT: BMI z-score at diagnosis −0.24 ± 0.15 BMI z-score at end of treatment 0.46 ± 0.11 (p-value < 0.0001) 22–24 Gy CRT: BMI z-score at diagnosis −0.70 ± 0.16 BMI z-score at the end of treatment −0.17 ± 0.12 (p-value 0.0005) Male 18–20 Gy CRT: BMI z-score at diagnosis −0.40 ± 0.16 BMI z-score at end of treatment 0.37 ± 0.16 (p-value < 0.0001) 22–24 Gy CRT: BMI z-score at diagnosis −0.17 ± 0.28 BMI z-score at end of treatment 0.48 ± 0.16 (p-value 0.02) BMI z-scores in patients with no history of CRT: Female BMI z-score at diagnosis −0.12 ± 0.19 BMI z-score at end of treatment 0.70 ± 0.17 (p-value < 0.0001) Male BMI z-score at diagnosis 0.23 ± 0.26 BMI z-score at end of treatment 0.81 ± 0.18 (p-value 0.01) |
| Author (Reference) | Study Design | Populations | Findings |
|---|---|---|---|
| Hjalgrim et al. [43] | Meta-analysis | 18 studies n = 10,282 Age: 0–29 years | BWt > 4000 was associated with a trend of higher risk of ALL (OR 1.26, 95% CI 1.17–1.37) |
| Caughey et al. [44] | Meta-analysis | 32 studies n = 16,501 Leukemias (n = 10,974 ALL) Age: ≤ 30 years | Significant odds for the association of high BWt with ALL risk (OR 1.23, 95% CI 1.15–1.32) |
| Milne et al. [45] | CCS | n = 519 patients Age: 0–14 years | OR for 1 SD increase in proportion to optimal BWt 1.18 (95% CI 1.04–1.35, p < 0.05). However, faster fetal growth, instead of BWt, was the factor associated with ALL risk |
| Jiménez-Hernández et al. [46] | CCS | n = 2910 children Age: 0–18 years | ALL is associated with a birth weight ≥ 2500 g (OR 2.06, 95% CI 1.59–2.66) Birth weight ≥ 3500 g was also associated with ALL OR 1.19 (95% CI: 1.00–1.41) |
| Sprehe et al. [47] | RCR | n = 13,988 children Age < 5 years at cancer diagnosis + age-matched controls | Increased risk of ALL was associated with LGA compared to AGA LGA (<4000g) OR 1.5 (95% CI: 0.97–2.52, p = 0.0005) LGA (>4000g) OR 1.67 (95% CI: 1.29–2.16, p = 0.0005) |
| Author | Study Design | Population | Protocol | Findings |
|---|---|---|---|---|
| Saenz et al. [57] | RCS + Meta-analysis | n = 181 Age: 2–17 years | COG | A trend of relapse risk for obese/overweight patients (HR 2.89, 95% CI 0.89–9.36, p = 0.08) in age-and sex-adjusted patients ≥ 10 years old. While meta-analyses reported increased mortality in the overweight/obese group (HR 1.39, 95% CI 1.16–1.46, p < 0.05), this was not confirmed in adjusted analyses |
| Orgel et al. [58] | Meta-analysis | 11 articles n = 8680 (ALL), Age: 0–21 years | Included all treatment regimens that reported the effect of weight on treatment outcomes, specifically EFS mortality, overall survival, the cumulative incidence of relapse, and treatment-related toxicity | When compared to a lower BMI, higher BMI was associated with a statistically nonsignificant trend of risk of relapse (RR 1.17; 95% CI: 0.99, 1.38) Patients with a higher BMI had lower EFS (RR 1.35, 95% CI 1.20, 1.51) than those with lower BMI |
Publisher’s Note: MDPI stays neutral with regard to jurisdictional claims in published maps and institutional affiliations. |
© 2020 by the authors. Licensee MDPI, Basel, Switzerland. This article is an open access article distributed under the terms and conditions of the Creative Commons Attribution (CC BY) license (http://creativecommons.org/licenses/by/4.0/).
Share and Cite
Dushnicky, M.J.; Nazarali, S.; Mir, A.; Portwine, C.; Samaan, M.C. Is There a Causal Relationship between Childhood Obesity and Acute Lymphoblastic Leukemia? A Review. Cancers 2020, 12, 3082. https://doi.org/10.3390/cancers12113082
Dushnicky MJ, Nazarali S, Mir A, Portwine C, Samaan MC. Is There a Causal Relationship between Childhood Obesity and Acute Lymphoblastic Leukemia? A Review. Cancers. 2020; 12(11):3082. https://doi.org/10.3390/cancers12113082
Chicago/Turabian StyleDushnicky, Molly J., Samina Nazarali, Adhora Mir, Carol Portwine, and Muder Constantine Samaan. 2020. "Is There a Causal Relationship between Childhood Obesity and Acute Lymphoblastic Leukemia? A Review" Cancers 12, no. 11: 3082. https://doi.org/10.3390/cancers12113082
APA StyleDushnicky, M. J., Nazarali, S., Mir, A., Portwine, C., & Samaan, M. C. (2020). Is There a Causal Relationship between Childhood Obesity and Acute Lymphoblastic Leukemia? A Review. Cancers, 12(11), 3082. https://doi.org/10.3390/cancers12113082