Review

Three-Dimensional Cell Culture Systems in Radiopharmaceutical Cancer Research

1
Department of Radiopharmaceutical and Chemical Biology, Institute of Radiopharmaceutical Cancer Research, Helmholtz-Zentrum Dresden-Rossendorf, 01328 Dresden, Germany
2
School of Science, Faculty of Chemistry and Food Chemistry, Technische Universität Dresden, 01069 Dresden, Germany
*
Author to whom correspondence should be addressed.
S.H. and J.P. share senior authorship.
Cancers 2020, 12(10), 2765; https://doi.org/10.3390/cancers12102765
Submission received: 20 August 2020 / Revised: 14 September 2020 / Accepted: 16 September 2020 / Published: 25 September 2020
(This article belongs to the Special Issue Cancer-on-a-Chip: Applications and Challenges)

Abstract

:

Simple Summary

Cancer cells cultured in three-dimensional (3D) model systems exhibit physiologically relevant cell–cell and cell–matrix interactions, gene expression patterns, and signaling cascades as well as heterogeneity and structural complexity that more reliably reflect tumors and metastases than monolayer cultures do. In recent years, the development of various 3D models, including scaffold-free, scaffold-based, chip-based, and organoid systems, has improved, among other things, the characterization of new radioligands and the use of screening platforms for the development of radiotracers and radiotherapeutics. This review article attempts to summarize and critically discuss the suitability of different 3D culture systems in radiopharmaceutical cancer research. Specific emphasis is put on pancreatic ductal adenocarcinoma, which is a predestined target for new radiotheranostic agents. This overview also highlights the different sophisticated techniques for generating 3D models and their characteristics.

Abstract

In preclinical cancer research, three-dimensional (3D) cell culture systems such as multicellular spheroids and organoids are becoming increasingly important. They provide valuable information before studies on animal models begin and, in some cases, are even suitable for reducing or replacing animal experiments. Furthermore, they recapitulate microtumors, metastases, and the tumor microenvironment much better than monolayer culture systems could. Three-dimensional models show higher structural complexity and diverse cell interactions while reflecting (patho)physiological phenomena such as oxygen and nutrient gradients in the course of their growth or development. These interactions and properties are of great importance for understanding the pathophysiological importance of stromal cells and the extracellular matrix for tumor progression, treatment response, or resistance mechanisms of solid tumors. Special emphasis is placed on co-cultivation with tumor-associated cells, which further increases the predictive value of 3D models, e.g., for drug development. The aim of this overview is to shed light on selected 3D models and their advantages and disadvantages, especially from the radiopharmacist’s point of view with focus on the suitability of 3D models for the radiopharmacological characterization of novel radiotracers and radiotherapeutics. Special attention is paid to pancreatic ductal adenocarcinoma (PDAC) as a predestined target for the development of new radionuclide-based theranostics.

Graphical Abstract

1. Introduction

For 50 years now, since their introduction in 1970 by Sutherland et al. [1], so-called spheroids of various cancer cell lines have found their place in cancer research as three-dimensional (3D) tumor models. Today, such 3D models are basically separated into three main categories: scaffold or matrix-based, scaffold-free, and organoids. Multicellular tumor spheroid (MCTS) as a term is unfortunately not consistently defined throughout the literature [2]. Sometimes loose packages of cells that aggregate but do not form compact structures are misleadingly described as spheroids [1,3]. Therefore, we like to emphasize that, in this review, the term spheroid is used exclusively for tight cell aggregates that possess a spherical shape, are stable, and can be lifted or relocated without disintegration (Figure 1).
Moreover, we will describe the possibilities and advantages of 3D models, especially with regard to the ductal pancreatic adenocarcinoma (PDAC). Since there is no characteristic symptom, PDAC is a very deceptive and ultimately very dangerous cancer. PDAC is the deadliest tumor entity worldwide with an overall 5-year survival rate of only about 7%. The mean survival time in PDAC is 6 months after diagnosis, which is extremely short. In almost all cases, it forms metastases, primarily in liver and lungs, and only a small percentage of patients (15–20%) benefit from resection [4,5,6]. The PDAC etiology is highly complex, as little is known about the risk factors and the characteristics of precursor lesions. PDAC is a very heterogeneous tumor-stroma entity with up to 90% of the tumor mass formed by stromal cells [5,7]. The tumor stroma is mainly created by activated pancreatic stellate cells (PSC) [8]. In the healthy pancreas, nonactivated PSCs are located around the acinar cells, store lipid droplets containing vitamin A, and synthesize proteins of the extracellular matrix (ECM). Upon activation, PSCs not only lose their vitamin A storing function but also start producing extensive quantities of ECM proteins leading to fibrosis. Various factors lead to PSC activation such as alcohol; oxidative stress; overexpression of various factors, e.g., cyclooxygenase-2 and fibrinogen; as well as hypoxia [9]. The large proportion of stromal cells leads to pronounced resistance to irradiation and chemotherapy of these tumors [4,10]. A major challenge is the development of early diagnosis imaging tests and more effective therapeutic approaches. Hence, for a fast and successful establishment of new radiotracers, drugs, and potentially also radiotherapeutics, it is essential to use models that reflect the tumor’s distinctive features already at the in vitro cell culture level. Various spheroid- and organoid-based approaches have proven to be particularly suitable for modelling PDAC in vitro, which will be discussed in more detail below.

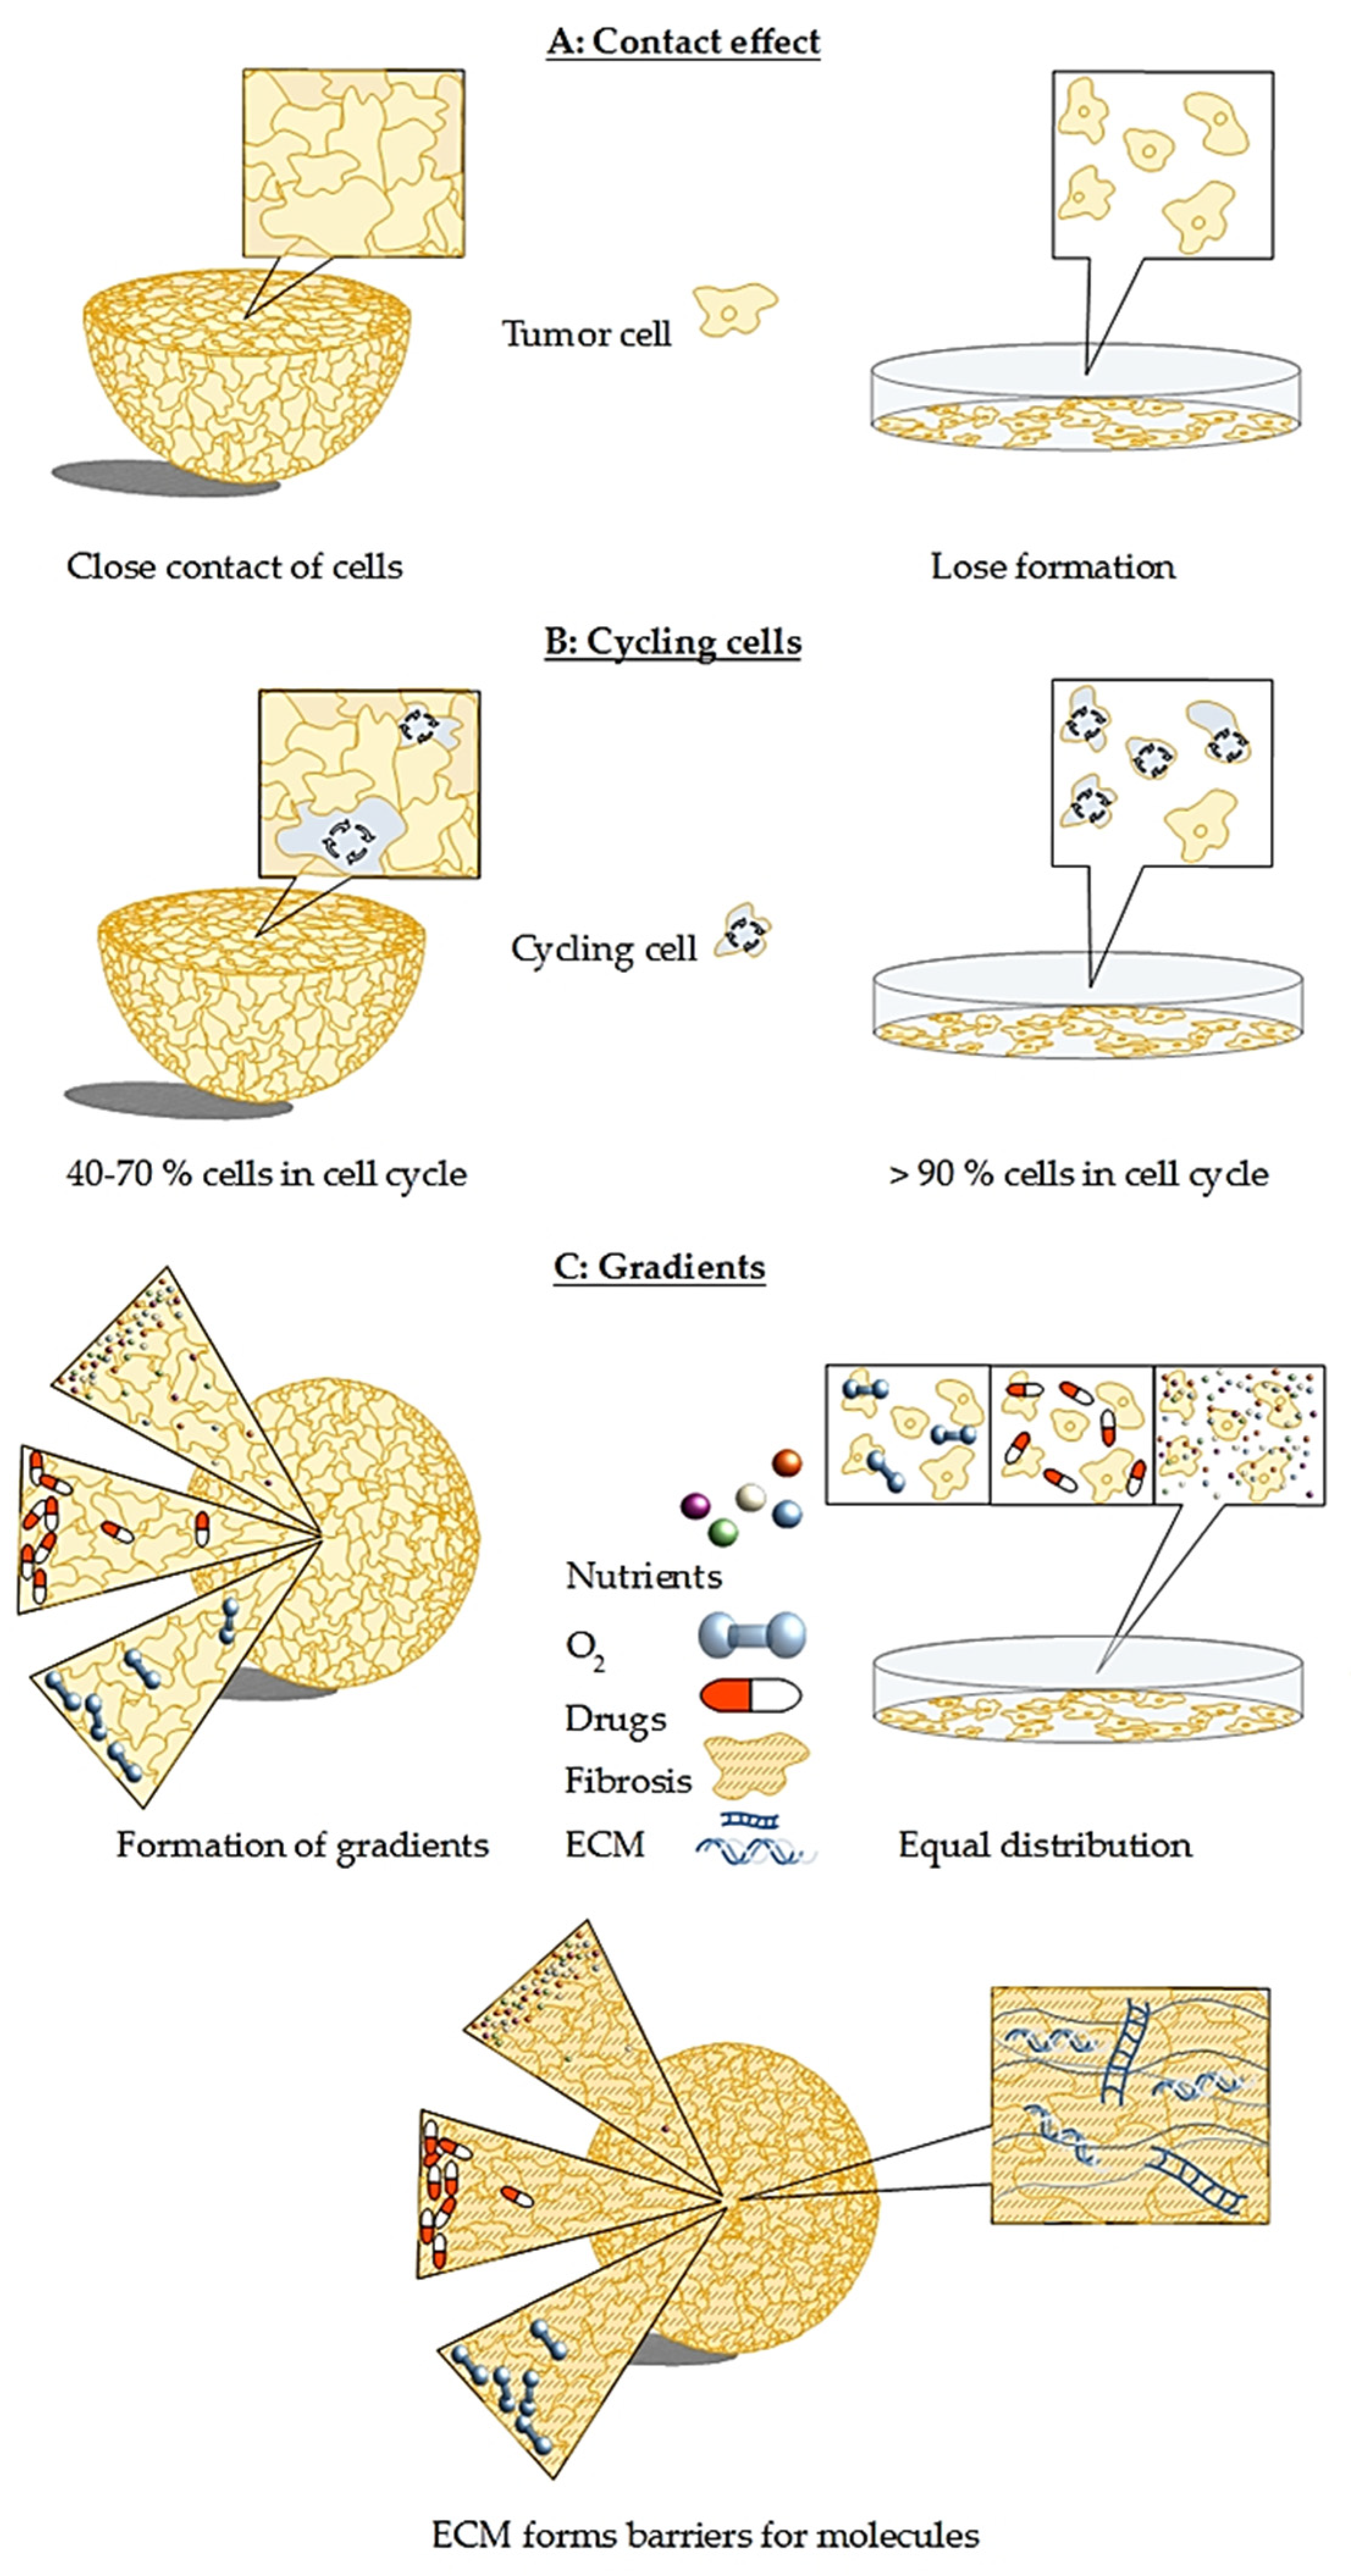
2. In Vitro 3D Models Are Superior to Classical Monolayer Cultures

In the following, three-dimensional cell culture models in vitro are referred to as “3D models”. Moreover, the term “spheroid” is used synonymously for MCTS. Three-dimensional models are well known to overcome at least some of the limitations of classical monolayer cultures. For example, 3D models mimic biological situations better than classical cell cultures, as monolayer cultures adapt extensively during 2D culture in vitro. Rare clones expand and proliferate, causing the cell line to undergo substantial genetic changes that no longer represent the genetic heterogeneity of human tumor [11].
Through genomic profiling of parental tumor, monolayer, and spheroid cultures of human glioblastoma, De Witt Hamer et al. concluded that spheroids are more representative of the parental tumor. This hypothesis is based on the average correlation coefficient of the genomic profiles between the culture method and the original tumor, which was higher for spheroids (0.89) compared to monolayer cultures (0.62). In addition, half of the analyzed monolayer cultures showed substantial genetic changes even in short-term culture [12]. Spheroid cultures, especially from primary tumor cells are therefore genetically more stable [3,12,13].
Besides genetic variance, monolayer cultures differ morphologically [14,15] and metabolically [16,17]. While 2D cultured cells possess an unnatural stretched form [14,15]. Three-dimensional cultured cells keep the same distinct morphology [15] and cell density [18] as natural tissue. Along with morphology of single cells, the spatial cell organization of the whole cell aggregate plays a certain role in mirroring the 3D context of relevant physiological gradients of tumors in vivo due to nonuniform oxygen and nutrient levels [3,19].
Among the processes that can be better visualized and studied with 3D models are phenomena associated with hypoxia. Near the surrounding media, the outer layer of a spheroid consists of proliferating cells while the spheroid core hosts quiescent, hypoxic, and necrotic cells [1,3,14,20,21]. These innermost cells die via apoptosis due to limited availability of oxygen, nutrients, and growth factors [1,14,21]. Similar to tumor xenografts, large spheroids of about 400 to 500 µm [22,23,24,25] comprise up to 20% hypoxic cells [26]. Hypoxia in solid tumors occurs at a distance of approximately 75–80 µm [27,28] from functional blood vessels, and it is generally accepted that tumors do not exceed 1–2 mm in diameter without the induction of angiogenesis [27]. Similar to solid tumors, the complex tissue-like structure derives from the 3D physiological organization that is dependent on cell-matrix interactions and variations in the supply and transport of glucose and lactate as well as gradients in pH and oxygen [22,29]. Pronounced gradients form in particular in PDAC as an extensive ECM creates barriers that physically inhibit penetration [30,31] and cause interstitial pressure resulting in vascular compression and decreasing molecular transport [31,32]. Monolayers though, lose tissue-specific architecture that is responsible for the biochemical gradients and cell-cell and cell-matrix interactions [21]. No gradient can form in monolayer culture, as all cells receive a homogenous amount of nutrients and growth factors through the surrounding media. Moreover, the culture just consists of proliferating cells as necrotic cells are removed by regular media changes [14].
The development of secondary central necrosis was studied in more detail over the past decades, showing that apoptotic and necrotic pathways are highly relevant. According to Mueller-Klieser [25], spheroids can be classified into three groups that differ in timing of hypoxia and necrosis. Either hypoxia precedes the appearance of necrosis, necrosis precedes hypoxia, or they emerge simultaneously. As spheroids express micro-regions with different cell phenotypes depending on spatial distance from nourishing capillaries, they resemble poorly vascularized, hypoxic solid tumors with their cellular environment and behavior more closely than monolayers [13,14,21,29]. The cell viability in spheroids is preserved despite the gradients. In the beginning of spheroid formation, cells proliferate, macromolecules are synthesized, and genes are active or are activated. Those processes have a high demand for ATP with the result that a high metabolic rate must be maintained despite oxygen and substrate limitation processes. While spheroids grow, a necrotic core begins to form, which induces a decrease in the oxidative phosphorylation rate. To counter the decrease, the glycolytic uptake increases fourfold. While in small spheroids with a size of 0.4 to 0.5 mm, oxidative phosphorylation generates the majority of ATP; in larger spheroids with a size of 1 mm, glycolysis produces most of the ATP. Although ATP production is lower in larger spheroids, it is enough for survival [29]. The change in the ATP-generating pathway in spheroids is accompanied by a more than threefold increase in hypoxia-inducible factor 1-alpha (HIF-1α) expression [29]. The reduced proliferation rate in older spheroids, in contrast to always proliferating monolayer cultures, is more similar to the situation in vivo [14]. The 3D environment with its complex cell-cell and cell-matrix interactions affects not only gradients but also cell surface molecules leading to altered intracellular signaling pathways [33].
The described metabolic and proliferative gradients in vivo contribute to the therapeutic challenges of tumors [3]. Because of its similarity to tumors, spheroids are the ideal link in complexity between monolayer culture and in vivo models [26]. All these advantages are also beneficial for theranostic research for PDAC, allowing for investigations not only on altered gene expression and protein levels but also on responses to treatment.

3. Current Methods and Challenges in Cultivation of Multicellular Spheroids

There are two principally distinguishable methods to produce spheroids: scaffold-free and scaffold or matrix-based (Table 1). The overall aim is to efficiently and conveniently produce uniformly sized 3D tumor models that are suitable for the desired application such as detection of protein levels or drug screening [13].
Scaffold-free methods comprise approaches from forced-floating to agitation-based methods as well as the hanging drop method. The term “forced-floating” involves approaches that use low-adhesion plates. Cell culture plates are coated with 0.5% poly(2-hydroxyethyl methacrylate) (PHEMA) [1,13,33,60], or 1.5–3% agarose [1,33] to prevent cells from attaching. Cell–cell interactions develop, and as a consequence, spheroids are formed [33]. This method is straightforward and produces consistent spheroids with diameter variation below 5% [1,33]. Spheroid size is adjustable depending on the cell number in each well. Cultivation of spheroids in multiwell-plates allows high-throughput screening and easy accessibility [21,33].
Agitation-based methods retain the cells in constant motion so that the cells do not attach to the walls of the container but interact with adjacent cells [20]. Alternatively, preestablished spheroids produced in low-adhesion plates can be used [1]. Long-term culture of these spheroids is possible, as media change is simple. Constant motion also allows easy transport of nutrients and waste [20]. On the other hand, motion generates sheer forces potentially affecting spheroid morphology and size. Consequently, agitation-based approaches show relatively high variation in spheroid size [33] and might therefore be inappropriate for drug testing. Besides, the large media volume is unfavorable for drug screening, as only minimal amounts of drug candidates are often available [1].
Another important approach is the hanging drop method. A drop of cell suspension is placed onto the underside of a culture dish lid. Spheroids form, as gravity accumulates the cells at the tip of the drop [13,21,33]. With this method, spheroids are simple to establish and reproduce; however, the drop is limited to a small volume and media change is difficult [33]. Therefore, some advanced versions, for example by Tung et al. [61] or Hsiao et al. [45], use specialized plates. Tung et al. created a 384-well plate with holes in the top lid allowing direct access and therefore long-term culture and high-throughput drug screening [61].
The overall advantage of scaffolds is that they provide a physical structure comparable with the extracellular matrix in vivo [34,62]. Scaffolds should be porous to allow oxygen, nutrient, and drug transport as well as waste removal [33,63]. The most common scaffolds are Matrigel™, hyaluronic acid, polyethylene glycol (PEG), and polyvinyl alcohol (PVA) [14,21]. Besides these, fibrin, chitosan, alginate, and silk fibrils can be used but are less versatile [21]. Biological matrices promote cell organization as they contain hormones and soluble growth factors. However, composition may vary between different batches [21,33] and the additional growth factors may alter experimental results. Matrigel™ for example consists of extracellular matrix obtained from Engelbreth–Holm–Swarm mouse tumor sarcoma. The matrix contains basement membrane proteins such as collagen IV, laminin, perlecan, entactin, matrix metalloproteinase-2 (MMP2), and growth factors. For pancreatic cells, the most widely used materials are collagen and Matrigel™ [34,35,36]. To mimic pancreatic tissue, a combination of 75% collagen I and 25% Matrigel™ can be used [37]. Hyaluronic acid is an example of natural scaffolds without eukaryotic growth factors, as it is commercially produced by bacteria [62]. Synthetic scaffolds maximize reproducibility and provide possibilities for tuning biochemical and mechanical properties [21]. However, they are not as biologically relevant as natural scaffolds [62]. Furthermore, scaffold materials based on hydrogels are high in water content and enable transport of soluble factors [21]. Methylcellulose thickens cell suspensions and is therefore used for cells that do not form spheroids in scaffold-free methods as it is the case for many pancreatic cancer cell lines [38]. Consequently, methylcellulose counts as scaffold even though, in some research articles [64], 3D cultivation with methylcellulose is misleadingly described as a scaffold-free method.
Spheroids have been used in different fields of preclinical research to investigate, amongst others, regulation of gene expression and protein levels [40,65,66] (Table 2).

4. Organoids as a Step Forward to Personalized Medicine

Besides multicellular spheroids, organoids are praised as an efficient tool for cancer research. In contrast to spheroids originating from previously established cell lines, organoids grow from cells obtained directly from healthy or tumorous tissue or stem cells [11,21,34,76]. Organoids retain functionality and appearance of the original tissue [76].
Similar to other 3D culturing methods, organoids are grown encapsulated or on top of scaffolds such as collagen or Matrigel™ [34,76]. Together, scaffold material and media containing growth factors mimic a natural, growth promoting cell environment [77]. In this manner, human pancreas duct cells can be cultured in vitro up to five months [46] while remaining genetically stable [78]. Organoids derived from healthy pancreas progenitor cells show normal pancreatic development with differentiation into exocrine and endocrine cells [79]. Prior to seeding, tissue must be dissociated either enzymatically or mechanically [34,46,76]. Methods for creating pancreatic organoids are for example described by Broutier et al. [46], Huch et al. [47], and Boj et al. [48]. Besides establishing organoids from cancerous tissue, oncogenic mutations of interest can be introduced into cells [49,80]. In the case of PDAC, the KRAS mutation is the most common mutation at 90%, is responsible for stimulated proliferation of cancer cells, and occurs early in tumor formation [80]. Therefore, introducing a KRAS mutation in cells is a step towards understanding its role in PDAC progression [69]. Further applications for organoids as well as spheroids in PDAC research can be found in Table 2.
Organoids are suitable for biobanking. For that purpose, large amounts of organoids derived from cancerous tissue are grown and stored for further research [11,76]. Some of these investigations focused on potential relationships between genetic variation and drug efficacy. Here, biobanked, cryopreserved organoids ensured access to statistically relevant sample numbers.
Moreover, organoids are relevant for personalized medicine. Treatment responses of healthy and tumorous organoids are evaluated to choose the best possible therapy for a patient by considering the patient’s genetic background. Ideally, treatment should eradicate the tumor cells while leaving healthy cells undamaged. To test this, two organoids per patient are established. One organoid originates from healthy tissue, and the other originates from tumorous tissue. Based on proteomic data obtained from both organoids, tumor-specific characteristics across all patients and patient-specific characteristics can be analyzed. Changes in protein levels can further be assigned to changes in cell signaling pathways [81].
Apart from individual treatment planning, also effects of novel drugs can be assessed [82]. Some small-scale drug screenings revealed encouraging results [11]. To establish an organoid culture, just a small number of cells is necessary. Therefore, cells can be gained not only from resected tumors but also by endoscopic fine-needle aspiration [46,48,76,78]. This is of particular interest for research on PDAC, with just 15–20% of patients undergoing a resection of the tumor [5,6,83]. First results on drug screens and assessment of biomarkers are available three to four weeks after surgery [76]. During this reasonably short time, the risk of genetic changes within the organoids is relatively low. Therefore, use of organoids ensures that treatment evaluation is performed in models maintaining as much as possible the characteristics of the primary cancerous tissue [84].

5. Co-Cultures Visualize Challenges Associated with Tumor–Stroma Interactions

In pancreatic cancer, up to 90% of the tumor mass is formed by stroma, which is created by activated pancreatic stellate cells (PSC) and is responsible for the unique microenvironment of pancreatic cancers [85,86]. There are multiple experimental and clinical evidences that the microenvironment of pancreatic cancers is mostly responsible for resistance to chemotherapeutic agents [87,88], targeted drugs [89], immunotherapy [90], and radiotherapy [91]—a characteristic that is also referred to as environment-mediated resistance [92].
To visualize the effects of tumor–stroma interactions, particularly with regard to therapeutic resistances of PDAC, 3D models need to reflect the complex and heterogeneous composition of the ECM. As a key component of tumor stroma, the ECM strongly influences the behavior of tumor and stroma cells in fibrotic tumors such as pancreatic cancer [31,37]. In our opinion, this effect should not be artificially altered by adding additional matrix components such as Matrigel™, as it has been shown that matrix components influence the epithelial–mesenchymal transition (EMT) of PDAC cell lines [93]. Therefore, a model is needed that includes the effects associated with the stroma, however, without altering the situation with external factors. Until now, the models most suitable for meeting this challenge are co-culture 3D models, as they include other cell types besides cancer cells.
Co-culture models are used to test the effects of neighboring non-tumor cells on 3D systems [62]. As tissues comprise more than one specific cell type, 3D models that include the heterotypic composition of tissue are most likely mimicking the in-vivo situation [37,50,94]. Depending on the author and source, those models are sometimes called co-culture spheroids [95], heterotypic spheroids [13], organotypic cultures [37], tumoroids [96], hybrid spheroids [97,98], or heterospheroids [72]. In this review, the term co-culture spheroid is used. Despite the differences in term, they all have in common that (cancer) cells are cultured together with other cells, e.g., immune cells [3] or stromal cells such as fibroblasts [1,50,72]. Co-culturing with immune cells such as macrophages, monocytes, etc. is used for studying migration and activation in the field of immunotherapy [3], while the stromal environment is interesting for inquiring effects on drug administration and radiotherapy [1,62,97] as well as tumor cell invasion and metastasis [13,62]. The interaction of tumor cells and associated cells is essential for mimicking tissue architecture in vivo [13,37,62] including vascularity [99,100].
Co-culturing pancreatic cancer cells together with stromal cells increased the invasiveness of tumor cells by 4- to 16-fold [50,101] and boosted therapy resistance [68,72]. These changes are most likely due to signaling events between the two cell types [101].
Even in 2D cultures, similar results were obtained by co-culture of pancreatic cancer cells with pancreatic stellate cells, where an increased migration and altered expression of EMT marker genes were observed [74]. These observations are even more pronounced in 3D co-cultures [51]. Taken all together, the effects of co-culturing pancreatic cancer cells with other cells increased proliferation [73], decreased T cell proliferation [52], and changed gene expression and protein levels with effects on signaling pathways [37,73]. Furthermore, the co-culture spheroids showed environment-mediated resistances [54,73] and increased invasiveness [50] (Table 2). Another aspect of co-culturing to take into account is the spatial organization of the cells in a spheroid. Wong et al. as well as Firuzi et al. observed that, in the co-culture of pancreatic cancer cells and PSC, the PSC forms the outer layer of the spheroid while the cancer cells form the core [41,68]. This contradicts the findings of Norberg et al. describing the reverse case [64]. Further research is needed to verify which result truly reflects the situation in vivo.
For several cancer entities, the co-culture method can be enhanced by cultivating three cell types in one model [102,103]. The benefits of so-called triple-cultures apply for PDAC as well. The effect of pancreatic cancer cells and fibroblasts on a third cell type, e.g., monocytes or endothelial cells, can be evaluated [52,54], aiming to reflect cancer progression in patients [50,52].
There are multiple approaches for setting up a co-culture experiment. So-called mixed spheroids are established by mixing tumor and other cells, e.g., fibroblasts in the desired ratios prior to spheroid formation in plates [1,3]. Another approach is to place already formed tumor spheroids on top of a monolayer of associated cells [1,3]. A third method is to put tumor spheroids and spheroids of associated cells side by side to allow for overgrowth [104,105]. By placing a spheroid of associated cells in a suspension of tumor cells, the migration of not yet aggregated tumor cells into adjacent tissue can be observed [1,106].
In summary, co- or even triple-cultured spheroids exhibit strong similarities with tumor tissue in patients, enhancing further the already existing advantages of spheroids compared to monolayer culture for drug development.

6. Biotechnical Microsystems Enable New Design of 3D Models

Besides these “classical” approaches of 3D cell-culture, new approaches have been established including “Tumors on a strip” [75], cell-based biosensors [14], and chip-based approaches [13,14,21,107,108] (Figure 2). These device-based 3D models bear some advantages over spheroid and organoids, including reproducibility and real-time measurements directly inside the cultivation device [109].
For instance, in 2015, Rodenhizer et al. [75] presented the “Tumor Roll for Analysis of Cellular Environment and Response” (TRACER), a device-based 3D model where collagen-embedded tumor cells grow on a cellulose strip. This strip is rolled onto a core and dipped into cell culture medium. Unrolling of the strip then allows for collection of cells from the desired parts of the tumor model and rapid analysis. As in the other 3D cultures, the tumor-on-a-strip develops nutrient and oxygen gradients and is therefore suitable for analysis related to hypoxia.
Two-dimension-based microelectrode arrays, well-known in neuronal network studies [110,111], can be applied for 3D models, e.g., for chips [112] or cell-based biosensors [113]. These approaches require attached, embedded [112], or trapped [114] cells on the substrate. For directly attaching the cells to the substrate, extracellular matrix proteins such as fibronectin or collagen can be used [112]. Popular embedding materials are hydrogels such as PEG [112,115] or alginate [116]. Trapping can be implemented by fixing the spheroid between two electrodes. The density of spheroids trapped between two gold electrodes can be measured, as high-density correlates with low amplitudes at high frequencies. Therefore, the effect of drug candidates on the spheroid density can be evaluated [114]. The surface material is usually silicon, glass, or plastic. The advantage of transparent materials is that investigations using, for instance, fluorescent microscopy are possible [112].
Another method is the cultivation of spheroids on top of small pillars. The plastic pillar is first coated with Matrigel™; then coated with poly-L-lysine and BaCl2 (for crosslinking); and then dipped into a cell suspension with 1% alginate [117], collagen, or Matrigel™ [118]. Similar to the hanging-drop method, spheroids form on the tip of the pillar by inverting and dipping it into media. This method allows easy media change and treatment testing by dipping into drug containing media. As the pillar inserts are compatible with 96-well plates, high-throughput analysis is possible [117]. The spheroids can be used afterwards for histology by embedding them in paraffin or by freezing in liquid nitrogen [118].
Due to their sensitivity to changes and the possibility for high-throughput drug screening in vitro, whole cell-based biosensors are applied in cancer research (Table 2) [119]. Some research groups also combined the ideas of co-cultivating spheroids with device-based methods [55,56]. It should be mentioned that, in those approaches, the cells are not truly cultured together as in spheroid co-cultures but cultivated together on a microfluidic chip with close proximity to each other, divided by a small channel between them, filled with media. Through the media, the two co-cultured cell types are allowed to communicate and migrate [55]. Because the cells do not have direct contact, the setup is less a co-culture model than a model with conditioned media. This setup is used for example to culture pancreatic cancer cell spheroids together with stellate cells in collagen-coated microchannels on a plate [56]. The microfluidic chip used in this setup is called HepaChip®, consisting of a cyclic olefin polymer chamber coated with collagen. PDAC cells cultivated on those chips have been reported to be vital and to appear morphologically similar to cells in spheroids [57,58]. With the help of this chip, response to treatment with cisplatin has been monitored [57]. The distance between cell types can be adjusted by geometry and arrangement of the microchannels [95]. Under these experimental conditions, changes associated with co-culturing such as migration activity, drug resistance, EMT marker expression [55,56], morphological changes, and increased spheroid size [55] were observed. The microchannels represent vascularity in a tissue and therefore integrate a stable nutrient supply and shear stress into the model [120,121].
A further method is the magnetic 3D bioprinting of cells into microplates. Biocompatible nanoparticles are attached to plasma membranes of cells. The magnetized cells are then printed into multi-well microplates. The nanoparticles are released within one week. This strategy was applied to pancreatic cancer cells and activated pancreatic fibroblasts, producing easy and reproducible spheroids that can be used for drug screening [59].

7. Translation of 3D Cell Culture Models from In Vitro to In Vivo

Besides establishing 3D models in vitro, it might be interesting for some applications to transplant preformed 3D structures into animals. Both spheroids and organoids may serve this purpose. Transplanted organoids have been shown to retain features of the original tumor [11]. For pancreatic organoids, successful transplantations either orthotopically or subcutaneously have been reported. For orthotopic transplantation into the pancreas, the 3D structure needs to be dissociated. Then, either small cell aggregates of approximately 1 × 10⁵ cells [70] or a cell suspension [71] are injected. Orthotopically transplanted organoids in mice have been reported to create preinvasive lesions that resemble pancreatic intraepithelial neoplasia (PanIN) [48,76], discussed as a precursor of PDAC [122]. Additionally, after forming PanIN-similar lesions, the organoids progress into invasive PDAC [48]. Therefore, orthotopic transplantation into the pancreas might be a model for the early stage of tumor formation (Table 2).
However, a major advantage of subcutaneous compared to orthotopic transplantation is that organoids or spheroids do not need to be dissociated. A small incision into the skin allows for transplanting the 3D structure into the space between skin and muscle and then for suturing the wound [70]. With this technique, smaller 3D aggregates can also be injected. Subcutaneous xenograft models based on injection of single-cell type spheroids and co-culture spheroids consisting of pancreatic cancer cells and fibroblasts have been reported to develop reproducible tumors which resemble natural PDAC [48,85,123]. Xenograft models of other tumor entities derived from 3D structures also resembled the clinical presentation [123,124]. Besides successful tumor formation via transplantation, also healthy pancreatic ductal tissue can be formed by transplantation of healthy pancreatic cells [48].

8. 3D Models as Pharmacists’ Tool for Drug Development

Three-dimensional models are acknowledged as a potential bridge between monolayer cultures in vitro and animal testing in vivo [3,33,62]. That is because 2D models generate misleading results with limited predictive value for clinical efficacy. Monolayers often fail to simulate the biological situation in tumors, and therefore, many drugs fail in clinical trials [1,11,14,29]. Almost all anticancer drugs are less effective in a multicellular spheroid model compared to monolayer cultures [125,126].
Altered treatment response of spheroids compared to 2D culture is considered a combination of three major changes: first, the higher resistance in combination with reduced drug diffusion; second, the influence of the altered cellular environment [33]; and third, the limited percentage of proliferating cells which are preferentially targeted by cytotoxic drugs [125,126] (Figure 3). In term of cytotoxicity and treatment efficacy, the predictive value of spheroid assays is therefore higher compared to monolayer cultures [17,21,126]. Additionally, 3D co-cultures of various cancer cells including pancreatic cancer cells are even more resistant to a variety of compounds than 3D cultures consisting of just one type of cells [68,72,73]. For instance, standard drugs for the therapy of PDAC such as gemcitabine and oxaliplatin need to be applied at 200-fold higher concentrations to reach the same IC50 value in spheroids compared to monolayer cultures [68]. Due to that phenomenon, it has been advised to test the effectiveness of treatments not only on 3D models but also on 3D co-culture models to identify compounds that are effective in both experimental setups [68]. This minimizes the costs of treatment testing, as ineffective compounds are dismissed already before animal testing.
Besides so-called negative selection, referring to the dismissal of ineffective compounds, also positive selection of substances occurs. Some targets or pathways are enhanced in the 3D environment and are therefore good targets for treatment [3,14]. An example of positive selection is the phosphatidylinositol 3-kinase (PI3K) inhibitor wortmannin and the wortmannin analogue PX-866, which was ineffective in monolayer culture but suppressed spheroid growth of, e.g., glioblastoma, prostate, breast, and colon cancer cell lines. Importantly, inhibition of spheroid growth correlated with results in human tumor xenografts [127]. Likewise, the proteasome inhibitor PS-341 showed equal or higher inhibitor potential in spheroid ovarian and prostate cultures [126]. The list of drugs with positive selection can be continued and has been reported elsewhere [61,125].
As already mentioned, depending on their size, spheroids often exhibit a hypoxic core. This is an important feature for investigations on hypoxia-selective cytotoxic compounds such as tirapazamine derivatives [10]. Besides the presence or absence of the hypoxic core, also the size of the spheroid impacts treatment testing, as some factors are spheroid-size-dependently expressed [67]. Before the start of an investigation, it is therefore of great importance to predefine besides the required statistically relevant sample numbers also the spheroid size [128,129].

9. 3D Models as Radiopharmacists’ Tool for Development of Radiotheranostics

Recent radiopharmaceutical research increasingly uses 3D models. The main objective is the in vitro characterization of novel radiotracers for nuclear medical imaging using positron emission tomography (PET) or single photon emission computed tomography (SPECT). Secondly, the development of targeted radiolabeled molecules with suitable radionuclides, in this case β-or α-emitters, results in radiotherapeutic agents for endoradionuclide therapy for which treatment effects can be tested in 3D models. Thirdly, in order to improve radionuclide-based therapeutic approaches, neoadjuvant therapy with radiosensitizers or, with regard to the risks of normal tissue damage, radioprotectants are increasingly discussed [130]. In this regard, well-designed experiments with these models contribute to the 3R principles of animal research (replacement, reduction, and refinement).
However, the insensitivity of 3D models and tumors towards ionizing radiation remains challenging. Radiosensitivity depends on cell contact, signaling pathways, and apoptosis [10]. These factors are influenced by the three-dimensional structure of the tumor or 3D model. Moreover, hypoxia in spheroids and solid tumors results in up to 3-fold enhanced radioresistance [10,19,125,126].
For successful irradiation treatment, principles also known as the four Rs of radiotherapy must be considered: reoxygenation, redistribution, regrowth or repopulation, and repair. During irradiation, some cells die immediately, which leads to improved availability of nutrients and oxygen for the remaining viable cells. Reactive oxygen species generated during irradiation treatment are able to damage previously undamaged regions, leading to reoxygenation of surviving cells [131]. The term redistribution refers to the reorganization of cells in different cell ages as a result of selective killing of quiescent cells during therapy [26,131], causing resynchronization of the cell cycle. Due to the phenomena of reoxygenation and reorganization, radiotherapy in clinical routine is divided into several fractioned doses [26]. After therapy, only healthy cells should regrow to repair the damaged tissue. However, there is often also regrowth of tumorous cells. Similar effects can be observed in spheroids after radiation treatment [131,132].
Furthermore, phenomena such as the “contact effect” also known as “bystander effect” [58,91,92,133,134] drives radioresistance in tumors and spheroids (Figure 3). One proposed mechanism is rooted in better intercellular communication, changed cell and nucleus shape, tighter DNA packaging, and altered gene expression [135,136]. Zschenker et al. [137] suggested that increased radioresistance is likely caused by increased expression of genes for tissue development, adhesion processes, and cell defense as the authors did not observe increased expression of DNA repair genes.
Cell cycling in tumors corresponds with uptake of radiopharmaceuticals and is therefore the major limitation for targeted radiopharmaceutical therapy. In monolayer cultures, more than 90% of cells are cycling, while in spheroids, the amount of cycling cells decreases with increasing size. The fraction of cycling cells decreases size-dependently from 70 to 40% (Figure 3) [138]. It was shown that slow growing spheroids have less cells in the radiosensitive G2-M phase [139] and are therefore more resistant towards radiation-induced therapeutic effects [140].
Tumor spheroids are suitable for testing response to irradiation as they share similarities with microregions in a larger tumor [141]. Moreover, they show responses to irradiation similar to tumors in vivo and are therefore suitable models for irradiation experiments [10]. Interestingly, cells of a spheroid separated before irradiation treatment still exhibit radiation resistance [135]. Spheroids allow for remodeling of the cell cycle synchronization as also observed in tumors responding to irradiation or antitumor compounds. Cell cycle synchronization results in a higher radiosensitivity and is consequently associated with increased treatment efficacy (Figure 3). Therefore, spheroids can be used to predict appropriate time points with maximal sensitivity to irradiation [141]. Moreover, dose-responses of spheroids correspond to those observed in xenograft studies [26]. Furthermore, spheroids allow for testing of radiosensitizing agents. Radiosensitizers can boost the therapeutic effect of radiotherapy, e.g., by sensitizing the cancer cells to radiation while sparing healthy tissue [142].
The aspects considered here are directly related to radiopharmaceutical therapeutic developments. The main restriction of radiotherapy is the limited radiation tolerance of surrounding tissues. Targeted endoradiotherapy can limit the damage to healthy tissue. With the help of radiolabeled drugs, radiation dose is specifically targeted to and deposited in tumor cells while damages to adjacent normal tissue are minimized (Table 3). To simulate penetration, required dose, distribution, and specific concentration in tumors, spheroids are considered the ideal model in vitro [143]. For targeted radiotherapy, retention time, penetration, and physical properties of nuclides are of importance, as the absorbed energy depends on the mean path length of emitted particles [144,145]. Diagnostically and therapeutically useful isotopes including half-life times and main types of decay have been summarized in a review by Sihver et al. [146]. Alpha particles deposit their energy in a short range of up to 100 µm with a high linear energy transfer (LET) between 80–100 keV/µm. The short range is disadvantageous since particles need to be emitted directly at the position of the tumor cells to damage their DNA. Beta emitters have a lower LET of 0.2 keV/µm, but their higher range of up to 1 cm allows cross-fire to be emitted from neighboring cells [147,148]. Therefore, the main advantage of beta emitters such as iodine-131 over alpha-emitters such as astatine-211 is that, due to the long range and resulting cross-fire, beta particle emitting radiopharmaceuticals do not need to be present in every tumor cell to induce treatment-relevant damage [148]. However, investigations with iodine-131 labeled metaiodobenzylguanidine (MIBG) showed that smaller spheroids were less prone to therapy, suggesting that micrometastases might survive the treatment. The results of treatment in vivo corresponded with spheroid treatment [144,145]. To target smaller tumors, the radionuclide astatine-211 is suitable, as the range is much smaller but with higher LET. In combination with iodine-131, a range of sizes can be targeted [145]. Similar to that, the combination of the high-energy beta particle emitter yttrium-90 targeting larger sizes and the medium-energy beta particle emitter lutetium-177 targeting smaller sizes have proven to be complementary [149]. As a special type of radionuclide, copper-64 is as positron emitter applicable for diagnostic purposes and additionally emits high-LET Auger electrons, appropriate for targeted therapy approaches. The extremely short range of under 1 µm implies high damage to adjacent cell DNA but, at the same time, the necessity to enter every tumor cell [146,150].
To investigate effects of potential radiotherapeutics or other compounds on cell viability, spheroids can be re-incubated in media to allow for potential regrow. For simulating radiotherapy in clinical practice, the therapeutic agent can be administered several times [165]. Using spheroids in this stage of evaluation is suitable, as spheroids are easy to handle without extensive laboratory costs and they recapitulate clinical results, as described above. Furthermore, the possibility to administer the radiopharmaceutical several times while observing spheroid growth is favorable.
Cell viability or rather treatment response of spheroids can be measured before and after drug testing, irradiation, or radiotherapy via different approaches (Figure 4). One of the easiest approaches that does not require dissociation of the spheroids is the acid phosphatase assay (APH). The assay is very sensitive and linear over a broad range of cell numbers (103 to 105 cells) [1,3,166,167]. Acid phosphatase hydrolyses p-nitrophenyl-phosphate to p-nitrophenol in viable cells. The absorption of p-nitrophenol can be measured at 405 nm and is proportional to its concentration [167]. The acid phosphatase assay is also suitable for quantification of viable cells during treatment testing, in particular, in spheroid cultures of pancreatic cancer cells [168]. Spheroids can be further examined taking into account the hallmarks of treatment response such as cell viability or integrity to be determined directly via immunostaining [140,169] or indirectly via monitoring growth and regrowth referring to spheroid size [136,163]. The size of the spheroid is measured through graphic analysis of bright field micrographs. Irradiated spheroids shrink in size followed by regrowth or disintegration depending on the applied dose. Short- and long-term effects can be evaluated referring to the relative decline or regrowth capacity of spheroids compared to nontreated controls. Application of radiosensitizing agents prior or during irradiation results in enhanced shrinkage and declined regrowth.
Prior to applications in animal models, the performance of newly developed radiotracers can be evaluated in 3D models. Vice versa, well-established radiotracers can be used to functionally characterize the pathophysiologic molecular and metabolic alterations in tumors using 3D models. For example, intrinsic tumor hypoxia is one of the major triggers for the induction of angiogenesis primarily via HIF-regulated genes including vascular endothelial growth factor (VEGF). This plays a central role in the switch from avascular to vascular growth in many tumors [170]. Hypoxia not only has been shown to activate several pathways via stabilization of the transcription factors associated with tumor progression HIF-1α and HIF-2α but also has been identified as a critical parameter of the tumor microenvironment. It affects therapeutic efficacy of various treatment modalities including radiotherapy and oxygen-dependent chemotherapeutic approaches. Monitoring hypoxia in individual human tumors to optimize treatment schemes, e.g., for intensity-modulated radiotherapy planning, is thus a new challenge for clinicians. To visualize hypoxic regions in tumors, a variety of PET tracers such as [18F]fluoromisonidazole ([18F]FMISO), [18F]fluoroazomycinarabinoside ([18F]FAZA), or [64Cu]copper(II)-diacetyl-bis(N(4)-methylthio-semicarbazone ([64Cu]ATSM) are currently under investigation [171,172,173,174]. At low oxygen concentrations, nitroimidazoles such as [18F]FMISO are intracellularly reduced by nitroreductases and trapped depending on the formation of covalent adducts of reduced nitroimidazoles to intracellular macromolecules [175]. [18F]FMISO uptake indicates the presence of inherent hypoxic areas with pO2 < 10 mmHg oxygen, which has been described to be the limit for the fixation of misonidazoles [176]. Other radiotracers do not visualize hypoxia directly but target specific enzymes or receptors overexpressed in tumors (Figure 5). The comparison between investigations on spheroids and in vivo provided essential background information. Therefore, Monazzam et al. [165] suggested to evaluate novel radiotracer candidates first in spheroid models before performing PET tracer imaging in animals in order to minimize animal numbers and costs.
From a radiopharmaceutical point of view, it might also be feasible to measure radiotracer uptake in spheroids using radioluminography, a method that is often performed after intravenous injection of a radiotracer into tumor-bearing animals in order to determine its distribution. Here, after resection, freezing, and sectioning of organs and tumors, samples are placed on a radioluminographic imaging plate sensitive to β- or γ-emission. This can also be done with spheroids. After incubation with the radiolabeled compound, cryopreserved spheroids are sectioned and then evaluated using radioluminography [179,180]. As a result, evaluating the loco-regional uptake and enrichment of novel radiotracers in 3D models is possible [161]. Alternatively, uptake of radiotracers by spheroids can also be measured using a radioactivity counter [165,181]. After incubating with the tracer, the spheroids are washed and the radioactive uptake is measured through the emitted radiation. However, this method does not provide information on regional differences in radiotracer uptake in different cellular layers of a spheroid.
A great variety of radiotracers has been tested by different research groups on multiple tumor entities. Some of them were also tested on spheroids (Table 4). The selection reported here includes compounds radiolabeled with positron emitters (11C, 18F, and 68Ga), most of which are clinically established radiotracers. Other given examples such as [18F]3 and [18F]OFED are still under evaluation [24,182]. Moreover, 3H- and 14C-labeled compounds are also mentioned as examples; however, their use is restricted to preclinical research. The selection of radiotracers depends on the tumor entity and expression of target receptors. An example is [68Ga]Ga-DOTATATE that can be used as somatostatin analogue for targeting somatostatin receptors (SSTR) 2 and 5 [183] in SSTR overexpressing neuroendocrine tumors (NETs) [184]. Besides other NETs, also pancreatic NET can be diagnosed with [68Ga]Ga-DOTATATE [185]. For radiopharmacists, the mini-panel PET scanner-based microfluidic radiobioassay system developed by Liu et al. [186] is of interest. Microfluidic radiobioassays are assays using radiotracers to detect samples on chips. Liu et al. [186] extended this approach with the use of PET to detect the radiopharmacokinetics in 3D models.

10. Conclusions and Perspective

In summary, 3D models exhibit important characteristics resembling tumors in vivo that are absent in monolayer cultures, in particular with respect to the genetic stability of the cells, their spatial organization, formation of gradients and barriers, better cell-cell and cell-matrix communication, and overall higher resistance to irradiation and chemotherapy. This is especially true for tumor stroma entities as heterogeneous as PDAC. Spheroids can be cultivated with the help of scaffold materials such as Matrigel™ or hyaluronic acid, or they can be cultivated without scaffolding materials in low-adhesion plates, hanging drops, or rotating vessels. More sophisticated approaches are 3D models on chips or strips that allow for direct measurements and co-culture spheroids that reflect the tumor microenvironment. Together with spheroids, organoids are of great interest in cancer research. They do not originate from cell lines but from resected tumor tissue and can be used for personalized medicine together with genetic profiling. Three-dimensional models not only can be used as in vitro models but also can be translated into in vivo models via subcutaneous or orthotopic transplantation into a suitable recipient organism, usually mice. This allows, amongst other things, the modeling of precursor lesions. For example, by orthotopic transplantation of PDAC-originating organoids, the formation of tumors from the PanIN lesion to the pancreatic adenocarcinoma has been demonstrated in detail. Especially for drug development, 3D models are now state-of-the-art. They allow both negative and positive selection of drug candidates, even in high-throughput scenarios, before animal experiments are performed. This reduces not only the number of laboratory animals but also the costs of drug development. Three-dimensional models can also be used to pursue new approaches in radiopharmaceutical and radiobiological cancer research. This allows for investigations on specific aspects important for establishing new radiotracers such as tissue perfusion, specific and nonspecific radiotracer uptake, and locoregional radiotracer enrichment. The influence of physicochemical and pathophysiological parameters, such as interstitial pressure, pH-value, and hypoxic and necrotic regions can also be modelled and investigated reliably. With regard to the aspect of chemo- and radioresistance, spheroids, in particular co-culture spheroids, resemble natural tumors more closely than monolayer cultures. Repeated experiments in the course of the growth of spheroids can be carried out and can allow for a more precise evaluation of radiooncological therapy approaches. However, the evaluation of novel diagnostic radiotracers and new approaches in radiotherapy has not yet been performed on PDAC 3D models and just rarely for radiopharmaceuticals. Our aim is to stimulate and strengthen an in-depth discussion of this exciting topic, especially from the point of view of radiopharmacists. In our view, tumors that prove to be refractory or resistant to classical therapies, especially conventional radiotherapy, are predestined for radiotheranostic applications. Requirements are suitable molecular targets, chemically available radiotheranostics that address the target with appropriate selectivity and affinity and the ability to combine them with chemotherapeutic or radiosensitizing agents. Radionuclide-based diagnostics initially provide information on the individual molecular signature of the respective tumor and metastases. Later on, they offer essential information for monitoring the molecular behavior of the tumor during therapy. In the case of heterogeneous tumor-stroma entities as PDAC, obtaining knowledge of the molecular signature of the tumor-associated cells and extracellular matrix as well as the addressability of the target structures is essential. Consequently, therapeutic concepts have to address the tumor-associated cells and extracellular matrix as well or even primarily. Ultimately, these concepts have to be studied in animal and clinical experiments; however, the 3D models discussed here offer an opportunity to test the feasibility of new radiotheranostic approaches in vitro. Very promising in this context are approaches for both high-throughput analysis and automation. Summarizing, the stronger inclusion of 3D models such as spheroids; organoids; or, in particular, co-culture systems in radiotracer and radiotherapeutic research should be taken into account, especially for PDAC-oriented approaches. Specifically addressing the tumor or stroma-associated molecular processes and remodeling could be the key to success in this tumor entity.

Author Contributions

A.D. and J.P. conceptualized and organized the manuscript; V.S., M.U., and S.H. contributed to literature searches and writing. All authors have read and agreed to the published version of the manuscript.

Funding

This research was in part funded by the Deutsche Forschungsgemeinschaft (DFG) within the Collaborative Research Center Transregio 205 “The Adrenal: Central Relay in Health and Disease” (CRC/TRR 205/1; V.S., M.U., and J.P.). Alina Doctor (née Achterhold) is the recipient (since 2019) of a fellowship by Europäische Sozialfonds (ESF). This research is funded by the European Social Fund and co-financed by tax funds based on the budget approved by the members of the Saxon State Parliament.

Acknowledgments

We wish to apologize to those researchers whose works have not been mentioned due to restrictions in space. The authors greatly acknowledge the excellent technical assistance of Aline Morgenegg, Catharina Knöfel, and Johanna Wodtke. The authors also thank the Helmholtz Association for supporting this work through the Helmholtz Cross-Programme Initiative “Technology and Medicine—Adaptive Systems”.

Conflicts of Interest

The authors declare no conflict of interest. The funders had no influence on the conception of the review, on the interpretation of literature data, on the conclusions drawn, or in the decision to publish this review.

References

  1. Friedrich, J.; Ebner, R.; Kunz-Schughart, L.A. Experimental anti-tumor therapy in 3-D: Spheroids—Old hat or new challenge? Int. J. Radiat. Biol. 2007, 83, 849–871. [Google Scholar] [CrossRef] [PubMed]
  2. Nath, S.; Devi, G.R. Three-dimensional culture systems in cancer research: Focus on tumor spheroid model. Pharmacol. Ther. 2016, 163, 94–108. [Google Scholar] [CrossRef] [PubMed] [Green Version]
  3. Hirschhaeuser, F.; Menne, H.; Dittfeld, C.; West, J.; Mueller-Klieser, W.; Kunz-Schughart, L.A. Multicellular tumor spheroids: An underestimated tool is catching up again. J. Biotechnol. 2010, 148, 3–15. [Google Scholar] [CrossRef]
  4. Large, T.Y.S.L.; Bijlsma, M.F.; Kazemier, G.; van Laarhoven, H.W.M.; Giovannetti, E.; Jimenez, C.R. Key biological processes driving metastatic spread of pancreatic cancer as identified by multi-omics studies. Semin. Cancer Biol. 2017, 44, 153–169. [Google Scholar] [CrossRef]
  5. Guo, X.-Z.; Cui, Z.-M.; Liu, X. Current developments, problems and solutions in the non-surgical treatment of pancreatic cancer. World J. Gastrointest. Oncol. 2013, 5, 20. [Google Scholar] [CrossRef] [PubMed]
  6. Vasseur, S.; Guillaumond, F. LDL Receptor: An open route to feed pancreatic tumor cells. Mol. Cell. Oncol. 2015, 3, e1033586. [Google Scholar] [CrossRef] [Green Version]
  7. Ghaneh, P.; Costello, E.; Neoptolemos, J.P. Biology and management of pancreatic cancer. Postgrad. Med. J. 2008, 84, 478–497. [Google Scholar] [CrossRef]
  8. Phillips, P. Pancreatic stellate cells and fibrosis. In Pancreatic Cancer and Tumor Microenvironment; Grippo, P.J., Munshi, H.G., Eds.; Transworld Research Network: Trivandrum, India, 2012; ISBN 978-81-7895-548-3. [Google Scholar]
  9. Apte, M.V.; Pirola, R.C.; Wilson, J.S. Pancreatic stellate cells: A starring role in normal and diseased pancreas. Front. Physiol. 2012, 3, 344. [Google Scholar] [CrossRef] [Green Version]
  10. Dubessy, C. Spheroids in radiobiology and photodynamic therapy. Crit. Rev. Oncol. Hematol. 2000, 36, 179–192. [Google Scholar] [CrossRef]
  11. Drost, J.; Clevers, H. Organoids in cancer research. Nat. Rev. Cancer 2018, 18, 407–418. [Google Scholar] [CrossRef]
  12. De Witt Hamer, P.C.; Van Tilborg, A.A.G.; Eijk, P.P.; Sminia, P.; Troost, D.; Van Noorden, C.J.F.; Ylstra, B.; Leenstra, S. The genomic profile of human malignant glioma is altered early in primary cell culture and preserved in spheroids. Oncogene 2008, 27, 2091–2096. [Google Scholar] [CrossRef] [PubMed] [Green Version]
  13. Lin, R.-Z.; Chang, H.-Y. Recent advances in three-dimensional multicellular spheroid culture for biomedical research. Biotechnol. J. 2008, 3, 1172–1184. [Google Scholar] [CrossRef] [PubMed]
  14. Edmondson, R.; Broglie, J.J.; Adcock, A.F.; Yang, L. Three-dimensional cell culture systems and their applications in drug discovery and cell-based biosensors. ASSAY Drug Dev. Technol. 2014, 12, 207–218. [Google Scholar] [CrossRef] [PubMed] [Green Version]
  15. Lee, J.; Cuddihy, M.J.; Kotov, N.A. Three-dimensional cell culture matrices: State of the art. Tissue Eng. Part B Rev. 2008, 14, 61–86. [Google Scholar] [CrossRef] [PubMed] [Green Version]
  16. Kimlin, L.C.; Casagrande, G.; Virador, V.M. In vitro three-dimensional (3D) models in cancer research: An update. Mol. Carcinog. 2013, 52, 167–182. [Google Scholar] [CrossRef] [PubMed]
  17. Rimann, M.; Graf-Hausner, U. Synthetic 3D multicellular systems for drug development. Curr. Opin. Biotechnol. 2012, 23, 803–809. [Google Scholar] [CrossRef]
  18. Casciari, J.J.; Sotirchos, S.V.; Sutherland, R.M. Glucose diffusivity in multicellular tumor spheroids. Cancer Res. 1988, 48, 3905–3909. [Google Scholar]
  19. Dardousis, K.; Voolstra, C.; Roengvoraphoj, M.; Sekandarzad, A.; Mesghenna, S.; Winkler, J.; Ko, Y.; Hescheler, J.; Sachinidis, A. Identification of differentially expressed genes involved in the formation of multicellular tumor spheroids by HT-29 colon carcinoma cells. Mol. Ther. J. Am. Soc. Gene Ther. 2007, 15, 94–102. [Google Scholar] [CrossRef]
  20. Kim, J.B. Three-dimensional tissue culture models in cancer biology. Semin. Cancer Biol. 2005, 15, 365–377. [Google Scholar] [CrossRef]
  21. Fang, Y.; Eglen, R.M. Three-dimensional cell cultures in drug discovery and development. Slas Discov. Adv. Life Sci. R D 2017, 22, 456–472. [Google Scholar] [CrossRef] [Green Version]
  22. Riffle, S.; Hegde, R.S. Modeling tumor cell adaptations to hypoxia in multicellular tumor spheroids. J. Exp. Clin. Cancer Res. 2017, 36, 102. [Google Scholar] [CrossRef] [PubMed]
  23. Kunz-Schughart, L.A.; Freyer, J.P.; Hofstaedter, F.; Ebner, R. The use of 3-D cultures for high-throughput screening: The multicellular spheroid model. J. Biomol. Screen. 2004, 9, 273–285. [Google Scholar] [CrossRef] [PubMed] [Green Version]
  24. Seifert, V.; Liers, J.; Kniess, T.; Richter, S.; Bechmann, N.; Feldmann, A.; Bachmann, M.; Eisenhofer, G.; Pietzsch, J.; Ullrich, M. Fluorescent mouse pheochromocytoma spheroids expressing hypoxia-inducible factor 2 alpha: Morphologic and radiopharmacologic characterization. J. Cell. Biotechnol. 2019, 5, 135–151. [Google Scholar] [CrossRef]
  25. Mueller Klieser, W. Tumor biology and experimental therapeutics. Crit. Rev. Oncol. Hematol. 2000, 36, 123–139. [Google Scholar] [CrossRef]
  26. Hall, E.J.; Giaccia, A.J. Radiobiology for the Radiologist, 7th ed.; Wolters Kluwer Health/Lippincott Williams & Wilkins: Philadelphia, PA, USA, 2012; ISBN 978-1-60831-193-4. [Google Scholar]
  27. Forster, J.; Harriss-Phillips, W.; Douglass, M.; Bezak, E. A review of the development of tumor vasculature and its effects on the tumor microenvironment. Hypoxia 2017, 5, 21–32. [Google Scholar] [CrossRef] [PubMed] [Green Version]
  28. Beasley, N.J.; Wykoff, C.C.; Watson, P.H.; Leek, R.; Turley, H.; Gatter, K.; Pastorek, J.; Cox, G.J.; Ratcliffe, P.; Harris, A.L. Carbonic anhydrase IX, an endogenous hypoxia marker, expression in head and neck squamous cell carcinoma and its relationship to hypoxia, necrosis, and microvessel density. Cancer Res. 2001, 61, 5262–5267. [Google Scholar] [PubMed]
  29. Rodríguez-Enríquez, S.; Gallardo-Pérez, J.C.; Avilés-Salas, A.; Marín-Hernández, A.; Carreño-Fuentes, L.; Maldonado-Lagunas, V.; Moreno-Sánchez, R. Energy metabolism transition in multi-cellular human tumor spheroids. J. Cell. Physiol. 2008, 216, 189–197. [Google Scholar] [CrossRef]
  30. Cramer, G.M.; Jones, D.P.; El-Hamidi, H.; Celli, J.P. ECM composition and rheology regulate growth, motility, and response to photodynamic therapy in 3D models of pancreatic ductal adenocarcinoma. Mol. Cancer Res. 2017, 15, 15–25. [Google Scholar] [CrossRef] [Green Version]
  31. Senthebane, D.A.; Rowe, A.; Thomford, N.E.; Shipanga, H.; Munro, D.; Mazeedi, M.A.M.A.; Almazyadi, H.A.M.; Kallmeyer, K.; Dandara, C.; Pepper, M.S.; et al. The role of tumor microenvironment in chemoresistance: To survive, keep your enemies closer. Int. J. Mol. Sci. 2017, 18, 1586. [Google Scholar] [CrossRef]
  32. Nieskoski, M.D.; Marra, K.; Gunn, J.R.; Hoopes, P.J.; Doyley, M.M.; Hasan, T.; Trembly, B.S.; Pogue, B.W. Collagen complexity spatially defines microregions of total tissue pressure in pancreatic cancer. Sci. Rep. 2017, 7, 1–12. [Google Scholar] [CrossRef]
  33. Breslin, S.; O’Driscoll, L. Three-dimensional cell culture: The missing link in drug discovery. Drug Discov. Today 2013, 18, 240–249. [Google Scholar] [CrossRef] [PubMed]
  34. Baker, L.A.; Tiriac, H.; Clevers, H.; Tuveson, D.A. Modeling pancreatic cancer with organoids. Trends Cancer 2016, 2, 176–190. [Google Scholar] [CrossRef] [PubMed] [Green Version]
  35. Gutierrez-Barrera, A.M.; Menter, D.G.; Abbruzzese, J.L.; Reddy, S.A.G. Establishment of three-dimensional cultures of human pancreatic duct epithelial cells. Biochem. Biophys. Res. Commun. 2007, 358, 698–703. [Google Scholar] [CrossRef] [PubMed] [Green Version]
  36. Grzesiak, J.J.; Bouvet, M. Determination of the ligand-binding specificities of the alpha2beta1 and alpha1beta1 integrins in a novel 3-dimensional in vitro model of pancreatic cancer. Pancreas 2007, 34, 220–228. [Google Scholar] [CrossRef] [PubMed]
  37. Froeling, F.E.M.; Marshall, J.F.; Kocher, H.M. Pancreatic cancer organotypic cultures. J. Biotechnol. 2010, 148, 16–23. [Google Scholar] [CrossRef] [PubMed]
  38. Ware, M.J.; Colbert, K.; Keshishian, V.; Ho, J.; Corr, S.J.; Curley, S.A.; Godin, B. Generation of homogenous three-dimensional pancreatic cancer cell spheroids using an improved hanging drop technique. Tissue Eng. Part C Methods 2016, 22, 312–321. [Google Scholar] [CrossRef] [PubMed] [Green Version]
  39. Feng, H.; Ou, B.; Zhao, J.; Yin, S.; Lu, A.; Oechsle, E.; Thasler, W.E. Homogeneous pancreatic cancer spheroids mimic growth pattern of circulating tumor cell clusters and macrometastases: Displaying heterogeneity and crater-like structure on inner layer. J. Cancer Res. Clin. Oncol. 2017, 143, 1771–1786. [Google Scholar] [CrossRef] [PubMed]
  40. Matsuda, Y.; Ishiwata, T.; Kawamoto, Y.; Kawahara, K.; Peng, W.-X.; Yamamoto, T.; Naito, Z. Morphological and cytoskeletal changes of pancreatic cancer cells in three-dimensional spheroidal culture. Med. Mol. Morphol. 2010, 43, 211–217. [Google Scholar] [CrossRef]
  41. Wong, C.-W.; Han, H.-W.; Tien, Y.-W.; Hsu, S. Biomaterial substrate-derived compact cellular spheroids mimicking the behavior of pancreatic cancer and microenvironment. Biomaterials 2019, 213, 119202. [Google Scholar] [CrossRef]
  42. Meier-Hubberten, J.C.; Sanderson, M.P. Establishment and analysis of a 3D co-culture spheroid model of pancreatic adenocarcinoma for application in drug discovery. In Target Identification and Validation in Drug Discovery; Springer: New York, NY, USA, 2019; pp. 163–179. [Google Scholar]
  43. Yeon, S.-E.; No, D.Y.; Lee, S.-H.; Nam, S.W.; Oh, I.-H.; Lee, J.; Kuh, H.-J. Application of concave microwells to pancreatic tumor spheroids enabling anticancer drug evaluation in a clinically relevant drug resistance model. PLoS ONE 2013, 8, e73345. [Google Scholar] [CrossRef] [Green Version]
  44. Kelm, J.M.; Timmins, N.E.; Brown, C.J.; Fussenegger, M.; Nielsen, L.K. Method for generation of homogeneous multicellular tumor spheroids applicable to a wide variety of cell types. Biotechnol. Bioeng. 2003, 83, 173–180. [Google Scholar] [CrossRef] [PubMed]
  45. Hsiao, A.Y.; Tung, Y.-C.; Qu, X.; Patel, L.R.; Pienta, K.J.; Takayama, S. 384 hanging drop arrays give excellent Z-factors and allow versatile formation of co-culture spheroids. Biotechnol. Bioeng. 2012, 109, 1293–1304. [Google Scholar] [CrossRef] [PubMed] [Green Version]
  46. Broutier, L.; Andersson-Rolf, A.; Hindley, C.J.; Boj, S.F.; Clevers, H.; Koo, B.-K.; Huch, M. Culture and establishment of self-renewing human and mouse adult liver and pancreas 3D organoids and their genetic manipulation. Nat. Protoc. 2016, 11, 1724–1743. [Google Scholar] [CrossRef]
  47. Huch, M.; Bonfanti, P.; Boj, S.F.; Sato, T.; Loomans, C.J.M.; van de Wetering, M.; Sojoodi, M.; Li, V.S.W.; Schuijers, J.; Gracanin, A.; et al. Unlimited in vitro expansion of adult bi-potent pancreas progenitors through the Lgr5/R-spondin axis. EMBO J. 2013, 32, 2708–2721. [Google Scholar] [CrossRef] [PubMed] [Green Version]
  48. Boj, S.F.; Hwang, C.-I.; Baker, L.A.; Chio, I.I.C.; Engle, D.D.; Corbo, V.; Jager, M.; Ponz-Sarvise, M.; Tiriac, H.; Spector, M.S.; et al. Organoid models of human and mouse ductal pancreatic cancer. Cell 2015, 160, 324–338. [Google Scholar] [CrossRef] [PubMed] [Green Version]
  49. Ashok, A.; Choudhury, D.; Fang, Y.; Hunziker, W. Towards manufacturing of human organoids. Biotechnol. Adv. 2020, 39, 107460. [Google Scholar] [CrossRef]
  50. Froeling, F.E.M.; Mirza, T.A.; Feakins, R.M.; Seedhar, A.; Elia, G.; Hart, I.R.; Kocher, H.M. Organotypic culture model of pancreatic cancer demonstrates that stromal cells modulate E-cadherin, beta-catenin, and Ezrin expression in tumor cells. Am. J. Pathol. 2009, 175, 636–648. [Google Scholar] [CrossRef] [PubMed] [Green Version]
  51. Ware, M.J.; Keshishian, V.; Law, J.J.; Ho, J.C.; Favela, C.A.; Rees, P.; Smith, B.; Mohammad, S.; Hwang, R.F.; Rajapakshe, K.; et al. Generation of an in vitro 3D PDAC stroma rich spheroid model. Biomaterials 2016, 108, 129–142. [Google Scholar] [CrossRef] [Green Version]
  52. Kuen, J.; Darowski, D.; Kluge, T.; Majety, M. Pancreatic cancer cell/fibroblast co-culture induces M2 like macrophages that influence therapeutic response in a 3D model. PLoS ONE 2017, 12, e0182039. [Google Scholar] [CrossRef]
  53. Goodwin, M.L.; Urs, S.K.; Simeone, D.M. Pancreatic microtumors: A novel 3D ex vivo testing platform. In Methods in Molecular Biology; Springer: New York, NY, USA, 2018; pp. 73–80. [Google Scholar]
  54. Lazzari, G.; Nicolas, V.; Matsusaki, M.; Akashi, M.; Couvreur, P.; Mura, S. Multicellular spheroid based on a triple co-culture: A novel 3D model to mimic pancreatic tumor complexity. Acta Biomater. 2018, 78, 296–307. [Google Scholar] [CrossRef]
  55. Jeong, S.-Y.; Lee, J.-H.; Shin, Y.; Chung, S.; Kuh, H.-J. Co-culture of tumor spheroids and fibroblasts in a collagen matrix-incorporated microfluidic chip mimics reciprocal activation in solid tumor microenvironment. PLoS ONE 2016, 11, e0159013. [Google Scholar] [CrossRef] [Green Version]
  56. Lee, J.-H.; Kim, S.-K.; Khawar, I.A.; Jeong, S.-Y.; Chung, S.; Kuh, H.-J. Microfluidic co-culture of pancreatic tumor spheroids with stellate cells as a novel 3D model for investigation of stroma-mediated cell motility and drug resistance. J. Exp. Clin. Cancer Res. 2018, 37, 1–12. [Google Scholar] [CrossRef] [Green Version]
  57. Beer, M.; Kuppalu, N.; Stefanini, M.; Becker, H.; Schulz, I.; Manoli, S.; Schuette, J.; Schmees, C.; Casazza, A.; Stelzle, M.; et al. A novel microfluidic 3D platform for culturing pancreatic ductal adenocarcinoma cells: Comparison with in vitro cultures and in vivo xenografts. Sci. Rep. 2017, 7, 1–12. [Google Scholar] [CrossRef] [PubMed]
  58. Ramappa, N.K. A System Biology Approach to Study Pancreatic Ductal Adenocarcinoma (PDAC) Cells in In Vitro Culture; Universita degli Studi di Firenze: Florence, Italy, 2017. [Google Scholar]
  59. Noel, P.; Muñoz, R.; Rogers, G.W.; Neilson, A.; Hoff, D.D.V.; Han, H. Preparation and metabolic assay of 3-dimensional spheroid co-cultures of pancreatic cancer cells and fibroblasts. J. Vis. Exp. 2017. [Google Scholar] [CrossRef] [PubMed] [Green Version]
  60. Ivascu, A.; Kubbies, M. Rapid generation of single-tumor spheroids for high-throughput cell function and toxicity analysis. J. Biomol. Screen. 2006, 11, 922–932. [Google Scholar] [CrossRef] [PubMed] [Green Version]
  61. Tung, Y.-C.; Hsiao, A.Y.; Allen, S.G.; Torisawa, Y.; Ho, M.; Takayama, S. High-throughput 3D spheroid culture and drug testing using a 384 hanging drop array. Analyst 2011, 136, 473–478. [Google Scholar] [CrossRef]
  62. Gurski, L.A.; Petrelli, N.J.; Jia, X.; Farach-Carson, M.C. 3D Matrices for anti-cancer drug testing and development. Oncol. Issues 2010, 25, 20–25. [Google Scholar] [CrossRef]
  63. Schmidt, J.J.; Rowley, J.; Kong, H.J. Hydrogels used for cell-based drug delivery. J. Biomed. Mater. Res. A 2008, 87, 1113–1122. [Google Scholar] [CrossRef]
  64. Norberg, K.J.; Liu, X.; Fernández Moro, C.; Strell, C.; Nania, S.; Blümel, M.; Balboni, A.; Bozóky, B.; Heuchel, R.L.; Löhr, J.M. A novel pancreatic tumour and stellate cell 3D co-culture spheroid model. BMC Cancer 2020, 20, 1–13. [Google Scholar] [CrossRef]
  65. Cukierman, E.; Pankov, R.; Stevens, D.R.; Yamada, K.M. Taking cell-matrix adhesions to the third dimension. Science 2001, 294, 1708–1712. [Google Scholar] [CrossRef]
  66. Gagliano, N. Epithelial-to-mesenchymal transition in pancreatic ductal adenocarcinoma: Characterization in a 3D-cell culture model. World J. Gastroenterol. 2016, 22, 4466. [Google Scholar] [CrossRef] [PubMed]
  67. Asthana, A.; Kisaalita, W.S. Microtissue size and hypoxia in HTS with 3D cultures. Drug Discov. Today 2012, 17, 810–817. [Google Scholar] [CrossRef] [PubMed]
  68. Firuzi, O.; Che, P.P.; Hassouni, B.E.; Buijs, M.; Coppola, S.; Löhr, M.; Funel, N.; Heuchel, R.; Carnevale, I.; Schmidt, T.; et al. Role of c-MET inhibitors in overcoming drug resistance in spheroid models of primary human pancreatic cancer and stellate cells. Cancers 2019, 11, 638. [Google Scholar] [CrossRef] [PubMed] [Green Version]
  69. Zhang, H.C.; Kuo, C.J. Personalizing pancreatic cancer organoids with hPSCs. Nat. Med. 2015, 21, 1249–1251. [Google Scholar] [CrossRef] [PubMed]
  70. Seino, T.; Kawasaki, S.; Shimokawa, M.; Tamagawa, H.; Toshimitsu, K.; Fujii, M.; Ohta, Y.; Matano, M.; Nanki, K.; Kawasaki, K.; et al. Human pancreatic tumor organoids reveal loss of stem cell niche factor dependence during disease progression. Cell Stem Cell 2018, 22, 454–467. [Google Scholar] [CrossRef] [Green Version]
  71. Lee, J.; Snyder, E.R.; Liu, Y.; Gu, X.; Wang, J.; Flowers, B.M.; Kim, Y.J.; Park, S.; Szot, G.L.; Hruban, R.H.; et al. Reconstituting development of pancreatic intraepithelial neoplasia from primary human pancreas duct cells. Nat. Commun. 2017, 8, 1–14. [Google Scholar] [CrossRef] [Green Version]
  72. Yip, D.; Cho, C.H. A multicellular 3D heterospheroid model of liver tumor and stromal cells in collagen gel for anti-cancer drug testing. Biochem. Biophys. Res. Commun. 2013, 433, 327–332. [Google Scholar] [CrossRef]
  73. Majety, M.; Pradel, L.P.; Gies, M.; Ries, C.H. Fibroblasts influence survival and therapeutic response in a 3D co-culture model. PLoS ONE 2015, 10, e0127948. [Google Scholar] [CrossRef]
  74. Kikuta, K.; Masamune, A.; Watanabe, T.; Ariga, H.; Itoh, H.; Hamada, S.; Satoh, K.; Egawa, S.; Unno, M.; Shimosegawa, T. Pancreatic stellate cells promote epithelial-mesenchymal transition in pancreatic cancer cells. Biochem. Biophys. Res. Commun. 2010, 403, 380–384. [Google Scholar] [CrossRef]
  75. Rodenhizer, D.; Gaude, E.; Cojocari, D.; Mahadevan, R.; Frezza, C.; Wouters, B.G.; McGuigan, A.P. A three-dimensional engineered tumour for spatial snapshot analysis of cell metabolism and phenotype in hypoxic gradients. Nat. Mater. 2015, 15, 227–234. [Google Scholar] [CrossRef]
  76. Moreira, L.; Bakir, B.; Chatterji, P.; Dantes, Z.; Reichert, M.; Rustgi, A.K. Pancreas 3D organoids: Current and future aspects as a research platform for personalized medicine in pancreatic cancer. Cell. Mol. Gastroenterol. Hepatol. 2018, 5, 289–298. [Google Scholar] [CrossRef] [PubMed] [Green Version]
  77. Nelson, S.R.; Zhang, C.; Roche, S.; O’Neill, F.; Swan, N.; Luo, Y.; Larkin, A.; Crown, J.; Walsh, N. Modelling of pancreatic cancer biology: Transcriptomic signature for 3D PDX-derived organoids and primary cell line organoid development. Sci. Rep. 2020, 10, 1–12. [Google Scholar] [CrossRef] [PubMed]
  78. Hwang, C.-I.; Boj, S.F.; Clevers, H.; Tuveson, D.A. Preclinical models of pancreatic ductal adenocarcinoma: Pre-clinical models of pancreatic ductal adenocarcinoma. J. Pathol. 2016, 238, 197–204. [Google Scholar] [CrossRef] [PubMed] [Green Version]
  79. Greggio, C.; De Franceschi, F.; Figueiredo-Larsen, M.; Gobaa, S.; Ranga, A.; Semb, H.; Lutolf, M.; Grapin-Botton, A. Artificial three-dimensional niches deconstruct pancreas development in vitro. Development 2013, 140, 4452–4462. [Google Scholar] [CrossRef] [PubMed] [Green Version]
  80. Ferro, R.; Falasca, M. Emerging role of the KRAS-PDK1 axis in pancreatic cancer. World J. Gastroenterol. 2014, 20, 10752–10757. [Google Scholar] [CrossRef]
  81. Cristobal, A.; van den Toorn, H.W.P.; van de Wetering, M.; Clevers, H.; Heck, A.J.R.; Mohammed, S. Personalized proteome profiles of healthy and tumor human colon organoids reveal both individual diversity and basic features of colorectal cancer. Cell Rep. 2017, 18, 263–274. [Google Scholar] [CrossRef] [Green Version]
  82. Walsh, A.J.; Castellanos, J.A.; Nagathihalli, N.S.; Merchant, N.B.; Skala, M.C. Optical imaging of drug-induced metabolism changes in murine and human pancreatic cancer organoids reveals heterogeneous drug response. Pancreas 2016, 45, 863–869. [Google Scholar] [CrossRef]
  83. Amrutkar, M.; Aasrum, M.; Verbeke, C.S.; Gladhaug, I.P. Secretion of fibronectin by human pancreatic stellate cells promotes chemoresistance to gemcitabine in pancreatic cancer cells. BMC Cancer 2019, 19, 596. [Google Scholar] [CrossRef] [Green Version]
  84. Huang, L.; Holtzinger, A.; Jagan, I.; BeGora, M.; Lohse, I.; Ngai, N.; Nostro, C.; Wang, R.; Muthuswamy, L.B.; Crawford, H.C.; et al. Ductal pancreatic cancer modeling and drug screening using human pluripotent stem cell—And patient-derived tumor organoids. Nat. Med. 2015, 21, 1364–1371. [Google Scholar] [CrossRef]
  85. Durymanov, M.; Kroll, C.; Permyakova, A.; O’Neill, E.; Sulaiman, R.; Person, M.; Reineke, J. Subcutaneous inoculation of 3D pancreatic cancer spheroids results in development of reproducible stroma-rich tumors. Transl. Oncol. 2019, 12, 180–189. [Google Scholar] [CrossRef]
  86. Omary, M.B.; Lugea, A.; Lowe, A.W.; Pandol, S.J. The pancreatic stellate cell: A star on the rise in pancreatic diseases. J. Clin. Investig. 2007, 117, 50–59. [Google Scholar] [CrossRef] [PubMed] [Green Version]
  87. Hwang, R.F.; Moore, T.; Arumugam, T.; Ramachandran, V.; Amos, K.D.; Rivera, A.; Ji, B.; Evans, D.B.; Logsdon, C.D. Cancer-associated stromal fibroblasts promote pancreatic tumor progression. Cancer Res. 2008, 68, 918–926. [Google Scholar] [CrossRef] [PubMed] [Green Version]
  88. Miyamoto, H.; Murakami, T.; Tsuchida, K.; Sugino, H.; Miyake, H.; Tashiro, S. Tumor-stroma interaction of human pancreatic cancer: Acquired resistance to anticancer drugs and proliferation regulation is dependent on extracellular matrix proteins. Pancreas 2004, 28, 38–44. [Google Scholar] [CrossRef]
  89. Uzunparmak, B.; Sahin, I.H. Pancreatic cancer microenvironment: A current dilemma. Clin. Transl. Med. 2019, 8, 2. [Google Scholar] [CrossRef] [PubMed]
  90. Amit, M.; Gil, Z. Macrophages increase the resistance of pancreatic adenocarcinoma cells to gemcitabine by upregulating cytidine deaminase. OncoImmunology 2013, 2, e27231. [Google Scholar] [CrossRef] [Green Version]
  91. Al-Assar, O.; Demiciorglu, F.; Lunardi, S.; Gaspar-Carvalho, M.M.; McKenna, W.G.; Muschel, R.M.; Brunner, T.B. Contextual regulation of pancreatic cancer stem cell phenotype and radioresistance by pancreatic stellate cells. Radiother. Oncol. 2014, 111, 243–251. [Google Scholar] [CrossRef]
  92. Dauer, P.; Nomura, A.; Saluja, A.; Banerjee, S. Microenvironment in determining chemo-resistance in pancreatic cancer: Neighborhood matters. Pancreatology 2017, 17, 7–12. [Google Scholar] [CrossRef] [Green Version]
  93. Puls, T.J.; Tan, X.; Whittington, C.F.; Voytik-Harbin, S.L. 3D collagen fibrillar microstructure guides pancreatic cancer cell phenotype and serves as a critical design parameter for phenotypic models of EMT. PLoS ONE 2017, 12, e0188870. [Google Scholar] [CrossRef] [Green Version]
  94. Davies, C.d.L.; Berk, D.A.; Pluen, A.; Jain, R.K. Comparison of IgG diffusion and extracellular matrix composition in rhabdomyosarcomas grown in mice versus in vitro as spheroids reveals the role of host stromal cells. Br. J. Cancer 2002, 86, 1639–1644. [Google Scholar] [CrossRef]
  95. Young, E.W.K. Cells, tissues, and organs on chips: Challenges and opportunities for the cancer tumor microenvironment. Integr. Biol. Quant. Biosci. Nano Macro 2013, 5, 1096–1109. [Google Scholar] [CrossRef]
  96. Vamvakidou, A.P.; Mondrinos, M.J.; Petushi, S.P.; Garcia, F.U.; Lelkes, P.I.; Tozeren, A. Heterogeneous breast tumoroids: An in vitro assay for investigating cellular heterogeneity and drug delivery. J. Biomol. Screen. 2007, 12, 13–20. [Google Scholar] [CrossRef] [PubMed] [Green Version]
  97. Djordjevic, B.; Lange, C.S. Hybrid spheroids as a tool for prediction of radiosensitivity in tumor therapy. Indian J. Exp. Biol. 2004, 42, 443–447. [Google Scholar] [PubMed]
  98. Djordjevic, B.; Lange, C.S. Cell-cell interactions in spheroids maintained in suspension. Acta Oncol. 2006, 45, 412–420. [Google Scholar] [CrossRef] [PubMed]
  99. Kamb, A. What’s wrong with our cancer models? Nat. Rev. Drug Discov. 2005, 4, 161–165. [Google Scholar] [CrossRef] [PubMed]
  100. Fennema, E.; Rivron, N.; Rouwkema, J.; van Blitterswijk, C.; de Boer, J. Spheroid culture as a tool for creating 3D complex tissues. Trends Biotechnol. 2013, 31, 108–115. [Google Scholar] [CrossRef]
  101. Sato, N.; Maehara, N.; Goggins, M. Gene Expression Profiling of tumor—Stromal interactions between pancreatic cancer cells and stromal fibroblasts. Cancer Res. 2004, 64, 6950–6956. [Google Scholar] [CrossRef] [Green Version]
  102. Venter, C.; Niesler, C. A triple co-culture method to investigate the effect of macrophages and fibroblasts on myoblast proliferation and migration. BioTechniques 2018, 64, 52–58. [Google Scholar] [CrossRef] [Green Version]
  103. Bauleth-Ramos, T.; Feijão, T.; Gonçalves, A.; Shahbazi, M.-A.; Liu, Z.; Barrias, C.; Oliveira, M.J.; Granja, P.; Santos, H.A.; Sarmento, B. Colorectal cancer triple co-culture spheroid model to assess the biocompatibility and anticancer properties of polymeric nanoparticles. J. Controlled Release 2020, 323, 398–411. [Google Scholar] [CrossRef]
  104. Kunz-Schughart, L.A.; Heyder, P.; Schroeder, J.; Knuechel, R. A Heterologous 3-D coculture model of breast tumor cells and fibroblasts to study tumor-associated fibroblast differentiation. Exp. Cell Res. 2001, 266, 74–86. [Google Scholar] [CrossRef]
  105. Seidl, P.; Huettinger, R.; Knuechel, R.; Kunz-Schughart, L.A. Three-dimensional fibroblast-tumor cell interaction causes downregulation ofRACK1 mRNA expression in breast cancer cellsin vitro. Int. J. Cancer 2002, 102, 129–136. [Google Scholar] [CrossRef]
  106. Cavaco, A.C.M.; Rezaei, M.; Caliandro, M.F.; Lima, A.M.; Stehling, M.; Dhayat, S.A.; Haier, J.; Brakebusch, C.; Eble, J.A. The interaction between laminin-332 and α3β1 integrin determines differentiation and maintenance of CAFs, and supports invasion of pancreatic duct adenocarcinoma cells. Cancers 2018, 11, 14. [Google Scholar] [CrossRef] [Green Version]
  107. Bianco, M.; Zizzari, A.; Priore, P.; Moroni, L.; Metrangolo, P.; Frigione, M.; Rella, R.; Gaballo, A.; Arima, V. Lab-on-a-brane for spheroid formation. Biofabrication 2019, 11, 021002. [Google Scholar] [CrossRef] [PubMed]
  108. Lopa, S.; Piraino, F.; Kemp, R.J.; Di Caro, C.; Lovati, A.B.; Di Giancamillo, A.; Moroni, L.; Peretti, G.M.; Rasponi, M.; Moretti, M. Fabrication of multi-well chips for spheroid cultures and implantable constructs through rapid prototyping techniques: Multi-well PDMS chips and fibrin constructs. Biotechnol. Bioeng. 2015, 112, 1457–1471. [Google Scholar] [CrossRef] [PubMed] [Green Version]
  109. Ahn, J.; Sei, Y.; Jeon, N.; Kim, Y. Tumor microenvironment on a chip: The progress and future perspective. Bioengineering 2017, 4, 64. [Google Scholar] [CrossRef] [PubMed] [Green Version]
  110. Chiappalone, M.; Vato, A.; Tedesco, M.B.; Marcoli, M.; Davide, F.; Martinoia, S. Networks of neurons coupled to microelectrode arrays: A neuronal sensory system for pharmacological applications. Biosens. Bioelectron. 2003, 18, 627–634. [Google Scholar] [CrossRef]
  111. Manos, P.; Pancrazio, J.J.; Coulombe, M.G.; Ma, W.; Stenger, D.A. Characterization of rat spinal cord neurons cultured in defined media on microelectrode arrays. Neurosci. Lett. 1999, 271, 179–182. [Google Scholar] [CrossRef]
  112. Ben-Yoav, H.; Melamed, S.; Freeman, A.; Shacham-Diamand, Y.; Belkin, S. Whole-cell biochips for bio-sensing: Integration of live cells and inanimate surfaces. Crit. Rev. Biotechnol. 2011, 31, 337–353. [Google Scholar] [CrossRef]
  113. Stenger, D.A.; Gross, G.W.; Keefer, E.W.; Shaffer, K.M.; Andreadis, J.D.; Ma, W.; Pancrazio, J.J. Detection of physiologically active compounds using cell-based biosensors. Trends Biotechnol. 2001, 19, 304–309. [Google Scholar] [CrossRef]
  114. Kloss, D.; Fischer, M.; Rothermel, A.; Simon, J.C.; Robitzki, A.A. Drug testing on 3D in vitro tissues trapped on a microcavity chip. Lab Chip 2008, 8, 879–884. [Google Scholar] [CrossRef]
  115. Lin, S.-P.; Kyriakides, T.R.; Chen, J.-J.J. On-line observation of cell growth in a three-dimensional matrix on surface-modified microelectrode arrays. Biomaterials 2009, 30, 3110–3117. [Google Scholar] [CrossRef] [Green Version]
  116. Selimoglu, S.M.; Elibol, M. Alginate as an immobilization material for MAb production via encapsulated hybridoma cells. Crit. Rev. Biotechnol. 2010, 30, 145–159. [Google Scholar] [CrossRef] [PubMed]
  117. Lee, D.W.; Yi, S.H.; Jeong, S.H.; Ku, B.; Kim, J.; Lee, M.-Y. Plastic pillar inserts for three-dimensional (3D) cell cultures in 96-well plates. Sens. Actuators B Chem. 2013, 177, 78–85. [Google Scholar] [CrossRef]
  118. Kang, J.; Lee, D.W.; Hwang, H.J.; Yeon, S.-E.; Lee, M.-Y.; Kuh, H.-J. Mini-pillar array for hydrogel-supported 3D culture and high-content histologic analysis of human tumor spheroids. Lab Chip 2016, 16, 2265–2276. [Google Scholar] [CrossRef] [PubMed]
  119. Gui, Q.; Lawson, T.; Shan, S.; Yan, L.; Liu, Y. The application of whole cell-based biosensors for use in environmental analysis and in medical diagnostics. Sensors 2017, 17, 1623. [Google Scholar] [CrossRef] [Green Version]
  120. Van Duinen, V.; Trietsch, S.J.; Joore, J.; Vulto, P.; Hankemeier, T. Microfluidic 3D cell culture: From tools to tissue models. Curr. Opin. Biotechnol. 2015, 35, 118–126. [Google Scholar] [CrossRef] [PubMed] [Green Version]
  121. Griffith, L.G.; Swartz, M.A. Capturing complex 3D tissue physiology in vitro. Nat. Rev. Mol. Cell Biol. 2006, 7, 211–224. [Google Scholar] [CrossRef]
  122. Ott, C.; Heinmöller, E.; Gaumann, A.; Schölmerich, J.; Klebl, F. Intraepitheliale neoplasien (PanIN) und intraduktale papillär-muzinöse neoplasien (IPMN) des pankreas als vorläufer des pankreaskarzinoms. Med. Klin. 2007, 102, 127–135. [Google Scholar] [CrossRef]
  123. Xu, H.; Lyu, X.; Yi, M.; Zhao, W.; Song, Y.; Wu, K. Organoid technology and applications in cancer research. J. Hematol. Oncol. 2018, 11, 116. [Google Scholar] [CrossRef]
  124. Fujii, M.; Shimokawa, M.; Date, S.; Takano, A.; Matano, M.; Nanki, K.; Ohta, Y.; Toshimitsu, K.; Nakazato, Y.; Kawasaki, K.; et al. A colorectal tumor organoid library demonstrates progressive loss of niche factor requirements during tumorigenesis. Cell Stem Cell 2016, 18, 827–838. [Google Scholar] [CrossRef] [Green Version]
  125. Barbone, D.; Yang, T.-M.; Morgan, J.R.; Gaudino, G.; Broaddus, V.C. Mammalian target of rapamycin contributes to the acquired apoptotic resistance of human mesothelioma multicellular spheroids. J. Biol. Chem. 2008, 283, 13021–13030. [Google Scholar] [CrossRef] [Green Version]
  126. Frankel, A.; Man, S.; Elliott, P.; Adams, J.; Kerbel, R.S. Lack of multicellular drug resistance observed in human ovarian and prostate carcinoma treated with the proteasome inhibitor PS-341. Clin. Cancer Res. 2000, 6, 3719–3728. [Google Scholar]
  127. Howes, A.L.; Chiang, G.G.; Lang, E.S.; Ho, C.B.; Powis, G.; Vuori, K.; Abraham, R.T. The phosphatidylinositol 3-kinase inhibitor, PX-866, is a potent inhibitor of cancer cell motility and growth in three-dimensional cultures. Mol. Cancer Ther. 2007, 6, 2505–2514. [Google Scholar] [CrossRef] [PubMed] [Green Version]
  128. De Witt Hamer, P.C.; Leenstra, S.; Van Noorden, C.J.F.; Zwinderman, A.H. Organotypic glioma spheroids for screening of experimental therapies: How many spheroids and sections are required? Cytometry A 2009, 75, 528–534. [Google Scholar] [CrossRef] [PubMed]
  129. Zanoni, M.; Piccinini, F.; Arienti, C.; Zamagni, A.; Santi, S.; Polico, R.; Bevilacqua, A.; Tesei, A. 3D tumor spheroid models for in vitro therapeutic screening: A systematic approach to enhance the biological relevance of data obtained. Sci. Rep. 2016, 6, 1–11. [Google Scholar] [CrossRef] [PubMed]
  130. Laube, M.; Kniess, T.; Pietzsch, J. Development of antioxidant COX-2 inhibitors as radioprotective agents for radiation therapy—A hypothesis-driven review. Antioxidants 2016, 5, 14. [Google Scholar] [CrossRef] [Green Version]
  131. Kempf, H.; Bleicher, M.; Meyer-Hermann, M. Spatio-temporal cell dynamics in tumour spheroid irradiation. Eur. Phys. J. D 2010, 60, 177–193. [Google Scholar] [CrossRef]
  132. Sham, E.; Durand, R.E. Cell kinetics and repopulation mechanisms during multifraction irradiation of spheroids. Radiother. Oncol. 1998, 46, 201–207. [Google Scholar] [CrossRef]
  133. Azzam, E.I.; Little, J.B. The radiation-induced bystander effect: Evidence and significance. Hum. Exp. Toxicol. 2004, 23, 61–65. [Google Scholar] [CrossRef]
  134. Bishayee, A.; Rao, D.V.; Howell, R.W. Evidence for pronounced bystander effects caused by nonuniform distributions of radioactivity using a novel three-dimensional tissue culture model. Radiat. Res. 1999, 152, 88–97. [Google Scholar] [CrossRef]
  135. Durand, R.E.; Olive, P.L. Resistance of tumor cells to chemo- and radiotherapy modulated by the three-dimensional architecture of solid tumors and spheroids. In Methods in Cell Biology; Elsevier: Amsterdam, The Netherlands, 2001; Volume 64, pp. 211–233. ISBN 978-0-12-544167-4. [Google Scholar]
  136. Schwachöfer, J.H. Multicellular tumor spheroids in radiotherapy research (review). Anticancer Res. 1990, 10, 963–969. [Google Scholar]
  137. Zschenker, O.; Streichert, T.; Hehlgans, S.; Cordes, N. Genome-wide gene expression analysis in cancer cells reveals 3D growth to affect ECM and processes associated with cell adhesion but not DNA repair. PLoS ONE 2012, 7, e34279. [Google Scholar] [CrossRef] [PubMed] [Green Version]
  138. Neshasteh-Riz, A.; Angerson, W.; Reeves, J.; Smith, G.; Rampling, R.; Mairs, R. Incorporation of iododeoxyuridine in multicellular glioma spheroids: Implications for DNA-targeted radiotherapy using Auger electron emitters. Br. J. Cancer 1997, 75, 493–499. [Google Scholar] [CrossRef] [PubMed] [Green Version]
  139. Pawlik, T.M.; Keyomarsi, K. Role of cell cycle in mediating sensitivity to radiotherapy. Int. J. Radiat. Oncol. Biol. Phys. 2004, 59, 928–942. [Google Scholar] [CrossRef]
  140. Al-Ramadan, A.; Mortensen, A.; Carlsson, J.; Nestor, M. Analysis of radiation effects in two irradiated tumor spheroid models. Oncol. Lett. 2017. [Google Scholar] [CrossRef] [PubMed] [Green Version]
  141. Kempf, H.; Hatzikirou, H.; Bleicher, M.; Meyer-Hermann, M. In silico analysis of cell cycle synchronisation effects in radiotherapy of tumour spheroids. PLoS Comput. Biol. 2013, 9, e1003295. [Google Scholar] [CrossRef] [PubMed] [Green Version]
  142. Karlsson, H.; Senkowski, W.; Fryknäs, M.; Mansoori, S.; Linder, S.; Gullbo, J.; Larsson, R.; Nygren, P. A novel tumor spheroid model identifies selective enhancement of radiation by an inhibitor of oxidative phosphorylation. Oncotarget 2019, 10, 5372–5382. [Google Scholar] [CrossRef] [Green Version]
  143. Zoller, F.; Eisenhut, M.; Haberkorn, U.; Mier, W. Endoradiotherapy in cancer treatment—Basic concepts and future trends. Eur. J. Pharmacol. 2009, 625, 55–62. [Google Scholar] [CrossRef]
  144. Mehta, G.; Hsiao, A.Y.; Ingram, M.; Luker, G.D.; Takayama, S. Opportunities and challenges for use of tumor spheroids as models to test drug delivery and efficacy. J. Controlled Release 2012, 164, 192–204. [Google Scholar] [CrossRef] [Green Version]
  145. Gaze, M.N.; Mairs, R.J.; Boyack, S.M.; Wheldon, T.E.; Barrett, A. 131I-meta-iodobenzylguanidine therapy in neuroblastoma spheroids of different sizes. Br. J. Cancer 1992, 66, 1048–1052. [Google Scholar] [CrossRef]
  146. Sihver, W.; Pietzsch, J.; Krause, M.; Baumann, M.; Steinbach, J.; Pietzsch, H.-J. Radiolabeled cetuximab conjugates for EGFR targeted cancer diagnostics and therapy. Pharmaceuticals 2014, 7, 311–338. [Google Scholar] [CrossRef] [Green Version]
  147. Volkert, W.A.; Goeckeler, W.F.; Ehrhardt, G.J.; Ketring, A.R. Therapeutic radionuclides: Production and decay property considerations. J. Nucl. Med. 1991, 32, 174–185. [Google Scholar] [PubMed]
  148. Kassis, A.I. Therapeutic radionuclides: Biophysical and radiobiologic principles. Semin. Nucl. Med. 2008, 38, 358–366. [Google Scholar] [CrossRef] [PubMed] [Green Version]
  149. De Jong, M.; Breeman, W.A.P.; Valkema, R.; Bernard, B.F.; Krenning, E.P. Combination radionuclide therapy using 177Lu- and 90Y-labeled somatostatin analogs. J. Nucl. Med. 2005, 46 (Suppl. S1), 13S–17S. [Google Scholar] [PubMed]
  150. McMillan, D.D.; Maeda, J.; Bell, J.J.; Genet, M.D.; Phoonswadi, G.; Mann, K.A.; Kraft, S.L.; Kitamura, H.; Fujimori, A.; Yoshii, Y.; et al. Validation of 64Cu-ATSM damaging DNA via high-LET Auger electron emission. J. Radiat. Res. 2015, 56, 784–791. [Google Scholar] [CrossRef] [Green Version]
  151. Mairs, R.J.; Fullerton, N.E.; Cosimo, E.; Boyd, M. Gene manipulation to enhance MIBG-targeted radionuclide therapy. Nucl. Med. Biol. 2005, 32, 749–753. [Google Scholar] [CrossRef] [PubMed]
  152. Wheldon, T.E. Radiation physics and genetic targeting: New directions for radiotherapy. Phys. Med. Biol. 2000, 45, R77–R95. [Google Scholar] [CrossRef] [PubMed]
  153. Rae, C.; Tesson, M.; Babich, J.W.; Boyd, M.; Sorensen, A.; Mairs, R.J. The role of copper in disulfiram-induced toxicity and radiosensitization of cancer cells. J. Nucl. Med. 2013, 54, 953–960. [Google Scholar] [CrossRef] [PubMed] [Green Version]
  154. Rae, C.; Mairs, R.J. Evaluation of the radiosensitizing potency of chemotherapeutic agents in prostate cancer cells. Int. J. Radiat. Biol. 2017, 93, 194–203. [Google Scholar] [CrossRef] [Green Version]
  155. Lundsten, S.; Spiegelberg, D.; Stenerlöw, B.; Nestor, M. The HSP90 inhibitor onalespib potentiates 177Lu-DOTATATE therapy in neuroendocrine tumor cells. Int. J. Oncol. 2019, 55, 1287–1295. [Google Scholar] [CrossRef]
  156. De Kruijff, R.M.; van der Meer, A.J.G.M.; Windmeijer, C.A.A.; Kouwenberg, J.J.M.; Morgenstern, A.; Bruchertseifer, F.; Sminia, P.; Denkova, A.G. The therapeutic potential of polymersomes loaded with 225Ac evaluated in 2D and 3D in vitro glioma models. Eur. J. Pharm. Biopharm. 2018, 127, 85–91. [Google Scholar] [CrossRef]
  157. Wang, J.; Abbas Rizvi, S.M.; Madigan, M.C.; Cozzi, P.J.; Power, C.A.; Qu, C.F.; Morgenstern, A.; Apostolidis, C.; Russell, P.J.; Allen, B.J.; et al. Control of prostate cancer spheroid growth using213Bi-labeled multiple targeted α radioimmunoconjugates. Prostate 2006, 66, 1753–1767. [Google Scholar] [CrossRef] [PubMed]
  158. Qu, C.F.; Song, Y.J.; Rizvi, S.M.A.; Li, Y.; Smith, R.; Perkins, A.; Morgenstern, A.; Brechbiel, M.W.; Allen, B.J. In vivo and in vitro inhibition of pancreatic cancer growth by targeted alpha therapy using 213Bi-CHX.A”-C595. Cancer Biol. Ther. 2005, 4, 848–853. [Google Scholar] [CrossRef] [PubMed] [Green Version]
  159. Allen, B.J.; Rizvi, S.M.A.; Qu, C.F.; Smith, R.C. Targeted alpha therapy approach to the management of pancreatic cancer. Cancers 2011, 3, 1821–1843. [Google Scholar] [CrossRef] [Green Version]
  160. Song, H.; Shahverdi, K.; Huso, D.L.; Esaias, C.; Fox, J.; Liedy, A.; Zhang, Z.; Reilly, R.T.; Apostolidis, C.; Morgenstern, A.; et al. 213Bi (-Emitter)-Antibody Targeting of Breast Cancer Metastases in the neu-N Transgenic Mouse Model. Cancer Res. 2008, 68, 3873–3880. [Google Scholar] [CrossRef] [Green Version]
  161. Kennel, S.J.; Stabin, M.; Roeske, J.C.; Foote, L.J.; Lankford, P.K.; Terzaghi-Howe, M.; Patterson, H.; Barkenbus, J.; Popp, D.M.; Boll, R.; et al. Radiotoxicity of bismuth-213 bound to membranes of monolayer and spheroid cultures of tumor cells. Radiat. Res. 1999, 151, 244. [Google Scholar] [CrossRef]
  162. Koi, L.; Bergmann, R.; Brüchner, K.; Pietzsch, J.; Pietzsch, H.-J.; Krause, M.; Steinbach, J.; Zips, D.; Baumann, M. Radiolabeled anti-EGFR-antibody improves local tumor control after external beam radiotherapy and offers theragnostic potential. Radiother. Oncol. 2014, 110, 362–369. [Google Scholar] [CrossRef] [PubMed]
  163. Ingargiola, M.; Runge, R.; Heldt, J.-M.; Freudenberg, R.; Steinbach, J.; Cordes, N.; Baumann, M.; Kotzerke, J.; Brockhoff, G.; Kunz-Schughart, L.A. Potential of a Cetuximab-based radioimmunotherapy combined with external irradiation manifests in a 3-D cell assay: Potential of EGFR-based RIT with X-ray. Int. J. Cancer 2014, 135, 968–980. [Google Scholar] [CrossRef] [Green Version]
  164. Kasten, B.B.; Gangrade, A.; Kim, H.; Fan, J.; Ferrone, S.; Ferrone, C.R.; Zinn, K.R.; Buchsbaum, D.J. 212Pb-labeled B7-H3-targeting antibody for pancreatic cancer therapy in mouse models. Nucl. Med. Biol. 2018, 58, 67–73. [Google Scholar] [CrossRef]
  165. Monazzam, A.; Razifar, P.; Ide, S.; Rugaard Jensen, M.; Josephsson, R.; Blomqvist, C.; Langström, B.; Bergström, M. Evaluation of the Hsp90 inhibitor NVP-AUY922 in multicellular tumour spheroids with respect to effects on growth and PET tracer uptake. Nucl. Med. Biol. 2009, 36, 335–342. [Google Scholar] [CrossRef]
  166. Senavirathna, L.K.; Fernando, R.; Maples, D.; Zheng, Y.; Polf, J.C.; Ranjan, A. Tumor spheroids as an in vitro model for determining the therapeutic response to proton beam radiotherapy and thermally sensitive nanocarriers. Theranostics 2013, 3, 687–691. [Google Scholar] [CrossRef] [Green Version]
  167. Friedrich, J.; Eder, W.; Castaneda, J.; Doss, M.; Huber, E.; Ebner, R.; Kunz-Schughart, L.A. A reliable tool to determine cell viability in complex 3-D culture: The acid phosphatase assay. J. Biomol. Screen. 2007, 12, 925–937. [Google Scholar] [CrossRef] [PubMed] [Green Version]
  168. Wen, Z.; Liao, Q.; Hu, Y.; You, L.; Zhou, L.; Zhao, Y. A spheroid-based 3-D culture model for pancreatic cancer drug testing, using the acid phosphatase assay. Braz. J. Med. Biol. Res. 2013, 46, 634–642. [Google Scholar] [CrossRef] [PubMed] [Green Version]
  169. Qvarnström, O.F.; Simonsson, M.; Eriksson, V.; Turesson, I.; Carlsson, J. γH2AX and cleaved PARP-1 as apoptotic markers in irradiated breast cancer BT474 cellular spheroids. Int. J. Oncol. 2009, 35, 41–47. [Google Scholar] [CrossRef]
  170. Hanahan, D.; Folkman, J. Patterns and emerging mechanisms of the angiogenic switch during tumorigenesis. Cell 1996, 86, 353–364. [Google Scholar] [CrossRef] [Green Version]
  171. Furukawa, T.; Yuan, Q.; Jin, Z.-H.; Aung, W.; Yoshii, Y.; Hasegawa, S.; Endo, H.; Inoue, M.; Zhang, M.-R.; Fujibayashi, Y.; et al. A limited overlap between intratumoral distribution of 1-(5-fluoro-5-deoxy-α-D-arabinofuranosyl)-2-nitroimidazole and copper-diacetyl-bis[N(4)-methylthiosemicarbazone]. Oncol. Rep. 2015, 34, 1379–1387. [Google Scholar] [CrossRef]
  172. Litos, L.-M. The Evaluation of PET-Tracer Accumulation in Multicellular Tumor Spheroids. Ph.D. Thesis, University of Vienna, Vienna, Austria, 2017. [Google Scholar]
  173. Kniess, T.; Laube, M.; Bergmann, R.; Sehn, F.; Graf, F.; Steinbach, J.; Wuest, F.; Pietzsch, J. Radiosynthesis of a 18F-labeled 2,3-diarylsubstituted indole via McMurry coupling for functional characterization of cyclooxygenase-2 (COX-2) in vitro and in vivo. Bioorg. Med. Chem. 2012, 20, 3410–3421. [Google Scholar] [CrossRef]
  174. Reissenweber, B.; Mosch, B.; Pietzsch, J. Experimental hypoxia does not influence gene expression and protein synthesis of Eph receptors and ephrin ligands in human melanoma cells in vitro. Melanoma Res. 2013, 23, 85–95. [Google Scholar] [CrossRef]
  175. Rasey, J.S.; Nelson, N.J.; Chin, L.; Evans, M.L.; Grunbaum, Z. Characteristics of the binding of labeled fluoromisonidazole in cells in vitro. Radiat. Res. 1990, 122, 301. [Google Scholar] [CrossRef]
  176. Gross, M.W.; Karbach, U.; Groebe, K.; Franko, A.J.; Mueller-Klieser, W. Calibration of misonidazole labeling by simultaneous measurement of oxygen tension and labeling density in multicellular spheroids. Int. J. Cancer 1995, 61, 567–573. [Google Scholar] [CrossRef]
  177. Monazzam, A.; Razifar, P.; Simonsson, M.; Qvarnström, F.; Josephsson, R.; Blomqvist, C.; Långström, B.; Bergström, M. Multicellular tumour spheroid as a model for evaluation of [18F]FDG as biomarker for breast cancer treatment monitoring. Cancer Cell Int. 2006, 6, 6. [Google Scholar] [CrossRef] [Green Version]
  178. Senekowitsch-Schmidtke, R.; Matzen, K.; Truckenbrodt, R.; Mattes, J.; Heiss, P.; Schwaiger, M. Tumor cell spheroids as a model for evaluation of metabolic changes after irradiation. J. Nucl. Med. 1998, 39, 1762–1768. [Google Scholar] [PubMed]
  179. Mairs, R.; Angerson, W.; Gaze, M.; Murray, T.; Babich, J.; Reid, R.; McSharry, C. The distribution of alternative agents for targeted radiotherapy within human neuroblastoma spheroids. Br. J. Cancer 1991, 63, 404–409. [Google Scholar] [CrossRef] [Green Version]
  180. Monazzam, A.; Razifar, P.; Lindhe, Ö.; Josephsson, R.; Långström, B.; Bergström, M. A new, fast and semi-automated size determination method (SASDM) for studying multicellular tumor spheroids. Cancer Cell Int. 2005, 5, 32. [Google Scholar] [CrossRef] [PubMed] [Green Version]
  181. Monazzam, A.; Josephsson, R.; Blomqvist, C.; Carlsson, J.; Långström, B.; Bergström, M. Application of the multicellular tumour spheroid model to screen PET tracers for analysis of early response of chemotherapy in breast cancer. Breast Cancer Res. 2007, 9, R45. [Google Scholar] [CrossRef] [PubMed] [Green Version]
  182. Laube, M.; Kniess, T.; Pietzsch, J. Radiolabeled COX-2 inhibitors for non-invasive visualization of COX-2 expression and activity—A critical update. Molecules 2013, 18, 6311–6355. [Google Scholar] [CrossRef] [PubMed] [Green Version]
  183. Servente, L.; Bianco, C.; Gigirey, V.; Alonso, O. Imaging benign pathology and variants with uptake in 68ga-Dotatate PET/CT studies. Rev. Argent. Radiol. 2017, 81, 184–191. [Google Scholar] [CrossRef] [Green Version]
  184. Lakhotia, R.; Jhawar, S.; Malayeri, A.A.; Millo, C.; Del Rivero, J.; Ahlman, M.A. Incidental 68Ga-DOTATATE uptake in the pancreatic head: A case report and a unique opportunity to improve clinical care. Medicine 2020, 99, e20197. [Google Scholar] [CrossRef]
  185. Barrio, M.; Ceppa, E.P. Diagnosing microscopic pancreatic neuroendocrine tumor using 68-Ga-DOTATATE PET/CT: Case series. J. Surg. Case Rep. 2018, 2018, rjy237. [Google Scholar] [CrossRef] [Green Version]
  186. Liu, Z.; Zhang, P.; Ji, H.; Long, Y.; Jing, B.; Wan, L.; Xi, D.; An, R.; Lan, X. A mini-panel PET scanner-based microfluidic radiobioassay system allowing high-throughput imaging of real-time cellular pharmacokinetics. Lab Chip 2020, 20, 1110–1123. [Google Scholar] [CrossRef]
Figure 1. Characteristics of spheroids originating from human cancer cell lines: (A) SEM image of a colorectal cancer cell line (HT29) spheroid depicting the spherical shape as the main characteristic of spheroids. (B) Bright-field microscopy image of a pancreatic cancer cell line (HPAF II) spheroid confirming stability of the 3D cell assembly. (C) Like tumors in vivo, spheroids show physiological zoning, consisting of a rim of viable cells and, depending on their size, of hypoxic or necrotic core zone. Exemplarily, the hypoxic core of a melanoma cell line (A2508) spheroid with a diameter of approximately 0.55 mm is shown by pimonidazole staining. (D) Hematoxylin and eosin staining of a melanoma cell line (A2508) spheroid showing the heterogeneous composition that can vary in cell and extracellular matrix arrangement depending on cell line and treatment. (E) Distribution of viable cells and, as a further characteristic feature, the possible active migration of cells from the 3D cell assembly: here, exemplarily shown by fluorescence staining with DAPI (4′,6-diamidino-2-phenylindole) (blue) and calcein (green) in a 10-day-old co-cultivated spheroid of pancreatic carcinoma cell line (SW1990) and pancreatic stellate cells (HPaSteC) with an initial seeded cell number of 16,000 cells (ratio 1:3). (F) Spheroids are characterized by the formation of gradients, which, among other things, modify the transport of nutrients, metabolites, and drugs similar to the situation in vivo, as shown here in the passive transport of the fluorescent marker calcein in a 10-day-old pancreatic cancer cell line (PanC-1) spheroid with an initial seeded cell number of 16,000 cells.
Cancers 12 02765 g001
Figure 2. Increment of complexity in cell culture methods for PDAC research: cancer research is moving forward from monolayer cultures towards the use of spheroids. Including a second cell line, e.g., fibroblasts, into the model further increases the complexity. One-step further, spheroids are injected into mice for an advanced model in vivo with the possibility to mimic the progression of small metastases to tumors. On the other hand, using biotechnological state-of-the-art, for example HepaChip®, allows for measurement of cell reactions directly with electrodes.
Cancers 12 02765 g002
Figure 3. Major differences between spheroid and monolayer culture that cause challenges for therapy development: (A) in contrast to monolayer culture, cells in a spheroid are tightly packed. This leads to the contact effect that induces radioresistance observed in 3D models as well as in patients. (B) The percentage of cycling cells in spheroids is size-dependent and varies between 40 to 70%, while in monolayer culture, more than 90% of cells are cycling. That makes the monolayer cells much more prone to medication and leads to misleading results, explaining the high number of failed clinical trials. (C) Oxygen, nutrient, and drug gradients are present in spheroids with concentration and penetration of all three decreasing towards the spheroid core, whereas in a monolayer culture, oxygen, nutrients, and drugs can reach each cell with equal efficiency. This leads again to false expectations on the true effectiveness of a drug candidate. In PDAC, the situation is even more severe, as fibrosis leads to a dense mesh-like network that hampers nutrients, drugs, as well as oxygen from entering the spheroid, leading to pronounced gradient formation. All three challenges are present and even more complex in co-culture spheroids.
Cancers 12 02765 g003
Figure 4. Methods for measuring response of spheroids to anticancer treatment: reactions of spheroids to treatments, e.g., irradiation, radiopharmaceuticals, or nonradioactive compounds, can be determined using these methods. The first option is to measure spheroid size using bright-field microscopy. Treatment effects are evaluated referring to shrinkage in size, reduction of growth rate, and capacity for regrowth (w/o: without). The second option is the acid phosphatase assay (APH) assay utilizing the activity of acid phosphatase in viable cells. The hydrolysis of p-nitrophenyl-phosphate to p-nitrophenol is detected as increase in absorption at 405 nm. The third option is to estimate the fraction of viable cells in a spheroid referring to staining of nucleic acids and viability markers such as DAPI and calcein, respectively.
Cancers 12 02765 g004
Figure 5. Schematic overview of molecular or pathophysiologic targets for well-established and novel radiotracers: some of them address membrane-bound cell receptors or transporters like somatostatin receptors (SSTR), adenosine receptors A3 (ADORA3), or L-amino-acid transporters (LAT1). Other tracers such as [11C]choline are taken up by transporters as the choline transporter-like protein (CTL1) and incorporated into the phospholipids of proliferating cells. The enzyme substrates [3H]thymidine and [18F]FLT target proliferating cells by incorporation into the DNA via for example the cytosolic thymidine kinase (TK-1). Enzyme inhibitors, portrayed here by [18F]3, a radiolabeled selective cyclooxygenase 2 inhibitor, in turn accumulate in areas of high enzyme concentration and activity. The radiolabeled glucose derivative [18F]FDG visualizes glucose turnover by glucose transport (GLUT-1) and hexokinase (HK) reaction and consequently the metabolic activity and viability of cells, which is high in the normoxic proliferating regions of the spheroid and lower in the hypoxic core. In contrast, [18F]FMISO binds to macromolecules in a hypoxic environment and thus accumulates in the hypoxic core (Table 4).
Cancers 12 02765 g005
Table 1. Overview of current techniques for 3D models used in pancreatic ductal adenocarcinoma (PDAC) research.
3D ModelTechniqueLiterature
Multicellular spheroidsScaffold: Matrigel and collagen[34,35,36,37]
Scaffold: Methylcellulose[38,39]
NanoCulture plates[40]
Hyaluronan/chitosan coated plates[41]
Ultralow attachment plates[42]
concave polydimethylsiloxane microwell plates[43]
Hanging drop[38,44,45]
OrganoidsMechanical and chemical dissociation[46,47,48,49]
Co-culturesCultivation with stromal cells[42,50]
Cultivation with stellate cells[51]
Triple culture with fibroblasts and monocytes[52,53]
Triple culture with fibroblasts and endothelial cells[54]
Biotechnical microsystemsMicrofluidic chip[55]
Microfluidic plate[56]
HepaChip®[57,58]
Magnetic bioprinting[59]
Table 2. Three-dimensional models for PDAC research and their application.
3D ModelField of InterestLiterature
Multicellular spheroidsProtein levels[40,65,66]
Hypoxia marker[38]
Drug screening[42,43,67,68]
MicroRNA expression[43]
qRT-PCR[43]
OrganoidsKRAS or other genetic mutation[46,69]
Orthotopic transplantation[48,70,71]
Subcutaneous transplantation[70]
PanIN development[48]
Co-culturesInvasive behavior[50,70]
Therapy resistance[68,72,73]
Migration[41,74]
EMT marker expression[74]
Proliferation[73]
T-cell inhibition[52]
Protein expression[73]
Signaling pathways[37]
Biotechnical microsystemsDrug response[56,57,58]
Marker and factor expression[56]
Hypoxia[75]
Table 3. Examples for radiopharmaceuticals that have been used on 3D models of various tumor entities and partly in combination with radiosensitizers or external radiation.
TherapeuticsTumor EntityTargetTreatment CombinationsLiterature
[211At]MABGneuroblastomanorepinephrine receptor [151]
[131I]MIGBglioma neuroblastomanorepinephrine receptorradiosensitizer Disulfiram[145,152,153]
[131I]MIP-1145melanomamelanin uptakeradiosensitizer topotecan, AG014699[154]
[125I]IUdRglioblastomaDNA (S-phase) [138]
[177Lu]Lu-DOTATATEpancreatic neuroendocrine tumor, lung cancersomatostatin analogueradiosensitizer onalespib[155]
[225Ac]DTPAglioblastomaDNA [156]
[213Bi]C595 ACprostate cancer, pancreatic cancermucin1 [157,158,159]
[213Bi]BLCA-38 ACprostate cancerunknown glycoprotein [157]
[213Bi]PAI2 ACprostate cancerurokinase plasminogen activator [157]
[213Bi]7.16.4breast cancerHER-2/neu [160]
[213Bi]Mab 13Amurine breast cancerCD44 [161]
[90Y]Mab 13Amurine breast cancerCD44 [161]
[90Y]cetuximabhuman squamous cell carcinoma modelsepidermal growth factor receptorExternal radiation[162]
[90Y]C225Head and neck squamous cell carcinomaepidermal growth factor receptorExternal radiation[163]
[212Pb]mAb 376.96pancreatic ductal adenocarcinomaB7-H3 (CD276) [164]
Isotope half-life: [90Y]: 2.7 days, [131I]: 8 days, [125I]: 59.5 days, [177Lu]: 6.7 days, [212Pb]: 10.64 h, [213Bi]: 45.6 min, [211At]: 7.2 h, and [225Ac]: 10 days. [211At]MABG: meta-[211At]astatobenzylguanidine, [131I]MIGB: Meta-[131I]iodobenzylguanidine, [131I]MIP-1145: N-(2-diethylaminoethyl)-4-(4-fluoro-benzamido)-5-iodo-2-methoxy-benzamide, [125I]IUdR: 125I-deoxyuridine, [90Y]C225: [90Y]Y-CHX-A′′-DTPA-C225, [177Lu]LuDOTATATE: [177Lu]Lu-(Tyr3)octreotate, and [225Ac]DTPA: [225Ac]-diethylenetriaminepentaacetic acid, AG014699: Rucaparib.
Table 4. Selected examples for established radiotracers and radiotracers still in experimental research that have been used on 3D models of various tumor entities.
TracerTumor EntityApplicationReference
[18F]FDGpheochromocytoma, breast cancer, colorectal adenocarcinoma, colorectal carcinoma, glioblastoma, colon carcinomaGlucose turnover, viability, metabolic activity[24,165,172,177]
[18F]FMISOcolorectal adenocarcinoma, colorectal carcinoma, melanomaHypoxia[172,173,174]
[18F]OFEDpheochromocytomaLarge neutral amino-acid transporter[24]
[18F]FE@SUPPYcolorectal adenocarcinoma, colorectal carcinomaA3-Adenosine receptor[172]
[18F]3colorectal adenocarcinomaCyclooxygenase-2[173]
[18F]FLTbreast cancer, glioblastoma, colon carcinomaProliferation[165]
[18F]FAZAcolon adenocarcinoma, lung squamous cell carcinoma, lung adenocarcinomaHypoxia[171]
[68Ga]Ga-DOTATATEpheochromocytomaSomatostatin receptor 2/5[24]
[3H]Methioninerectal adenocarcinomaProtein synthesis[178]
[3H]Thymidinerectal adenocarcinomaProliferation[178]
[14C]FDGrectal adenocarcinomaGlucose turnover, viability, metabolic activity[178]
[11C]Methioninebreast cancer, glioblastoma, colon carcinomaProtein synthesis[165]
[11C]Cholinebreast cancer, glioblastoma, colon carcinomaMembrane lipid synthesis[165]
[64Cu]ATSMcolon adenocarcinoma, lung squamous cell carcinoma, lung adenocarcinomaHypoxia[171]
Isotope half-life: [3H]: 12.3 years, [14C]: 5730 years, [11C]: 20.3 min, [18F]: 109.8 min, [64Cu]: 12.7 h, and [68Ga]: 67.4 min. Abbreviation: [18F]FDG: 2-[18F]fluoro-2-deoxyglucose; [18F]FMISO: [18F]fluoromisonidazole; [18F]OFED: O-3-(2[18F]fluoroethoxy)-4-hydroxyphenylalanine; [18F]FE@SUPPY: 5-(2-[18F]fluoroethyl)2,4-diethyl-3-(ethylsulfanyl-carbonyl)-6-phenylpyridine-5-carboxylate; [18F]3: 3-(4-[18F]fluorophenyl)-2-(4-methylsulfonylphenyl)-1H-indole; [18F]FLT: 3′-deoxy-3′-[18F]fluorothymidine; [18F]FAZA: 1-(5-fluoro-5-deoxy-α-D-arabinofuranosyl)-2-nitroimidazole; [68Ga]GaDOTA-TATE: [68Ga]-1,4,7,10-tetraazacyclododecane-N,N′,N″,N‴-tetraaceticacid-D-Phe1,Tyr3-octreotate; and [64Cu]ATSM: [64Cu]copper-diacetyl-bis[N(4)-methylthiosemicarbazone].

