Relative Ratios Enhance the Diagnostic Power of Phospholipids in Distinguishing Benign and Cancerous Ovarian Masses

 , ,
, ,
Abstract
1. Introduction
2. Results
2.1. LC-MS Analysis of Lysophospholipids
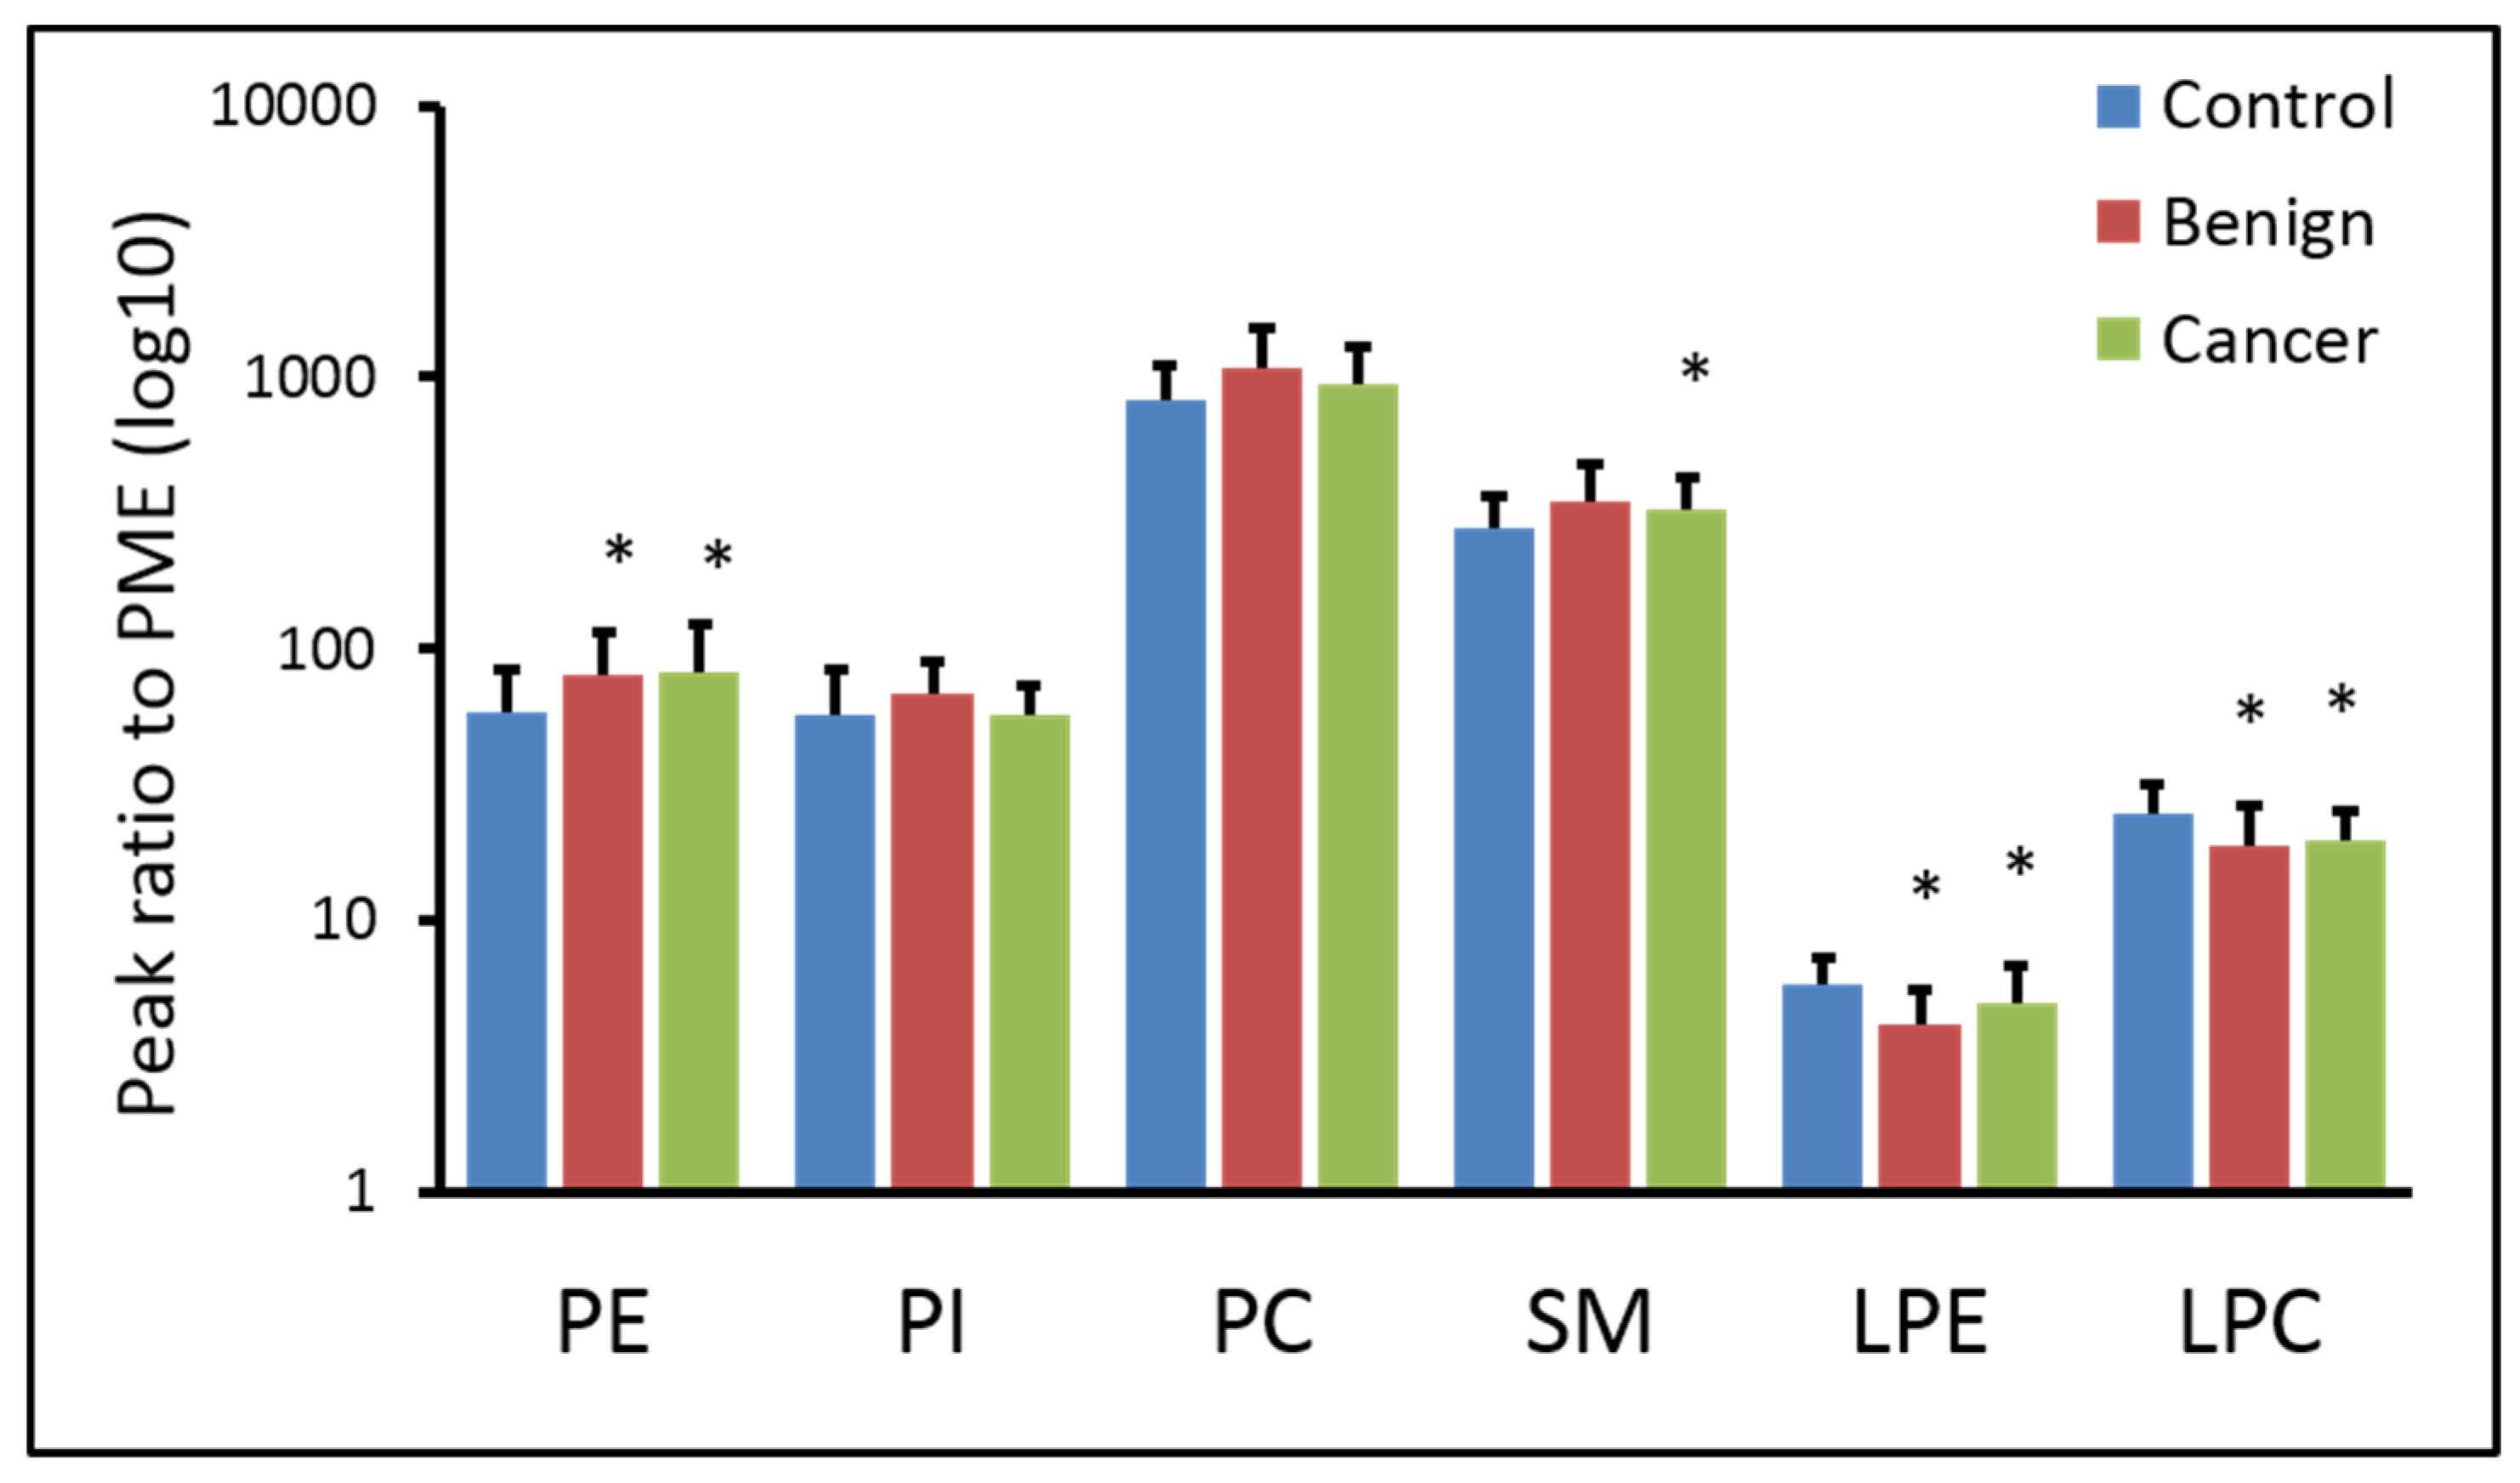
2.2. Phospholipids Content
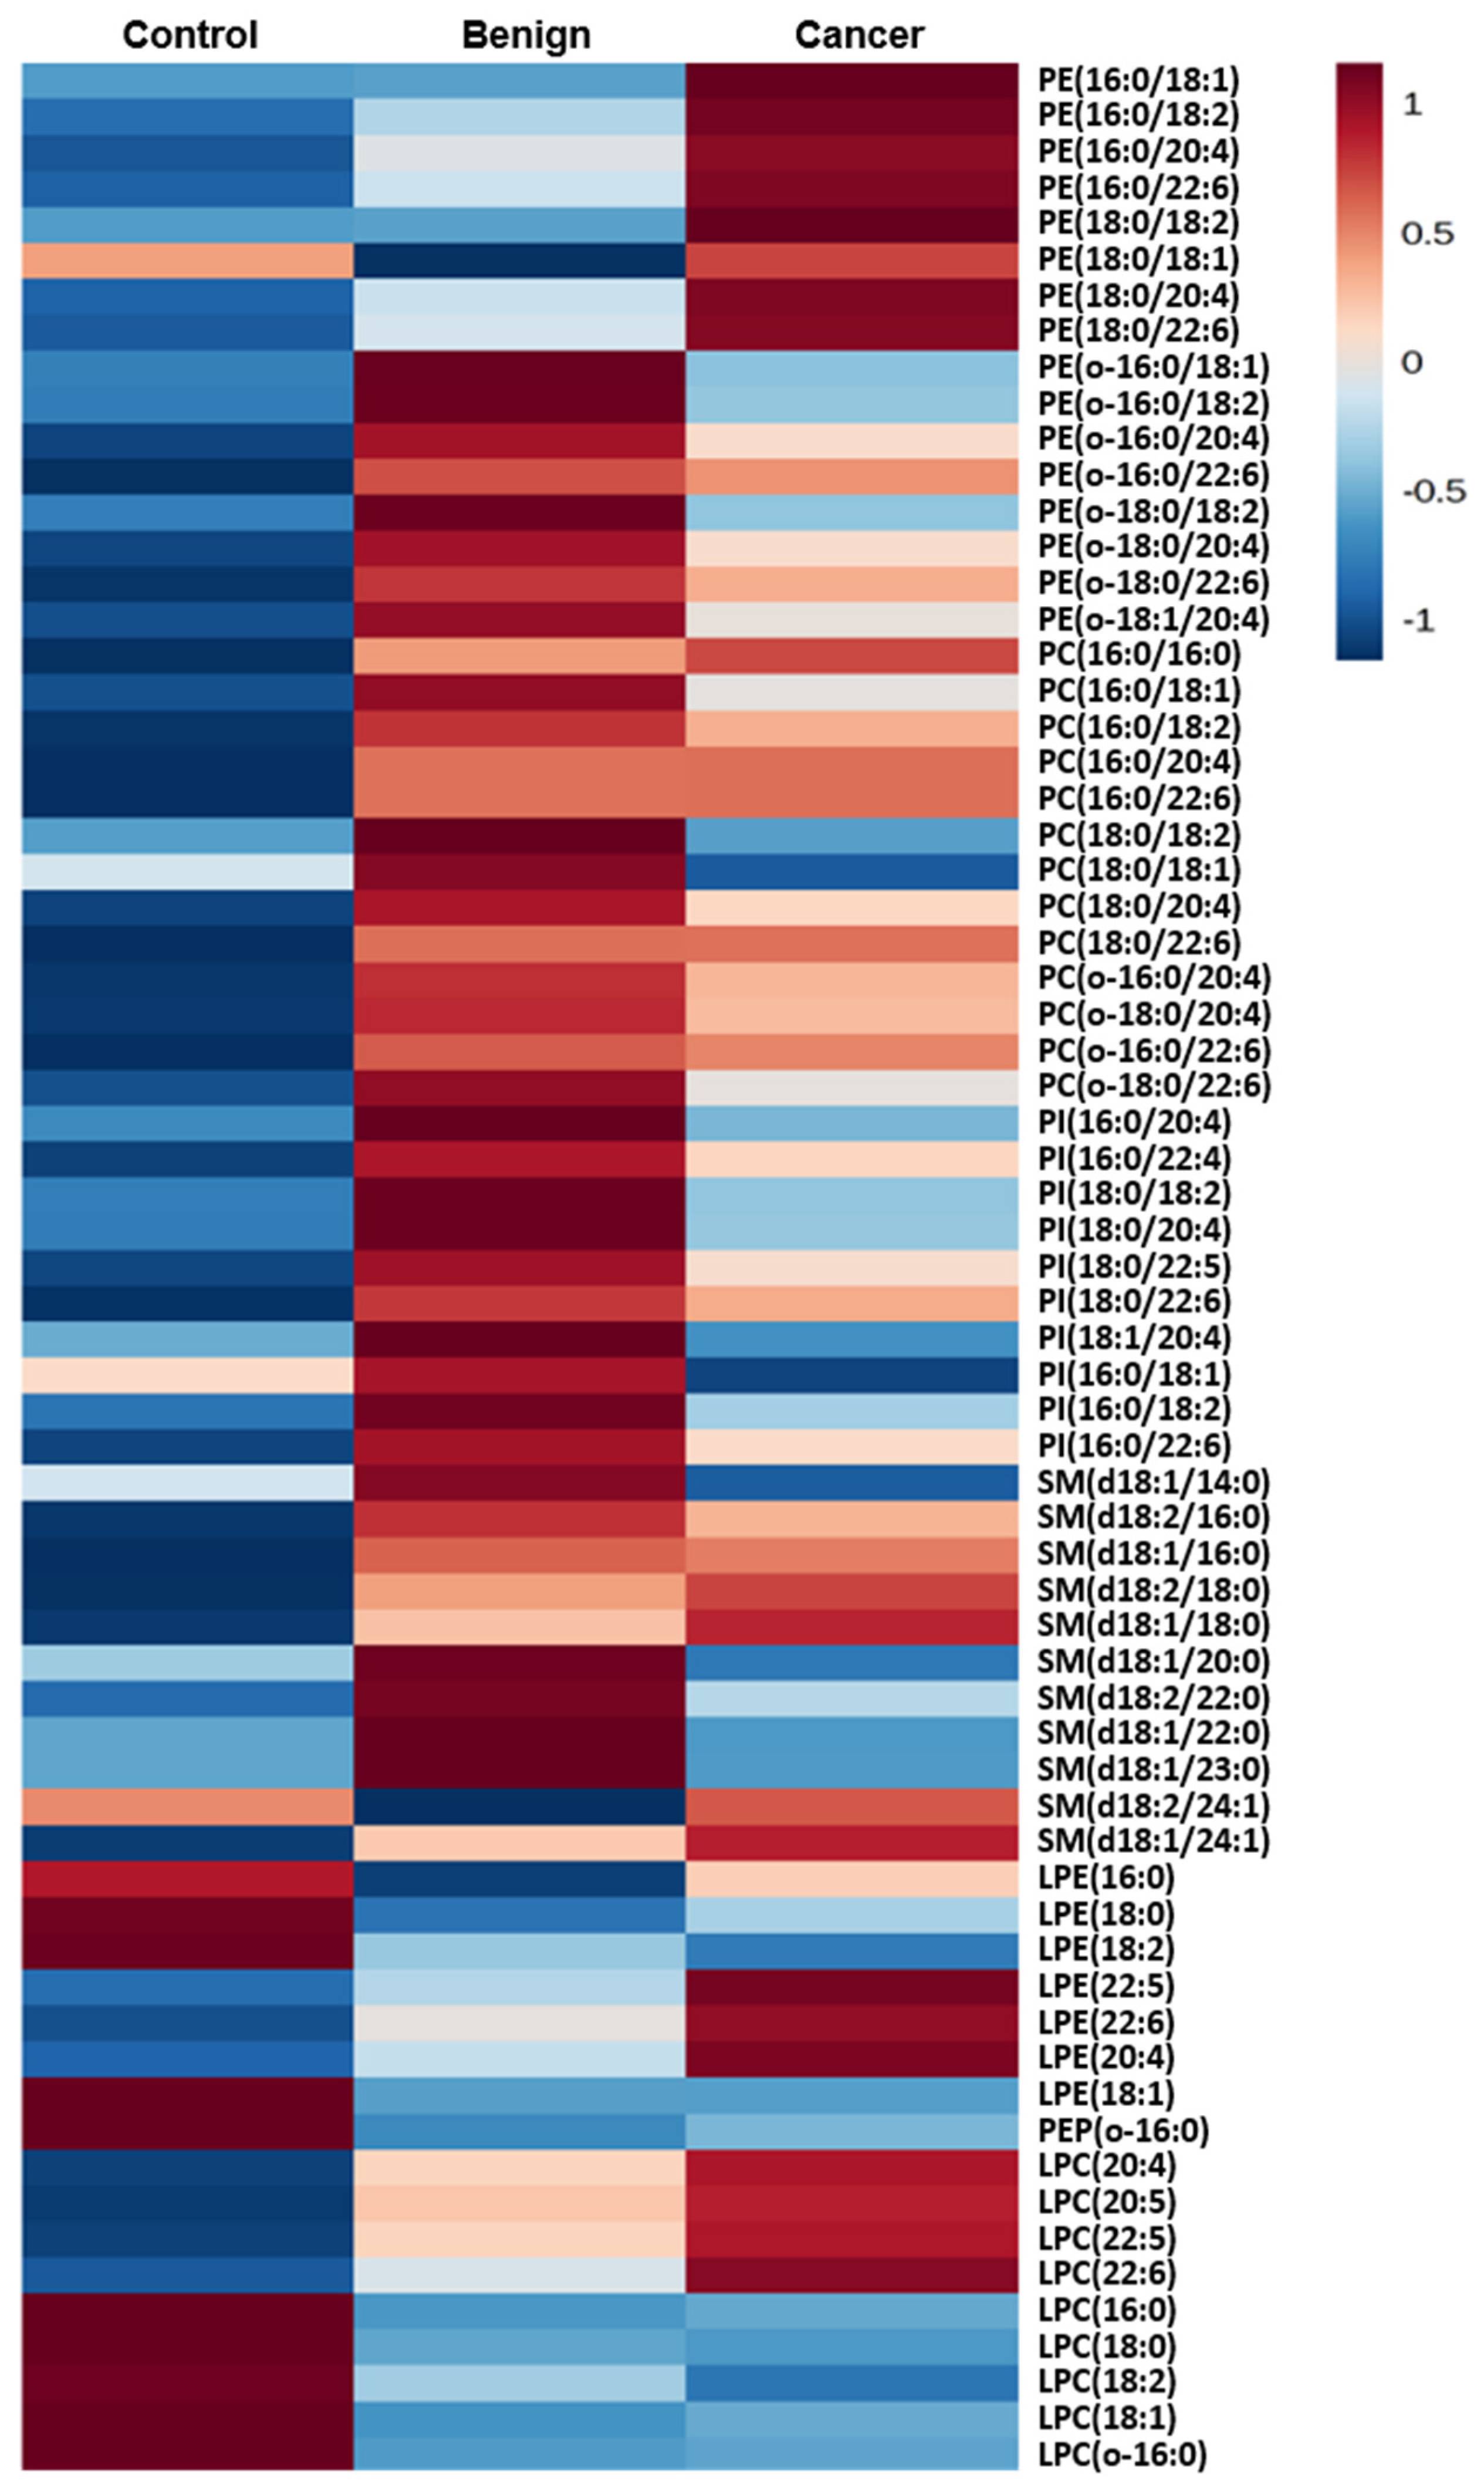
2.3. Normalization to Other Species Within a Class
2.4. No Changes in the Ratio Occur When the Sample Amount is Altered
3. Discussion
4. Materials and Methods
4.1. Materials and Reagents
4.2. Sample Collection and Processing
4.3. Extraction of Phospholipids
4.4. HPLC-MS Analysis
4.5. Data Analysis
4.6. Peak Normalization
4.7. Statistical Analysis
5. Conclusions
Supplementary Materials
Author Contributions
Funding
Conflicts of Interest
References
- De Angelis, R.; Sant, M.; Coleman, M.P.; Francisci, S.; Baili, P.; Pierannunzio, D.; Trama, A.; Visser, O.; Brenner, H.; Ardanaz, E.; et al. Cancer survival in europe 1999–2007 by country and age: Results of eurocare-5-a population-based study. Lancet. Oncol. 2014, 15, 23–34. [Google Scholar] [CrossRef]
- Santaballa, A.; Barretina, P.; Casado, A.; Garcia, Y.; Gonzalez-Martin, A.; Guerra, E.; Lainez, N.; Martinez, J.; Redondo, A.; Romero, I. Seom clinical guideline in ovarian cancer. Clin. Transl. Oncol. 2016, 18, 1206–1212. [Google Scholar] [CrossRef] [PubMed]
- Biggs, W.S.; Marks, S.T. Diagnosis and management of adnexal masses. Am. Fam. Phys. 2016, 93, 676–681. [Google Scholar]
- Schwartz, P.E.; Taylor, K.J. Is early detection of ovarian cancer possible? Ann. Med. 1995, 27, 519–528. [Google Scholar] [CrossRef]
- Montagnana, M.; Benati, M.; Danese, E. Circulating biomarkers in epithelial ovarian cancer diagnosis: From present to future perspective. Ann. Transl. Med. 2017, 5, 276. [Google Scholar] [CrossRef]
- Turkoglu, O.; Zeb, A.; Graham, S.; Szyperski, T.; Szender, J.B.; Odunsi, K.; Bahado-Singh, R. Metabolomics of biomarker discovery in ovarian cancer: A systematic review of the current literature. Metabolomics 2016, 12, 60. [Google Scholar] [CrossRef]
- Huang, D.; Gaul, D.A.; Nan, H.; Kim, J.; Fernandez, F.M. Deep metabolomics of a high-grade serous ovarian cancer triple-knockout mouse model. J. Proteome Res. 2019, 18, 3184–3194. [Google Scholar] [CrossRef]
- Breier, M.; Wahl, S.; Prehn, C.; Fugmann, M.; Ferrari, U.; Weise, M.; Banning, F.; Seissler, J.; Grallert, H.; Adamski, J.; et al. Targeted metabolomics identifies reliable and stable metabolites in human serum and plasma samples. PLoS ONE 2014, 9, e89728. [Google Scholar] [CrossRef]
- Zhang, Y.; Liu, Y.; Li, L.; Wei, J.; Xiong, S.; Zhao, Z. High resolution mass spectrometry coupled with multivariate data analysis revealing plasma lipidomic alteration in ovarian cancer in asian women. Talanta 2016, 150, 88–96. [Google Scholar] [CrossRef]
- Li, J.; Xie, H.; Li, A.; Cheng, J.; Yang, K.; Wang, J.; Wang, W.; Zhang, F.; Li, Z.; Dhillon, H.S.; et al. Distinct plasma lipids profiles of recurrent ovarian cancer by liquid chromatography-mass spectrometry. Oncotarget 2017, 8, 46834–46845. [Google Scholar] [CrossRef]
- Yang, W.; Mu, T.; Jiang, J.; Sun, Q.; Hou, X.; Sun, Y.; Zhong, L.; Wang, C.; Sun, C. Identification of potential biomarkers and metabolic profiling of serum in ovarian cancer patients using uplc/q-tof ms. Cell. Physiol. Biochem. 2018, 51, 1134–1148. [Google Scholar] [CrossRef] [PubMed]
- Buas, M.F.; Gu, H.; Djukovic, D.; Zhu, J.; Drescher, C.W.; Urban, N.; Raftery, D.; Li, C.I. Identification of novel candidate plasma metabolite biomarkers for distinguishing serous ovarian carcinoma and benign serous ovarian tumors. Gynecol. Oncol. 2016, 140, 138–144. [Google Scholar] [CrossRef] [PubMed]
- Yagi, T.; Shoaib, M.; Kuschner, C.; Nishikimi, M.; Becker, L.B.; Lee, A.T.; Kim, J. Challenges and inconsistencies in using lysophosphatidic acid as a biomarker for ovarian cancer. Cancers 2019, 11, 520. [Google Scholar] [CrossRef] [PubMed]
- Vance, J.E. Phosphatidylserine and phosphatidylethanolamine in mammalian cells: Two metabolically related aminophospholipids. J. Lipid Res. 2008, 49, 1377–1387. [Google Scholar] [CrossRef] [PubMed]
- van der Veen, J.N.; Kennelly, J.P.; Wan, S.; Vance, J.E.; Vance, D.E.; Jacobs, R.L. The critical role of phosphatidylcholine and phosphatidylethanolamine metabolism in health and disease. Biochim. Biophys. Acta Biomembr. 2017, 1859, 1558–1572. [Google Scholar] [CrossRef] [PubMed]
- Kim, J.; Yin, T.; Shinozaki, K.; Lampe, J.W.; Becker, L.B. Potential of lysophosphatidylinositol as a prognostic indicator of cardiac arrest using a rat model. Biomarkers 2017, 22, 755–763. [Google Scholar] [CrossRef]
- Bascoul-Colombo, C.; Guschina, I.A.; Maskrey, B.H.; Good, M.; O’Donnell, V.B.; Harwood, J.L. Dietary dha supplementation causes selective changes in phospholipids from different brain regions in both wild type mice and the tg2576 mouse model of alzheimer’s disease. Biochim. Biophys. Acta 2016, 1861, 524–537. [Google Scholar] [CrossRef]
- Kim, J.; Hoppel, C.L. Comprehensive approach to the quantitative analysis of mitochondrial phospholipids by hplc-ms. J. Chromatogr. B Anal. Technol. Biomed. Life Sci. 2013, 912, 105–114. [Google Scholar] [CrossRef]
- Otoki, Y.; Kato, S.; Kimura, F.; Furukawa, K.; Yamashita, S.; Arai, H.; Miyazawa, T.; Nakagawa, K. Accurate quantitation of choline and ethanolamine plasmalogen molecular species in human plasma by liquid chromatography-tandem mass spectrometry. J. Pharm. Biomed. Anal. 2017, 134, 77–85. [Google Scholar] [CrossRef]
- Tokuyama, W.; Hashimoto, T.; Li, Y.X.; Okuno, H.; Miyashita, Y. Quantification of neurotrophin-3 mrna in the rat hippocampal subregions using the rt-pcr-based coamplification method. Brain Res. Brain Res. Protoc. 1999, 4, 407–414. [Google Scholar] [CrossRef]
- Petricoin, E.F.; Ardekani, A.M.; Hitt, B.A.; Levine, P.J.; Fusaro, V.A.; Steinberg, S.M.; Mills, G.B.; Simone, C.; Fishman, D.A.; Kohn, E.C.; et al. Use of proteomic patterns in serum to identify ovarian cancer. Lancet 2002, 359, 572–577. [Google Scholar] [CrossRef]
- Ye, B.; Cramer, D.W.; Skates, S.J.; Gygi, S.P.; Pratomo, V.; Fu, L.; Horick, N.K.; Licklider, L.J.; Schorge, J.O.; Berkowitz, R.S.; et al. Haptoglobin-alpha subunit as potential serum biomarker in ovarian cancer: Identification and characterization using proteomic profiling and mass spectrometry. Clin. Cancer Res. 2003, 9, 2904–2911. [Google Scholar] [PubMed]
- Jackson, D.; Craven, R.A.; Hutson, R.C.; Graze, I.; Lueth, P.; Tonge, R.P.; Hartley, J.L.; Nickson, J.A.; Rayner, S.J.; Johnston, C.; et al. Proteomic profiling identifies afamin as a potential biomarker for ovarian cancer. Clin. Cancer Res. 2007, 13, 7370–7379. [Google Scholar] [CrossRef] [PubMed]
- Ye, B.; Skates, S.; Mok, S.C.; Horick, N.K.; Rosenberg, H.F.; Vitonis, A.; Edwards, D.; Sluss, P.; Han, W.K.; Berkowitz, R.S.; et al. Proteomic-based discovery and characterization of glycosylated eosinophil-derived neurotoxin and cooh-terminal osteopontin fragments for ovarian cancer in urine. Clin. Cancer Res. 2006, 12, 432–441. [Google Scholar] [CrossRef] [PubMed]
- Terry, K.L.; Schock, H.; Fortner, R.T.; Husing, A.; Fichorova, R.N.; Yamamoto, H.S.; Vitonis, A.F.; Johnson, T.; Overvad, K.; Tjonneland, A.; et al. A prospective evaluation of early detection biomarkers for ovarian cancer in the european epic cohort. Clin. Cancer Res. Off. J. Am. Assoc. Cancer Res. 2016, 22, 4664–4675. [Google Scholar] [CrossRef]
- Sampson, J.N.; Boca, S.M.; Shu, X.O.; Stolzenberg-Solomon, R.Z.; Matthews, C.E.; Hsing, A.W.; Tan, Y.T.; Ji, B.T.; Chow, W.H.; Cai, Q.; et al. Metabolomics in epidemiology: Sources of variability in metabolite measurements and implications. Cancer Epidemiol. Biomarker. Prev. 2013, 22, 631–640. [Google Scholar] [CrossRef]
- Nedelkov, D.; Kiernan, U.A.; Niederkofler, E.E.; Tubbs, K.A.; Nelson, R.W. Investigating diversity in human plasma proteins. Proc. Natl. Acad. Sci. USA 2005, 102, 10852–10857. [Google Scholar] [CrossRef]
- Wu, Y.; Li, L. Sample normalization methods in quantitative metabolomics. J. Chromatogr. A 2016, 1430, 80–95. [Google Scholar] [CrossRef]
- Zhao, Z.; Xu, Y. An extremely simple method for extraction of lysophospholipids and phospholipids from blood samples. J. Lipid Res. 2010, 51, 652–659. [Google Scholar] [CrossRef]
- Choi, J.; Yin, T.; Shinozaki, K.; Lampe, J.W.; Stevens, J.F.; Becker, L.B.; Kim, J. Comprehensive analysis of phospholipids in the brain, heart, kidney, and liver: Brain phospholipids are least enriched with polyunsaturated fatty acids. Mol. Cell. Biochem. 2018, 442, 187–201. [Google Scholar] [CrossRef]
- Kim, J.; Lampe, J.W.; Yin, T.; Shinozaki, K.; Becker, L.B. Phospholipid alterations in the brain and heart in a rat model of asphyxia-induced cardiac arrest and cardiopulmonary bypass resuscitation. Mol. Cell. Biochem. 2015, 408, 273–281. [Google Scholar] [CrossRef] [PubMed]
- Chong, J.; Soufan, O.; Li, C.; Caraus, I.; Li, S.; Bourque, G.; Wishart, D.S.; Xia, J. Metaboanalyst 4.0: Towards more transparent and integrative metabolomics analysis. Nucleic Acids Res. 2018, 46, W486–W494. [Google Scholar] [CrossRef] [PubMed]


| Control vs. Benign | Control vs. Cancer | Benign vs. Cancer | ||||||
|---|---|---|---|---|---|---|---|---|
| Species | Ben/Con | p | Species | Can/Con | p | Species | Can/Ben | p |
| LPE (o-16:0) | 0.368 | <0.001 | PE (16:0/22:6) | 3.155 | <0.001 | PI (18:1/20:4) | 0.718 | 0.014 |
| PE1 (6:0/22:6) | 1.832 | <0.001 | PE (18:0/22:6) | 2.606 | <0.001 | PE (16:0/18:1) | 1.544 | 0.016 |
| PI (18:0/22:6) | 1.889 | 0.001 | LPE (22:6) | 1.822 | <0.001 | PI (18:0/20:4) | 0.787 | 0.040 |
| PE (16:0/22:6) | 1.774 | 0.001 | LPC (22:6) | 2.276 | <0.001 | PI (16:0/18:1) | 0.693 | 0.042 |
| LPC (18:0) | 0.661 | 0.001 | PC (18:0/22:6) | 1.754 | <0.001 | LPC (22:6) | 1.460 | 0.055 |
| PC (16:0/22:6) | 1.779 | 0.001 | PC (16:0/22:6) | 1.779 | <0.001 | SM (d18:1/14:0) | 0.724 | 0.055 |
| LPE (18:1) | 0.621 | 0.001 | LPE (18:2) | 0.648 | 0.001 | PI (16:0/20:4) | 0.746 | 0.055 |
| PE (o-18:0/22:6) | 1.889 | 0.001 | LPE (18:1) | 0.618 | 0.001 | SM (d18:1/23:0) | 0.835 | 0.066 |
| Control vs. Benign | Control vs. Cancer | Benign vs. Cancer | ||||||
|---|---|---|---|---|---|---|---|---|
| Species | Ben/Con | p | Species | Can/Con | p | Species | Can/Ben | p |
| LPE (20:4) | 1.551 | <0.001 | LPC (20:4) | 2.086 | <0.001 | SM (d18:1/24:1) | 1.196 | <0.001 |
| LPE (22:6) | 2.134 | <0.001 | PC (18:0/18:1) | 0.771 | <0.001 | SM (d18:1/22:0) | 0.873 | 0.001 |
| LPE (22:5) | 1.659 | <0.001 | LPE (22:6) | 2.168 | <0.001 | PC (18:0/18:1) | 0.888 | 0.002 |
| PC (18:0/20:4) | 1.321 | <0.001 | LPC (22:6) | 2.758 | <0.001 | SM (d18:1/14:0) | 0.790 | 0.002 |
| LPC (22:6) | 1.907 | <0.001 | LPC (18:0) | 0.811 | <0.001 | LPE (18:2) | 0.718 | 0.002 |
| PE (o-18:0/22:6) | 1.327 | <0.001 | LPC (22:5) | 2.330 | <0.001 | PE (16:0/18:1) | 1.434 | 0.006 |
| LPC (20:4) | 1.706 | <0.001 | SM (d18:1/24:1) | 1.261 | <0.001 | SM (d18:2/22:0) | 0.903 | 0.007 |
| PC (o-18:0/20:4) | 1.322 | <0.001 | SM(d18:1/20:0) | 0.819 | <0.001 | SM(d18:1/23:0) | 0.866 | 0.008 |
| PI (18:0/22:6) | 1.566 | 0.001 | PC (16:0/20:4) | 1.420 | <0.001 | PE (o-18:0/18:2) | 0.732 | 0.008 |
| PI (18:0/22:5) | 1.382 | 0.001 | PE (16:0/22:6) | 2.182 | <0.001 | SM(d18:1/16:0) | 1.050 | 0.010 |
| PE (o-16:0/22:6) | 1.302 | 0.001 | PC (o-18:0/20:4) | 1.353 | <0.001 | PE (o-16:0/18:1) | 0.780 | 0.013 |
| PC (18:0/22:6) | 1.382 | 0.002 | SM(d18:1/22:0) | 0.840 | <0.001 | LPC (22:6) | 1.446 | 0.014 |
| LPC (18:0) | 0.884 | 0.002 | PE (18:0/22:6) | 1.939 | <0.001 | SM (d18:1/20:0) | 0.880 | 0.016 |
| PE (18:0/18:1) | 0.633 | 0.002 | PI (18:0/22:6) | 1.684 | <0.001 | PE (o-16:0/18:2) | 0.725 | 0.020 |
| PC (16:0/20:4) | 1.233 | 0.002 | LPE (20:4) | 1.370 | <0.001 | PE (16:0/22:6) | 1.467 | 0.023 |
| PC (18:0/18:1) | 0.868 | 0.002 | LPE (22:5) | 1.589 | <0.001 | PC (16:0/16:0) | 1.150 | 0.030 |
| PE (16:0/22:6) | 1.487 | 0.003 | SM (d18:1/23:0) | 0.853 | <0.001 | LPC (18:0) | 0.917 | 0.033 |
| PI (18:0/20:4) | 1.178 | 0.003 | PC (16:0/22:6) | 1.602 | <0.001 | PC (16:0/20:4) | 1.151 | 0.035 |
| LPC (22:5) | 1.823 | 0.003 | SM (d18:1/14:0) | 0.764 | <0.001 | PE (o-16:0/22:6) | 0.933 | 0.035 |
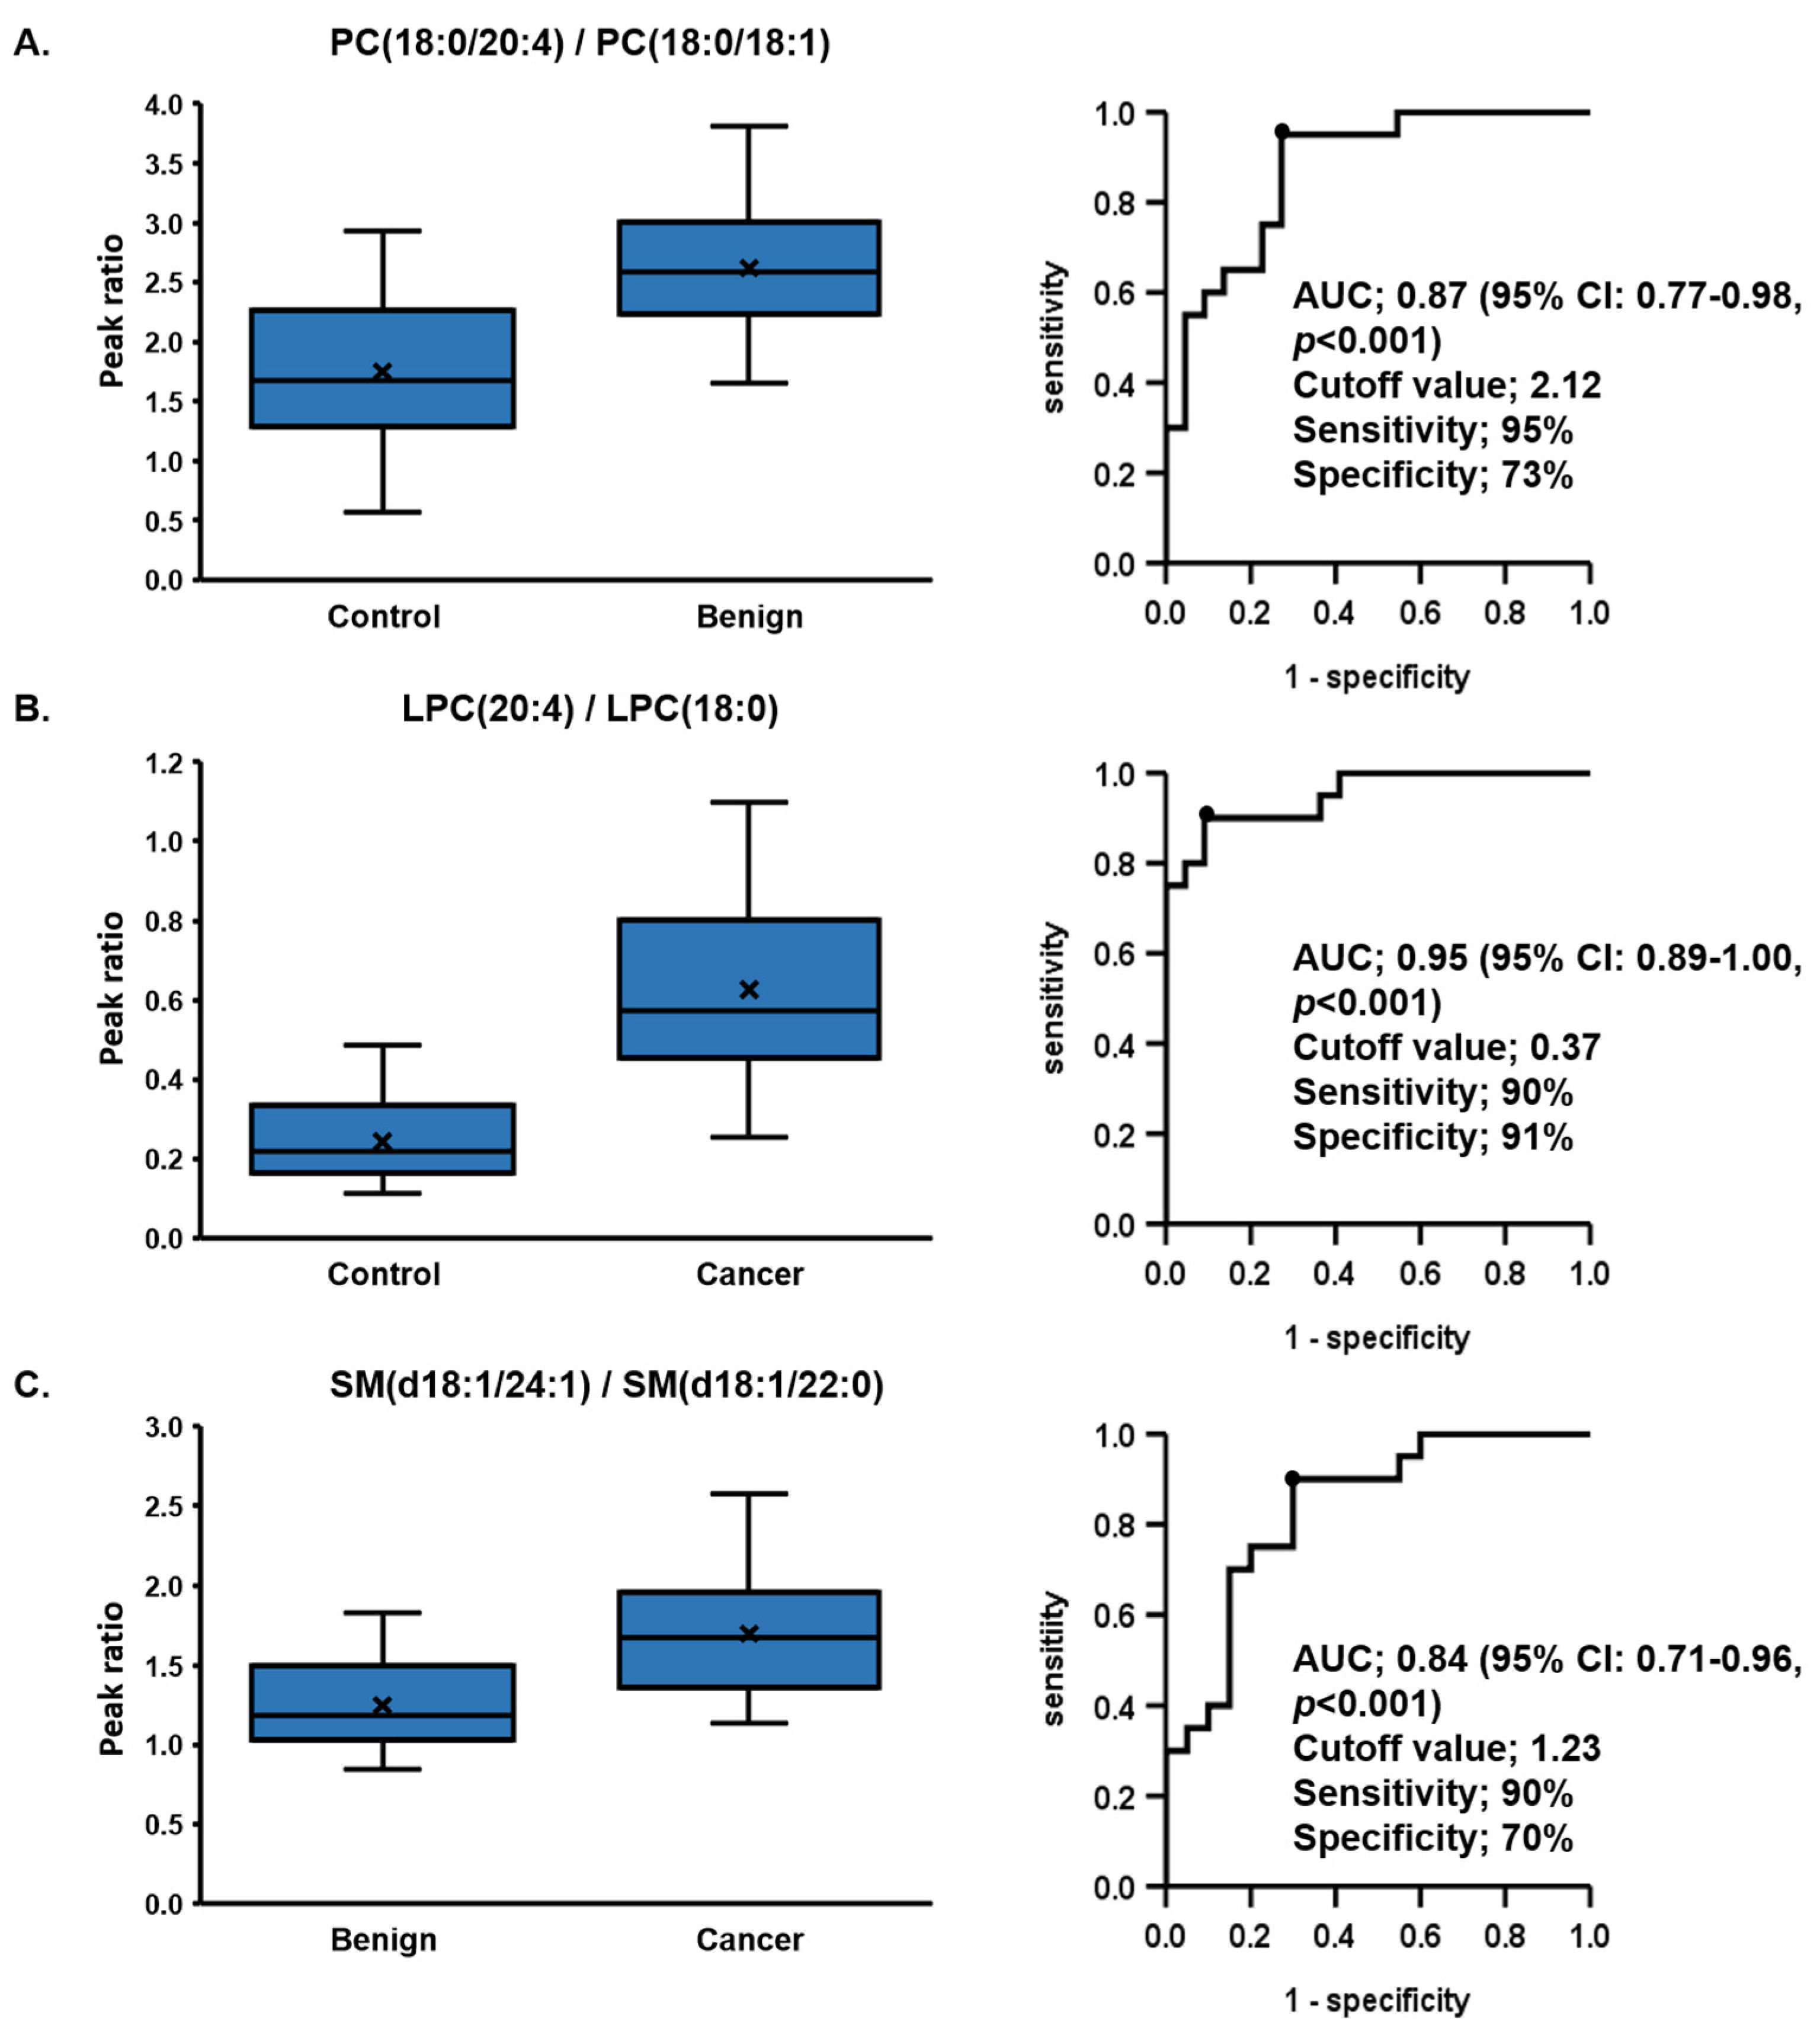
| (a) Control vs. Benign | PC (18:0/20:4)/PC (18:0/18:1) | LPE (22:6)/LPE (o-16:0) | LPC (22:6)/LPC (18:0) | LPC (20:4)/LPC (18:0) | PC (18:0/22:6)/PC (18:0/18:1) |
| AUC | 0.87 | 0.86 | 0.85 | 0.84 | 0.83 |
| p value | <0.001 | <0.001 | <0.001 | <0.001 | <0.001 |
| 95%CI | 0.77–0.98 | 0.74–0.97 | 0.72–0.97 | 0.72–0.96 | 0.71–0.96 |
| Sensitivity (%) | 95 | 100 | 80 | 65 | 90 |
| Specificity (%) | 73 | 64 | 86 | 91 | 68 |
| Cutoff Value | 2.12 | 3.9 | 0.07 | 0.37 | 0.35 |
| (b) Control vs. Cancer | LPC (20:4)/LPC (18:0) | LPC (22:6)/LPC (18:0) | LPC (20:4)/LPC (16:0) | LPC (22:6)/LPC (o-16:0) | SM (d18:1/24:1)/SM (d18:1/22:0) |
| AUC | 0.95 | 0.94 | 0.94 | 0.92 | 0.92 |
| p value | <0.001 | <0.001 | <0.001 | <0.001 | <0.001 |
| 95%CI | 0.89–1.00 | 0.88–1.00 | 0.87–1.00 | 0.84–1.00 | 0.83–1.00 |
| Sensitivity (%) | 90 | 95 | 80 | 95 | 100 |
| Specificity (%) | 91 | 82 | 96 | 82 | 73 |
| Cutoff Value | 0.37 | 0.07 | 0.14 | 4 | 1.13 |
| (c) Benign vs. Cancer | SM (d18:1/24:1)/SM (d18:1/22:0) | SM (d18:1/16:0)/SM (d18:1/22:0) | SM (d18:1/16:0)/SM (d18:1/14:0) | SM (d18:1/24:1)/SM (d18:1/14:0) | PE (16:0/18:1)/PE (o-18:0/18:2) |
| AUC | 0.84 | 0.82 | 0.82 | 0.81 | 0.77 |
| p value | <0.001 | <0.001 | 0.001 | 0.001 | 0.003 |
| 95%CI | 0.71–0.96 | 0.70–0.95 | 0.68–0.96 | 0.66–0.95 | 0.62–0.92 |
| Sensitivity (%) | 90 | 90 | 80 | 80 | 55 |
| Specificity (%) | 70 | 65 | 80 | 85 | 100 |
| Cutoff Value | 1.23 | 2.41 | 11.3 | 6.24 | 0.47 |
© 2019 by the authors. Licensee MDPI, Basel, Switzerland. This article is an open access article distributed under the terms and conditions of the Creative Commons Attribution (CC BY) license (http://creativecommons.org/licenses/by/4.0/).
Share and Cite
Yagi, T.; Kuschner, C.E.; Shoaib, M.; Choudhary, R.C.; Becker, L.B.; Lee, A.T.; Kim, J. Relative Ratios Enhance the Diagnostic Power of Phospholipids in Distinguishing Benign and Cancerous Ovarian Masses. Cancers 2020, 12, 72. https://doi.org/10.3390/cancers12010072
Yagi T, Kuschner CE, Shoaib M, Choudhary RC, Becker LB, Lee AT, Kim J. Relative Ratios Enhance the Diagnostic Power of Phospholipids in Distinguishing Benign and Cancerous Ovarian Masses. Cancers. 2020; 12(1):72. https://doi.org/10.3390/cancers12010072
Chicago/Turabian StyleYagi, Tsukasa, Cyrus E. Kuschner, Muhammad Shoaib, Rishabh C. Choudhary, Lance B. Becker, Annette T. Lee, and Junhwan Kim. 2020. "Relative Ratios Enhance the Diagnostic Power of Phospholipids in Distinguishing Benign and Cancerous Ovarian Masses" Cancers 12, no. 1: 72. https://doi.org/10.3390/cancers12010072
APA StyleYagi, T., Kuschner, C. E., Shoaib, M., Choudhary, R. C., Becker, L. B., Lee, A. T., & Kim, J. (2020). Relative Ratios Enhance the Diagnostic Power of Phospholipids in Distinguishing Benign and Cancerous Ovarian Masses. Cancers, 12(1), 72. https://doi.org/10.3390/cancers12010072