Differential Expression of DNA Repair Genes in Prognostically-Favorable versus Unfavorable Uveal Melanoma

 ,
,  ,
,
Abstract
1. Introduction
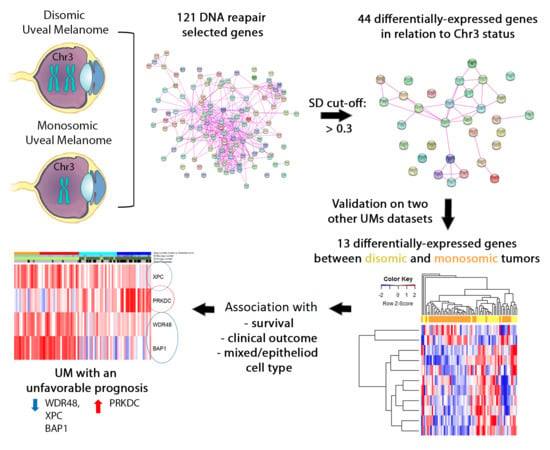
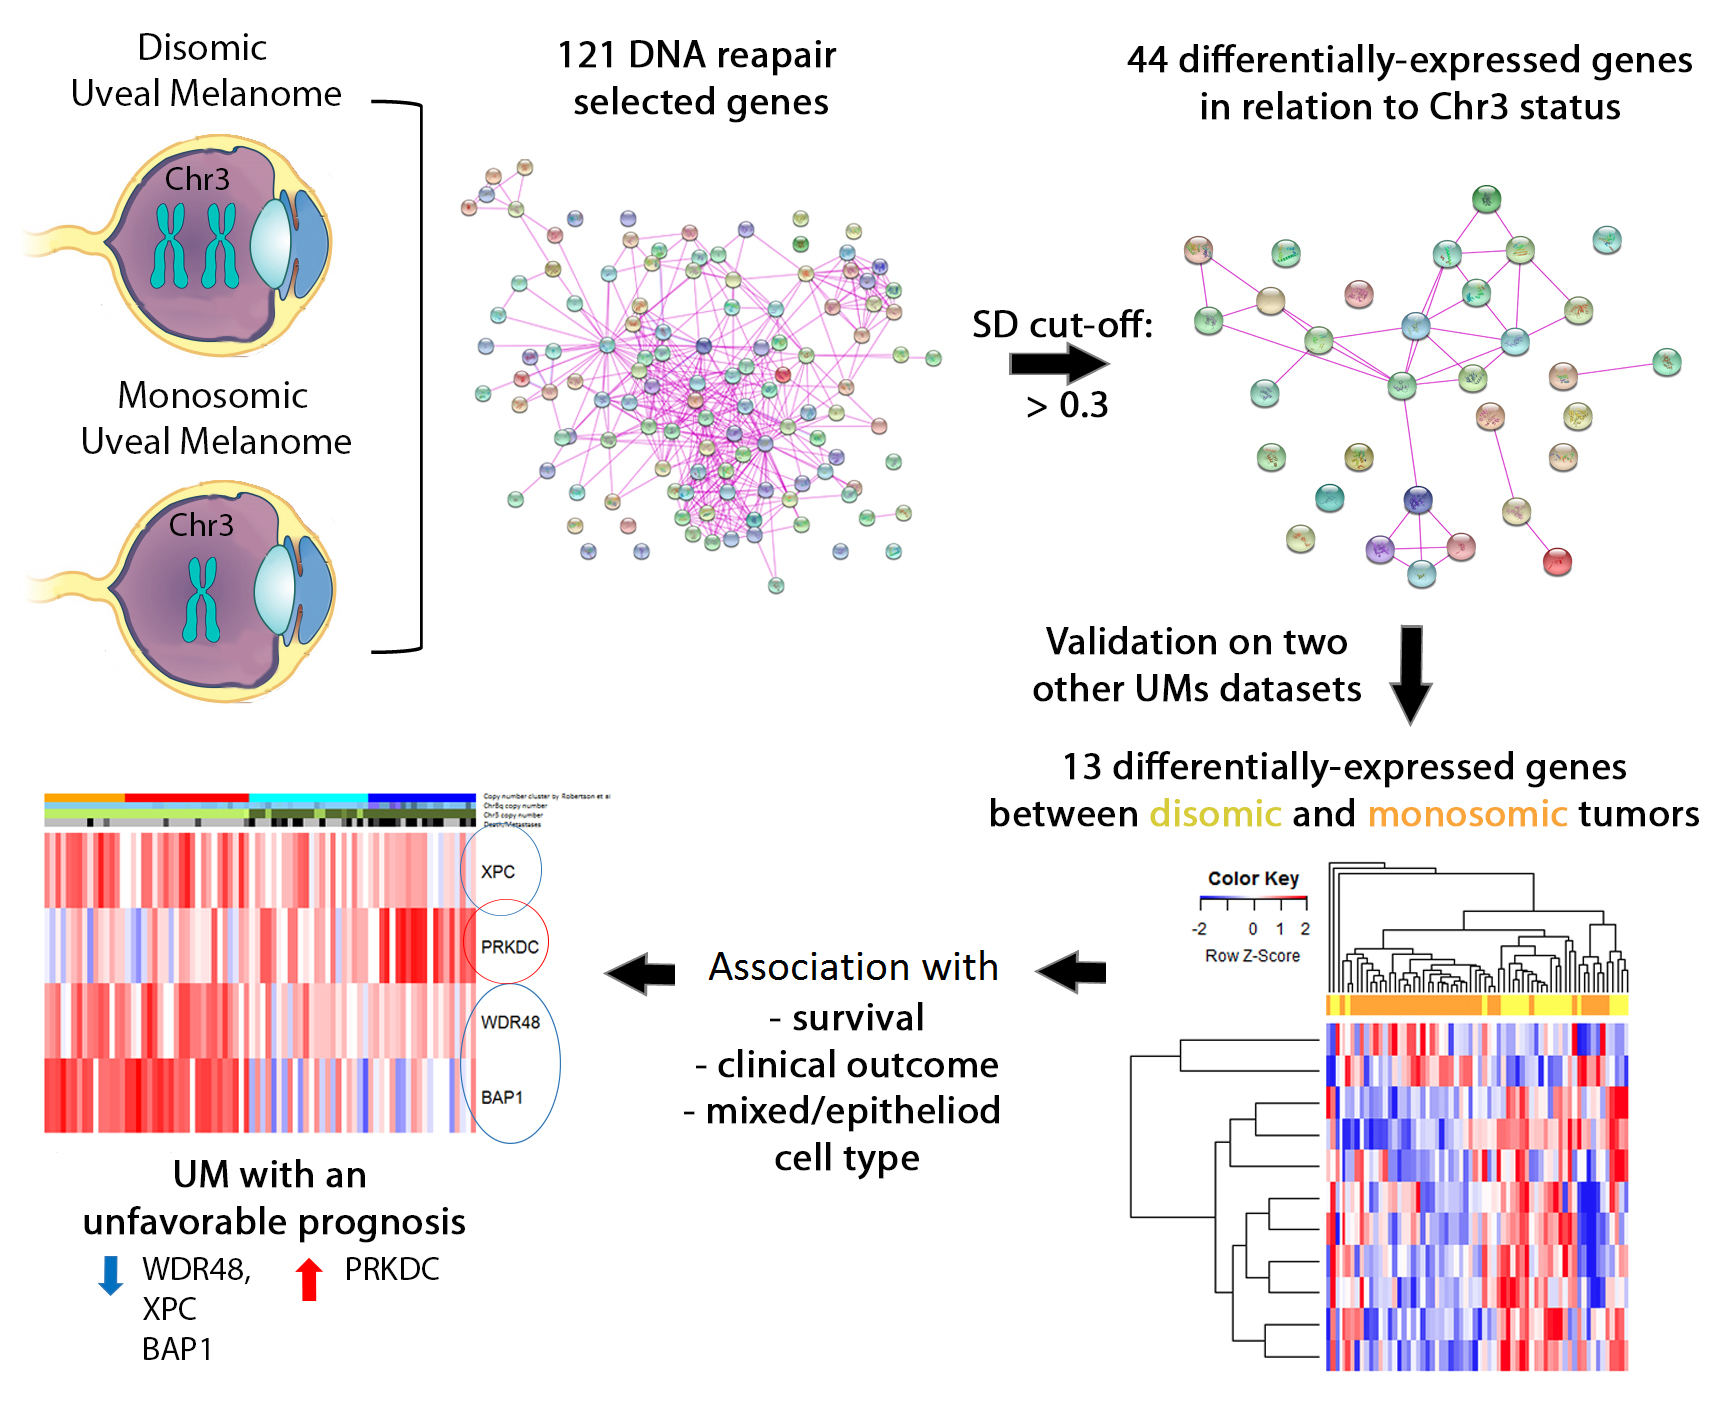
2. Results
2.1. Population Characteristics
2.2. Gene Expression in Relation to Chromosome 3 Status
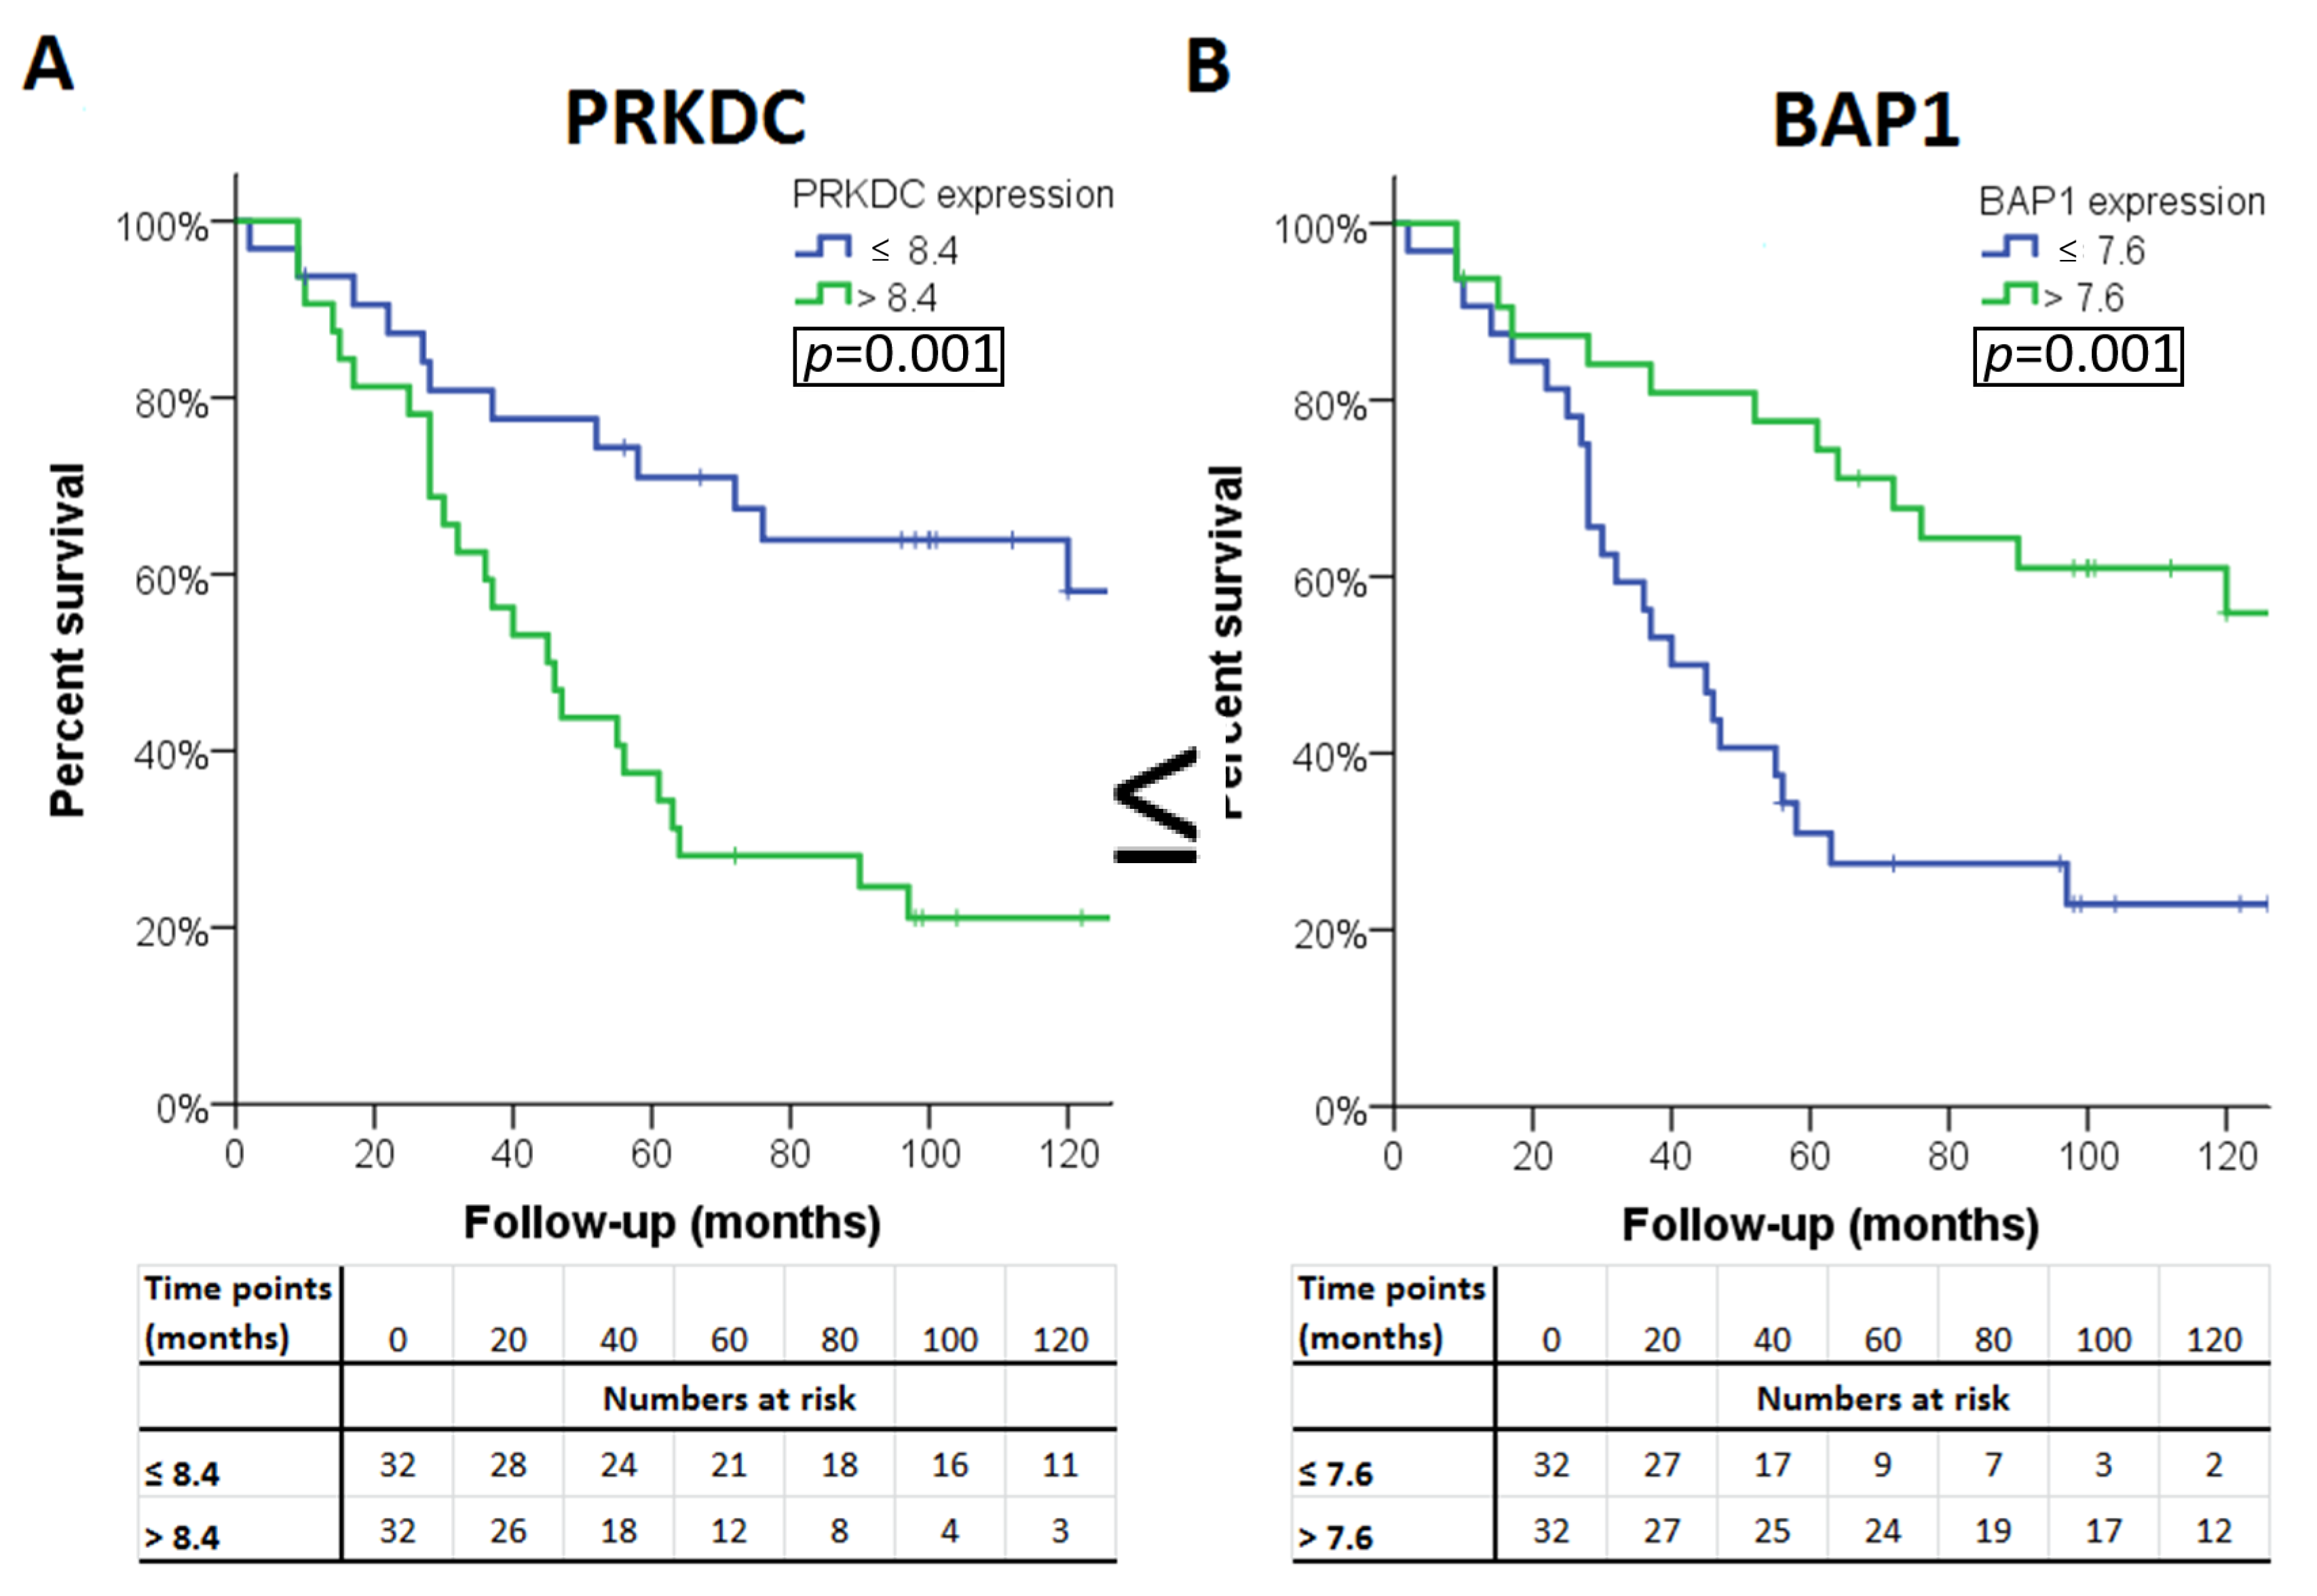
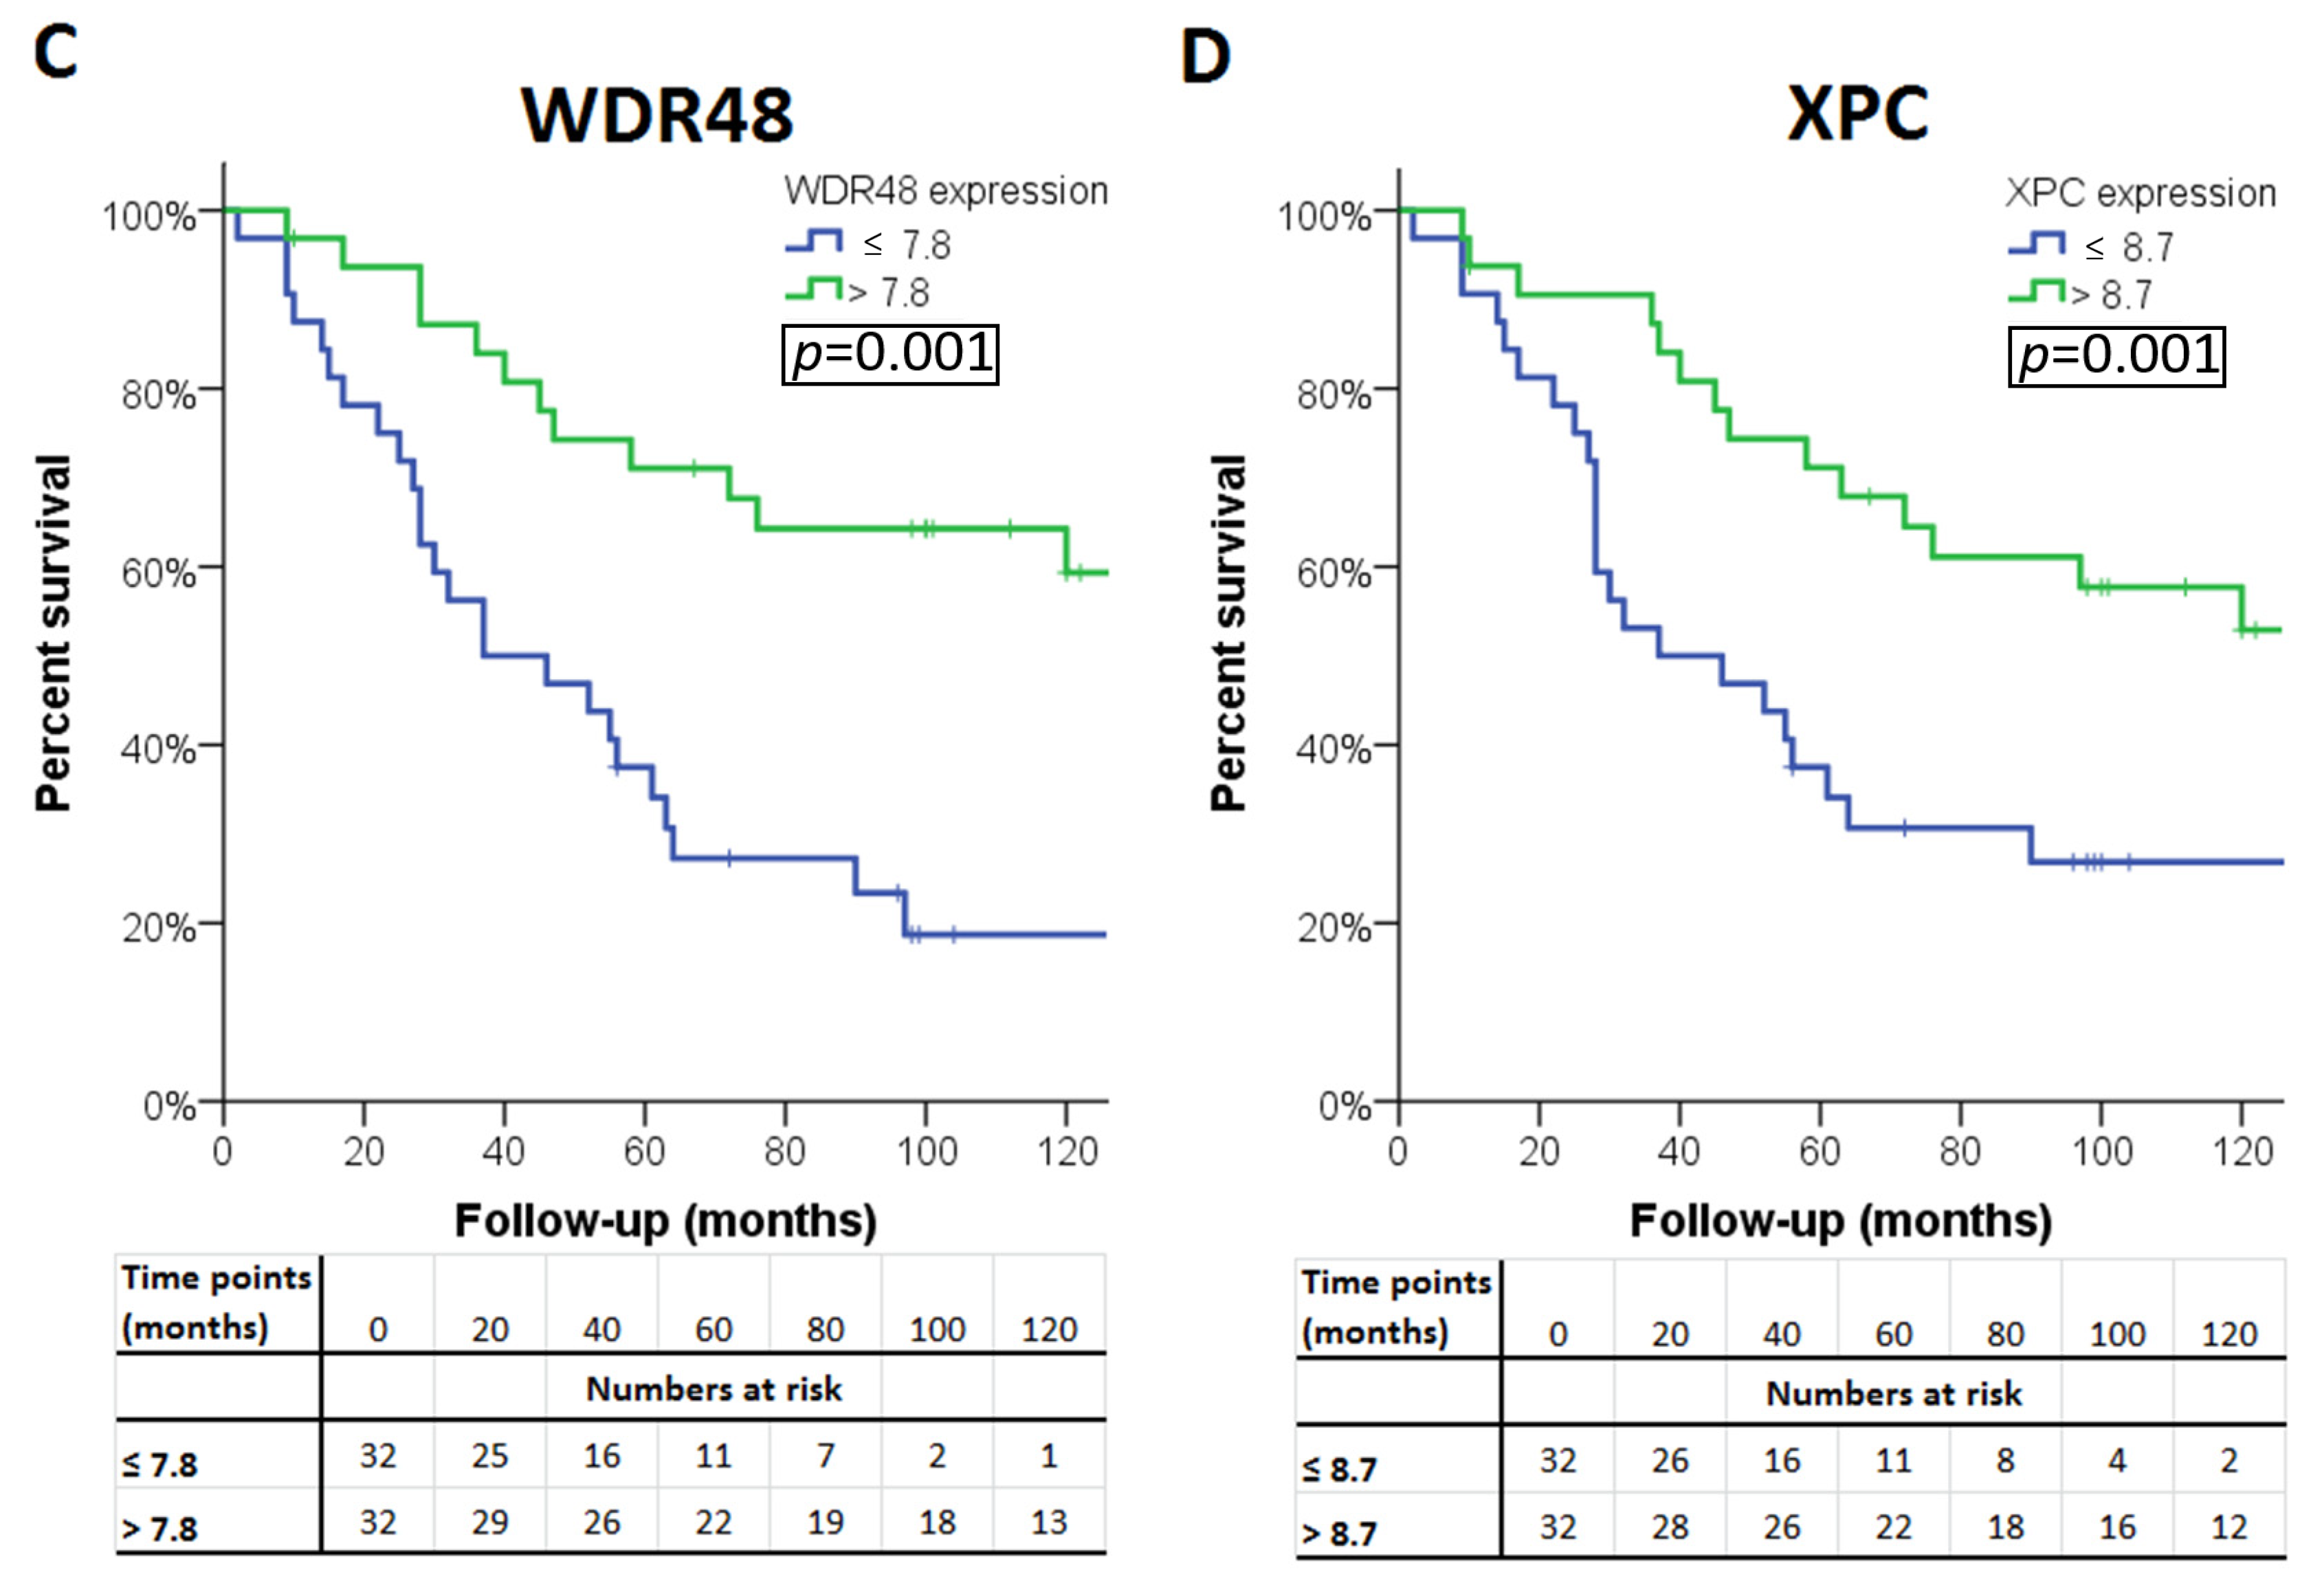
2.3. Gene Expression in Relation to Histological Data and Survival
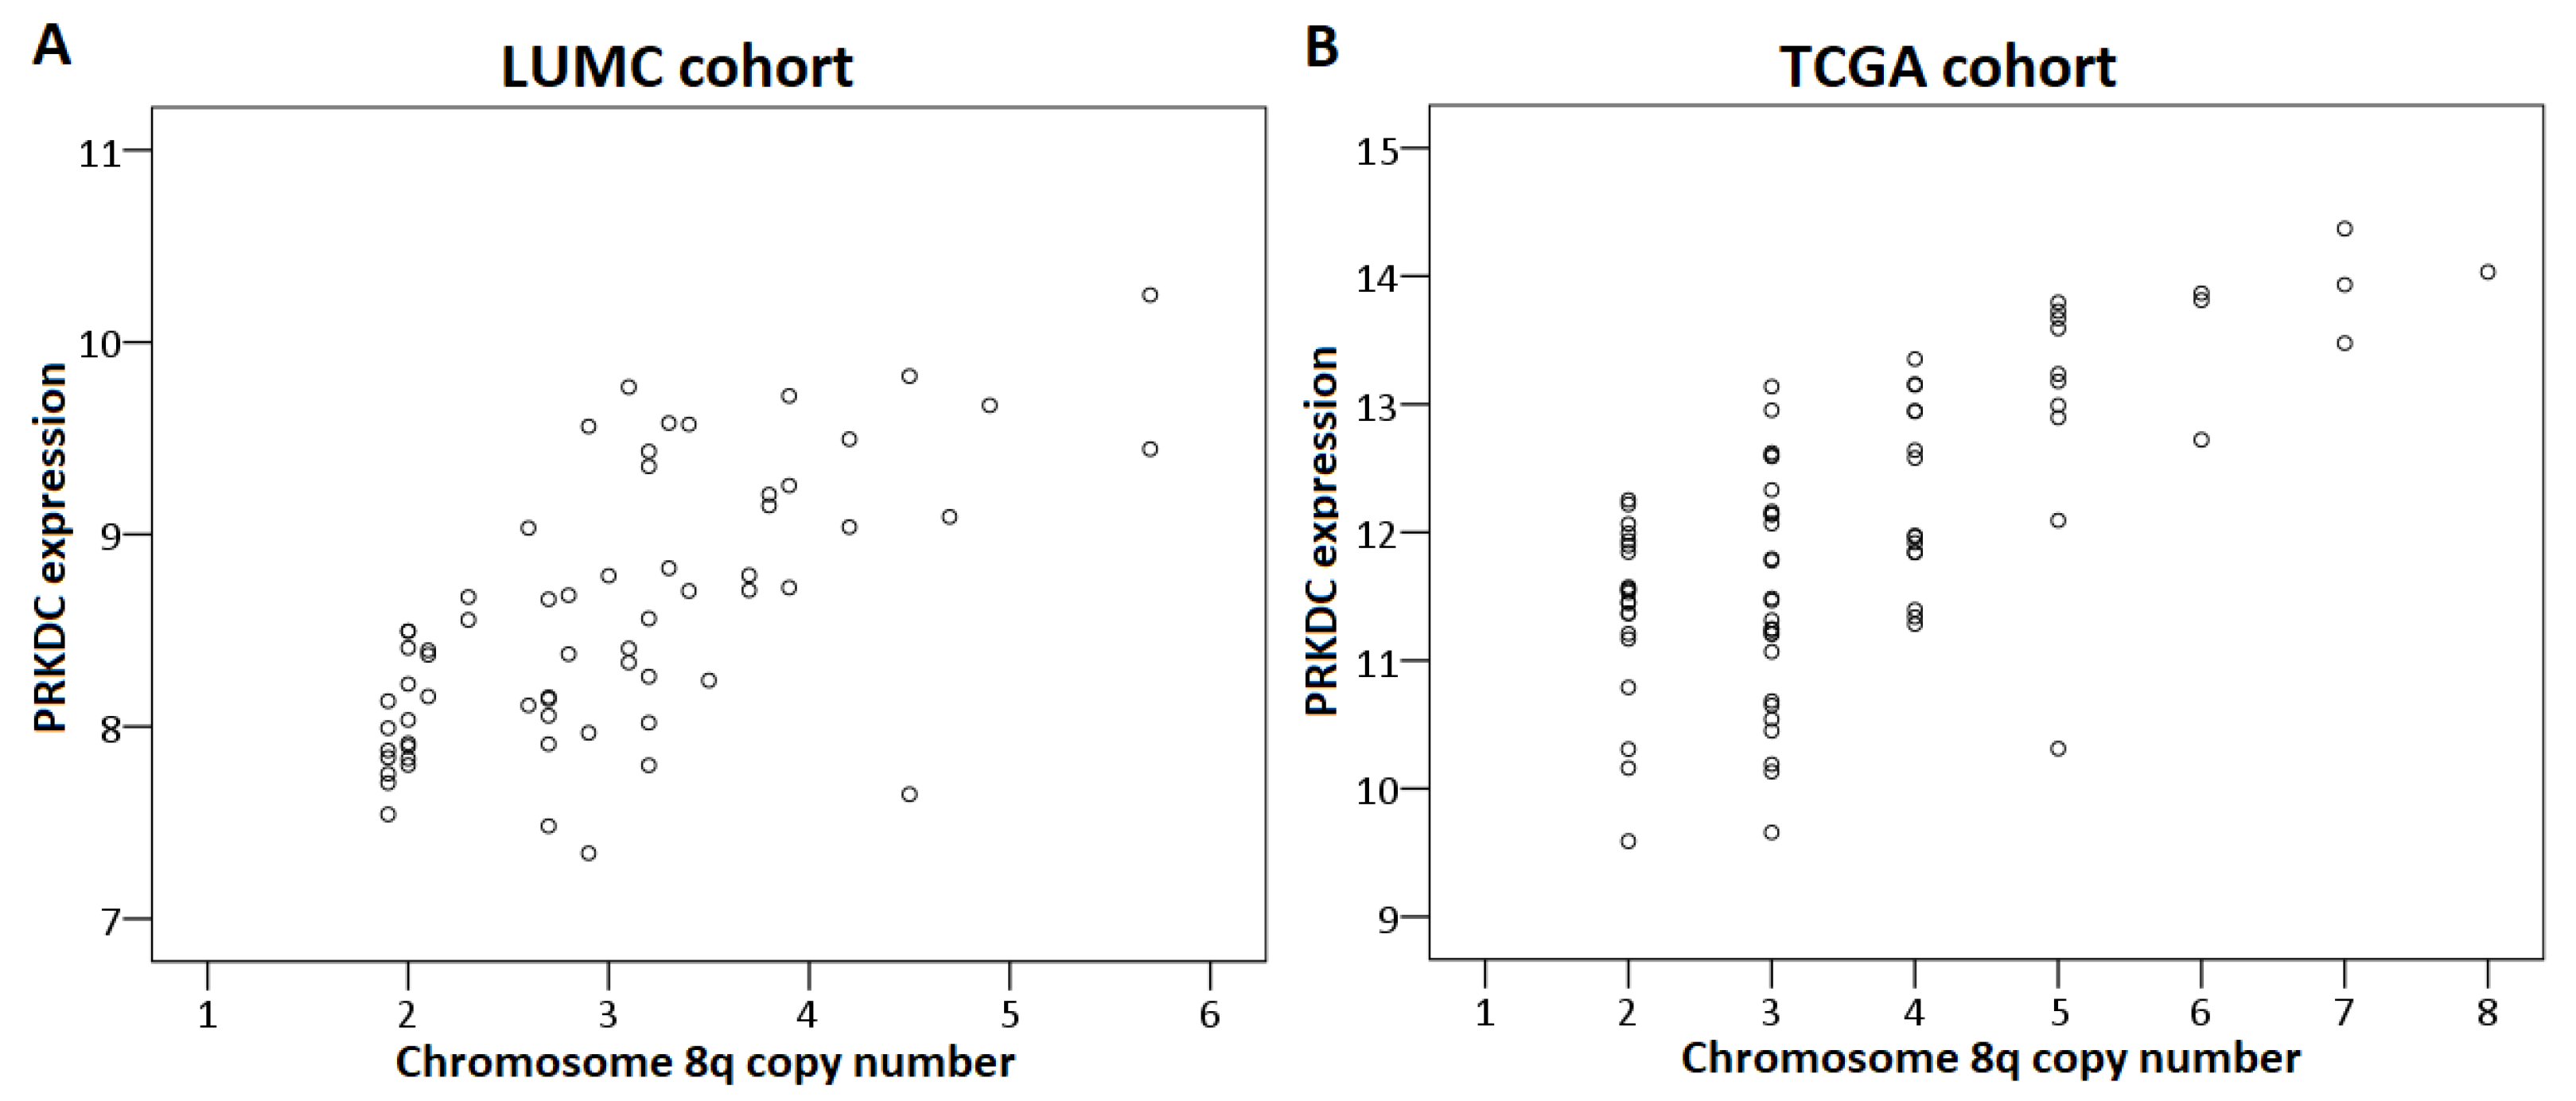
2.4. Chromosome Dose Effect and Expression Levels
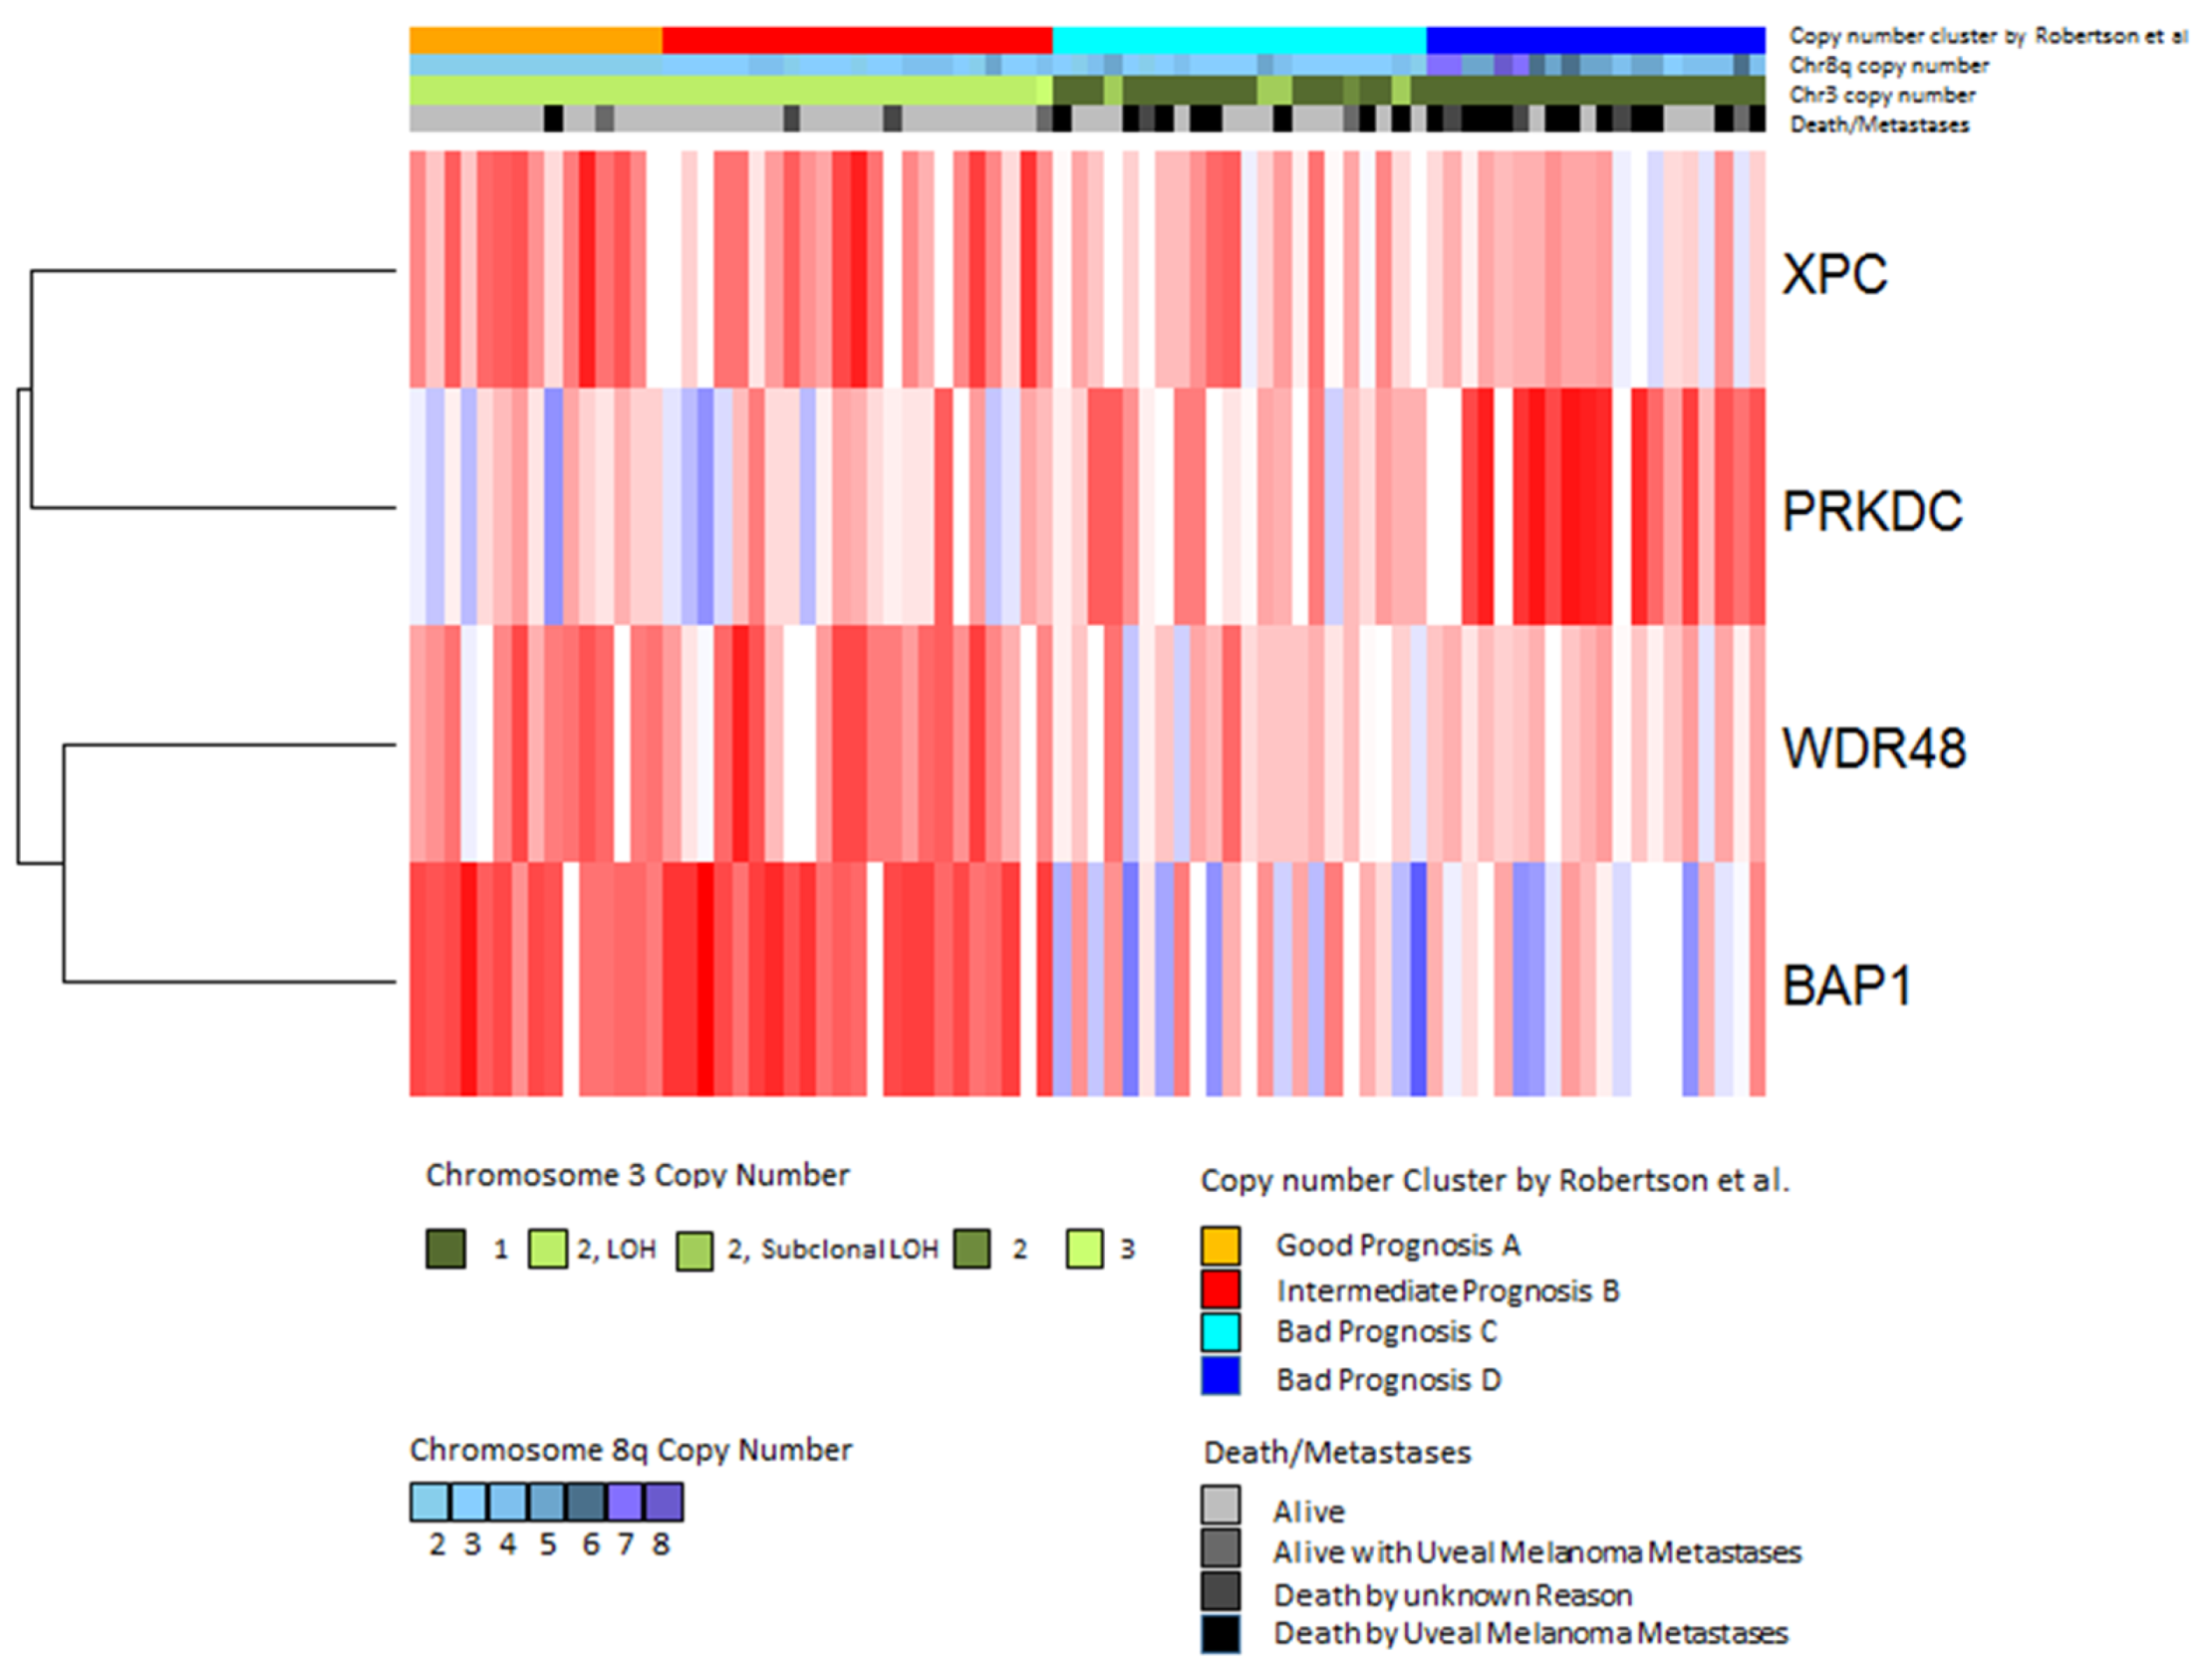
2.5. Validation
2.6. PRKDC
3. Discussion
4. Materials and Methods
4.1. Study Population
4.2. Histologic Examination
4.3. Genetic Analyses
4.4. Gene Selection Procedure
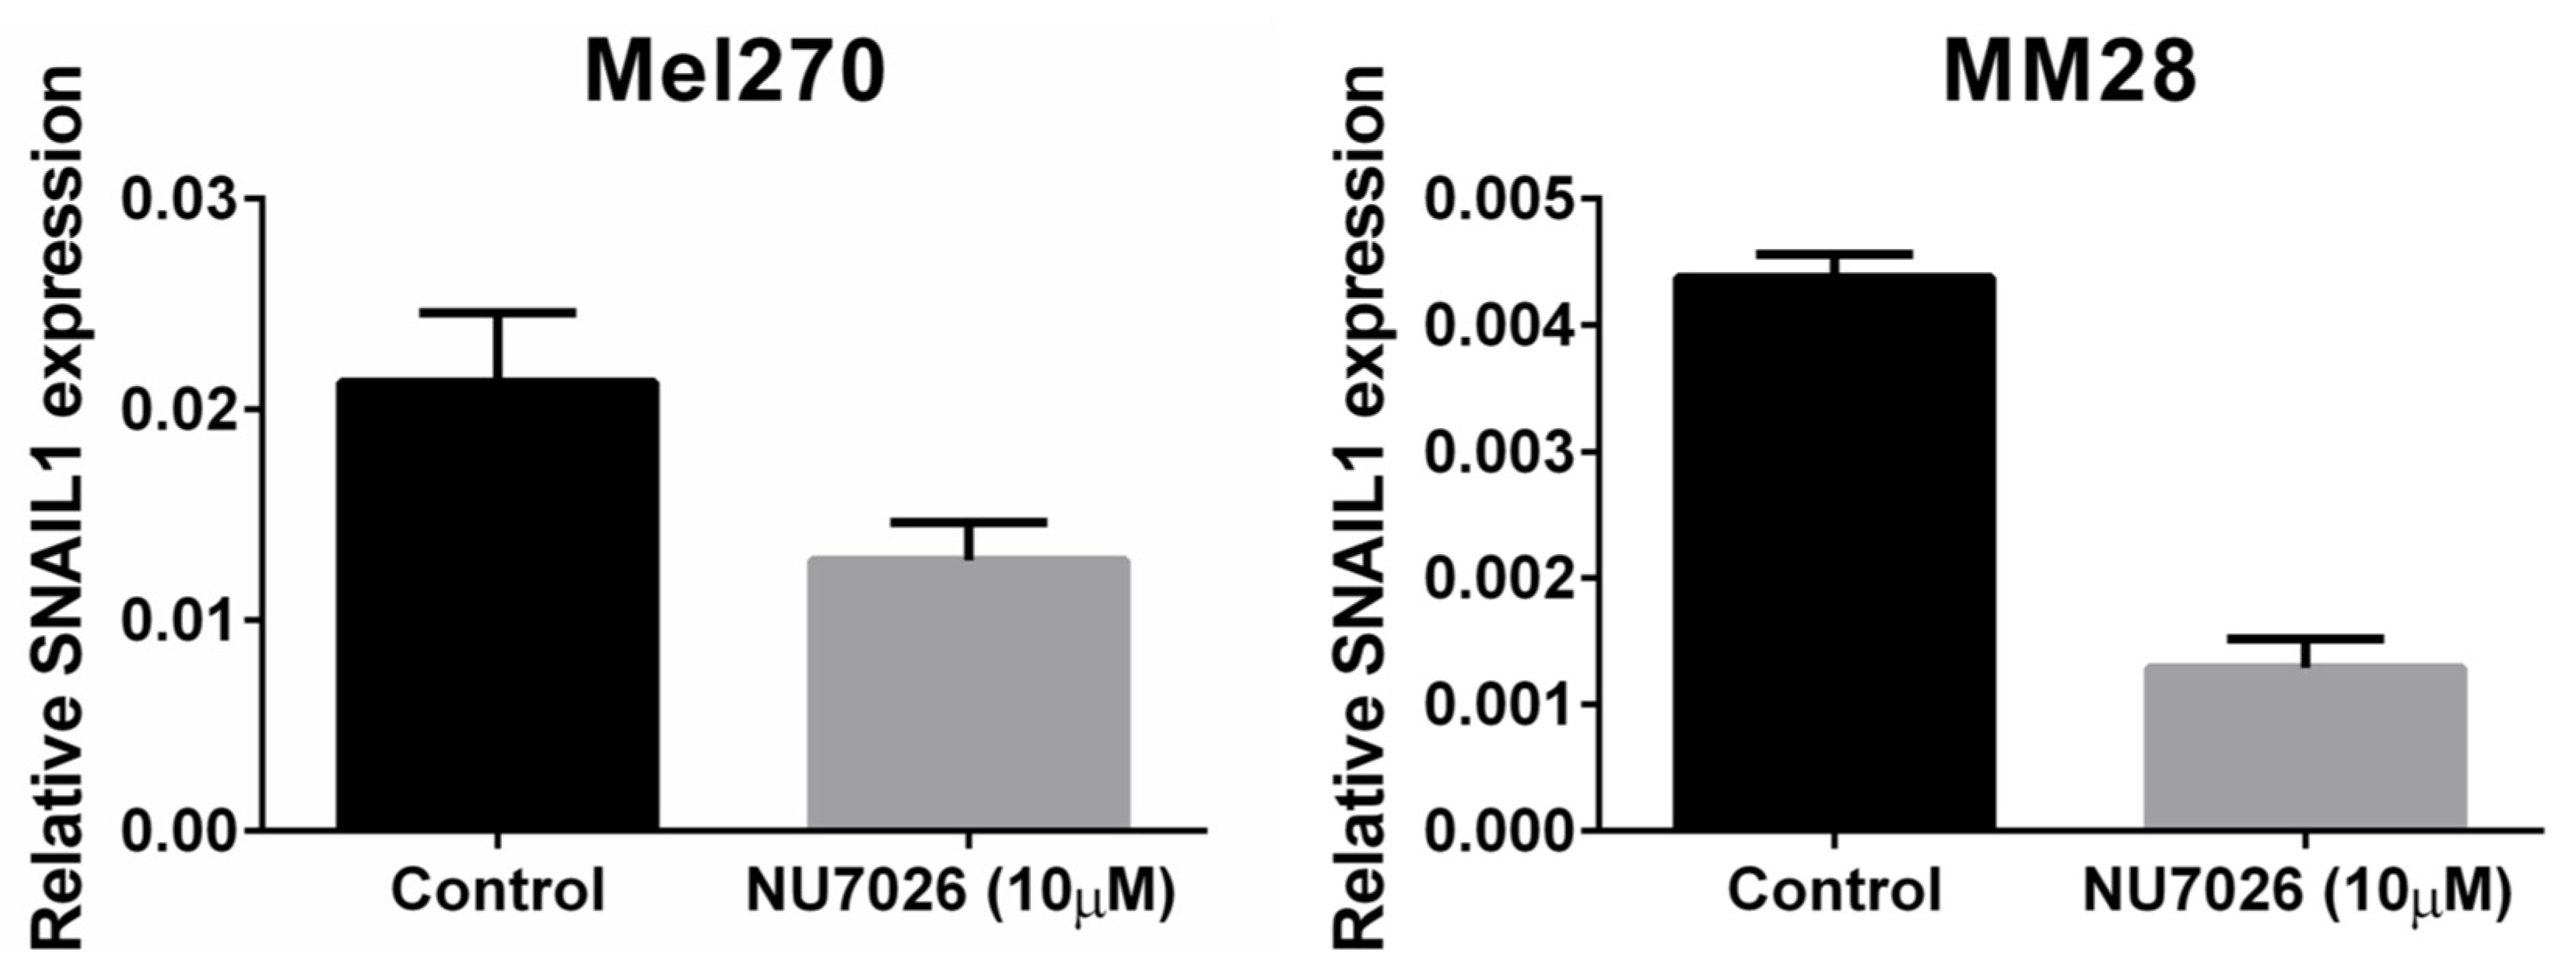
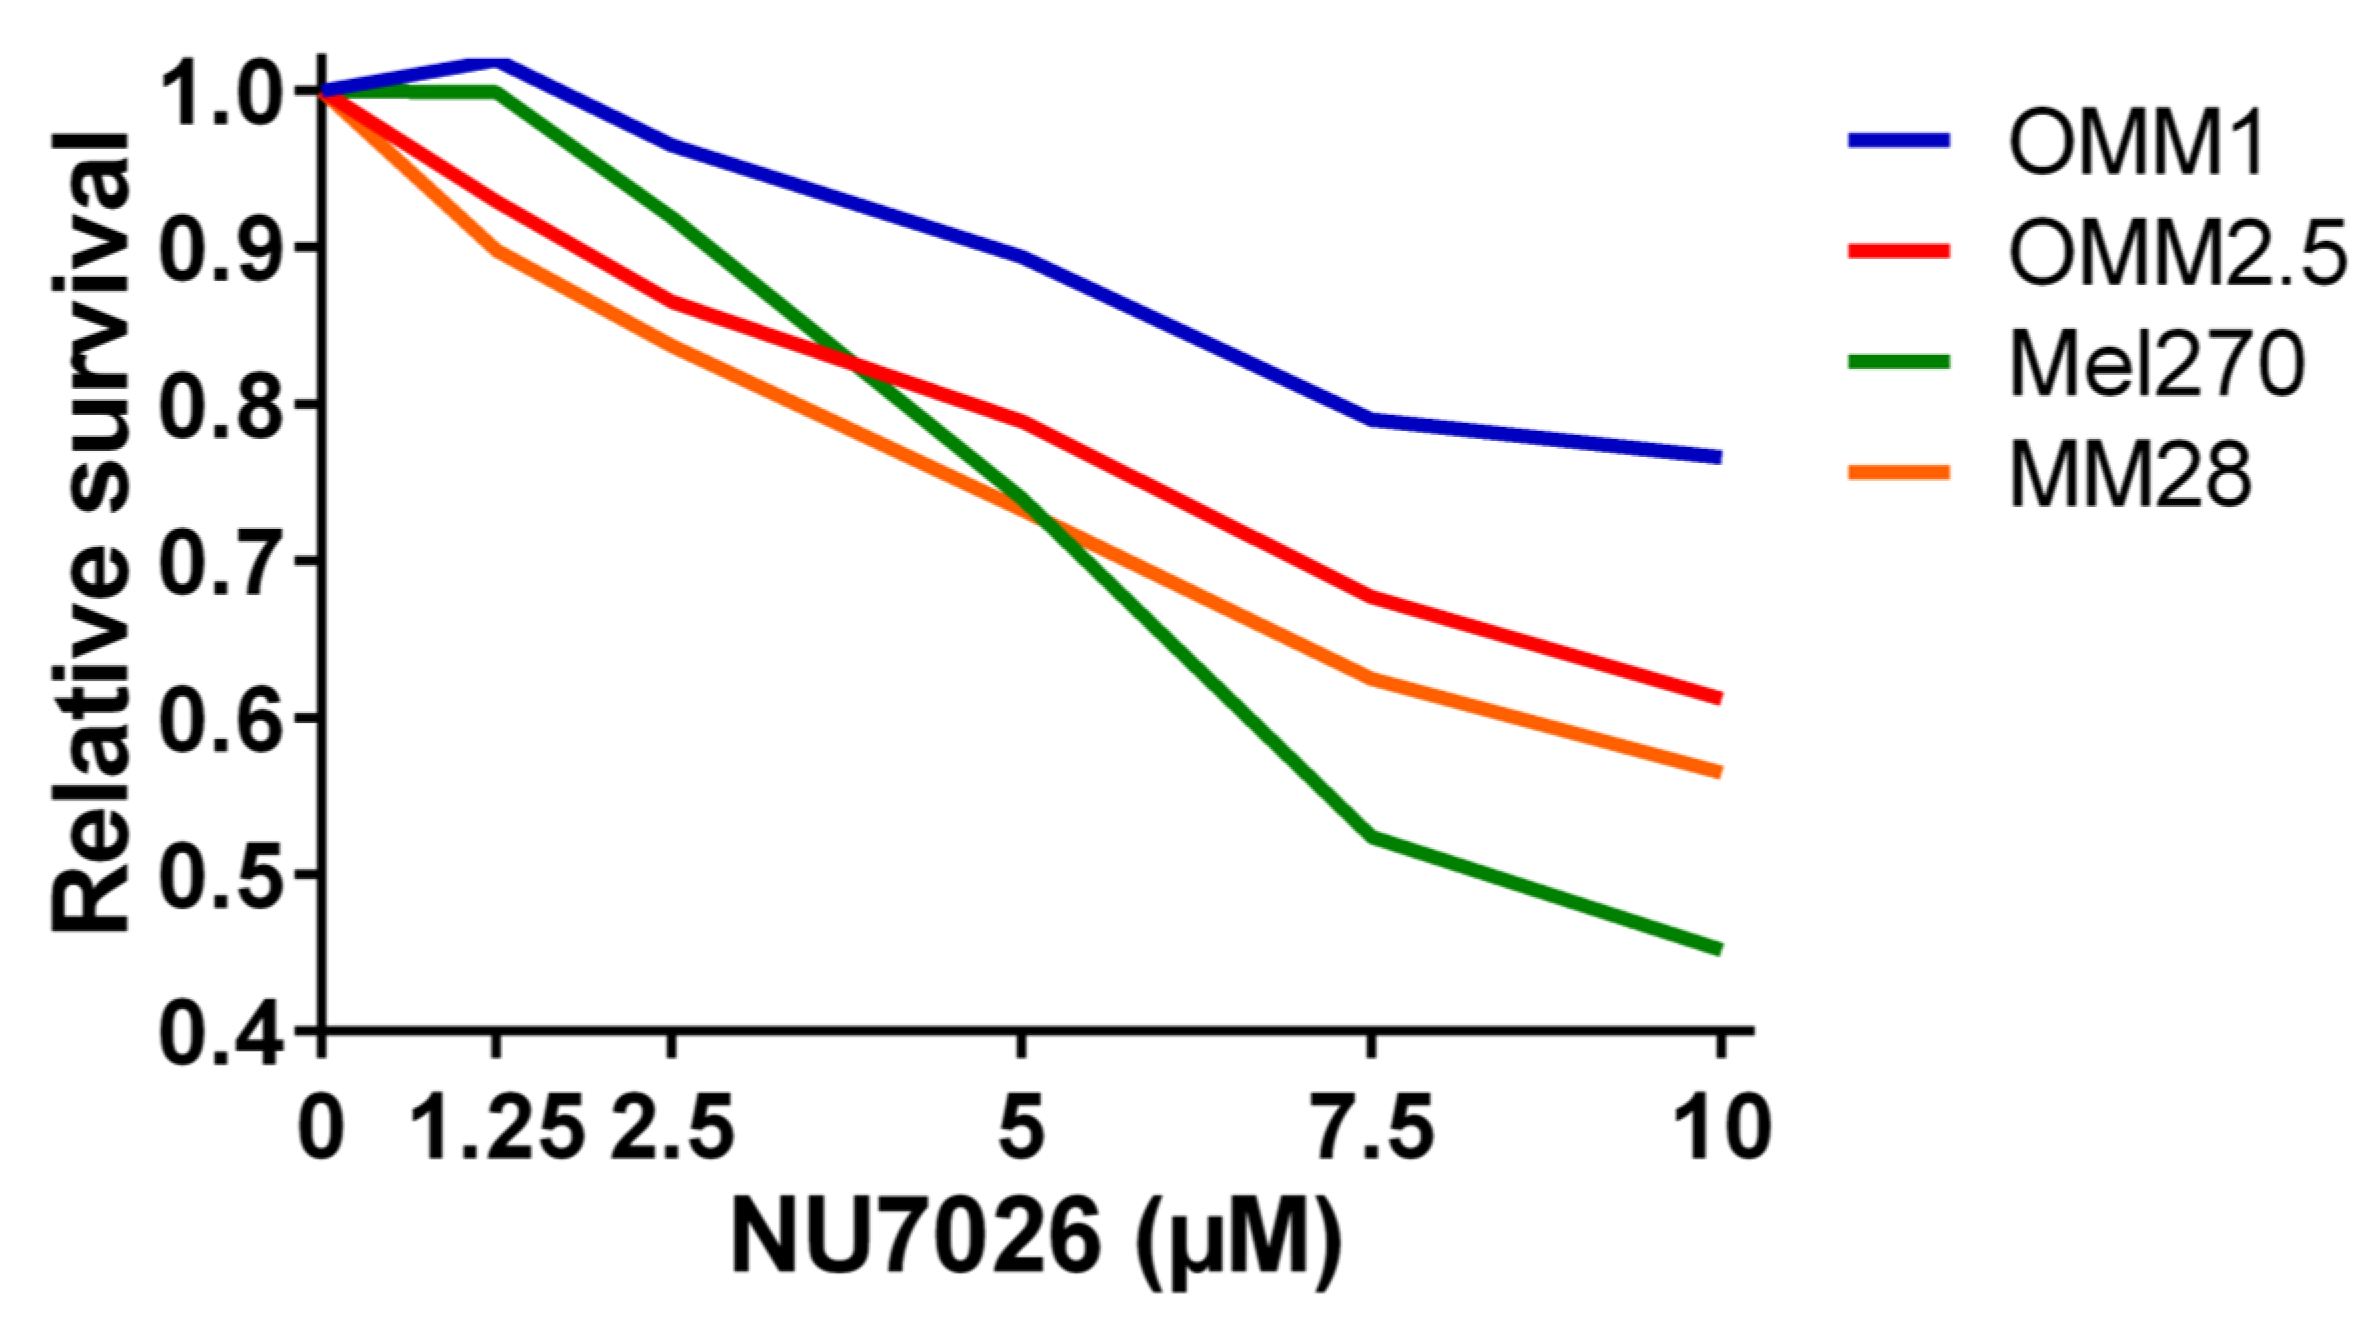
4.5. Cell Lines, DNA-PKcs Inhibition, and Proliferation Assay
4.6. Statistical Analysis
5. Conclusions
Author Contributions
Funding
Conflicts of Interest
Appendix A

| GENE | MEAN EXPRESSION | STANDARD DEVIATION | DISOMY 3 (n = 24) Median (Range) | MONOSOMY 3 (n = 40) Median (Range) | p-VALUE | CORRECTED p-VALUE |
|---|---|---|---|---|---|---|
| APEX1 | 9.76 | 0.58 | 10.2 (8.3–10.8) | 9.6 (8.5–10.7) | 0.001 | 0.07 |
| APEX1a | 10.69 | 0.42 | 11.0 (9.9–11.4) | 10.5 (9.6–11.4) | <0.001 | 0.004 |
| APEX2 | 7.87 | 0.21 | ||||
| APITD1 | Not in Illumina | Not in Illumina | ||||
| ATR | Not in Illumina | Not in Illumina | ||||
| ATRIP | 7.33 | 0.22 | ||||
| ATRIPa | 7.12 | 0.21 | ||||
| BAP1 | 7.52 | 0.53 | 8.0 (6.6–8.5) | 7.4 (6.4–8.1) | <0.001 | <0.001 |
| BIVM-ERCC5 | 7.46 | 0.28 | ||||
| BIVM-ERCC5a | 7.82 | 0.31 | 7.9 (7.4–8.3) | 7.8 (7.1–8.5) | 0.05 | 1 |
| BLM | 6.46 | 0.11 | ||||
| BRCA1 | 6.49 | 0.15 | ||||
| BRCA1a | 6.73 | 0.16 | ||||
| BRCA2 | Not in Illumina | Not in Illumina | ||||
| BRIP1 | 6.47 | 0.1 | ||||
| C17orf70 | 9.1 | 0.39 | 9.0 (8.3–9.8) | 9.2 (8.3–10.4) | 0.02 | 0.84 |
| C19orf40 | 7.06 | 0.19 | ||||
| CCNH | 7.54 | 0.34 | 7.4 (6.8–8.2) | 7.6 (7.0–8.4) | 0.008 | 0.38 |
| CCNHa | 7.66 | 0.22 | ||||
| CDK7 | 8.89 | 0.39 | 8.8 (7.7–9.7) | 8.9 (8.4–10.3) | 0.21 | 1 |
| CENPX | 9.61 | 0.38 | 9.3 (8.9–10.3) | 9.7 (9.0–10.6) | <0.001 | <0.001 |
| CETN2 | 10.02 | 0.38 | 10.2 (9.7–11.2) | 9.9 (9.3–10.7) | <0.001 | 0.002 |
| CUL4B | 7.71 | 0.27 | ||||
| CUL4Ba | 6.53 | 0.17 | ||||
| DCLRE1C | 6.7 | 0.14 | ||||
| DCLRE1Ca | 7.28 | 0.32 | 7.2 (6.7–8.4) | 7.3 (6.9–8.3) | 0.31 | 1 |
| DDB1 | 12.33 | 0.37 | 12.1 (11.3–13.0) | 12.4 (11.7–13.0) | 0.001 | 0.04 |
| DDB1a | 6.63 | 0.18 | ||||
| DDB1b | 6.9 | 0.18 | ||||
| DDB1c | 8.27 | 0.28 | ||||
| DDB2 | 6.95 | 0.23 | ||||
| DNTT | Not in Illumina | Not in Illumina | ||||
| EME1 | 6.54 | 0.1 | ||||
| EME2 | Not in Illumina | Not in Illumina | ||||
| ERCC1 | 9.52 | 0.27 | ||||
| ERCC1a | 7.38 | 0.3 | ||||
| ERCC1b | 9.74 | 0.29 | ||||
| ERCC1c | 6.53 | 0.11 | ||||
| ERCC2 | 7.79 | 0.28 | ||||
| ERCC3 | 7.98 | 0.17 | ||||
| ERCC3a | 6.6 | 0.11 | ||||
| ERCC4 | 6.47 | 0.09 | ||||
| ERCC6 | 6.48 | 0.11 | ||||
| ERCC8 | 6.62 | 0.13 | ||||
| ERCC8a | 6.52 | 0.12 | ||||
| EXO1 | 6.62 | 0.25 | ||||
| EXO1a | 6.39 | 0.13 | ||||
| FAN1 | 8.71 | 0.28 | ||||
| FAN1a | 7.1 | 0.16 | ||||
| FANCA | 6.5 | 0.12 | ||||
| FANCAa | 6.52 | 0.11 | ||||
| FANCAb | 6.36 | 0.13 | ||||
| FANCB | 6.4 | 0.12 | ||||
| FANCC | Not in Illumina | Not in Illumina | ||||
| FANCD2 | 6.74 | 0.2 | ||||
| FANCE | 7.59 | 0.36 | 7.7 (6.8–8.6) | 7.4 (7.1–8.3) | 0.003 | 0.13 |
| FANCF | Not in Illumina | Not in Illumina | ||||
| FANCG | 7.48 | 0.34 | 7.4 (7.0–8.5) | 7.4 (6.9–8.4) | 0.69 | 1 |
| FANCI | 6.59 | 0.18 | ||||
| FANCL | 6.42 | 0.14 | ||||
| FANCLa | 7.78 | 0.4 | 7.9 (7.1–8.6) | 7.6 (6.9–8.9) | 0.06 | 1 |
| FANCM | Not in Illumina | Not in Illumina | ||||
| FEN1 | 7.09 | 0.19 | ||||
| FEN1a | 8.97 | 0.32 | 9.0 (8.4–9.7) | 9.0 (8.1–9.6) | 0.98 | 1 |
| GTF2H1 | 6.91 | 0.19 | ||||
| GTF2H1a | 7.42 | 0.25 | ||||
| GTF2H2 | 6.27 | 0.13 | ||||
| GTF2H2B | 7.13 | 0.32 | 7.0 (6.6–7.9) | 7.2 (6.5–8.1) | 0.37 | 1 |
| GTF2H3 | 7.12 | 0.19 | ||||
| GTF2H4 | 8.09 | 0.47 | 8.5 (6.9–9.4) | 7.9 (7.2–9.3) | <0.001 | <0.001 |
| GTF2H5 | 10.19 | 0.43 | 10.1 (9.3–11.0) | 10.3 (9.3–11.2) | 0.01 | 0.62 |
| LIG1 | 8.27 | 0.31 | 8.2 (7.6–8.7) | 8.3 (7.8–9.0) | 0.09 | 1 |
| LIG3 | 6.85 | 0.12 | ||||
| LIG3a | 7.18 | 0.25 | ||||
| LIG4 | 6.63 | 0.08 | ||||
| LIG4a | 6.47 | 0.11 | ||||
| MBD4 | 8.26 | 0.46 | 8.4 (7.5–9.9) | 8.1 (7.5–9.3) | 0.33 | 1 |
| MGMT | 9.34 | 0.43 | 9.6 (8.7–10.3) | 9.2 (8.3–10.1) | 1 | |
| MLH1 | 7.94 | 0.33 | 8.2 (7.5–8.8) | 7.8 (7.1–8.3) | <0.001 | <0.001 |
| MLH3 | 6.44 | 0.11 | ||||
| MLH3a | 6.63 | 0.15 | ||||
| MNAT1 | 6.8 | 0.2 | ||||
| MPG | 6.61 | 0.09 | ||||
| MPGa | 6.31 | 0.12 | ||||
| MRE11A | 6.59 | 0.08 | ||||
| MRE11Aa | 6.74 | 0.17 | ||||
| MSH2 | 6.46 | 0.12 | ||||
| MSH2a | 6.68 | 0.12 | ||||
| MSH3 | 7.72 | 0.26 | ||||
| MSH3a | 13.39 | 0.65 | 13.3 (12.1–14.7) | 13.5 (12.3–15.0) | 0.13 | 1 |
| MSH6 | 8.8 | 0.3 | ||||
| MUS81 | 7.76 | 0.22 | ||||
| MUTYH | 6.61 | 0.12 | ||||
| MUTYHa | 7.85 | 0.38 | 7.9 (7.3–8.4) | 7.9 (6.9–8.5) | 0.39 | 1 |
| MUTYHb | 6.78 | 0.19 | ||||
| NBN | 8.1 | 0.42 | 7.9 (7.4–8.5) | 8.2 (7.3–9.2) | 0.005 | 0.24 |
| NBNa | 7.01 | 0.25 | ||||
| NEIL1 | 6.58 | 0.11 | ||||
| NEIL2 | 8.06 | 0.45 | 8.3 (7.4–8.8) | 7.9 (6.9–9.1) | 0.002 | 0.1 |
| NHEJ1 | Not in Illumina | Not in Illumina | ||||
| NEIL3 | Not in Illumina | Not in Illumina | ||||
| NTHL1 | 7.76 | 0.31 | 7.8 (7.1–8.5) | 7.7 (7.2–8.3) | 0.01 | 0.64 |
| OGG1 | 6.48 | 0.14 | ||||
| OGG1a | 6.94 | 0.2 | ||||
| PALB2 | 7.21 | 0.19 | ||||
| PARP2 | 7.43 | 0.22 | ||||
| PARP2a | 6.89 | 0.16 | ||||
| PCNA | 6.58 | 0.16 | ||||
| PCNAa | 8.53 | 0.51 | 8.3 (7.7–9.7) | 8.6 (7.5–9.9) | 0.002 | 0.12 |
| PMS2 | 6.97 | 0.21 | ||||
| PMS2a | 6.44 | 0.15 | ||||
| PMS2CL | 6.79 | 0.14 | ||||
| PMS2CLa | 6.48 | 0.11 | ||||
| POLB | 9.72 | 0.63 | 9.9 (9.1–10.7) | 9.7 (8.1–10.9) | 0.06 | 1 |
| POLD3 | 6.77 | 0.13 | ||||
| POLE3 | 9.62 | 0.31 | 9.7 (8.8–10.3) | 9.6 (9.1–10.3) | 0.24 | 1 |
| POLH | 6.52 | 0.13 | ||||
| POLHa | 6.55 | 0.09 | ||||
| POLI | Not in Illumina | Not in Illumina | ||||
| POLK | Not in Illumina | Not in Illumina | ||||
| POLL | 6.89 | 0.2 | ||||
| POLM | 7.14 | 0.22 | ||||
| POLN | 6.53 | 0.22 | ||||
| PRKDC | 6.64 | 0.21 | ||||
| PRKDCa | 8.55 | 0.68 | 8.0 (7.3–8.6) | 8.8 (7.8–10.2) | <0.001 | <0.001 |
| PRKDCb | 6.64 | 0.15 | ||||
| PRKDCc | 6.54 | 0.12 | ||||
| PRKDCd | 6.56 | 0.1 | ||||
| RAD23A | 9.77 | 0.24 | ||||
| RAD50 | 7.59 | 0.19 | ||||
| RAD51 | 6.97 | 0.26 | ||||
| RAD51a | 6.81 | 0.13 | ||||
| RAD51C | Not in Illumina | Not in Illumina | ||||
| RAD52 | Not in Illumina | Not in Illumina | ||||
| RAD54B | 6.52 | 0.1 | ||||
| RAD54Ba | 6.81 | 0.16 | ||||
| RBX1 | 10.17 | 0.39 | 10.0 (9.4–10.8) | 10.2 (9.6–11.1) | 0.01 | 0.55 |
| REV1 | 7.78 | 0.17 | ||||
| REV1a | 7.75 | 0.19 | ||||
| REV3L | 6.66 | 0.2 | ||||
| RFC1 | 7.37 | 0.19 | ||||
| RFC1a | 8.66 | 0.28 | ||||
| RMI1 | 6.84 | 0.14 | ||||
| RMI1a | 7.27 | 0.2 | ||||
| RMI2 | 7.07 | 0.32 | 7.2 (6.7–7.7) | 6.9 (6.5–7.7) | <0.001 | 0.02 |
| RPA1 | 8.2 | 0.34 | 8.5 (7.7–8.9) | 8.1 (7.4–8.9) | 0.006 | 0.28 |
| RPA1a | 9.74 | 0.36 | 9.9 (8.7–10.4) | 9.7 (8.9–10.5) | 0.02 | 1 |
| RPA1b | 8.39 | 0.36 | 8.7 (7.7–9.2) | 8.3 (7.4–8.9) | 0.001 | 0.04 |
| RPA2 | 9.95 | 0.38 | 10.1 (9.3–10.9) | 10.0 (9.2–10.7) | 0.22 | 1 |
| RPA3 | 9 | 0.41 | 9.1 (8.5–10.1) | 8.9 (8.0–9.9) | 0.09 | 1 |
| RPA4 | 6.38 | 0.13 | ||||
| SEM1 | 11.32 | 0.24 | ||||
| SEM1a | 7.53 | 0.32 | 7.7 (7.3–8.4) | 7.4 (6.8–8.0) | <0.001 | 0.01 |
| SLX1A | Not in Illumina | Not in Illumina | ||||
| SLX1B | Not in Illumina | Not in Illumina | ||||
| SLX4 | 6.96 | 0.19 | ||||
| SMUG1 | 9.04 | 0.23 | ||||
| TELO2 | 6.96 | 0.29 | ||||
| TDG | Not in Illumina | Not in Illumina | ||||
| TOP3A | 7.39 | 0.36 | 7.3 (6.7–8.6) | 7.4 (6.9–8.3) | 0.22 | 1 |
| TOP3Aa | 6.78 | 0.15 | ||||
| TOP3B | 7.89 | 0.26 | ||||
| UBE2T | 7.32 | 0.37 | 7.3 (6.8–8.2) | 7.3 (6.7–8.5) | 0.49 | 1 |
| UNG | 6.31 | 0.12 | ||||
| UNGa | 9.6 | 0.41 | 9.6 (8.8–10.5) | 9.7 (8.7–10.3) | 0.53 | 1 |
| UNGb | 6.54 | 0.11 | ||||
| USP1 | 7.57 | 0.29 | ||||
| USP1a | 6.48 | 0.12 | ||||
| WDR48 | 7.82 | 0.36 | 8.2 (7.4–8.6) | 7.6 (7.2–8.2) | <0.001 | <0.001 |
| XPA | 6.99 | 0.14 | ||||
| XPC | 8.76 | 0.42 | 9.2 (8.3–9.7) | 8.6 (8.0–9.3) | <0.001 | <0.001 |
| XRCC1 | 7.88 | 0.3 | 7.9 (7.3–8.7) | 7.9 (7.3–8.5) | 0.57 | 1 |
| XRCC4 | Not in Illumina | Not in Illumina | ||||
| XRCC5 | 8.94 | 0.32 | 9.0 (8.2–9.6) | 9.0 (8.1–9.6) | 0.95 | 1 |
| XRCC6 | 8.5 | 0.31 | 8.3 (7.8–8.8) | 8.6 (7.7–9.3) | 0.005 | 0.26 |
| XRCC6a | 6.73 | 0.13 | ||||
| XRCC6b | 8.75 | 0.38 | 8.7 (7.9–9.2) | 8.8 (7.9–10.0) | 0.65 | 1 |
| XRCC6c | 10.61 | 0.37 | 10.5 (9.5–11.2) | 10.7 (9.8–11.2) | 0.02 | 0.87 |
Appendix B
| A: Highly expressed genes in monosomy 3 tumors. | ||||||||||
| CHARACTERISTIC | GENE | |||||||||
| CENPX (17q25.3) | DDB1 (11q12) | PRKDC (8q11.21) | ||||||||
| PATHWAY | ||||||||||
| FA | NER | DSBR | ||||||||
| Largest Basal Diameter | ||||||||||
| ≤13 mm (n = 34) median(range) | 9.4 (9.0–10.6) | 12.3 (11.3–13.0) | 8.4 (7.5–9.8) | |||||||
| >13 mm (n = 30) median(range) | 9.7 (8.9–10.5) | 12.3 (11.7–12.8) | 8.7 (7.3–10.2) | |||||||
| p-value * | 0.02 | 0.93 | 0.11 | |||||||
| Cell type | ||||||||||
| Spindle (n = 22) median (range) | 9.5 (8.9–10.4) | 12.3 (11.7–13.0) | 8.2 (7.3–9.7) | |||||||
| Mixed/epithelioid (n = 42) median(range) | 9.6 (9.0–10.6) | 12.3 (11.3–13.0) | 8.6 (7.5–10.2) | |||||||
| p-value * | 0.04 | 0.59 | 0.12 | |||||||
| AJCC Stage | ||||||||||
| Stage I (n = 5) median (range) | 9.3 (9.0–9.9) | 12.6 (12.2–13.0) | 8.2 (7.7–9.6) | |||||||
| Stage II (n = 36) median (range) | 9.5 (8.9–10.6) | 12.3 (11.3–13.0) | 8.4 (7.5–9.8) | |||||||
| Stage III (n = 23) median (range) | 9.7 (9.3–10.5) | 12.3 (11.8–12.9) | 8.7 (7.3–10.2) | |||||||
| p-value † | 0.01 | 0.1 | 0.19 | |||||||
| Presence of metastases | ||||||||||
| No (n = 27) median (range) | 9.3 (9.0–10.4) | 12.3 (11.2–13.0) | 8.1 (7.5–9.4) | |||||||
| Yes (n = 37) median (range) | 9.8 (8.9–10.6) | 12.4 (11.7–13.0) | 8.8 (7.3–10.2) | |||||||
| p-value * | <0.001 | 0.3 | <0.001 | |||||||
| Survival analysis | ||||||||||
| Expression lower than or equal to median | ≤9.6 | ≤12.3 | ≤8.4 | |||||||
| Expression higher than median | >9.6 § | >12.3 | >8.4 § | |||||||
| p-value ‡ | <0.001 | 0.48 | 0.001 | |||||||
| B: Lowly expressed genes in monosomy 3 tumors. | ||||||||||
| CHARACTERISTIC | GENE | |||||||||
| APEX1 (14q11.2) | BAP1 (3p21.1) | CETN2 (Xq28) | GTF2H4 (6p21.33) | MLH1 (3p22.2) | RMI2 (16p13.13) | RPA1 (17p13.3) | SEM1 (7q21.3) | WDR48 (3p22.2) | XPC (3p25.1) | |
| PATHWAY | ||||||||||
| BER | DSBR | NER | NER | MMR/FA | DSBR | DSBR/MMR/NER | DSBR | FA | NER | |
| LBD | ||||||||||
| ≤13 mm (n = 34) median(range) | 10.7 (9.9–11.4) | 7.7 (6.6–8.5) | 10.0 (9.3–11.2) | 8.0(6.9–9.1) | 8.0(7.5–8.8) | 7.09 (6.6–7.7) | 8.4 (7.7–9.2) | 7.5(7.0–8.4) | 8.0(7.2–8.5) | 8.9 (8.0–9.6) |
| >13 mm (n = 30) median(range) | 10.7 (9.6–11.4) | 7.4 (6.4–8.5) | 9.9 (9.3–10.9) | 8.0(7.2–9.4) | 7.9 (7.1–8.6) | 7.0 (6.5–7.7) | 8.4 (7.4–8.8) | 7.4 (6.8–8.0) | 7.7 (7.2–8.6) | 8.6 (8.0–9.7) |
| p-value * | 0.75 | 0.17 | 0.24 | 0.86 | 0.16 | 0.11 | 0.2 | 0.11 | 0.01 | 0.004 |
| Cell type | ||||||||||
| Spindle (n = 22) median (range) | 10.8 (9.6–11.4) | 7.7 (6.6–8.5) | 10.1 (9.6–10.9) | 8.2 (7.2–9.4) | 7.9 (7.1–8.8) | 7.1 (6.5–7.7) | 8.6 (7.4–9.2) | 7.5 (6.8–8.0) | 8.0(7.3–8.6) | 8.9 (8.0–9.7) |
| Mixed/epithelioid (n = 42) median(range) | 10.6 (9.6–11.4) | 7.6 (6.4–8.5) | 10.0 (9.3–11.2) | 8.0 (6.9–9.1) | 7.9 (7.2–8.8) | 6.9 (6.6–7.7) | 8.4(7.5–9.1) | 7.5 (6.9–8.4) | 7.7 (7.2–8.5) | 8.7 (8.0–9.3) |
| p-value * | 0.13 | 0.15 | 0.1 | 0.12 | 0.97 | 0.15 | 0.06 | 0.09 | 0.007 | 0.03 |
| AJCC Stage | ||||||||||
| Stage I (n = 5) median (range) | 10.7 (10.4–11.0) | 7.7 (7.5–8.1) | 10.1 (9.3–11.2) | 8.1 (7.9–8.5) | 7.8 (7.6–8.4) | 7.1 (6.9–7.6) | 8.7 (7.9–9.1) | 7.6 (7.1–8.2) | 7.9 (7.5–8.5) | 8.8 (8.6–9.2) |
| Stage II (n = 36) median (range) | 10.8 (9.7–11.4) | 7.7 (6.4–8.5) | 10.0(9.6–10.7) | 8.0 (6.9–9.4) | 8.0 (7.5–8.8) | 7.0 (6.6–7.7) | 8.5 (7.7–9.2) | 7.5 (7.0–8.4) | 8.1 (7.3–8.6) | 8.8 (8.0–9.7) |
| Stage III (n = 23)median (range) | 10.5 (9.6–11.3) | 7.4 (6.6–8.5) | 9.9 (9.3–10.9) | 8.0 (7.5–9.1) | 7.8 (7.1–8.6) | 7.1 (6.5–7.7) | 8.3 (7.4–8.8) | 7.4 (6.8–8.0) | 7.7 (7.2–8.3) | 8.6 (8.0–9.3) |
| p-value † | 0.1 | 0.35 | 0.16 | 0.76 | 0.05 | 0.44 | 0.03 | 0.27 | 0.08 | 0.14 |
| Presence of metastases | ||||||||||
| No (n = 27) median (range) | 10.8 (9.9–11.4) | 7.8 (6.6–8.5) | 10.1 (9.7–11.2) | 8.3 (6.9–9.3) | 8.1 (7.5–8.8) | 7.1(6.7–7.7) | 8.4(7.7–9.2) | 7.6 (7.3–8.4) | 8.1(7.2–8.6) | 9.0 (8.0–9.6) |
| Yes (n = 37) median (range) | 10.6 (9.6–11.4) | 7.4(6.4–8.3) | 9.9 (9.3–10.9) | 7.9 (7.2–9.4) | 7.9 (7.1–8.6) | 6.9 (6.5–7.7) | 8.4 (7.4–8.9) | 7.4 (6.8–8.01) | 7.7 (7.2–8.3) | 8.6 (8.0–9.7) |
| p-value * | 0.11 | 0.003 | 0.03 | 0.005 | 0.02 | 0.003 | 0.09 | 0.006 | <0.001 | 0.006 |
| Survival analysis | ||||||||||
| Expression ≤ median | ≤10.7 | ≤7.6 § | ≤10 | ≤8 § | ≤7.9 | ≤7.1 § | ≤8.4 | ≤7.5 § | ≤7.8 § | ≤8.7 § |
| Expression higher than median | >10.7 | >7.6 | >10 | >8 | >7.9 | >7.1 | >8.4 | >7.5 | >7.8 | >8.7 |
| p-value ‡ | 0.05 | 0.001 | 0.18 | 0.001 | 0.07 | 0.02 | 0.41 | 0.006 | <0.001 | 0.005 |
References
- Chang, A.E.; Karnell, L.H.; Menck, H.R. The National Cancer Data Base report on cutaneous and noncutaneous melanoma: A summary of 84,836 cases from the past decade. The American College of Surgeons Commission on Cancer and the American Cancer Society. Cancer 1998, 83, 1664–1678. [Google Scholar] [CrossRef]
- Singh, A.D.; Turell, M.E.; Topham, A.K. Uveal melanoma: Trends in incidence, treatment, and survival. Ophthalmology 2011, 118, 1881–1885. [Google Scholar] [CrossRef] [PubMed]
- Holly, E.A.; Aston, D.A.; Char, D.H.; Kristiansen, J.J.; Ahn, D.K. Uveal melanoma in relation to ultraviolet light exposure and host factors. Cancer Res. 1990, 50, 5773–5777. [Google Scholar] [PubMed]
- Weis, E.; Shah, C.P.; Lajous, M.; Shields, J.A.; Shields, C.L. The association between host susceptibility factors and uveal melanoma: A meta-analysis. Arch. Ophthalmol. 2006, 124, 54–60. [Google Scholar] [CrossRef] [PubMed]
- Diener-West, M.; Hawkins, B.S.; Markowitz, J.A.; Schachat, A.P. A review of mortality from choroidal melanoma. II. A meta-analysis of 5-year mortality rates following enucleation, 1966 through 1988. Arch. Ophthalmol. 1992, 110, 245–250. [Google Scholar] [CrossRef] [PubMed]
- Jampol, L.M.; Moy, C.S.; Murray, T.G.; Reynolds, S.M.; Albert, D.M.; Schachat, A.P.; Diddie, K.R.; Engstrom, R.E., Jr.; Finger, P.T.; Hovland, K.R.; et al. The COMS randomized trial of iodine 125 brachytherapy for choroidal melanoma: IV. Local treatment failure and enucleation in the first 5 years after brachytherapy. COMS report no. 19. Ophthalmology 2002, 109, 2197–2206. [Google Scholar] [CrossRef]
- Krohn, J.; Monge, O.R.; Skorpen, T.N.; Mork, S.J.; Dahl, O. Posterior uveal melanoma treated with I-125 brachytherapy or primary enucleation. Eye 2008, 22, 1398–1403. [Google Scholar] [CrossRef]
- Tarmann, L.; Wackernagel, W.; Avian, A.; Mayer, C.; Schneider, M.; Winkler, P.; Langmann, G. Ruthenium-106 plaque brachytherapy for uveal melanoma. Br. J. Ophthalmol. 2015, 99, 1644–1649. [Google Scholar] [CrossRef]
- Riechardt, A.I.; Cordini, D.; Willerding, G.D.; Georgieva, I.; Weber, A.; Seibel, I.; Lakotka, N.; Bechrakis, N.E.; Foerster, M.H.; Moser, L.; et al. Proton beam therapy of parapapillary choroidal melanoma. Am. J. Ophthalmol. 2014, 157, 1258–1265. [Google Scholar] [CrossRef]
- Seddon, J.M.; Gragoudas, E.S.; Egan, K.M.; Glynn, R.J.; Howard, S.; Fante, R.G.; Albert, D.M. Relative survival rates after alternative therapies for uveal melanoma. Ophthalmology 1990, 97, 769–777. [Google Scholar] [CrossRef]
- Augsburger, J.J.; Correa, Z.M.; Shaikh, A.H. Effectiveness of treatments for metastatic uveal melanoma. Am. J. Ophthalmol. 2009, 148, 119–127. [Google Scholar] [CrossRef] [PubMed]
- Singh, A.D.; Bergman, L.; Seregard, S. Uveal melanoma: Epidemiologic aspects. Ophthalmol. Clin. N. Am. 2005, 18, 75–84. [Google Scholar] [CrossRef] [PubMed]
- Kujala, E.; Makitie, T.; Kivela, T. Very long-term prognosis of patients with malignant uveal melanoma. Investig. Ophthalmol. Vis. Sci. 2003, 44, 4651–4659. [Google Scholar] [CrossRef] [PubMed]
- Kujala, E.; Damato, B.; Coupland, S.E.; Desjardins, L.; Bechrakis, N.E.; Grange, J.D.; Kivela, T. Staging of ciliary body and choroidal melanomas based on anatomic extent. J. Clin. Oncol. 2013, 31, 2825–2831. [Google Scholar] [CrossRef] [PubMed]
- Seddon, J.M.; Albert, D.M.; Lavin, P.T.; Robinson, N. A prognostic factor study of disease-free interval and survival following enucleation for uveal melanoma. Arch. Ophthalmol. 1983, 101, 1894–1899. [Google Scholar] [CrossRef] [PubMed]
- Affeldt, J.C.; Minckler, D.S.; Azen, S.P.; Yeh, L. Prognosis in uveal melanoma with extrascleral extension. Arch. Ophthalmol. 1980, 98, 1975–1979. [Google Scholar] [CrossRef] [PubMed]
- Makitie, T.; Summanen, P.; Tarkkanen, A.; Kivela, T. Microvascular loops and networks as prognostic indicators in choroidal and ciliary body melanomas. J. Nat. Cancer Inst. 1999, 91, 359–367. [Google Scholar] [CrossRef] [PubMed]
- Shields, C.L.; Furuta, M.; Thangappan, A.; Nagori, S.; Mashayekhi, A.; Lally, D.R.; Kelly, C.C.; Rudich, D.S.; Nagori, A.V.; Wakade, O.A.; et al. Metastasis of uveal melanoma millimeter-by-millimeter in 8033 consecutive eyes. Arch. Ophthalmol. 2009, 127, 989–998. [Google Scholar] [CrossRef] [PubMed]
- Horsman, D.E.; Sroka, H.; Rootman, J.; White, V.A. Monosomy 3 and isochromosome 8q in a uveal melanoma. Cancer Genet. Cytogenet. 1990, 45, 249–253. [Google Scholar] [CrossRef]
- Prescher, G.; Bornfeld, N.; Hirche, H.; Horsthemke, B.; Jockel, K.H.; Becher, R. Prognostic implications of monosomy 3 in uveal melanoma. Lancet 1996, 347, 1222–1225. [Google Scholar]
- Sisley, K.; Rennie, I.G.; Parsons, M.A.; Jacques, R.; Hammond, D.W.; Bell, S.M.; Potter, A.M.; Rees, R.C. Abnormalities of chromosomes 3 and 8 in posterior uveal melanoma correlate with prognosis. Genes Chromosomes Cancer 1997, 19, 22–28. [Google Scholar] [CrossRef]
- Kilic, E.; Naus, N.C.; van Gils, W.; Klaver, C.C.; van Til, M.E.; Verbiest, M.M.; Stijnen, T.; Mooy, C.M.; Paridaens, D.; Beverloo, H.B.; et al. Concurrent loss of chromosome arm 1p and chromosome 3 predicts a decreased disease-free survival in uveal melanoma patients. Investig. Ophthalmol. Vis. Sci. 2005, 46, 2253–2257. [Google Scholar] [CrossRef]
- Dogrusöz, M.; Jager, M.J. Genetic prognostication in uveal melanoma. Acta Ophthalmol. 2018, 96, 331–347. [Google Scholar] [CrossRef]
- White, V.A.; Chambers, J.D.; Courtright, P.D.; Chang, W.Y.; Horsman, D.E. Correlation of cytogenetic abnormalities with the outcome of patients with uveal melanoma. Cancer 1998, 83, 354–359. [Google Scholar] [CrossRef]
- Damato, B.; Dopierala, J.; Klaasen, A.; van Dijk, M.; Sibbring, J.; Coupland, S.E. Multiplex ligation-dependent probe amplification of uveal melanoma: Correlation with metastatic death. Investig. Ophthalmol. Vis. Sci. 2009, 50, 3048–3055. [Google Scholar] [CrossRef]
- Onken, M.D.; Worley, L.A.; Ehlers, J.P.; Harbour, J.W. Gene expression profiling in uveal melanoma reveals two molecular classes and predicts metastatic death. Cancer Res. 2004, 64, 7205–7209. [Google Scholar] [CrossRef]
- Onken, M.D.; Worley, L.A.; Tuscan, M.D.; Harbour, J.W. An accurate, clinically feasible multi-gene expression assay for predicting metastasis in uveal melanoma. J. Mol. Diagn. 2010, 12, 461–468. [Google Scholar] [CrossRef]
- Onken, M.D.; Worley, L.A.; Char, D.H.; Augsburger, J.J.; Correa, Z.M.; Nudleman, E.; Aaberg, T.M., Jr.; Altaweel, M.M.; Bardenstein, D.S.; Finger, P.T.; et al. Collaborative Ocular Oncology Group report number 1: Prospective validation of a multi-gene prognostic assay in uveal melanoma. Ophthalmology 2012, 119, 1596–1603. [Google Scholar] [CrossRef]
- Harbour, J.W.; Onken, M.D.; Roberson, E.D.; Duan, S.; Cao, L.; Worley, L.A.; Council, M.L.; Matatall, K.A.; Helms, C.; Bowcock, A.M. Frequent mutation of BAP1 in metastasizing uveal melanomas. Science 2010, 330, 1410–1413. [Google Scholar] [CrossRef]
- Yavuzyigitoglu, S.; Koopmans, A.E.; Verdijk, R.M.; Vaarwater, J.; Eussen, B.; van Bodegom, A.; Paridaens, D.; Kilic, E.; de Klein, A. Rotterdam Ocular Melanoma Study Group. Uveal Melanomas with SF3B1 Mutations: A Distinct Subclass Associated with Late-Onset Metastases. Ophthalmology 2016, 123, 1118–1128. [Google Scholar] [CrossRef]
- Ewens, K.G.; Kanetsky, P.A.; Richards-Yutz, J.; Purrazzella, J.; Shields, C.L.; Ganguly, T.; Ganguly, A. Chromosome 3 Status Combined with BAP1 and EIF1AX Mutation Profiles Are Associated with Metastasis in Uveal Melanoma. Investig. Ophthalmol. Vis. Sci. 2014, 55, 5160–5167. [Google Scholar] [CrossRef]
- Hanahan, D.; Weinberg, R.A. Hallmarks of cancer: The next generation. Cell 2011, 144, 646–674. [Google Scholar] [CrossRef]
- Amaro, A.; Gangemi, R.; Piaggio, F.; Angelini, G.; Barisione, G.; Ferrini, S.; Pfeffer, U. The biology of uveal melanoma. Cancer Metastasis Rev. 2017, 36, 109–140. [Google Scholar] [CrossRef]
- van Essen, T.H.; van Pelt, S.I.; Versluis, M.; Bronkhorst, I.H.; van Duinen, S.G.; Marinkovic, M.; Kroes, W.G.; Ruivenkamp, C.A.; Shukla, S.; de Klein, A.; et al. Prognostic parameters in uveal melanoma and their association with BAP1 expression. Br. J. Ophthalmol. 2014, 98, 1738–1743. [Google Scholar] [CrossRef]
- Shah, A.A.; Bourne, T.D.; Murali, R. BAP1 protein loss by immunohistochemistry: A potentially useful tool for prognostic prediction in patients with uveal melanoma. Pathology 2013, 45, 651–656. [Google Scholar] [CrossRef]
- Yu, H.; Pak, H.; Hammond-Martel, I.; Ghram, M.; Rodrigue, A.; Daou, S.; Barbour, H.; Corbeil, L.; Hebert, J.; Drobetsky, E.; et al. Tumor suppressor and deubiquitinase BAP1 promotes DNA double-strand break repair. Proc. Nat. Acad. Sci. USA 2014, 111, 285–290. [Google Scholar] [CrossRef]
- Helleday, T.; Petermann, E.; Lundin, C.; Hodgson, B.; Sharma, R.A. DNA repair pathways as targets for cancer therapy. Nat. Rev. Cancer 2008, 8, 193–204. [Google Scholar] [CrossRef]
- Lieberman, H.B. DNA damage repair and response proteins as targets for cancer therapy. Curr. Med. Chem. 2008, 15, 360–367. [Google Scholar] [CrossRef]
- Kelley, M.R.; Fishel, M.L. DNA repair proteins as molecular targets for cancer therapeutics. Anti Cancer Agents Med. Chem. 2008, 8, 417–425. [Google Scholar] [CrossRef]
- Gangemi, R.; Mirisola, V.; Barisione, G.; Fabbi, M.; Brizzolara, A.; Lanza, F.; Mosci, C.; Salvi, S.; Gualco, M.; Truini, M.; et al. Mda-9/syntenin is expressed in uveal melanoma and correlates with metastatic progression. PLoS ONE 2012, 7, e29989. [Google Scholar] [CrossRef]
- Laurent, C.; Valet, F.; Planque, N.; Silveri, L.; Maacha, S.; Anezo, O.; Hupe, P.; Plancher, C.; Reyes, C.; Albaud, B.; et al. High PTP4A3 phosphatase expression correlates with metastatic risk in uveal melanoma patients. Cancer Res. 2011, 71, 666–674. [Google Scholar] [CrossRef]
- Robertson, A.G.; Shih, J.; Yau, C.; Gibb, E.A.; Oba, J.; Mungall, K.L.; Hess, J.M.; Uzunangelov, V.; Walter, V.; Danilova, L.; et al. Integrative Analysis Identifies Four Molecular and Clinical Subsets in Uveal Melanoma. Cancer Cell 2018, 33, 151. [Google Scholar] [CrossRef]
- Tschentscher, F.; Husing, J.; Holter, T.; Kruse, E.; Dresen, I.G.; Jockel, K.H.; Anastassiou, G.; Schilling, H.; Bornfeld, N.; Horsthemke, B.; et al. Tumor classification based on gene expression profiling shows that uveal melanomas with and without monosomy 3 represent two distinct entities. Cancer Res. 2003, 63, 2578–2584. [Google Scholar]
- Van Gils, W.; Lodder, E.M.; Mensink, H.W.; Kilic, E.; Naus, N.C.; Bruggenwirth, H.T.; van Ijcken, W.; Paridaens, D.; Luyten, G.P.; de Klein, A. Gene expression profiling in uveal melanoma: Two regions on 3p related to prognosis. Investig. Ophthalmol. Vis. Sci. 2008, 49, 4254–4262. [Google Scholar] [CrossRef]
- Goodwin, J.F.; Kothari, V.; Drake, J.M.; Zhao, S.; Dylgjeri, E.; Dean, J.L.; Schiewer, M.J.; McNair, C.; Jones, J.K.; Aytes, A.; et al. DNA-PKcs-Mediated Transcriptional Regulation Drives Prostate Cancer Progression and Metastasis. Cancer Cell 2015, 28, 97–113. [Google Scholar] [CrossRef]
- Evert, M.; Frau, M.; Tomasi, M.L.; Latte, G.; Simile, M.M.; Seddaiu, M.A.; Zimmermann, A.; Ladu, S.; Staniscia, T.; Brozzetti, S.; et al. Deregulation of DNA-dependent protein kinase catalytic subunit contributes to human hepatocarcinogenesis development and has a putative prognostic value. Br. J. Cancer 2013, 109, 2654–2664. [Google Scholar] [CrossRef]
- Asnaghi, L.; Gezgin, G.; Tripathy, A.; Handa, J.T.; Merbs, S.L.; van der Velden, P.A.; Jager, M.J.; Harbour, J.W.; Eberhart, C.G. EMT-associated factors promote invasive properties of uveal melanoma cells. Mol. Vis. 2015, 21, 919–929. [Google Scholar]
- Ma, H.; Takahashi, A.; Yoshida, Y.; Adachi, A.; Kanai, T.; Ohno, T.; Nakano, T. Combining carbon ion irradiation and non-homologous end-joining repair inhibitor NU7026 efficiently kills cancer cells. Radiat. Oncol. 2015, 10, 255. [Google Scholar] [CrossRef]
- Fontana, A.O.; Augsburger, M.A.; Grosse, N.; Guckenberger, M.; Lomax, A.J.; Sartori, A.A.; Pruschy, M.N. Differential DNA repair pathway choice in cancer cells after proton- and photon-irradiation. Radiother. Oncol. 2015, 116, 374–380. [Google Scholar] [CrossRef]
- Dolman, M.E.; van der Ploeg, I.; Koster, J.; Bate-Eya, L.T.; Versteeg, R.; Caron, H.N.; Molenaar, J.J. DNA-Dependent Protein Kinase as Molecular Target for Radiosensitization of Neuroblastoma Cells. PLoS One 2015, 10, e0145744. [Google Scholar] [CrossRef]
- Friedberg, E.C. DNA damage and repair. Nature 2003, 421, 436–440. [Google Scholar] [CrossRef]
- Zhou, B.B.; Elledge, S.J. The DNA damage response: Putting checkpoints in perspective. Nature 2000, 408, 433–439. [Google Scholar] [CrossRef]
- Shields, C.L.; Ganguly, A.; Bianciotto, C.G.; Turaka, K.; Tavallali, A.; Shields, J.A. Prognosis of Uveal Melanoma in 500 Cases Using Genetic Testing of Fine-Needle Aspiration Biopsy Specimens. Ophthalmology 2011, 118, 396–401. [Google Scholar] [CrossRef]
- Jensen, D.E.; Proctor, M.; Marquis, S.T.; Gardner, H.P.; Ha, S.I.; Chodosh, L.A.; Ishov, A.M.; Tommerup, N.; Vissing, H.; Sekido, Y.; et al. BAP1: A novel ubiquitin hydrolase which binds to the BRCA1 RING finger and enhances BRCA1-mediated cell growth suppression. Oncogene 1998, 16, 1097–1112. [Google Scholar] [CrossRef]
- Nishikawa, H.; Wu, W.; Koike, A.; Kojima, R.; Gomi, H.; Fukuda, M.; Ohta, T. BRCA1-associated protein 1 interferes with BRCA1/BARD1 RING heterodimer activity. Cancer Res. 2009, 69, 111–119. [Google Scholar] [CrossRef]
- Ismail, I.H.; Davidson, R.; Gagne, J.P.; Xu, Z.Z.; Poirier, G.G.; Hendzel, M.J. Germline mutations in BAP1 impair its function in DNA double-strand break repair. Cancer Res. 2014, 74, 4282–4294. [Google Scholar] [CrossRef]
- Cohn, M.A.; Kee, Y.; Haas, W.; Gygi, S.P.; D’Andrea, A.D. UAF1 is a subunit of multiple deubiquitinating enzyme complexes. J. Biol. Chem. 2009, 284, 5343–5351. [Google Scholar] [CrossRef]
- Kennedy, R.D.; D’Andrea, A.D. The Fanconi Anemia/BRCA pathway: New faces in the crowd. Genes Dev. 2005, 19, 2925–2940. [Google Scholar] [CrossRef]
- Dunn, J.; Potter, M.; Rees, A.; Runger, T.M. Activation of the Fanconi anemia/BRCA pathway and recombination repair in the cellular response to solar ultraviolet light. Cancer Res. 2006, 66, 11140–11147. [Google Scholar] [CrossRef]
- Nijman, S.M.; Huang, T.T.; Dirac, A.M.; Brummelkamp, T.R.; Kerkhoven, R.M.; D’Andrea, A.D.; Bernards, R. The deubiquitinating enzyme USP1 regulates the Fanconi anemia pathway. Mol. Cell 2005, 17, 331–339. [Google Scholar] [CrossRef]
- Cohn, M.A.; Kowal, P.; Yang, K.; Haas, W.; Huang, T.T.; Gygi, S.P.; D’Andrea, A.D. A UAF1-containing multisubunit protein complex regulates the Fanconi anemia pathway. Mol. Cell 2007, 28, 786–797. [Google Scholar] [CrossRef]
- Park, E.; Kim, J.M.; Primack, B.; Weinstock, D.M.; Moreau, L.A.; Parmar, K.; D’Andrea, A.D. Inactivation of Uaf1 causes defective homologous recombination and early embryonic lethality in mice. Mol. Cell. Biol. 2013, 33, 4360–4370. [Google Scholar] [CrossRef]
- Sands, A.T.; Abuin, A.; Sanchez, A.; Conti, C.J.; Bradley, A. High susceptibility to ultraviolet-induced carcinogenesis in mice lacking XPC. Nature 1995, 377, 162–165. [Google Scholar] [CrossRef]
- De Laat, W.L.; Jaspers, N.G.; Hoeijmakers, J.H. Molecular mechanism of nucleotide excision repair. Genes Dev. 1999, 13, 768–785. [Google Scholar] [CrossRef]
- Sugasawa, K.; Ng, J.M.; Masutani, C.; Iwai, S.; van der Spek, P.J.; Eker, A.P.; Hanaoka, F.; Bootsma, D.; Hoeijmakers, J.H. Xeroderma pigmentosum group C protein complex is the initiator of global genome nucleotide excision repair. Mol. Cell 1998, 2, 223–232. [Google Scholar] [CrossRef]
- Volker, M.; Mone, M.J.; Karmakar, P.; van Hoffen, A.; Schul, W.; Vermeulen, W.; Hoeijmakers, J.H.; van Driel, R.; van Zeeland, A.A.; Mullenders, L.H. Sequential assembly of the nucleotide excision repair factors in vivo. Mol. Cell 2001, 8, 213–224. [Google Scholar] [CrossRef]
- Yang, J.; Xu, Z.; Li, J.; Zhang, R.; Zhang, G.; Ji, H.; Song, B.; Chen, Z. XPC epigenetic silence coupled with p53 alteration has a significant impact on bladder cancer outcome. J. Urol. 2010, 184, 336–343. [Google Scholar] [CrossRef]
- Araki, M.; Masutani, C.; Takemura, M.; Uchida, A.; Sugasawa, K.; Kondoh, J.; Ohkuma, Y.; Hanaoka, F. Centrosome protein centrin 2/caltractin 1 is part of the xeroderma pigmentosum group C complex that initiates global genome nucleotide excision repair. J. Biol. Chem. 2001, 276, 18665–18672. [Google Scholar] [CrossRef]
- Ramkumar, H.L.; Brooks, B.P.; Cao, X.; Tamura, D.; Digiovanna, J.J.; Kraemer, K.H.; Chan, C.C. Ophthalmic manifestations and histopathology of xeroderma pigmentosum: Two clinicopathological cases and a review of the literature. Surv. Ophthalmol. 2011, 56, 348–361. [Google Scholar] [CrossRef]
- Sipley, J.D.; Menninger, J.C.; Hartley, K.O.; Ward, D.C.; Jackson, S.P.; Anderson, C.W. Gene for the catalytic subunit of the human DNA-activated protein kinase maps to the site of the XRCC7 gene on chromosome 8. Proc. Nat. Acad. Sci. USA 1995, 92, 7515–7519. [Google Scholar] [CrossRef]
- Jackson, S.P.; Jeggo, P.A. DNA double-strand break repair and V(D)J recombination: Involvement of DNA-PK. Trends Biochem. Sci. 1995, 20, 412–415. [Google Scholar] [CrossRef]
- Yoo, S.; Dynan, W.S. Geometry of a complex formed by double strand break repair proteins at a single DNA end: Recruitment of DNA-PKcs induces inward translocation of Ku protein. Nucleic Acids Res. 1999, 27, 4679–4686. [Google Scholar] [CrossRef]
- An, J.; Huang, Y.C.; Xu, Q.Z.; Zhou, L.J.; Shang, Z.F.; Huang, B.; Wang, Y.; Liu, X.D.; Wu, D.C.; Zhou, P.K. DNA-PKcs plays a dominant role in the regulation of H2AX phosphorylation in response to DNA damage and cell cycle progression. BMC Mol. Biol. 2010, 11, 18. [Google Scholar] [CrossRef]
- Mehta, A.; Haber, J.E. Sources of DNA Double-Strand Breaks and Models of Recombinational DNA Repair. Cold Spring Harb. Perspect. Biol. 2014, 6, a016428. [Google Scholar] [CrossRef]
- Jager, M.J.; Brouwer, N.J.; Esmaeli, B. The Cancer Genome Atlas Project: An integrated molecular view of uveal melanoma. Ophthalmology 2018, 125, 1139–1142. [Google Scholar] [CrossRef]
- Mukherjee, B.; McEllin, B.; Camacho, C.V.; Tomimatsu, N.; Sirasanagandala, S.; Nannepaga, S.; Hatanpaa, K.J.; Mickey, B.; Madden, C.; Maher, E.; et al. EGFRvIII and DNA double-strand break repair: A molecular mechanism for radioresistance in glioblastoma. Cancer Res. 2009, 69, 4252–4259. [Google Scholar] [CrossRef]
- Shintani, S.; Mihara, M.; Li, C.; Nakahara, Y.; Hino, S.; Nakashiro, K.; Hamakawa, H. Up-regulation of DNA-dependent protein kinase correlates with radiation resistance in oral squamous cell carcinoma. Cancer Sci. 2003, 94, 894–900. [Google Scholar] [CrossRef]
- Li, X.; Tian, J.; Bo, Q.; Li, K.; Wang, H.; Liu, T.; Li, J. Targeting DNA-PKcs increased anticancer drug sensitivity by suppressing DNA damage repair in osteosarcoma cell line MG63. Tumour Biol. 2015, 36, 9365–9372. [Google Scholar] [CrossRef]
- Van Oorschot, B.; Granata, G.; Di Franco, S.; ten Cate, R.; Rodermond, H.M.; Todaro, M.; Medema, J.P.; Franken, N.A.P. Targeting DNA double strand break repair with hyperthermia and DNA-PKcs inhibition to enhance the effect of radiation treatment. Oncotarget 2016, 7, 65504–65513. [Google Scholar] [CrossRef]
- Sunada, S.; Kanai, H.; Lee, Y.; Yasuda, T.; Hirakawa, H.; Liu, C.; Fujimori, A.; Uesaka, M.; Okayasu, R. Nontoxic concentration of DNA-PK inhibitor NU7441 radio-sensitizes lung tumor cells with little effect on double strand break repair. Cancer Sci. 2016, 107, 1250–1255. [Google Scholar] [CrossRef]
- Cassoux, N.; Rodrigues, M.J.; Plancher, C.; Asselain, B.; Levy-Gabriel, C.; Lumbroso-Le Rouic, L.; Piperno-Neumann, S.; Dendale, R.; Sastre, X.; Desjardins, L.; et al. Genome-wide profiling is a clinically relevant and affordable prognostic test in posterior uveal melanoma. Br. J. Ophthalmol. 2014, 98, 769–774. [Google Scholar] [CrossRef]
- Ehlers, J.P.; Worley, L.; Onken, M.D.; Harbour, J.W. DDEF1 is located in an amplified region of chromosome 8q and is overexpressed in uveal melanoma. Clin. Cancer Res. 2005, 11, 3609–3613. [Google Scholar] [CrossRef]
- Huang, B.; Shang, Z.F.; Li, B.; Wang, Y.; Liu, X.D.; Zhang, S.M.; Guan, H.; Rang, W.Q.; Hu, J.A.; Zhou, P.K. DNA-PKcs associates with PLK1 and is involved in proper chromosome segregation and cytokinesis. J. Cell. Biochem. 2014, 115, 1077–1088. [Google Scholar] [CrossRef]
- Kotula, E.; Berthault, N.; Agrario, C.; Lienafa, M.C.; Simon, A.; Dingli, F.; Loew, D.; Sibut, V.; Saule, S.; Dutreix, M. DNA-PKcs plays role in cancer metastasis through regulation of secreted proteins involved in migration and invasion. Cell Cycle 2015, 14, 1961–1972. [Google Scholar] [CrossRef]
- Kang, G.Y.; Pyun, B.J.; Seo, H.R.; Jin, Y.B.; Lee, H.J.; Lee, Y.J.; Lee, Y.S. Inhibition of Snail1-DNA-PKcs protein-protein interface sensitizes cancer cells and inhibits tumor metastasis. J. Biol. Chem. 2013, 288, 32506–32516. [Google Scholar] [CrossRef]
- Velic, D.; Couturier, A.M.; Ferreira, M.T.; Rodrigue, A.; Poirier, G.G.; Fleury, F.; Masson, J.Y. DNA Damage Signalling and Repair Inhibitors: The Long-Sought-After Achilles’ Heel of Cancer. Biomolecules 2015, 5, 3204–3259. [Google Scholar] [CrossRef]
- Amaro, A.; Mirisola, V.; Angelini, G.; Musso, A.; Tosetti, F.; Esposito, A.I.; Perri, P.; Lanza, F.; Nasciuti, F.; Mosci, C.; et al. Evidence of epidermal growth factor receptor expression in uveal melanoma: Inhibition of epidermal growth factor-mediated signalling by Gefitinib and Cetuximab triggered antibody-dependent cellular cytotoxicity. Eur. J. Cancer 2013, 49, 3353–3365. [Google Scholar] [CrossRef]
- McLean, I.W.; Foster, W.D.; Zimmerman, L.E.; Gamel, J.W. Modifications of Callender’s Classification of Uveal Melanoma at the Armed Forces Institute of Pathology. Am. J. Ophthalmol. 2018, 195, lvi–lx. [Google Scholar] [CrossRef]
- Amin, M.B. The American Joint Committee on Cancer: AJCC Cancer Staging Manual, 8th ed.; Springer International Publishing: New York, NY, USA, 2017; pp. 805–818. [Google Scholar] [CrossRef]
- Chen, P.W.; Murray, T.G.; Uno, T.; Salgaller, M.L.; Reddy, R.; Ksander, B.R. Expression of MAGE genes in ocular melanoma during progression from primary to metastatic disease. Clin. Exp. Metastasis 1997, 15, 509–1890. [Google Scholar] [CrossRef]
- Amirouchene-Angelozzi, N.; Nemati, F.; Gentien, D.; Nicolas, A.; Dumont, A.; Carita, G.; Camonis, J.; Desjardins, L.; Cassoux, N.; Piperno-Neumann, S.; et al. Establishment of novel cell lines recapitulating the genetic landscape of uveal melanoma and preclinical validation of mTOR as a therapeutic target. Mol. Oncol. 2014, 8, 1508–1520. [Google Scholar] [CrossRef]
- Luyten, G.P.; Naus, N.C.; Mooy, C.M.; Hagemeijer, A.; Kan-Mitchell, J.; Van Drunen, E.; Vuzevski, V.; De Jong, P.T.; Luider, T.M. Establishment and characterization of primary and metastatic uveal melanoma cell lines. Int. J. Cancer 1996, 66, 380–387. [Google Scholar] [CrossRef]
- De Waard-Siebinga, I.; Blom, D.J.; Griffioen, M.; Schrier, P.I.; Hoogendoorn, E.; Beverstock, G.; Danen, E.H.; Jager, M.J. Establishment and characterization of an uveal melanoma cell line. Int. J. Cancer 1995, 62, 155–161. [Google Scholar] [CrossRef]
- Bengtsson, H.; Irizarry, R.; Carvalho, B.; Speed, T.P. Estimation and assessment of raw copy numbers at the single locus level. Bioinformatics 2008, 24, 759–767. [Google Scholar] [CrossRef]
- Bengtsson, H.; Wirapati, P.; Speed, T.P. A single-array preprocessing method for estimating full-resolution raw copy numbers from all Affymetrix genotyping arrays including GenomeWideSNP 5 & 6. Bioinformatics 2009, 25, 2149–2156. [Google Scholar]


| CHARACTERISTIC | LUMC COHORT (n = 64) Test Set | GENOA and PARIS COHORT (n = 110) Validation Set | TCGA COHORT (n = 80) 2nd Validation Set |
|---|---|---|---|
| Gender | |||
| Female | 31 (48%) | 41 (38%) | 35 (44%) |
| Male | 33 (52%) | 67 (62%) | 45 (56%) |
| Median age at enucleation/diagnosis (TCGA) (range) | 61.6 (12.8–88.4) years | 63.0 (29.0–85.0) years | 61.5 (22.0–86.0) years |
| Median LBD (range) | 13.0 (8.0–30.0) mm | 15.0 (2.0–23.0) mm | 16.8 (10.0–23.6) mm |
| Median prominence (range) | 8.0 (2.0–12.0) mm | 11.1 (3.0–17.0) mm | 11.0 (4.4–16.0) mm |
| AJCC size categories | |||
| T1 | 6 (9%) | 1 (1%) | 0 (0%) |
| T2 | 25 (39%) | 24 (27%) | 14 (18%) |
| T3 | 31 (48%) | 39 (44%) | 32 (40%) |
| T4 | 2 (3%) | 25 (28%) | 34 (43%) |
| Cell type | |||
| Spindle | 22 (34%) | 10 (12%) | 43 (54%) |
| Mixed/epithelioid | 42 (66%) | 71 (88%) | 37 (46%) |
| Chromosome 3 status | |||
| No monosomy 3 | 24 (38%) | 46 (48%) | 43 (54%) * |
| Monosomy 3 | 40 (63%) | 49 (52%) | 37 (46%) |
| Metastasis | |||
| No | 27 (42%) | 54 (49%) | 53 (66%) |
| Yes | 37 (58%) | 56 (51%) | 27 (34%) |
| A. Higher expression in Monosomy 3 tumors | ||||||
| GENE | CHARACTERISTICS OF GENE | EXPRESSION Median (Range) | p-VALUES | |||
| Pathway | Chromosome Location | Disomy 3 (n = 24) | Monosomy 3 (n = 40) | p-Value | Corrected p-Value | |
| CENPX | FA | 17q25.3 | 9.3 (8.9–10.3) | 9.7 (9.0–10.6) | <0.001 | <0.001 |
| DDB1 | NER | 11q12.2 | 12.1 (11.3–13.0) | 12.4 (11.7–13.0) | 0.001 | 0.04 |
| PRKDC | DSBR | 8q11.21 | 8.0 (7.3–8.6) | 8.8 (7.8–10.2) | <0.001 | <0.001 |
| B. Lower expression in Monosomy 3 tumors | ||||||
| GENE | CHARACTERISTICS OF GENE | EXPRESSION Median (Range) | p-VALUES | |||
| Pathway | Chromosome Location | Disomy 3 (n = 24) | Monosomy 3 (n = 40) | p-Value | Corrected p-Value | |
| APEX1 | BER | 14q11.2 | 11.0 (9.9–11.4) | 10.5 (9.6–11.4) | <0.001 | 0.004 |
| BAP1 | DSBR | 3p21.1 | 8.0 (6.6–8.5) | 7.4 (6.4–8.1) | <0.001 | <0.001 |
| CETN2 | NER | Xq28 | 10.2 (9.7–11.2) | 9.9 (9.3–10.7) | <0.001 | 0.002 |
| GTF2H4 | NER | 6p21.33 | 8.5 (6.9–9.4) | 7.9 (7.2–9.3) | <0.001 | <0.001 |
| MLH1 | MMR/FA | 3p22.2 | 8.2 (7.5–8.8) | 7.8 (7.1–8.3) | <0.001 | <0.001 |
| RMI2 | DSBR | 16p13.13 | 7.2 (6.7–7.7) | 6.9 (6.5–7.7) | <0.001 | 0.02 |
| RPA1 | DSBR/MMR/NER | 17p13.3 | 8.7 (7.7–9.2) | 8.3 (7.4–8.9) | 0.001 | 0.04 |
| SEM1 | DSBR | 7q21.3 | 7.7 (7.3–8.4) | 7.4 (6.8–8.0) | <0.001 | 0.01 |
| WDR48 | FA | 3p22.2 | 8.2 (7.4–8.6) | 7.6 (7.2–8.2) | <0.001 | <0.001 |
| XPC | NER | 3p25.1 | 9.2 (8.3–9.7) | 8.6 (8.0–9.3) | <0.001 | <0.001 |
| GENE | CHARACTERISTICS OF GENE | EXPRESSION Median (Range) | p-Value | ||
|---|---|---|---|---|---|
| Pathway | Chromosome Location | No Aberrant Copy Number | Aberrant Copy Number | ||
| BAP1 | DSBR | 3p21.1 | 8.0 (6.6–8.5) n = 24 | 7.4 (6.4–8.1) n = 40 | <0.001 |
| FANCE | FA/DSBR | 6p21.31 | 7.4 (6.8–8.2) n = 43 | 7.9 (6.9–8.6) n = 21 | <0.001 |
| GTF2H4 | NER | 6p21.33 | 7.9 (6.9–8.5) n = 43 | 8.5 (7.8–9.4) n = 21 | <0.001 |
| GTF2H5 | NER | 6q25.3 | 10.3 (9.4–11.2) n = 53 | 9.9 (9.3–10.4) n = 11 | 0.004 |
| MBD4 | BER/DSBR | 3q21.3 | 8.4 (7.5–9.9) n = 24 | 8.1 (7.5–9.3) n = 40 | 0.33 |
| MLH1 | MMR/FA | 3p22.2 | 8.2 (7.5–8.8) n = 24 | 7.8 (7.1–8.3) n = 40 | <0.001 |
| NBN | DSBR | 8q21.3 | 7.9 (7.3–8.3) n = 19 | 8.2 (7.4–9.2) n = 45 | <0.001 |
| POLB | BER | 8p11.21 | 10.0 (8.6–10.9) n = 49 | 8.9 (8.1–10.2) n = 15 | <0.001 |
| PRKDC | DSBR | 8q11.21 | 8.0 (7.5–8.5) n = 19 | 8.7 (7.3–10.2) n = 45 | <0.001 |
| WDR48 | FA | 3p22.2 | 8.2 (7.4–8.6) n = 24 | 7.6 (7.2–8.2) n = 40 | <0.001 |
| XPC | NER | 3p25.1 | 9.2 (8.3–9.7) n = 24 | 8.6 (8.0–9.3) n = 40 | <0.001 |
| GENE | CHARACTERISTICS OF GENE | LUMC COHORT (n = 64) Test Set | GENOA & PARIS COHORT (n = 110) Validation Set | TCGA COHORT (n = 80) 2nd Validation Set | Validated Genes | |
|---|---|---|---|---|---|---|
| Pathway | Chromosome Location | |||||
| CENPX | FA | 17q25.3 | <0.001 | 0.09 | 0.03 | |
| DDB1 | NER | 11q12.2 | 0.48 | 0.75 | 0.22 | |
| PRKDC | DSBR | 8q11.21 | 0.001 | 0.005/0.01/<0.001 | 0.002 | PRKDC * |
| APEX1 | BER | 14q11.2 | 0.05 | 0.77 | 0.04 | |
| BAP1 | DSBR | 3p21.1 | 0.001 | <0.001/0.15 | <0.001 | BAP1 † |
| CETN2 | NER | Xq28 | 0.18 | 0.04 | 0.001 | |
| GTF2H4 | NER | 6p21.33 | 0.001 | 0.97 | 0.001 | |
| MLH1 | MMR/FA | 3p22.2 | 0.07 | 0.005 | 0.08 | |
| RMI2 | DSBR | 16p13.13 | 0.02 | 0.63 | 0.005 | |
| RPA1 | DSBR/MMR/NER | 17p13.3 | 0.41 | 0.39/0.26/0.002 | 0.04 | |
| SEM1 | DSBR | 7q21.3 | 0.006 | 0.06 | 0.02 | |
| WDR48 | FA | 3p22.2 | <0.001 | 0.07/0.06/0.04/0.03 | 0.003 | WDR48 † |
| XPC | NER | 3p25.1 | 0.005 | 0.02 | 0.01 | XPC † |
© 2019 by the authors. Licensee MDPI, Basel, Switzerland. This article is an open access article distributed under the terms and conditions of the Creative Commons Attribution (CC BY) license (http://creativecommons.org/licenses/by/4.0/).
Share and Cite
Dogrusöz, M.; Ruschel Trasel, A.; Cao, J.; Ҫolak, S.; van Pelt, S.I.; Kroes, W.G.M.; Teunisse, A.F.A.S.; Alsafadi, S.; van Duinen, S.G.; Luyten, G.P.M.; et al. Differential Expression of DNA Repair Genes in Prognostically-Favorable versus Unfavorable Uveal Melanoma. Cancers 2019, 11, 1104. https://doi.org/10.3390/cancers11081104
Dogrusöz M, Ruschel Trasel A, Cao J, Ҫolak S, van Pelt SI, Kroes WGM, Teunisse AFAS, Alsafadi S, van Duinen SG, Luyten GPM, et al. Differential Expression of DNA Repair Genes in Prognostically-Favorable versus Unfavorable Uveal Melanoma. Cancers. 2019; 11(8):1104. https://doi.org/10.3390/cancers11081104
Chicago/Turabian StyleDogrusöz, Mehmet, Andrea Ruschel Trasel, Jinfeng Cao, Selҫuk Ҫolak, Sake I. van Pelt, Wilma G. M. Kroes, Amina F. A. S. Teunisse, Samar Alsafadi, Sjoerd G. van Duinen, Gregorius P. M. Luyten, and et al. 2019. "Differential Expression of DNA Repair Genes in Prognostically-Favorable versus Unfavorable Uveal Melanoma" Cancers 11, no. 8: 1104. https://doi.org/10.3390/cancers11081104
APA StyleDogrusöz, M., Ruschel Trasel, A., Cao, J., Ҫolak, S., van Pelt, S. I., Kroes, W. G. M., Teunisse, A. F. A. S., Alsafadi, S., van Duinen, S. G., Luyten, G. P. M., van der Velden, P. A., Amaro, A., Pfeffer, U., Jochemsen, A. G., & Jager, M. J. (2019). Differential Expression of DNA Repair Genes in Prognostically-Favorable versus Unfavorable Uveal Melanoma. Cancers, 11(8), 1104. https://doi.org/10.3390/cancers11081104