mTOR Inhibitors Can Enhance the Anti-Tumor Effects of DNA Vaccines through Modulating Dendritic Cell Function in the Tumor Microenvironment


 , and
, and 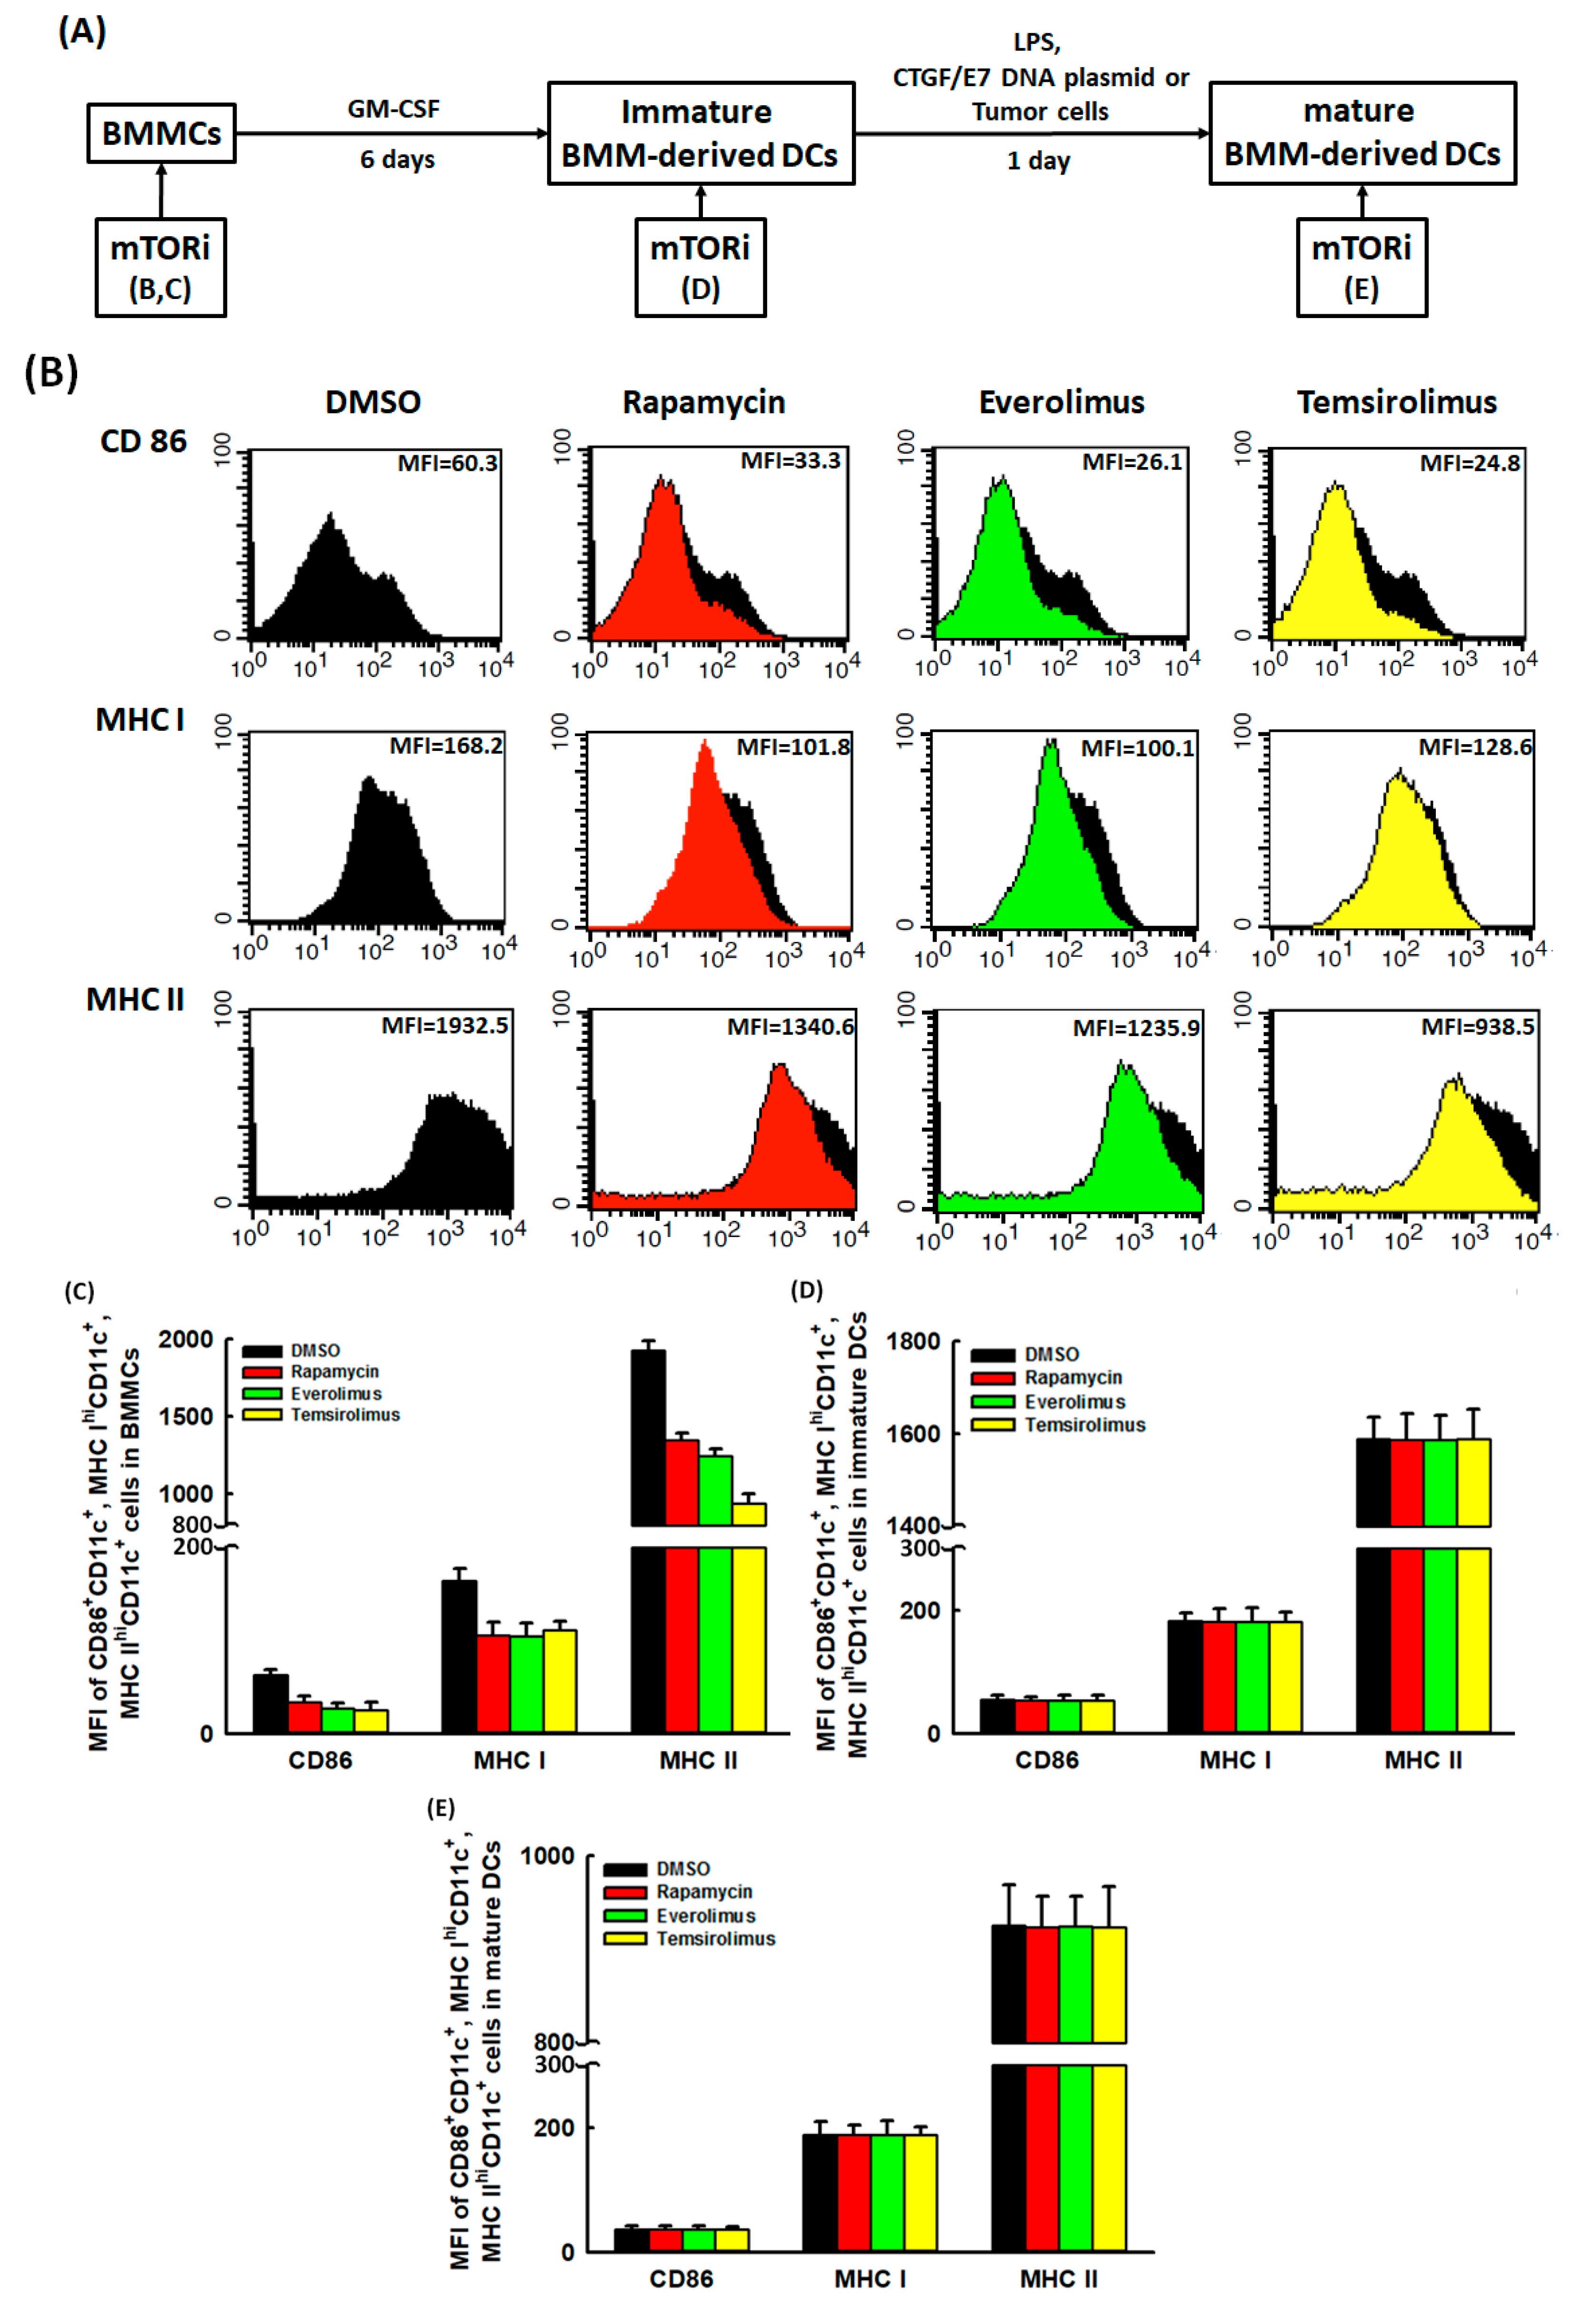
Abstract
1. Introduction
2. Results
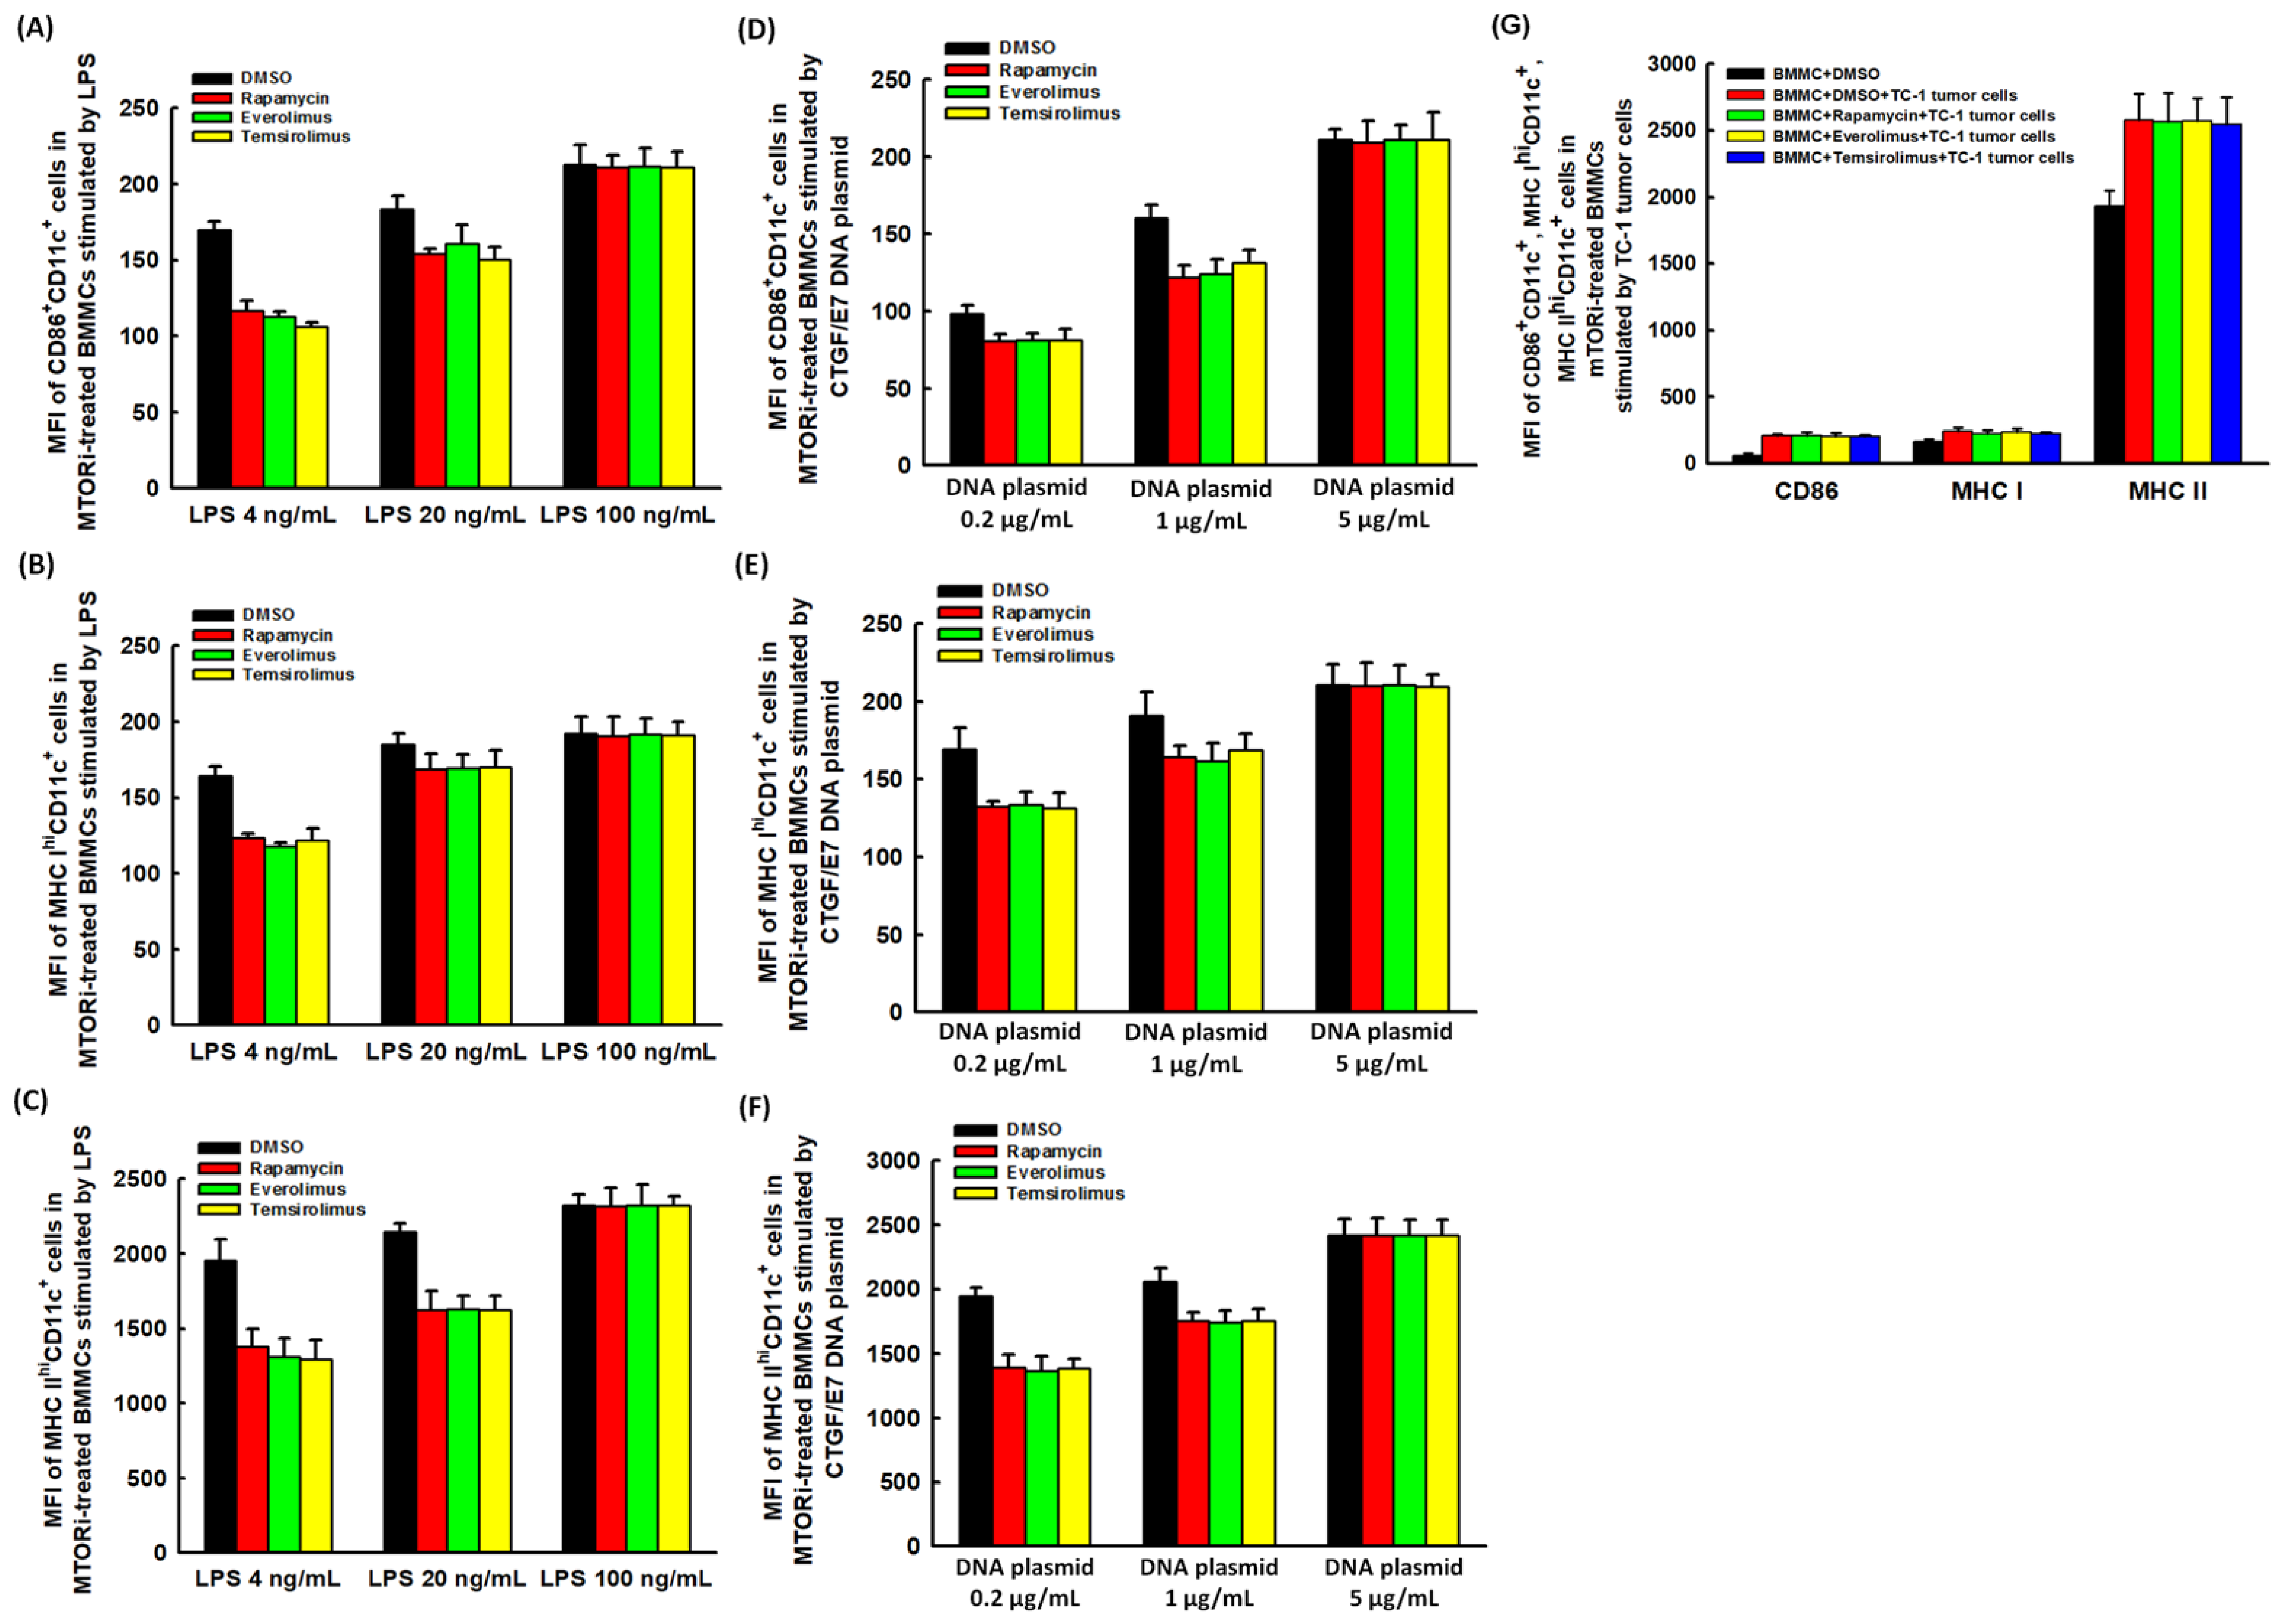
2.1. Suppressive Effects of mTORi on the DC Maturation Markers Expressed on BMMCs Could Be Reversed
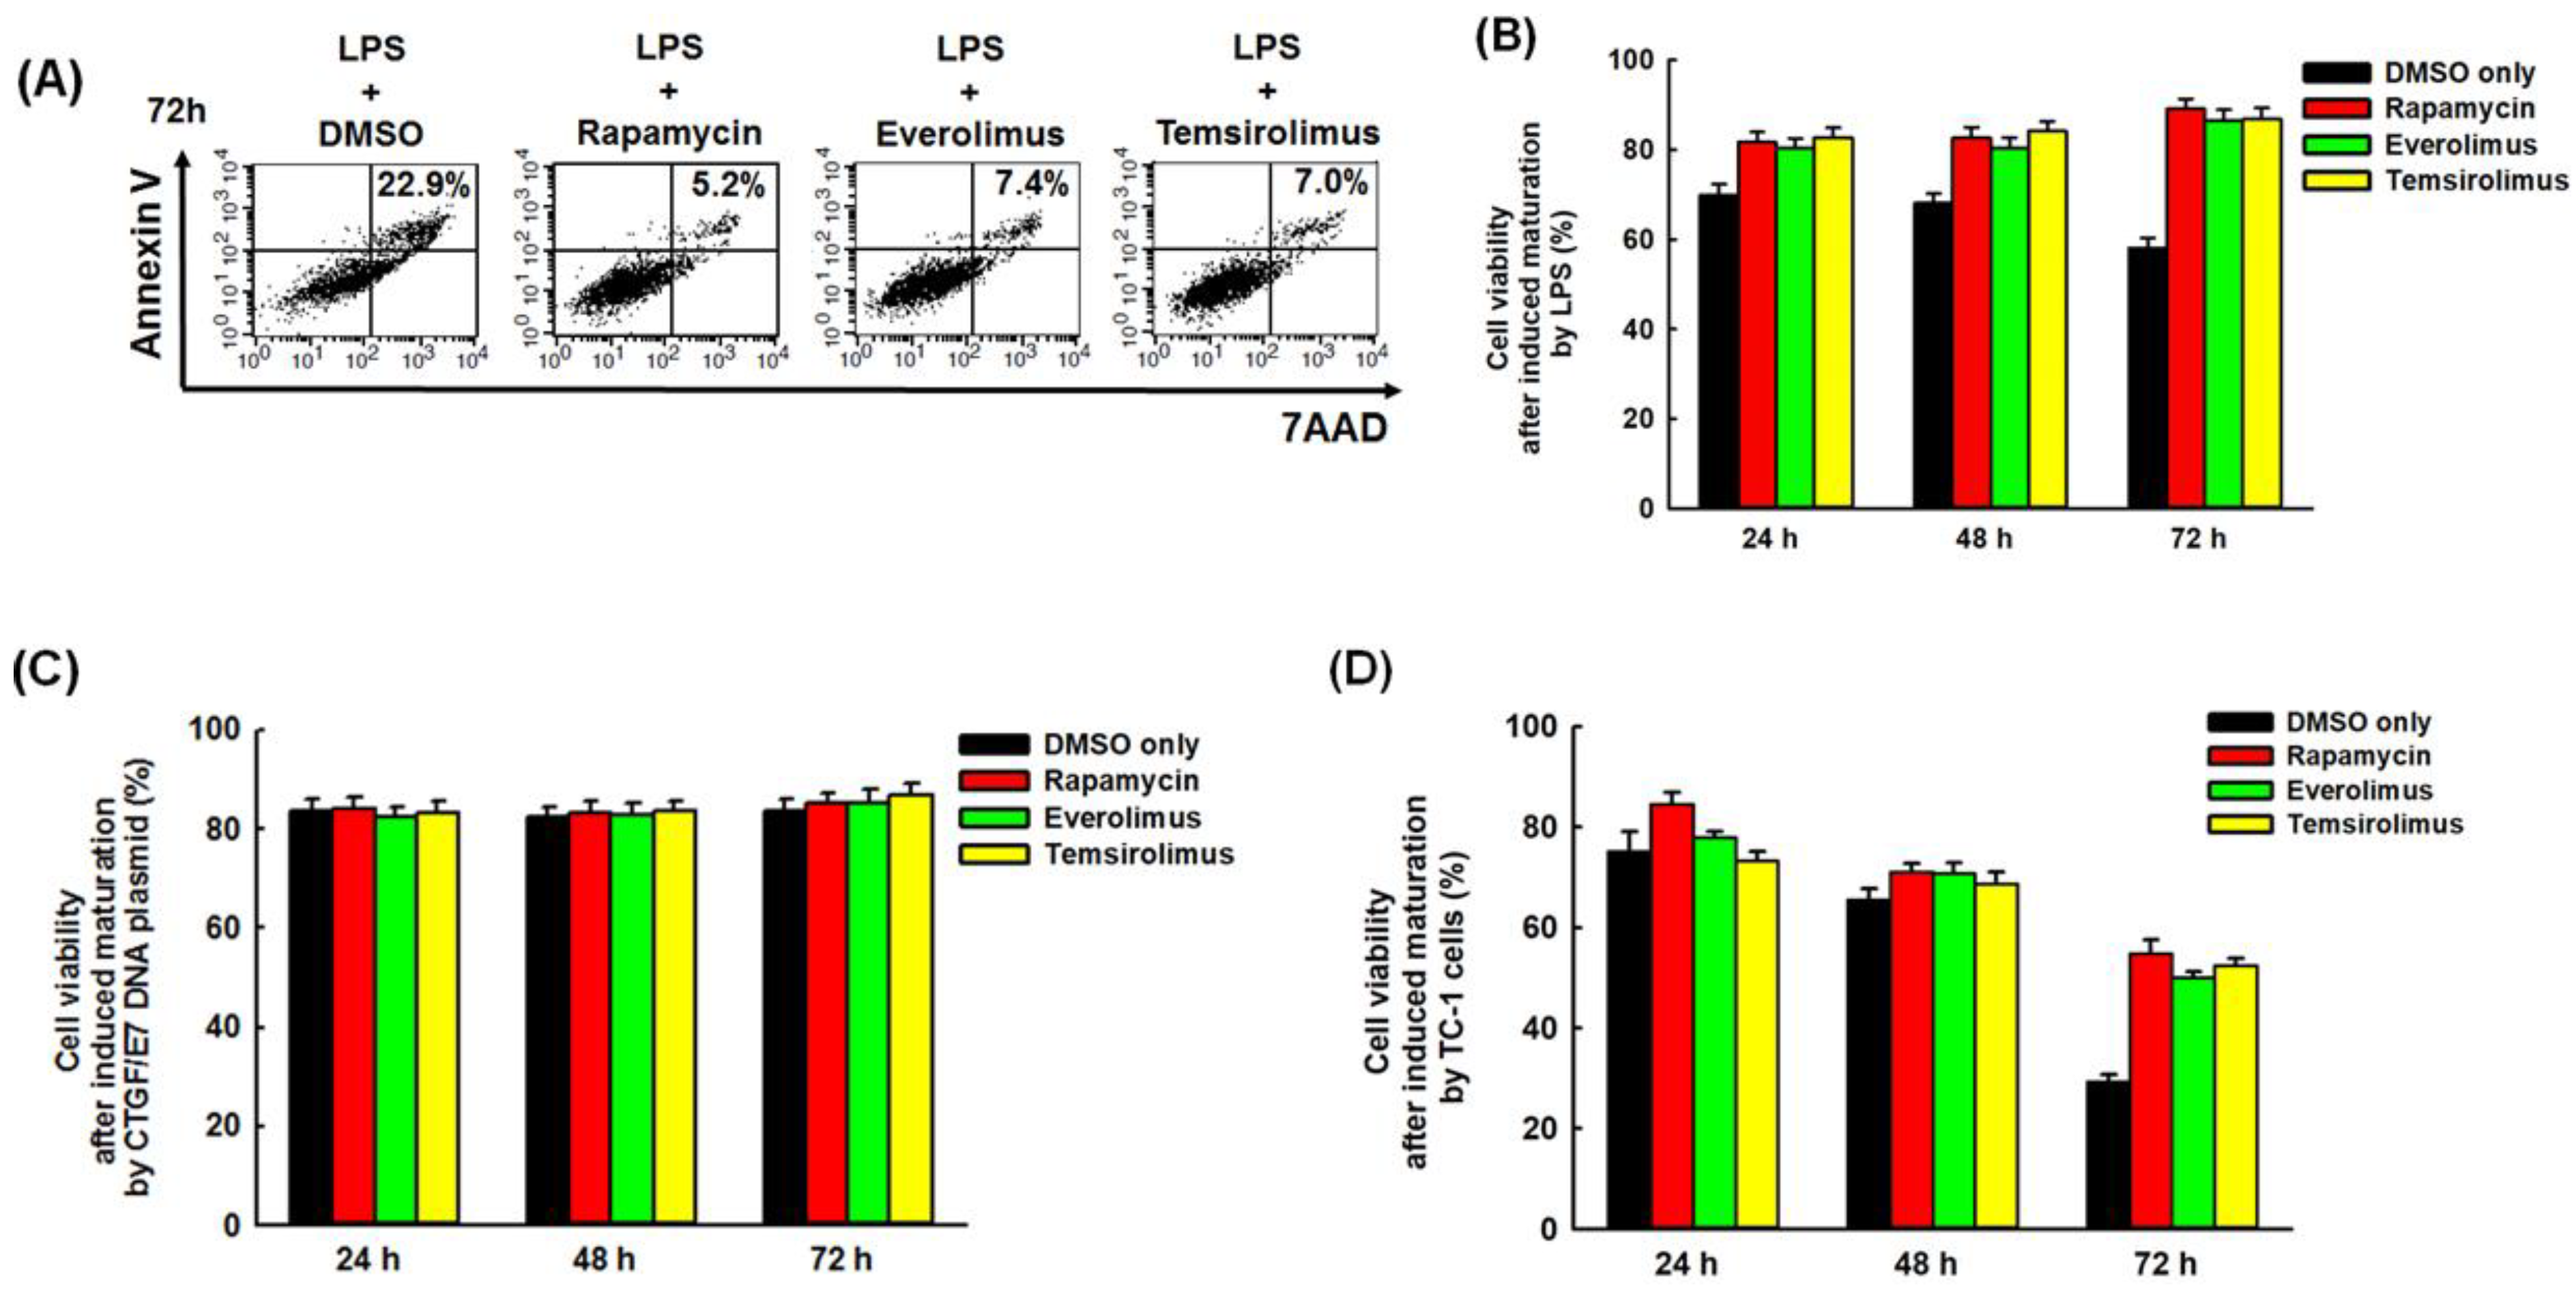
2.2. Mature BMM-Derived DCs Treated with mTORi Tended to Be Non-Apoptotic
2.3. mTORi-Treated BMM-Derived DCs Could Have Better Abilities of Antigen Presenting and Processing
2.4. In Vitro Tumoricidal Activity of E7-Specific Cytotoxic CD8+ T Lymphocytes Could Be Increased by mTORi-Treated BMM-Derived DCs
2.5. Expression of Apoptotic Molecules, Bad or Bak Can Be Inhibited in BMM-Derived DCs Treated with mTORi
2.6. mTORi Could Enhance the Anti-Tumor Effects of CTGF/E7 DNA Vaccine to Extend the Survivals of Tumor-Bearing Mice
3. Discussion
4. Materials and Methods
4.1. Mice
4.2. Cell Line
4.3. Preparation of DNA Construct and DNA Bullet
4.4. Generation of Immature BMM-Derived DCs
4.5. Maturation of BMM-Derived DCs Stimulated by LPS, CTGF/E7 DNA Plasmid and TC-1 Tumor Cells
4.6. Flow Cytometric Analysis of the Surface Markers of BMM-Derived DCs
4.7. In Vitro Apoptosis Assay of BMM-Derived DCs by Flow Cytometric Analyses
4.8. In Vitro Antigen Presentation Ability of BMM-Derived DCs Treated with mTORi
4.9. In Vitro Antigen Processing Ability of BMM-Derived DCs Treated with mTORi
4.10. In Vitro Anti-Tumor Activity of E7-Specific Cytotoxic CD8+ T Lymphocytes Activated by BMM-Derived DCs Treated with mTORi
4.11. Western Blot Analysis of BMM-Derived DCs Treated with mTORi
4.12. In Vivo Tumor Treatment
4.13. MTT Cytotoxicity Assay
4.14. Preparation of Lymphocytes from Tumor-Associated Draining Lymph Nodes and Tumors
4.15. Intracellular Interferon-γ Cytokine and MHC I-Restricted E7 peptide H-2Db Tetramer Staining by Flow Cytometric Analysis
4.16. Statistical Analysis
5. Conclusions
Supplementary Materials
Author Contributions
Funding
Conflicts of Interest
References
- Le Gall, C.M.; Weiden, J.; Eggermont, L.J.; Figdor, C.G. Dendritic cells in cancer immunotherapy. Nat. Mater. 2018, 17, 474–475. [Google Scholar] [CrossRef]
- Shang, N.; Figini, M.; Shangguan, J.; Wang, B.; Sun, C.; Pan, L.; Ma, Q.; Zhang, Z. Dendritic cells based immunotherapy. Am. J. Cancer Res. 2017, 7, 2091–2102. [Google Scholar] [PubMed]
- Nestle, F.O.; Burg, G.; Fäh, J.; Wrone-Smith, T.; Nickoloff, B.J. Human sunlight-induced basal-cell-carcinoma-associated dendritic cells are deficient in T cell co-stimulatory molecules and are impaired as antigen-presenting cells. Am. J. Pathol. 1997, 150, 641–651. [Google Scholar]
- Enk, A.H.; Jonuleit, H.; Saloga, J.; Knop, J. Dendritic cells as mediators of tumor-induced tolerance in metastatic melanoma. Int. J. Cancer 1997, 73, 309–316. [Google Scholar] [CrossRef]
- Thurnher, M.; Radmayr, C.; Ramoner, R.; Ebner, S.; Böck, G.; Klocker, H.; Romani, N.; Bartsch, G. Human renal-cell carcinoma tissue contains dendritic cells. Int. J. Cancer 1996, 68, 1–7. [Google Scholar] [CrossRef]
- Kamath, A.T.; Henri, S.; Battye, F.; Tough, D.F.; Shortman, K. Developmental kinetics and lifespan of dendritic cells in mouse lymphoid organs. Blood 2002, 100, 1734–1741. [Google Scholar] [PubMed]
- Amiel, E.; Everts, B.; Freitas, T.C.; King, I.L.; Curtis, J.D.; Pearce, E.L.; Pearce, E.J. Inhibition of mechanistic target of rapamycin promotes dendritic cell activation and enhances therapeutic autologous vaccination in mice. J. Immunol. 2012, 189, 2151–2158. [Google Scholar] [CrossRef]
- Gabrilovich, D.I.; Chen, H.L.; Girgis, K.R.; Cunningham, H.T.; Meny, G.M.; Nadaf, S.; Kavanaugh, D.; Carbone, D.P. Production of vascular endothelial growth factor by human tumors inhibits the functional maturation of dendritic cells. Nat. Med. 1996, 2, 1096–1103. [Google Scholar] [CrossRef] [PubMed]
- Merad, M.; Sugie, T.; Engleman, E.G.; Fong, L. In vivo manipulation of dendritic cells to induce therapeutic immunity. Blood 2002, 99, 1676–1682. [Google Scholar] [CrossRef] [PubMed]
- Krawczyk, C.M.; Holowka, T.; Sun, J.; Blagih, J.; Amiel, E.; DeBerardinis, R.J.; Cross, J.R.; Jung, E.; Thompson, C.B.; Jones, R.G.; et al. Toll-like receptor-induced changes in glycolytic metabolism regulate dendritic cell activation. Blood 2010, 115, 4742–4749. [Google Scholar] [CrossRef] [PubMed]
- Düvel, K.; Yecies, J.L.; Menon, S.; Raman, P.; Lipovsky, A.I.; Souza, A.L.; Triantafellow, E.; Ma, Q.; Gorski, R.; Cleaver, S.; et al. Activation of a metabolic gene regulatory network downstream of mTOR complex 1. Mol. Cell 2010, 39, 171–183. [Google Scholar] [CrossRef] [PubMed]
- Csibi, A.; Blenis, J. Appetite for destruction: the inhibition of glycolysis as a therapy for tuberous sclerosis complex-related tumors. BMC Biol. 2011, 9, 69. [Google Scholar] [CrossRef] [PubMed]
- Li, Y.; Liu, L.; Tollefsbol, T.O. Glucose restriction can extend normal cell lifespan and impair precancerous cell growth through epigenetic control of hTERT and p16 expression. FASEB J. 2010, 24, 1442–1453. [Google Scholar] [CrossRef]
- Li, Y.; Tollefsbol, T.O. p16(INK4a) suppression by glucose restriction contributes to human cellular lifespan extension through SIRT1-mediated epigenetic and genetic mechanisms. PLoS ONE 2011, 6, e17421. [Google Scholar]
- Bjedov, I.; Toivonen, J.M.; Kerr, F.; Slack, C.; Jacobson, J.; Foley, A.; Partridge, L. Mechanisms of life span extension by rapamycin in the fruit fly Drosophila melanogaster. Cell Metab. 2010, 11, 35–46. [Google Scholar] [CrossRef] [PubMed]
- Bonawitz, N.D.; Chatenay-Lapointe, M.; Pan, Y.; Shadel, G.S. Reduced TOR signaling extends chronological life span via increased respiration and upregulation of mitochondrial gene expression. Cell Metab. 2007, 5, 265–277. [Google Scholar] [CrossRef]
- Harrison, D.E.; Strong, R.; Sharp, Z.D.; Nelson, J.F.; Astle, C.M.; Flurkey, K.; Nadon, N.L.; Wilkinson, J.E.; Frenkel, K.; Carter, C.S.; et al. Rapamycin fed late in life extends lifespan in genetically heterogeneous mice. Nature 2009, 460, 392–395. [Google Scholar] [CrossRef]
- Mellman, I.; Coukos, G.; Dranoff, G. Cancer immunotherapy comes of age. Nature 2011, 80, 480–489. [Google Scholar] [CrossRef] [PubMed]
- Palucka, K.; Banchereau, J.; Mellman, I. Designing vaccines based on biology of human dendritic cell subsets. Immunity 2010, 33, 464–478. [Google Scholar] [CrossRef]
- Darrasse-Jèze, G.; Deroubaix, S.; Mouquet, H.; Victora, G.D.; Eisenreich, T.; Yao, K.H.; Masilamani, R.F.; Dustin, M.L.; Rudensky, A.; Liu, K.; et al. Feedback control of regulatory T cell homeostasis by dendritic cells in vivo. J. Exp. Med. 2009, 206, 1853–1862. [Google Scholar] [CrossRef]
- Jiang, A.; Bloom, O.; Ono, S.; Cui, W.; Unternaehrer, J.; Jiang, S.; Whitney, J.A.; Connolly, J.; Banchereau, J.; Mellman, I. Disruption of E-cadherin-mediated adhesion induces a functionally distinct pathway of dendritic cell maturation. Immunity 2007, 27, 610–624. [Google Scholar] [CrossRef]
- Steinman, R.M.; Turley, S.; Mellman, I.; Inaba, K. The induction of tolerance by dendritic cells that have captured apoptotic cells. J. Exp. Med. 2000, 191, 411–416. [Google Scholar] [CrossRef]
- Steinman, R.M.; Hawiger, D.; Nussenzweig, M.C. Tolerogenic dendritic cells. Annu. Rev. Immunol. 2003, 21, 685–711. [Google Scholar] [CrossRef] [PubMed]
- Idoyaga, J.; Moreno, J.; Bonifaz, L. Tumor cells prevent mouse dendritic cell maturation induced by TLR ligands. Cancer Immunol. Immunother. 2007, 56, 1237–1250. [Google Scholar] [CrossRef]
- Michielsen, A.J.; Hogan, A.E.; Marry, J.; Tosetto, M.; Cox, F.; Hyland, J.M.; Sheahan, K.D.; O’Donoghue, D.P.; Mulcahy, H.E.; Ryan, E.J.; et al. Tumour tissue microenvironment can inhibit dendritic cell maturation in colorectal cancer. PLoS ONE 2011, 6, e27944. [Google Scholar] [CrossRef]
- Ma, Y.; Shurin, G.V.; Peiyuan, Z.; Shurin, M.R. Dendritic cells in the cancer microenvironment. J. Cancer 2013, 4, 36–44. [Google Scholar] [CrossRef] [PubMed]
- Kiertscher, S.M.; Luo, J.; Dubinett, S.M.; Roth, M.D. Tumors promote altered maturation and early apoptosis of monocyte-derived dendritic cells. J. Immunol. 2000, 164, 1269–1276. [Google Scholar] [CrossRef]
- Amiel, E.; Everts, B.; Fritz, D.; Beauchamp, S.; Ge, B.; Pearce, E.L.; Pearce, E.J. Mechanistic target of rapamycin inhibition extends cellular lifespan in dendritic cells by preserving mitochondrial function. J. Immunol. 2014, 193, 2821–2830. [Google Scholar] [CrossRef]
- Emens, L.A.; Middleton, G. The interplay of immunotherapy and chemotherapy: Harnessing potential synergies. Cancer Immunol. Res. 2015, 3, 436–443. [Google Scholar] [CrossRef]
- Pennell, N.A. Understanding the rationale for immunotherapy in non-small cell lung cancer. Semin. Oncol. 2015, 42, S3–S10. [Google Scholar] [CrossRef] [PubMed]
- Saroj, P.; Verma, M.; Jha, K.K.; Pal, M. An overview on immunomodulation. J. Adv. Scient. Res. 2012, 3, 7–12. [Google Scholar]
- Mineharu, Y.; Kamran, N.; Lowenstein, P.R.; Castro, M.G. Blockade of mTOR signaling via rapamycin combined with immunotherapy augments antiglioma cytotoxic and memory T-cell functions. Mol. Cancer Ther. 2014, 13, 3024–3036. [Google Scholar] [CrossRef] [PubMed]
- Srivastava, M.K.; Zhu, L.; Harris-White, M.; Kar, U.K.; Huang, M.; Johnson, M.F.; Lee, J.M.; Elashoff, D.; Strieter, R.; Dubinett, S.; et al. Myeloid suppressor cell depletion augments antitumor activity in lung cancer. PLoS ONE 2012, 7, e40677. [Google Scholar] [CrossRef]
- Lin, K.Y.; Guarnieri, F.G.; Staveley-O’Carroll, K.F.; Levitsky, H.I.; August, J.T.; Pardoll, D.M.; Wu, T.C. Treatment of established tumors with a novel vaccine that enhances major histocompatibility class II presentation of tumor antigen. Cancer Res. 1996, 56, 21–26. [Google Scholar]
- Cheng, W.F.; Chang, M.C.; Sun, W.Z.; Lee, C.N.; Lin, H.W.; Su, Y.N.; Hsieh, C.Y.; Chen, C.A. Connective tissue growth factor linked to the E7 tumor antigen generates potent antitumor immune responses mediated by an antiapoptotic mechanism. Gene Ther. 2008, 15, 1007–1016. [Google Scholar] [CrossRef] [PubMed]
- Chang, M.C.; Chen, Y.L.; Lin, H.W.; Chiang, Y.C.; Chang, C.F.; Hsieh, S.F.; Chen, C.A.; Sun, W.Z.; Cheng, W.F. Irradiation enhances abscopal anti-tumor effects of antigen-specific immunotherapy through regulating tumor microenvironment. Mol. Ther. 2018, 26, 404–419. [Google Scholar] [CrossRef]
- Chang, M.C.; Chen, Y.L.; Chiang, Y.C.; Cheng, Y.J.; Jen, Y.W.; Chen, C.A.; Cheng, W.F.; Sun, W.Z. Anti-CD40 antibody and toll-like receptor 3 ligand restore dendritic cell-mediated anti-tumor immunity suppressed by morphine. Am. J. Cancer Res. 2016, 6, 157–172. [Google Scholar] [PubMed]
- Alyamkina, E.A.; Leplina, O.Y.; Sakhno, L.V.; Chernykh, E.R.; Ostanin, A.A.; Efremov, Y.R.; Shilov, A.G.; Proskurina, A.S.; Orishchenko, K.E.; Dolgova, E.V.; et al. Effect of double-stranded DNA on maturation of dendritic cells in vitro. Cell Immunol. 2010, 266, 46–51. [Google Scholar] [CrossRef]
- Pirtskhalaishvili, G.; Shurin, G.V.; Esche, C.; Trump, D.L.; Shurin, M.R. TNF-alpha protects dendritic cells from prostate cancer-induced apoptosis. Prostate Cancer Prostatic Dis. 2001, 4, 221–227. [Google Scholar] [CrossRef]
- Sun, N.Y.; Chen, Y.L.; Lin, H.W.; Chiang, Y.C.; Chang, C.F.; Tai, Y.J.; Chen, C.A.; Sun, W.Z.; Chien, C.L.; Cheng, W.F. Immune checkpoint Ab enhances the antigen-specific anti-tumor effects by modulating both dendritic cells and regulatory T lymphocytes. Cancer Lett. 2019, 444, 20–34. [Google Scholar] [CrossRef]
- Chen, Y.L.; Chang, M.C.; Huang, C.Y.; Chiang, Y.C.; Lin, H.W.; Chen, C.A.; Hsieh, C.Y.; Cheng, W.F. Serous ovarian carcinoma patients with high alpha-folate receptor had reducing survival and cytotoxic chemo-response. Mol. Oncol. 2012, 6, 360–369. [Google Scholar] [CrossRef]
- Huang, C.T.; Chang, M.C.; Chen, Y.L.; Chen, T.C.; Chen, C.A.; Cheng, W.F. Insulin-like growth factors inhibit dendritic cell-mediated anti-tumor immunity through regulating ERK1/2 phosphorylation and p38 dephosphorylation. Cancer Lett. 2015, 359, 117–126. [Google Scholar] [CrossRef]
- Gosland, M.P.; Lum, B.L.; Sikic, B.I. Reversal by cefoperazone of resistance to etoposide, doxorubicin, and vinblastine in multidrug resistant human sarcoma cells. Cancer Res. 1989, 49, 6901–6905. [Google Scholar] [PubMed]


© 2019 by the authors. Licensee MDPI, Basel, Switzerland. This article is an open access article distributed under the terms and conditions of the Creative Commons Attribution (CC BY) license (http://creativecommons.org/licenses/by/4.0/).
Share and Cite
Chen, Y.-L.; Lin, H.-W.; Sun, N.-Y.; Yie, J.-C.; Hung, H.-C.; Chen, C.-A.; Sun, W.-Z.; Cheng, W.-F. mTOR Inhibitors Can Enhance the Anti-Tumor Effects of DNA Vaccines through Modulating Dendritic Cell Function in the Tumor Microenvironment. Cancers 2019, 11, 617. https://doi.org/10.3390/cancers11050617
Chen Y-L, Lin H-W, Sun N-Y, Yie J-C, Hung H-C, Chen C-A, Sun W-Z, Cheng W-F. mTOR Inhibitors Can Enhance the Anti-Tumor Effects of DNA Vaccines through Modulating Dendritic Cell Function in the Tumor Microenvironment. Cancers. 2019; 11(5):617. https://doi.org/10.3390/cancers11050617
Chicago/Turabian StyleChen, Yu-Li, Han-Wei Lin, Nai-Yun Sun, Jr-Chi Yie, Hsueh-Chih Hung, Chi-An Chen, Wei-Zen Sun, and Wen-Fang Cheng. 2019. "mTOR Inhibitors Can Enhance the Anti-Tumor Effects of DNA Vaccines through Modulating Dendritic Cell Function in the Tumor Microenvironment" Cancers 11, no. 5: 617. https://doi.org/10.3390/cancers11050617
APA StyleChen, Y.-L., Lin, H.-W., Sun, N.-Y., Yie, J.-C., Hung, H.-C., Chen, C.-A., Sun, W.-Z., & Cheng, W.-F. (2019). mTOR Inhibitors Can Enhance the Anti-Tumor Effects of DNA Vaccines through Modulating Dendritic Cell Function in the Tumor Microenvironment. Cancers, 11(5), 617. https://doi.org/10.3390/cancers11050617