Influence of Body Mass Index on Long-Term Outcome in Patients with Rectal Cancer—A Single Centre Experience


 , ,
, ,
Abstract
:1. Introduction
2. Results
2.1. Subject Characteristics
2.2. Quality Indicators
2.3. Local Recurrence
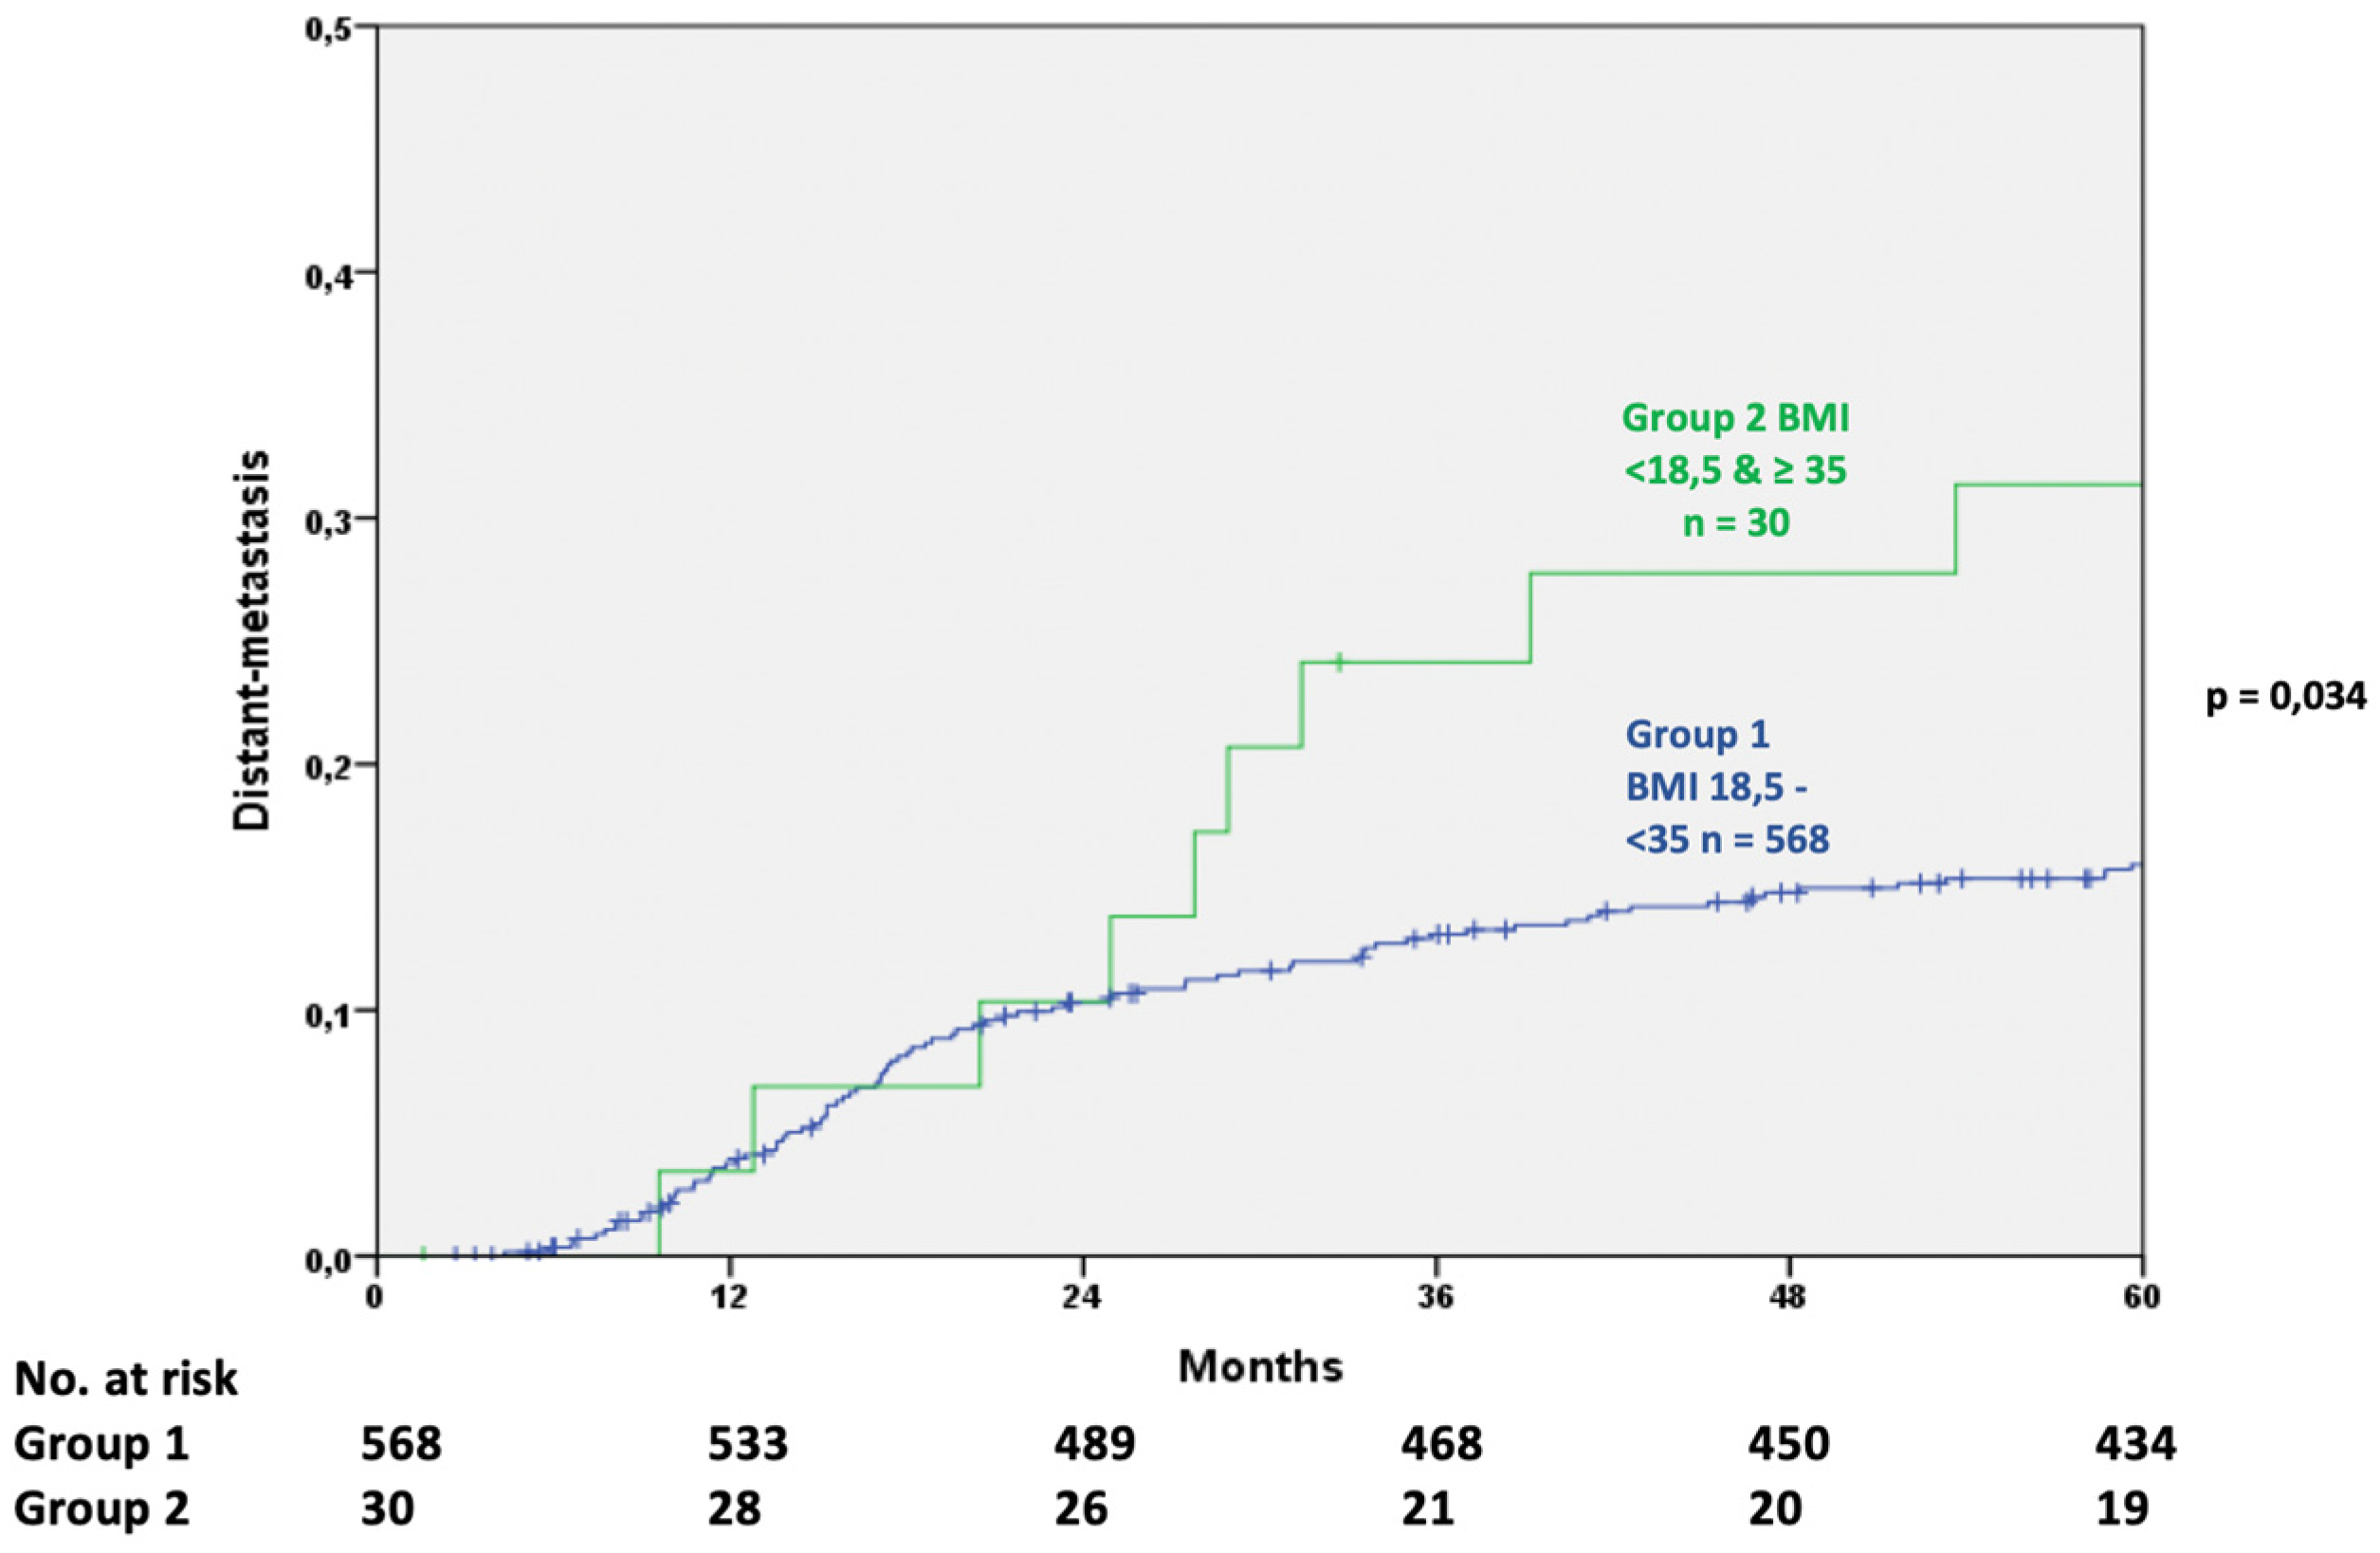
2.4. Distant Metastasis
2.5. Overall Survival
3. Discussion
3.1. Quality Indicators
3.2. Local Recurrence (LR)
3.3. Distant Metastasis (DM)
3.4. Overall Survival
4. Materials and Methods
Statistical Analysis
5. Conclusions
Author Contributions
Funding
Acknowledgments
Conflicts of Interest
References
- Krebs—Datenbankabfrage. Available online: https://www.krebsdaten.de/Krebs/SiteGlobals/Forms/Datenbankabfrage/datenbankabfrage_stufe2_form.html (accessed on 15 December 2017).
- Brenner, H.; Stegmaier, C.; Ziegler, H. Long-term survival of cancer patients in Germany achieved by the beginning of the third millenium. Ann. Oncol. 2005, 16, 981–986. [Google Scholar] [CrossRef]
- Luengo-Fernandez, R.; Leal, J.; Gray, A.; Sullivan, R. Economic burden of cancer across the European Union: A population-based cost analysis. Lancet Oncol. 2013, 14, 1165–1174. [Google Scholar] [CrossRef]
- Deng, T.; Lyon, C.J.; Bergin, S.; Caligiuri, M.A.; Hsueh, W.A. Obesity, Inflammation, and Cancer. Annu. Rev. Pathol. 2016, 11, 421–449. [Google Scholar] [CrossRef]
- Ma, Y.; Yang, Y.; Wang, F.; Zhang, P.; Shi, C.; Zou, Y.; Qin, H. Obesity and risk of colorectal cancer: A systematic review of prospective studies. PLoS ONE 2013, 8, e53916. [Google Scholar] [CrossRef]
- Hoda, M.R.; Keely, S.J.; Bertelsen, L.S.; Junger, W.G.; Dharmasena, D.; Barrett, K.E. Leptin acts as a mitogenic and antiapoptotic factor for colonic cancer cells. Br. J. Surg. 2007, 94, 346–354. [Google Scholar] [CrossRef] [PubMed]
- Giovannucci, E. Physical Activity, Obesity, and Risk for Colon Cancer and Adenoma in Men. Ann. Intern. Med. 1995, 122, 327–334. [Google Scholar] [CrossRef]
- Moghaddam, A.A.; Woodward, M.; Huxley, R. Obesity and Risk of Colorectal Cancer: A Meta-analysis of 31 Studies with 70,000 Events. Cancer Epidemiol. Prev. Biomark. 2007, 16, 2533–2547. [Google Scholar] [CrossRef]
- Gebauer, B.; Meyer, F.; Ptok, H.; Steinert, R.; Otto, R.; Lippert, H.; Gastinger, I. Impact of Body Mass Index on Early Postoperative and Long-Term Outcome after Rectal Cancer Surgery. Visc. Med. 2017, 33, 373–382. [Google Scholar] [CrossRef] [PubMed]
- Klil-Drori, A.J.; Azoulay, L.; Pollak, M.N. Cancer, obesity, diabetes, and antidiabetic drugs: Is the fog clearing? Nat. Rev. Clin. Oncol. 2017, 14, 85–99. [Google Scholar] [CrossRef]
- Larsson, S.C.; Wolk, A. Obesity and colon and rectal cancer risk: A meta-analysis of prospective studies. Am. J. Clin. Nutr. 2007, 86, 556–565. [Google Scholar] [CrossRef]
- Bianchini, F.; Kaaks, R.; Vainio, H. Overweight, obesity, and cancer risk. Lancet Oncol. 2002, 3, 565–574. [Google Scholar] [CrossRef]
- Lee, J.; Meyerhardt, J.A.; Giovannucci, E.; Jeon, J.Y. Association between body mass index and prognosis of colorectal cancer: A meta-analysis of prospective cohort studies. PLoS ONE 2015, 10, e0120706. [Google Scholar] [CrossRef]
- Meyerhardt, J.A.; Tepper, J.E.; Niedzwiecki, D.; Hollis, D.R.; McCollum, A.D.; Brady, D.; O’Connell, M.J.; Mayer, R.J.; Cummings, B.; Willett, C.; et al. Impact of Body Mass Index on Outcomes and Treatment-Related Toxicity in Patients With Stage II and III Rectal Cancer: Findings From Intergroup Trial 0114. J. Clin. Oncol. 2004, 22, 648–657. [Google Scholar] [CrossRef] [PubMed]
- Campbell, P.T.; Newton, C.C.; Dehal, A.N.; Jacobs, E.J.; Patel, A.V.; Gapstur, S.M. Impact of Body Mass Index on Survival After Colorectal Cancer Diagnosis: The Cancer Prevention Study-II Nutrition Cohort. J. Clin. Oncol. 2012, 30, 42–52. [Google Scholar] [CrossRef] [PubMed]
- Fedirko, V.; Romieu, I.; Aleksandrova, K.; Pischon, T.; Trichopoulos, D.; Peeters, P.H.; Romaguera-Bosch, D.; Bueno-de-Mesquita, H.B.; Dahm, C.C.; Overvad, K.; et al. Pre-diagnostic anthropometry and survival after colorectal cancer diagnosis in Western European populations. Int. J. Cancer 2014, 135, 1949–1960. [Google Scholar] [CrossRef]
- Schroen, A.T.; Cress, R.D. Use of Surgical Procedures and Adjuvant Therapy in Rectal Cancer Treatment. Ann. Surg. 2001, 234, 641–651. [Google Scholar] [CrossRef] [PubMed]
- Ciga Lozano, M.Á.; Codina Cazador, A.; Ortiz Hurtado, H. Cancer Project Recto of the Spanish Association of Surgeons Oncological results according to type of resection for rectal cancer. Cir. Esp. 2015, 93, 229–235. [Google Scholar] [CrossRef]
- Warschkow, R.; Ebinger, S.M.; Brunner, W.; Schmied, B.M.; Marti, L. Survival after Abdominoperineal and Sphincter-Preserving Resection in Nonmetastatic Rectal Cancer: A Population-Based Time-Trend and Propensity Score-Matched SEER Analysis. Gastroenterol. Res. Pract. 2017, 2017. [Google Scholar] [CrossRef]
- de Melo, G.M.; Ribeiro, K.C.; Kowalski, L.P.; Deheinzelin, D. Risk factors for postoperative complications in oral cancer and their prognostic implications. Arch. Otolaryngol. Head Neck Surg. 2001, 127, 828–833. [Google Scholar]
- Rizk, N.P.; Bach, P.B.; Schrag, D.; Bains, M.S.; Turnbull, A.D.; Karpeh, M.; Brennan, M.F.; Rusch, V.W. The impact of complications on outcomes after resection for esophageal and gastroesophageal junction carcinoma. J. Am. Coll. Surg. 2004, 198, 42–50. [Google Scholar] [CrossRef] [PubMed]
- Law, W.L.; Choi, H.K.; Lee, Y.M.; Ho, J.W. The impact of postoperative complications on long-term outcomes following curative resection for colorectal cancer. Ann. Surg. Oncol. 2007, 14, 2559–2566. [Google Scholar] [CrossRef]
- Hrabe, J.E.; Sherman, S.K.; Charlton, M.E.; Cromwell, J.W.; Byrn, J.C. Effect of BMI on outcomes in proctectomy. Dis. Colon Rectum 2014, 57, 608–615. [Google Scholar] [CrossRef]
- Bokey, L.; Chapuis, P.H.; Dent, O.F. Impact of obesity on complications after resection for rectal cancer. Colorectal Dis. 2014, 16, 896–906. [Google Scholar] [CrossRef]
- Tjeertes, E.E.K.M.; Hoeks, S.S.E.; Beks, S.S.B.J.C.; Valentijn, T.T.M.; Hoofwijk, A.A.G.M.; Stolker, R.J.R.J. Obesity—A risk factor for postoperative complications in general surgery? BMC Anesthesiol. 2015, 15, 112. [Google Scholar] [CrossRef] [PubMed]
- Merkow, R.P.; Bentrem, D.J.; Mulcahy, M.F.; Chung, J.W.; Abbott, D.E.; Kmiecik, T.E.; Stewart, A.K.; Winchester, D.P.; Ko, C.Y.; Bilimoria, K.Y. Effect of postoperative complications on adjuvant chemotherapy use for stage III colon cancer. Ann. Surg. 2013, 258, 847–853. [Google Scholar] [CrossRef] [PubMed]
- Jin, L.X.; Sanford, D.E.; Squires, M.H.; Moses, L.E.; Yan, Y.; Poultsides, G.A.; Votanopoulos, K.I.; Weber, S.M.; Bloomston, M.; Pawlik, T.M.; et al. Interaction of Postoperative Morbidity and Receipt of Adjuvant Therapy on Long-Term Survival After Resection for Gastric Adenocarcinoma: Results From the U.S. Gastric Cancer Collaborative. Ann. Surg. Oncol. 2016, 23, 2398–2408. [Google Scholar] [CrossRef]
- Donat, S.M.; Shabsigh, A.; Savage, C.; Cronin, A.M.; Bochner, B.H.; Dalbagni, G.; Herr, H.W.; Milowsky, M.I. Potential Impact of Postoperative Early Complications on the Timing of Adjuvant Chemotherapy in Patients Undergoing Radical Cystectomy: A High-Volume Tertiary Cancer Center Experience. Eur. Urol. 2009, 55, 177–186. [Google Scholar] [CrossRef] [PubMed]
- Stipa, S.; Nicolanti, V.; Botti, C.; Cosimelli, M.; Mannella, E.; Stipa, F.; Giannarelli, D.; Bangrazi, C.; Cavaliere, R. Local recurrence after curative resection for colorectal cancer: Frequency, risk factors and treatment. J. Surg. Oncol. Suppl. 1991, 2, 155–160. [Google Scholar] [CrossRef]
- den Dulk, M.; Putter, H.; Collette, L.; Marijnen, C.A.M.; Folkesson, J.; Bosset, J.-F.; Rödel, C.; Bujko, K.; Påhlman, L.; van de Velde, C.J.H. The abdominoperineal resection itself is associated with an adverse outcome: The European experience based on a pooled analysis of five European randomised clinical trials on rectal cancer. Eur. J. Cancer 2009, 45, 1175–1183. [Google Scholar] [CrossRef]
- Kissebah, A.H.; Vydelingum, N.; Murray, R.; Evans, D.J.; Hartz, A.J.; Kalkhoff, R.K.; Adams, P.W. Relation of body fat distribution to metabolic complications of obesity. J. Clin. Endocrinol. Metab. 1982, 54, 254–260. [Google Scholar] [CrossRef]
- Valentinis, B.; Baserga, R. IGF-I receptor signalling in transformation and differentiation. Mol. Pathol. 2001, 54, 133–137. [Google Scholar] [CrossRef]
- Yu, H.; Rohan, T. Role of the insulin-like growth factor family in cancer development and progression. J. Natl. Cancer Inst. 2000, 92, 1472–1489. [Google Scholar] [CrossRef]
- Wang, Z.; Aguilar, E.G.; Luna, J.I.; Dunai, C.; Khuat, L.T.; Le, C.T.; Mirsoian, A.; Minnar, C.M.; Stoffel, K.M.; Sturgill, I.R.; et al. Paradoxical effects of obesity on T cell function during tumor progression and PD-1 checkpoint blockade. Nat. Med. 2019, 25, 141–151. [Google Scholar] [CrossRef]
- Clements, V.K.; Long, T.; Long, R.; Figley, C.; Smith, D.M.C.; Ostrand-Rosenberg, S. Frontline Science: High fat diet and leptin promote tumor progression by inducing myeloid-derived suppressor cells. J. Leukoc. Biol. 2018, 103, 395–407. [Google Scholar] [CrossRef]
- Hakam, A.; Yeatman, T.J.; Lu, L.; Mora, L.; Marcet, G.; Nicosia, S.V.; Karl, R.C.; Coppola, D. Expression of insulin-like growth factor-1 receptor in human colorectal cancer. Hum. Pathol. 1999, 30, 1128–1133. [Google Scholar] [CrossRef]
- Wu, Y.; Yakar, S.; Zhao, L.; Hennighausen, L.; LeRoith, D. Circulating Insulin-like Growth Factor-I Levels Regulate Colon Cancer Growth and Metastasis. Cancer Res. 2002, 62, 1030–1035. [Google Scholar]
- Wu, Y.; Brodt, P.; Sun, H.; Mejia, W.; Novosyadlyy, R.; Nunez, N.; Chen, X.; Mendoza, A.; Hong, S.-H.; Khanna, C.; et al. Insulin-Like Growth Factor-I Regulates the Liver Microenvironment in Obese Mice and Promotes Liver Metastasis. Cancer Res. 2010, 70, 57–67. [Google Scholar] [CrossRef] [PubMed]
- Compton, C.C.; Greene, F.L. The Staging of Colorectal Cancer: 2004 and Beyond. CA Cancer J. Clin. 2004, 54, 295–308. [Google Scholar] [CrossRef]
- Haydon, A.M.M.; MacInnis, R.J.; English, D.R.; Giles, G.G. Effect of physical activity and body size on survival after diagnosis with colorectal cancer. Gut 2006, 55, 62–67. [Google Scholar] [CrossRef]
- Meyerhardt, J.A.; Catalano, P.J.; Haller, D.G.; Mayer, R.J.; Benson, A.B.; Macdonald, J.S.; Fuchs, C.S. Influence of body mass index on outcomes and treatment-related toxicity in patients with colon carcinoma. Cancer 2003, 98, 484–495. [Google Scholar] [CrossRef] [PubMed]
- Das, P.; Skibber, J.; Rodriguez-Bigas, M.; Feig, B.; Chang, G.; Hoff, P.; Eng, C.; Wolff, R.; JanJan, N.; Delclos, M.; et al. Clinical and Pathologic Predictors of Locoregional Recurrence, Distant Metastasis, and Overall Survival in Patients Treated with Chemoradiation and Mesorectal Excision for Rectal Cancer. Am. J. Clin. Oncol. 2006, 29, 219–224. [Google Scholar] [CrossRef]
- Pox, C.; Aretz, S.; Bischoff, S.; Graeven, U.; Hass, M.; Heußner, P.; Hohenberger, W.; Holstege, A.; Hübner, J.; Kolligs, F.; et al. S3-Leitlinie Kolorektales Karzinom, Kurzversion 1.1, AWMF Registrierungsnummer: 021/007OL; Leitlinienprogramm Onkologie: Berlin, Germany, 2014. [Google Scholar]
- Sauer, R.; Becker, H.; Hohenberger, W.; Rödel, C.; Wittekind, C.; Fietkau, R.; Martus, P.; Tschmelitsch, J.; Hager, E.; Hess, C.F.; et al. Preoperative vs. Postoperative Chemoradiotherapy for Rectal Cancer. N. Engl. J. Med. 2004, 351, 1731–1740. [Google Scholar] [CrossRef]
- Sobin, L.; Gospodarowicz, M.; Wittekind, C. TNM Classification of Malignant Tumours, 7th ed.; Available online: https://www.wiley.com/en-us/TNM+Classification+of+Malignant+Tumours%2C+7th+Edition-p-9781444358964 (accessed on 12 August 2018).
- World Health Organization (WHO). Global Database on Body Mass Index. Available online: http://apps.who.int/bmi/index.jsp?introPage=intro_3.html (accessed on 12 August 2018).
- NCD Risk Factor Collaboration (NCD-RisC). Trends in adult body-mass index in 200 countries from 1975 to 2014: A pooled analysis of 1698 population-based measurement studies with 19·2 million participants. Lancet 2016, 387, 1377–1396. [Google Scholar] [CrossRef]
- Quirke, P.; Durdey, P.; Dixon, M.F.; Williams, N.S. Local recurrence of rectal adenocarcinoma due to inadequate surgical resection. Histopathological study of lateral tumour spread and surgical excision. Lancet 1986, 2, 996–999. [Google Scholar] [CrossRef]


| Patient Characteristics | Number | Percent |
|---|---|---|
| Age (years), median (range) | 65 (18–91) | |
| Sex | ||
| Male | 406 | 66.3 |
| Female | 206 | 33.7 |
| BMI Groups | ||
| Group 1 BMI 18.5–35 | 580 | 94.8 |
| Group 2: BMI <18.5 & ≥35 | 32 | 5.2 |
| BMI WHO | ||
| <18.5 underweight | 7 | 1.1 |
| 18.5–24.9 normal weight | 212 | 34.6 |
| 25.0–29.9 overweight | 266 | 43.5 |
| 30.0–34.9 class I obesity | 102 | 16.7 |
| 35.0–39.9 class II obesity | 16 | 2.6 |
| ≥40.0 class III obesity | 9 | 1.5 |
| Tumour site | ||
| <6 cm lower third | 211 | 34.5 |
| 6–12 cm middle third | 276 | 45.1 |
| 12–16 cm upper third | 125 | 20.4 |
| ASA-Score | ||
| ASA 1 & 2 | 490 | 80.1 |
| ASA 3 & 4 | 118 | 19.3 |
| Missing | 4 | 0.7 |
| Pretherapy CEA level | ||
| normal(<5 ng/L) | 438 | 71.6 |
| raised(>10 ng/L) | 94 | 15.4 |
| Missing | 80 | 13.1 |
| Neoadjuvant therapy | ||
| neoadjuvant RCT | 320 | 52.3 |
| neoadjuvant RT | 4 | 0.7 |
| neoadjuvant CT | 1 | 0.2 |
| None | 287 | 46.9 |
| Elective surgery | ||
| Yes | 606 | 99.0 |
| No, Emergency | 6 | 1.0 |
| Type of surgery | ||
| Anterior resection | 77 | 12.6 |
| Low anterior resection | 378 | 61.8 |
| Hartmann procedure | 8 | 1.3 |
| Intersphincteric resection | 50 | 8.2 |
| Abdominoperineal excision | 99 | 16.2 |
| Multivisceral resection | ||
| No | 520 | 85.0 |
| Yes | 92 | 15.0 |
| Postoperative therapy | ||
| None | 70 | 11.4 |
| CT | 171 | 27.9 |
| RT | 4 | 0.7 |
| RCT | 56 | 9.2 |
| unknown | 311 | 50.8 |
| pT-category | ||
| pT1 | 66 | 10.8 |
| pT2 | 103 | 16.8 |
| pT3 | 100 | 16.3 |
| pT4 | 18 | 2.9 |
| ypT0 | 60 | 9.8 |
| ypT1 | 13 | 2.1 |
| ypT2 | 113 | 18.5 |
| ypT3 | 120 | 19.6 |
| ypT4 | 19 | 3.1 |
| pN-category | ||
| pN0 | 217 | 35.5 |
| pN1 | 46 | 7.5 |
| pN2 | 24 | 3.9 |
| ypN0 | 235 | 38.4 |
| ypN1 | 69 | 11.3 |
| ypN2 | 21 | 3.4 |
| UICC-stage | ||
| I | 150 | 24.5 |
| II | 67 | 10.9 |
| III | 70 | 11.4 |
| y0 | 55 | 9.0 |
| yI | 101 | 16.5 |
| yII | 79 | 12.9 |
| yIII | 90 | 14.7 |
| Patient Characteristics | <18.5 kg/m2 Underweight (n = 7) | 18.5–25 kg/m2 Normal Range (n = 212) | 25–30 kg/m2 Overweight (n = 266) | 30–35 kg/m2 Obese Class I (n = 102) | 35–40 kg/m2 Obese Class II (n = 16) | ≥40 kg/m2 Obese Class III (n = 9) | p | Group 1: BMI 18.5–35 (n = 580) | Group 2: BMI <18.5 & ≥35 (n = 32) | p |
|---|---|---|---|---|---|---|---|---|---|---|
| Age | ||||||||||
| < 65 | 6 (86) | 118 (55.7) | 137 (51.5) | 45 (44.1) | 8 (50) | 6 (67) | 300 (51.7) | 20 (63) | ||
| ≥ 65 | 1 (14) | 94 (44.3) | 129 (48.5) | 57 (55.9) | 8 (50) | 3 (33) | 0.180 | 280 (48.3) | 12 (37) | 0.277 |
| Sex | ||||||||||
| Male | 3 (43) | 122 (57.5) | 196 (73.7) | 69 (67.6) | 11 (69) | 5 (56) | 387 (66.7) | 19 (59) | ||
| Female | 4 (57) | 90 (42.5) | 70 (26.3) | 33 (32.4) | 5 (31) | 4 (44) | 0.005 | 193 (33.3) | 13 (41) | 0.443 |
| Tumour site | ||||||||||
| <6cm lower third | 4 (57) | 83 (39.2) | 82 (30.8) | 34 (33.3) | 5 (31) | 3 (33) | 199 (34.3) | 12 (38) | ||
| <12 cm middle third | 3 (43) | 84 (39.6) | 132 (49.6) | 43 (42.2) | 9 (56) | 5 (56) | 259 (44.7) | 17 (53) | ||
| ≤16cm upper third | 0 (0) | 45 (21.2) | 52 (19.6) | 25 (24.5) | 2 (13) | 1 (11) | 0.416 | 122 (21.0) | 3 (9) | 0.269 |
| ASA-Score a | ||||||||||
| ASA 1&2 | 4 (57) | 181/211 (85.8) | 215/264 (81.4) | 75/101 (74.3) | 9 (56) | 6 (67) | 471/576 (81.8) | 19 (59) | ||
| ASA 3&4 | 3 (43) | 30/211 (14.2) | 49/264 (18.6) | 26/101 (25.7) | 7 (44) | 3 (33) | 0.005 | 105/576 (18.2) | 13 (41) | 0.004 |
| Pretherapy CEA level b | ||||||||||
| Normal (<5 ng/L) | 3/6 (50) | 143/176 (81.3) | 196/231 (84.8) | 78/94 (83.0) | 9 (56) | 9 (100) | 417/501 (83.2) | 21/31 (68) | ||
| Elevated (≥5 ng/L) | 3/6 (50) | 33/176 (18.7) | 35/231 (14.2) | 16/94 (17.0) | 7 (44) | 0 (0) | 0.018 | 84/501 (16.8) | 10/31 (32) | 0.048 |
| Neoadjuvant therapy | ||||||||||
| Neoadjuvant RCT | 6 (86) | 117 (55.2) | 133 (50.0) | 52 (51.0) | 9 (56) | 9 (47) | 302 (52.1) | 18 (56) | ||
| Neoadjuvant RT | 0 (0) | 1 (0.5) | 3 (1.1) | 0 (0.0) | 0 (0) | 0 (0) | 4 (0.7) | 0 (0) | ||
| Neoadjuvant CT | 0 (0) | 0 (0.0) | 1 (0.4) | 0 (0.0) | 0 (0) | 0 (0) | 1 (0.1) | 0 (0) | ||
| None | 1 (14) | 94 (44.3) | 129 (48.5) | 50 (49.0) | 7 (44) | 10 (53) | 0.635 | 273 (47.1) | 14 (44) | 0.786 |
| Elective surgery | ||||||||||
| Yes | 7 (100) | 208 (98.1) | 264 (99.2) | 102 (100) | 16 (100) | 9 (100) | 574 (99.0) | 32 (100) | ||
| No, Emergency | 0 (0) | 4 (1.9) | 2 (0.8) | 0 (0.0) | 0 (0) | 0 (0) | 0.523 | 6 (1.0) | 0 (0) | 1.0 |
| Type of surgery | ||||||||||
| Anterior resection | 0 (0) | 32 (15.1) | 28 (10.5) | 15 (14.7) | 1 (6) | 1 (11) | 75 (12.9) | 2 (6) | ||
| Low anterior resection | 2 (29) | 126 (59.4) | 177 (66.5) | 59 (57.8) | 9 (56) | 5 (56) | 362 (62.4) | 16 (50) | ||
| Hartmann procedure | 1 (14) | 3 (1.4) | 3 (1.1) | 1 (1.1) | 0 (0) | 0 (0) | 7 (1.3) | 1 (3) | ||
| Intersphincteric resection | 0 (0) | 15 (7.1) | 19 (7.1) | 13 (12.7) | 2 (13) | 1 (11) | 47 (8.1) | 3 (9) | ||
| Abdominoperineal excision | 4 (57) | 36 (17.0) | 39 (14.8) | 14 (13.7) | 4 (25) | 2 (22) | 0.863 | 89 (15.3) | 10 (32) | 0.086 |
| Multivisceral resection | ||||||||||
| No | 3 (43) | 181 (85.4) | 228 (85.7) | 88 (86.3) | 13 (81) | 7 (78) | 497 (85.7) | 23 (72) | ||
| Yes | 4 (57) | 31 (14.6) | 38 (14.3) | 14 (13.7) | 3 (19) | 2 (22) | 0.098 | 83 (14.3) | 9 (28) | 0.042 |
| Postoperative therapy c | ||||||||||
| RCT | 0/6 (0) | 19/105 (18.1) | 26/127 (20.5) | 8/49 (16.3) | 1/9 (11) | 2/5 (40) | 53/281 (18.9) | 3/20 (15) | ||
| Radiotherapy | 0/6 (0) | 0/ 105 (0.0) | 2/127 (1.6) | 2/49 (4.2) | 0/9 (0) | 0/5 (0) | 4/281 (1.4) | 0/20 (0) | ||
| Chemotherapy | 5/6 (83.3) | 55/105 (52.4) | 77/127 (60.6) | 28/49 (57.1) | 5/9 (56) | 1/5 (20) | 160/281 (56.9) | 11/20 (55) | ||
| None | 1/6 (16.7) | 31/105 (29.5) | 22/127 (17.3) | 11/49. (22.4) | 3/9 (33) | 2/5 (40) | 0.320 | 64/281 (22.8) | 6/20 (30) | 0.856 |
| pT-category | ||||||||||
| pT1 | 0 (0) | 22 (10.4) | 25 (9.4) | 14 (13.7) | 2 (13) | 3 (34) | 61 (10.5) | 5 (16) | ||
| pT2 | 0 (0) | 31 (14.6) | 49 (18.4) | 20 (19.6) | 2 (13) | 1 (11) | 100 (17.2) | 3 (9) | ||
| pT3 | 1 (14) | 34 (16.0) | 45 (16.9) | 15 (14.7) | 3 (19) | 2 (22) | 94 (16.2) | 6 (19) | ||
| pT4 | 0 (0) | 7 (3.3) | 10 (3.8) | 1 (1.1) | 0 (0) | 0 (0) | 18 (3.2) | 0 (0) | ||
| ypT0 | 0 (0) | 22 (10.4) | 29 (10.9) | 7 (6.9) | 1 (6) | 1 (11) | 58 (10.0) | 2 (6) | ||
| ypT1 | 0 (0) | 5 (2.4) | 7 (2.6) | 1 (1.1) | 0 (0) | 0 (0) | 13 (2.2) | 0 (0) | ||
| ypT2 | 1 (14) | 46 (21.7) | 45 (16.9) | 18 (17.5) | 3 (19) | 0 (0) | 109 (18.8) | 4 (13) | ||
| ypT3 | 3 (43) | 39 (18.4) | 48 (18.0) | 24 (23.5) | 4 (24) | 2 (22) | 111 (19.1) | 9 (28) | ||
| ypT4 | 2 (29) | 6 (2.8) | 8 (3.1) | 2 (1.9) | 1 (6) | 0 (0) | 0.110 | 16 (2.8) | 3 (9) | 0.333 |
| pN-category | ||||||||||
| pN0 | 1 (14) | 67 (31.6) | 100 (37.6) | 42 (41.2) | 4 (25) | 3 (33) | 209 (36.0) | 8 (25) | ||
| pN1 | 0 (0) | 16 (7.5) | 20 (7.5) | 6 (5.9) | 2 (13) | 2 (23) | 42 (7.2) | 4 (13) | ||
| pN2 | 0 (0) | 11 (5.2) | 9 (3.4) | 2 (2.0) | 1 (6) | 1 (11) | 22 (3.8) | 2 (6) | ||
| ypN0 | 3 (43) | 90 (42.5) | 102 (38.3) | 30 (29.4) | 7 (44) | 3 (33) | 222 (38.3) | 13 (41) | ||
| ypN1 | 2 (29) | 21 (9.9) | 26 (9.8) | 19 (18.6) | 1 (6) | 0 (0) | 66 (11.4) | 3 (9) | ||
| ypN2 | 1 (14) | 7 (3.3) | 9 (3.4) | 3 (2.9) | 1 (6) | 0 (0) | 0.140 | 19 (3.3) | 2 (6) | 0.408 |
| Quality Indicators | <18.5 Underweight n = 7) | 18.5–25 Normal Weight (n = 212) | 25–30 Overweight (n = 266) | 30–35 Obese Class I (n = 102) | 35–40 Obese Class II (n = 16) | ≥40 Obese Class III (n = 9) | p | Group 1: 18.5–35 (n = 580) | Group 2: <18.5 & ≥ 35 (n = 32) | p |
|---|---|---|---|---|---|---|---|---|---|---|
| Number of examined LN; R0, R1, R2 n = 612 a, median (range) | 13 (11–33) | 20 (2–57) | 21.5 (3–62) | 21 (5–76) | 23.5 (8–57) | 30 (15–43) | 21 (2–76) | 25.5 (8 – 57) | ||
| ≥ 12 LN examined | 6/7 (86) | 188/212 (88.7) | 239/266 (89.8) | 93/102 (91.2) | 15/16 (94) | 9/9 (100) | 0.828 | 520/580 (89.7) | 30/32 (94) | 0.742 |
| pN0 n = 217, median (range) | 33 (33–33) | 24 (12–51) | 27 (7–57) | 31 (10–76) | 30 (22–36) | 26 (15–41) | 26 (7–76) | 30 (15–41) | ||
| ≥ 12 LN examined | 1/1 (100) | 67/67 (100) | 98/100 (98.0) | 41/42 (97.6) | 4/4 (100) | 3/3 (100) | 0.664 | 206/209 (98.6) | 8/8 (100) | 0.737 |
| ypN0 n = 235, median (range) | 13 (12–13) | 17 (2–36) | 18 (3–62) | 17 (7–37) | 21 (8–29) | 41 (16–43) | 17.5 (2–62) | 16 (8–43) | ||
| ≥ 12 LN examined | 3/3 (100) | 70/90 (77.8) | 79/102 (77.5) | 26/30 (86.7) | 6/7 (86) | 3/3 (100) | 0.004 | 175/222 (78.8) | 12/13 (92) | 0.238 |
| R0—resection-rate | 5/7 (71) | 209/212 (98.6) | 257/266 (96.6) | 102/102 (100) | 16/16 (100) | 9/9 (100) | 0.031 | 568/580 (97.9) | 30/32 (94) | 0.163 |
| Aboral resection margin > 1 mm | 7/7 (100) | 210/212 (99.1) | 263/266 (98.9) | 100/102 (98.0) | 15/16 (94) | 9/9 (100) | 0.474 | 573/580 (98.8) | 31/32 (97) | 0.351 |
| Circumferential resection margin > 1 mm | 5/7 (71) | 197/212 (92.9) | 244/266 (91.7) | 98/102 (96.1) | 15/16 (94) | 9/9 (100) | 0.186 | 539/580 (92.9) | 29/32 (91) | 0.096 |
| Intraoperative local tumour cell dissemination | 2/7 (29) | 10/212 (4.7) | 14/266 (5.3) | 2/102 (2.0) | 1/ 16 (6) | 0/9 (0) | 0.112 | 26/580 (4.5) | 3/32 (9) | 0.279 |
| Quality of TME/PME b | ||||||||||
| Mesorectal/intramesorectal plane | 6/6 (100) | 190/196 (96.9) | 246/253 (97.2) | 91/92 (98.9) | 14/15 (93,3) | 8/9 (88,9) | 527/541 (97.4) | 28/30 (93) | ||
| Muscularis propria plane | 0/6 (0) | 6/196 (3.1) | 7/253 (2.8) | 1/92 (1.1) | 1/15 (6,7)) | 1/9 (11,1) | 0.309 | 14/541 (2.6) | 2/30 (7) | 0.203 |
| Abdominoperineal excision | ||||||||||
| All locations | 4/7 (57) | 36/212 (17.0) | 39/266 (14.7) | 14/102 (13.7) | 4/16 (25) | 2/9 (23) | 0.074 | 89/580 (15.3) | 10/32 (31) | 0.025 |
| <6 cm lower third | 4/4 (100) | 30/83 (36.1) | 30/82 (36.6) | 14/34 (41.2) | 4/5 (80) | 2/3 (67) | <0.001 | 74/199 (37.2) | 10/12 (83) | <0.001 |
| 6–12 cm middle third | 0/3 (0) | 6/84 (7.1) | 9/132 (6.8) | 0/43 (0) | 0/9 (0) | 0/5 (0) | <0.001 | 15/259 (5.8) | 0/17 (0) | <0.001 |
| Anastomosis | 2/7 (29) | 173/212 (81.6) | 224/266 (84.2) | 87/102 (85.3) | 12 /16 (75) | 7/9 (78) | 0.019 | 484/580 (83.4) | 21/32 (66) | 0.016 |
| Anastomotic leak | 0/2 (0) | 5/173 (2.9) | 10/224 (4.5) | 7/87 (8) | 0/12 (0) | 0/7 (0) | 0.466 | 22/484 (4.5) | 0/21 (0) | 1.0 |
| Morbidity | ||||||||||
| Total | 2/7 (29) | 39/212 (18.4) | 55/266 (20.7) | 29/102 (28.4) | 9/16 (56) | 3/9 (33) | 0.008 | 123/580 (21.2) | 14/32 (44) | 0.005 |
| Non-surgical | 0/7 (0,) | 9/212 (4.2) | 12/266 (4.5) | 7/102 (6.8) | 1/16 (6) | 0/9 (0) | 0.460 | 26/580 (4.5) | 1/32 (3) | 1.0 |
| Surgical | 2/7 (29) | 30/212 (14.1) | 43/266 (16.2) | 22/102 (21.6) | 8/16 (50) | 3/9 (33) | 0.006 | 95/580 (16.4) | 13/32 (41) | 0.001 |
| Postoperative 30-day mortality | 1/7 (14) | 3/212 (1.4) | 1/266 (0.4) | 1/102 (1.0) | 0/16 (0) | 0/9 (0) | 0.116 | 5/580 (0.9) | 1/32 (3) | 0.282 |
| Univariate Analysis | Multivariate Analysis | ||||||
|---|---|---|---|---|---|---|---|
| Patient and Tumour Characteristics | Number | 5Y-locoregional Recurrence | 95% CI | p | Hazard Ratio | 95% CI | p |
| Total | 598 | 5.9% | 3.9–7.9 | ||||
| BMI WHO | |||||||
| BMI < 18.5 kg/m2 underweight | 5 | 0% | 0.0 | ||||
| BMI 18.5–25 kg/m2 normal range | 209 | 3.7% | 1.0–6.4 | 1.0 | |||
| BMI 25–30 kg/m2 overweight | 257 | 8.7% | 5.2–12.2 | 1.7 | 0.8–3.7 | 0.150 | |
| BMI 30–35 kg/m2 obese class I | 102 | 1.1% | 0.0–3.3 | 0.6 | 0.2–1.9 | 0.357 | |
| BMI 35–40 kg/m2 obese class II | 16 | 23.6% | 0.0–47.3 | 4.1 | 1.1–15.4 | 0.036 | |
| BMI ≥ 40 kg/m2 obese class III | 9 | 11.1% | 0.0–31.7 | 0.112 | 2.0 | 0.2–16.3 | 0.533 |
| BMI Groups | |||||||
| Group 1: BMI 18.5–35 | 568 | 5.5% | 3.5–7.5 | 1.0 | |||
| Group 2: BMI <18.5 & ≥35 | 30 | 15.4% | 1.5–29.3 | 0.106 | 2.0 | 0.7–5.9 | 0.187 |
| Age | |||||||
| ≤65 | 315 | 5.6% | 3.1–8.1 | ||||
| >65 | 283 | 6.4% | 3.5–9.3 | 0.884 | |||
| Sex | |||||||
| Male | 394 | 6.7% | 4.2–9.2 | ||||
| Female | 204 | 4.3% | 1.4–7.2 | 0.111 | |||
| Localisation | |||||||
| <6 cm | 202 | 5.3% | 2.2–8.4 | ||||
| 6–12 cm | 271 | 7.1% | 4.0–10.2 | ||||
| 12–16 cm | 125 | 4.3% | 0.6–8.0 | 0.641 | |||
| UICC-stage | |||||||
| I | 150 | 4.3% | 1.0–7.6 | 1.0 | |||
| II | 65 | 11.4% | 3.4–19.4 | 3.8 | 1.4–10.0 | 0.007 | |
| III | 65 | 9.2% | 1.4–17.0 | 1.9 | 0.6–6.1 | 0.258 | |
| y0 | 55 | 0% | 0 | 0.973 | |||
| yI | 101 | 3.0% | 0–6.3 | 0.6 | 0.2–2.4 | 0.487 | |
| yII | 74 | 7.5% | 1.0–14.0 | 1.7 | 0.6–5.2 | 0.321 | |
| yIII | 88 | 8.9% | 2.6–15.2 | 0.003 | 2.5 | 0.9–6.8 | 0.067 |
| Abdominoperineal excision | |||||||
| No | 509 | 5.4% | 3.4–7.4 | ||||
| Yes | 89 | 8.9% | 2.6–15.2 | 0.104 | |||
| ASA-Score a | |||||||
| ASA 1&2 | 481 | 5.0% | 3.0–7.0 | 1.0 | |||
| ASA 3&4 | 113 | 10.6% | 4.3–16.9 | 0.040 | 2.1 | 1.0–4.5 | 0.042 |
| CEA-level b | |||||||
| Normal (<5 ng/L) | 432 | 5.9% | 3.5–8.3 | 1.0 | |||
| Elevated (≥5 ng/L) | 88 | 4.9% | 0.2–9.6 | 0.389 | 1.9 | 0.9–3.9 | 0.075 |
| Univariate Analysis | Multivariate Analysis | ||||||
|---|---|---|---|---|---|---|---|
| Patient and Tumour Characteristics | Number | 5Y distant Metastases | 95% CI | p | Hazard Ratio | 95% CI | p |
| Total | 598 | 16.7% | 13.6–19.8 | ||||
| BMI WHO | |||||||
| BMI < 18.5 kg/m2 underweight | 5 | 40.0% | 0–82.9 | 1.7 | 0.4–7.2 | 0.493 | |
| BMI 18.5–25 kg/m2 normal range | 209 | 16.2% | 11.1–21.3 | 1.0 | |||
| BMI 25–30 kg/m2 overweight | 257 | 17.3% | 12.6–22.0 | 1.2 | 0.8–2.0 | 0.340 | |
| BMI 30–35 kg/m2 obese class I | 102 | 11.9% | 5.6–18.2 | 0.9 | 0.5–1.7 | 0.813 | |
| BMI 35–40 kg/m2 obese class II | 16 | 34.0% | 9.7–58.3 | 1.9 | 0.8–4.8 | 0.153 | |
| BMI ≥ 40 kg/m2 obese class III | 9 | 22.2% | 0–49.4 | 0.225 | 1.4 | 0.3–5.8 | 0.678 |
| BMI Groups | |||||||
| Group 1: BMI 18.5–35 | 568 | 15.9% | 12.8–19.0 | 1.0 | |||
| Group 2: BMI <18.5 or ≥35 | 30 | 31.4% | 14.3–48.5 | 0.034 | 1.6 | 0.8–3.1 | 0.177 |
| Age | |||||||
| ≤65 | 315 | 14.1% | 10.2–18.0 | ||||
| >65 | 283 | 19.7% | 14.8–24.6 | 0.085 | |||
| Sex | |||||||
| Male | 394 | 16.3% | 12.6–20.0 | ||||
| Female | 204 | 17.4% | 12.1–22.7 | 0.861 | |||
| Localisation | |||||||
| <6 cm | 202 | 13.8% | 9.0–18.8 | ||||
| 6–12 cm | 271 | 17.9% | 13.2–22.6 | ||||
| 12–16 cm | 125 | 18.8% | 11.7–25.9 | 0.541 | |||
| UICC-stage | |||||||
| I | 150 | 9.8% | 4.9–14.7 | 1.0 | |||
| II | 65 | 23.1% | 12.5–33.7 | 2.1 | 1.0–4.4 | 0.041 | |
| III | 65 | 30.7% | 18.4–43.0 | 2.7 | 1.4–5.5 | 0.003 | |
| y0 | 55 | 1.9% | 0–5.4 | 0.2 | 0–1.3 | 0.086 | |
| yI | 101 | 6.9% | 2.0–11.8 | 0.6 | 0.2–1.4 | 0.250 | |
| yII | 74 | 23.3% | 13.7–32.9 | 2.3 | 1.1–4.6 | 0.019 | |
| yIII | 88 | 30.3% | 20.5–40.1 | <0.001 | 3.1 | 1.7–5.8 | <0.001 |
| Abdominoperineal excision | |||||||
| No | 509 | 16.4% | 13.1–19.7 | ||||
| Yes | 89 | 18.0% | 9.8–26.2 | 0.313 | |||
| ASA-Score a | |||||||
| ASA 1&2 | 481 | 15.2% | 11.9–18.5 | ||||
| ASA 3&4 | 113 | 24.2% | 15.8–32.6 | 0.052 | |||
| CEA-level b | |||||||
| Normal (<5 ng/L) | 432 | 14.1% | 10.8–17.4 | 1.0 | |||
| Elevated(≥5 ng/L) | 88 | 31.6% | 21.6–41.6 | <0.001 | 1.9 | 1.2–3.0 | 0.005 |
| Univariate Analysis | Multivariate Analysis | ||||||
|---|---|---|---|---|---|---|---|
| Patient and Tumour Characteristics | Number | 5-OSR | 95%CI | p | Hazard Ratio | 95%CI | p |
| Total | 598 | 82.3% | 79.2–85.4 | ||||
| BMI WHO | |||||||
| BMI < 18.5 kg/m2 underweight | 5 | 60.0% | 17.1–100 | 1.7 | 0.4–7.2 | 0.458 | |
| BMI 18.5–25 kg/m2 normal range | 209 | 82.3% | 77.2–87.4 | 1.0 | |||
| BMI 25–30 kg/m2 overweight | 257 | 81.3% | 76.6–86.0 | 1.2 | 0.8–1.7 | 0.369 | |
| BMI 30–35 kg/m2 obese class I | 102 | 88.2% | 81.9–94.5 | 0.7 | 0.5–1.2 | 0.219 | |
| BMI 35–40 kg/m2 obese class II | 16 | 68.8% | 46.1–91.5 | 1.4 | 0.7–2.9 | 0.377 | |
| BMI ≥ 40 kg/m2 obese class III | 9 | 77.8% | 50.6–100 | 0.211 | 0.7 | 0.2–2.0 | 0.524 |
| BMI Groups | |||||||
| Group 1: BMI 18.5–35 | 568 | 82.9% | 79.8–86.0 | 1.0 | |||
| Group 2: BMI <18.5 or ≥35 | 30 | 70.0% | 53.5–86.5 | 0.023 | 1.1 | 0.7–1.9 | 0.652 |
| Age | |||||||
| ≤65 | 315 | 90.8% | 87.7–93.9 | ||||
| >65 | 283 | 72.8% | 67.7–77.9 | <0.001 | <0.001 | ||
| Sex | |||||||
| Male | 394 | 83.5% | 79.8–87.2 | ||||
| Female | 204 | 79.9% | 74.4–85.4 | 0.471 | |||
| Morbidity | |||||||
| Yes | 132 | 76.5% | 69.2–83.8 | ||||
| No | 466 | 83.9% | 80.6–87.2 | 0.004 | |||
| Localisation | |||||||
| <6 cm | 202 | 85.1% | 80.2–90.0 | ||||
| 6–<12 cm | 271 | 80.4% | 75.7–85.1 | ||||
| 12–16 cm | 125 | 81.6% | 74.7–88.5 | 0.176 | |||
| UICC-stage | |||||||
| I | 150 | 84.7% | 79.0– 90.4 | 1.0 | |||
| II | 65 | 73.8% | 63.0–84.6 | 1.2 | 0.7–2.0 | 0.476 | |
| III | 65 | 63.1% | 51.3–74.9 | 2.3 | 1.5–3.6 | <0.001 | |
| y0 | 55 | 98.2% | 94.7–100 | 0.4 | 0.2–0.9 | 0.024 | |
| yI | 101 | 97.0% | 93.7–100 | 0.5 | 0.3–0.8 | 0.010 | |
| yII | 74 | 74.3% | 64.3–84.3 | 1.0 | 0.6–1.7 | 0.973 | |
| yIII | 88 | 78.4% | 69.8–87.0 | <0.001 | 1.1 | 0.7– 1.8 | 0.658 |
| Abdominoperineal excision | |||||||
| No | 509 | 83.9% | 80.8–87.0 | 1.0 | |||
| Yes | 89 | 73.0% | 63.8–82.2 | 0.001 | 1.9 | 1.3–2.9 | 0.001 |
| ASA-Score a | |||||||
| ASA 1&2 | 481 | 86.3% | 83.2–89.4 | 1.0 | |||
| ASA 3&4 | 113 | 64.6% | 55.8–73.4 | <0.001 | 3.2 | 2.3–4.4 | <0.001 |
| Pretherapy CEA level b | |||||||
| Normal (<5 ng/mL) | 432 | 84.3% | 80.8–87.8 | 1.0 | |||
| Elevated (≥5 ng/mL) | 88 | 68.2% | 58.4–78.0 | <0.001 | 1.9 | 1.3–2.6 | <0.001 |
© 2019 by the authors. Licensee MDPI, Basel, Switzerland. This article is an open access article distributed under the terms and conditions of the Creative Commons Attribution (CC BY) license (http://creativecommons.org/licenses/by/4.0/).
Share and Cite
Kalb, M.; Langheinrich, M.C.; Merkel, S.; Krautz, C.; Brunner, M.; Bénard, A.; Weber, K.; Pilarsky, C.; Grützmann, R.; Weber, G.F. Influence of Body Mass Index on Long-Term Outcome in Patients with Rectal Cancer—A Single Centre Experience. Cancers 2019, 11, 609. https://doi.org/10.3390/cancers11050609
Kalb M, Langheinrich MC, Merkel S, Krautz C, Brunner M, Bénard A, Weber K, Pilarsky C, Grützmann R, Weber GF. Influence of Body Mass Index on Long-Term Outcome in Patients with Rectal Cancer—A Single Centre Experience. Cancers. 2019; 11(5):609. https://doi.org/10.3390/cancers11050609
Chicago/Turabian StyleKalb, Maximilian, Melanie C. Langheinrich, Susanne Merkel, Christian Krautz, Maximilian Brunner, Alan Bénard, Klaus Weber, Christian Pilarsky, Robert Grützmann, and Georg F. Weber. 2019. "Influence of Body Mass Index on Long-Term Outcome in Patients with Rectal Cancer—A Single Centre Experience" Cancers 11, no. 5: 609. https://doi.org/10.3390/cancers11050609
APA StyleKalb, M., Langheinrich, M. C., Merkel, S., Krautz, C., Brunner, M., Bénard, A., Weber, K., Pilarsky, C., Grützmann, R., & Weber, G. F. (2019). Influence of Body Mass Index on Long-Term Outcome in Patients with Rectal Cancer—A Single Centre Experience. Cancers, 11(5), 609. https://doi.org/10.3390/cancers11050609