Early Changes in CT Perfusion Parameters: Primary Renal Carcinoma Versus Metastases After Treatment with Targeted Therapy
 ,
, 
Abstract
:1. Introduction
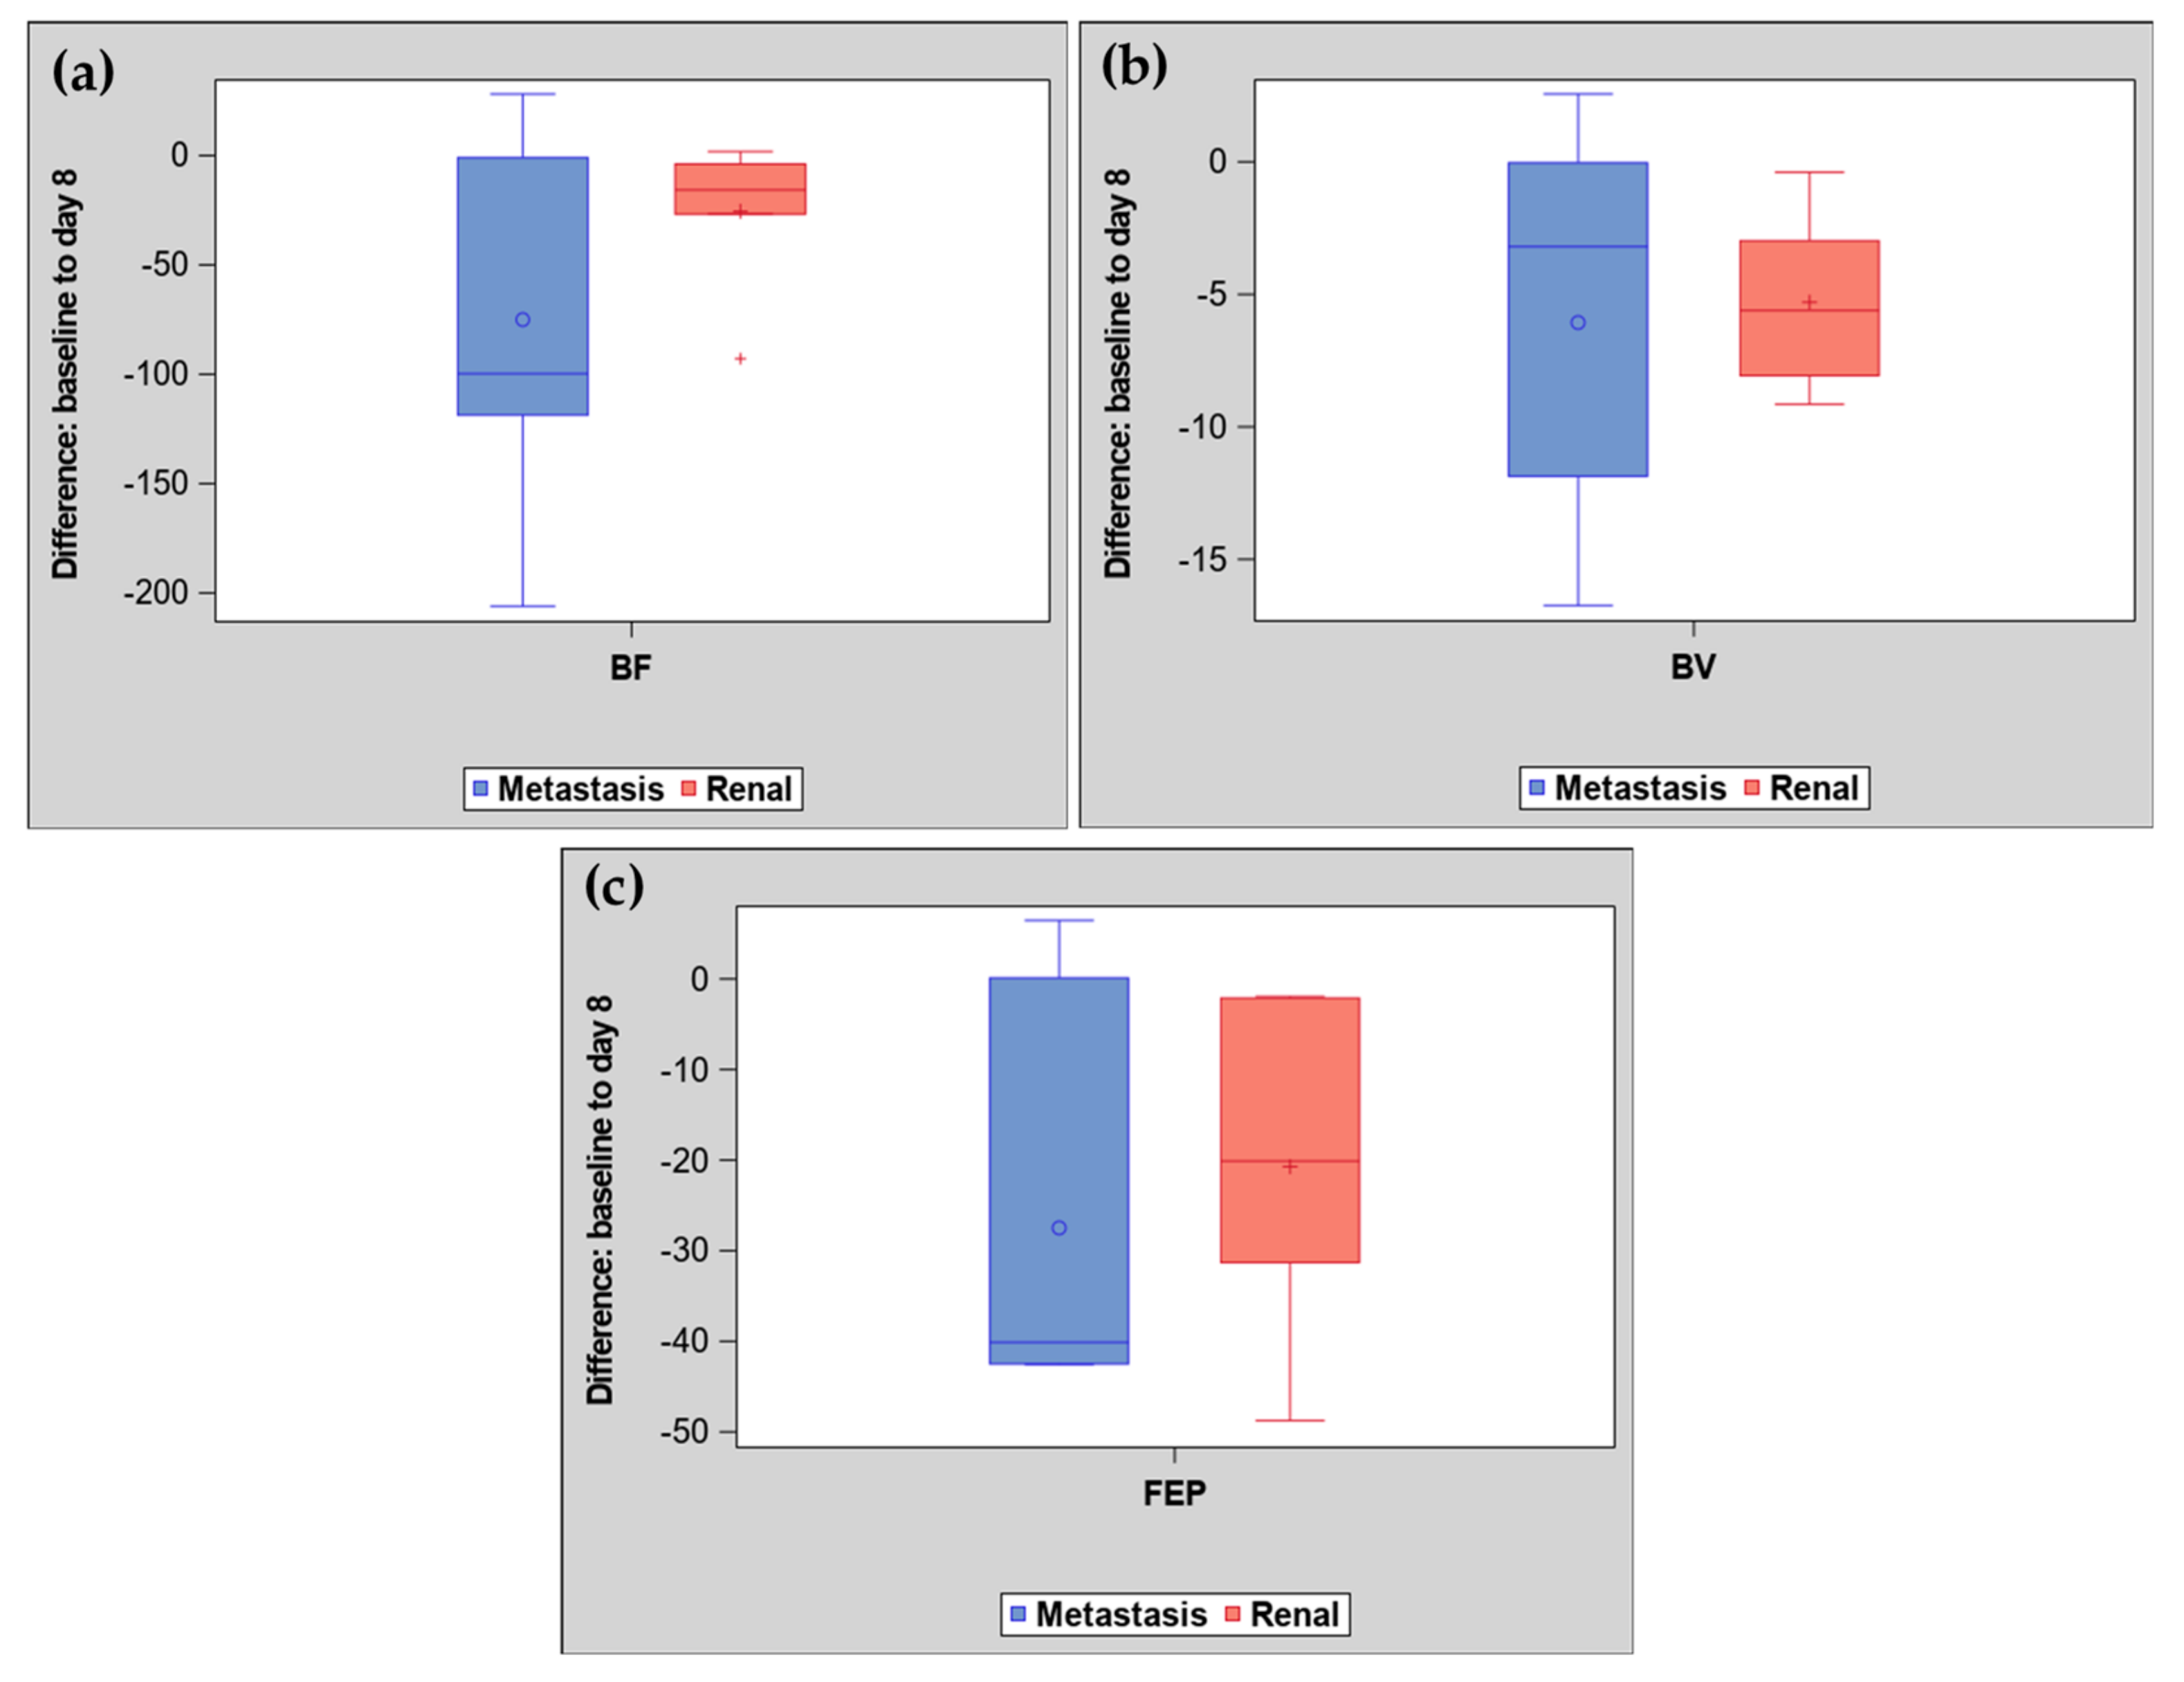
2. Results
3. Discussion
4. Materials and Methods
4.1. Study Protocol
4.2. CT Perfusion Technique
4.3. CT Perfusion Analysis
4.4. Treatment Response
4.5. Analysis
5. Conclusions
Author Contributions
Funding
Acknowledgments
Conflicts of Interest
References
- Hsieh, J.J.; Mark, P.P.; Sabina, S.; Charles, S.; Laurence, A.; Manuela, S.; Daniel, Y.H.; James, L.; Vincenzo, F. Renal Cell Carcinoma. Nat. Rev. Dis. Primers 2017, 3, 17009. [Google Scholar] [CrossRef]
- Posadas, E.M.; Suwicha, L.; Robert, A.F. Targeted Therapies for Renal Cell Carcinoma. Nat. Rev. Nephrol. 2017, 13, 496–511. [Google Scholar] [CrossRef] [PubMed]
- McKay, R.R.; Dominick, B.; Toni, K.C. Evolving Systemic Treatment Landscape for Patients with Advanced Renal Cell Carcinoma. J. Clin. Oncol. 2018, 36, 3615–3623. [Google Scholar] [CrossRef]
- Motzer, R.J.; Thomas, E.H.; Piotr, T.M.; Dror, M.; Ronald, M.B.; Olivier, R.; Stéphane, O.; Sylvie, N.; Cezary, S.; Sindy, T.K.; et al. Sunitinib versus Interferon Alfa in Metastatic Renal-Cell Carcinoma. N. Engl. J. Med. 2007, 356, 115–124. [Google Scholar] [CrossRef]
- Hudes, G.; Carducci, M.; Tomczak, P.; Dutcher, J.; Figlin, R.; Kapoor, A.; Staroslawska, E.; Sosman, J.; McDermott, D.; Bodrogi, I.; et al. Temsirolimus, Interferon Alfa, or Both for Advanced Renal-Cell Carcinoma. N. Engl. J. Med. 2007, 356, 2271–2281. [Google Scholar] [CrossRef]
- Motzer, R.J.; Hutson, T.E.; Glen, H.; Michaelson, M.D.; Molina, A.; Eisen, T.; Jassem, J.; Zolnierek, J.; Maroto, J.P.; Mellado, B.; et al. Lenvatinib, Everolimus, and the Combination in Patients with Metastatic Renal Cell Carcinoma: A Randomised, Phase 2, Open-Label, Multicentre Trial. Lancet Oncol. 2015, 16, 1473–1482. [Google Scholar] [CrossRef]
- Escudier, B.; Joaquim, B.; Sylvie, N.; Emilio, B.; Bohuslav, M.; Sergio, B.; Alain, R.; Sophie, G.; Sangeeta, J.; Vesna, S. Phase III Trial of Bevacizumab plus Interferon Alfa-2a in Patients with Metastatic Renal Cell Carcinoma (AVOREN): Final Analysis of Overall Survival. J. Clin. Oncol. 2010, 28, 2144–2150. [Google Scholar] [CrossRef] [PubMed]
- Motzer, R.J.; Nizar, M.; Tannir, D.F.; McDermott, O.; Arén, F.; Bohuslav, M.; Toni, K.C.; Elizabeth, R.P.; Philippe, B.; Camillo, P.; et al. Nivolumab plus Ipilimumab versus Sunitinib in Advanced Renal-Cell Carcinoma. N. Engl. J. Med. 2018, 378, 1277–1290. [Google Scholar] [CrossRef] [PubMed]
- Choueiri, T.K.; Susan, H.; Ben, L.S.; Olwen, H.M.; Dror, M.; Meghara, K.W.; Darren, R.F.; Olencki, T.; Picus, J.; Small, E.J.; et al. Cabozantinib Versus Sunitinib as Initial Targeted Therapy for Patients with Metastatic Renal Cell Carcinoma of Poor or Intermediate Risk: The Alliance A031203 CABOSUN Trial. J. Clin. Oncol. 2017, 35, 591–597. [Google Scholar] [CrossRef] [PubMed]
- Sternberg, C.N.; Ian, D.D.; Jozef, M.; Cezary, S.; Eunsik, L.; John, W.; Carlos, H.B.; Salman, P.; Gladkov, O.A.; Kavina, A.; et al. Pazopanib in Locally Advanced or Metastatic Renal Cell Carcinoma: Results of a Randomized Phase III Trial. J. Clin. Oncol. 2010, 28, 1061–1068. [Google Scholar] [CrossRef]
- Rini, B.I.; Elizabeth, R.P.; Viktor, S.; Rustem, G.; Robert, H.; Dmitry, N.; Frédéric, P.; Boris, A.; Denis, S.; Bohuslav, M.; et al. Pembrolizumab plus Axitinib versus Sunitinib for Advanced Renal-Cell Carcinoma. N. Engl. J. Med. 2019, 380, 1116–1127. [Google Scholar] [CrossRef]
- Motzer, R.J.; Konstantin, P.; John, H.; Brian, R.; Laurence, A.; Matthew, T.C.; Balaji, V.; Christian, K.; Sylvie, N.; Motohide, U.; et al. Avelumab plus Axitinib versus Sunitinib for Advanced Renal-Cell Carcinoma. N. Engl. J. Med. 2019, 380, 1103–1115. [Google Scholar] [CrossRef] [PubMed]
- Eisenhauer, E.A.; Therasse, P.; Bogaerts, J.; Schwartz, L.H.; Sargent, D.; Ford, R.; Dancey, J.; Arbuck, S.; Gwyther, S.; Mooney, M.; et al. New Response Evaluation Criteria in Solid Tumours: Revised RECIST Guideline (version 1.1). Eur. J. Cancer 2009, 45, 228–247. [Google Scholar] [CrossRef] [PubMed]
- Chen, V.; Cynthia, G.; Chiyuan, A.; Zhang, S.S.; Howard, E.L.; Alice, C.F. Economic Burden of Empiric Drug Utilization in Metastatic Renal Cell Carcinoma Emphasizes the Need for Early Biomarkers of Response. JCO 2017, 35, e16072. [Google Scholar] [CrossRef]
- Prezzi, D.; Aisha, K.; Vicky, G. Perfusion CT Imaging of Treatment Response in Oncology. Eur. J. Radiol. 2015, 12, 2380–2385. [Google Scholar] [CrossRef] [PubMed]
- Fournier, L.S.; Stephane, O.; Rokhaya, T.; Ludovic, T.; Eugeniu, B.; Jacques, M.; Daniel, B.; Gilles, C.; Guy, F.; Charles, A.C. Metastatic Renal Carcinoma: Evaluation of Antiangiogenic Therapy with Dynamic Contrast-Enhanced CT. Radiology 2010, 256, 511–518. [Google Scholar] [CrossRef] [PubMed]
- Brufau, B.P.; Carmen, S.C.; Laura, B.V.; Rafael, S.I.; Begoña, M.G.; Carlos, N.M. Metastatic Renal Cell Carcinoma: Radiologic Findings and Assessment of Response to Targeted Antiangiogenic Therapy by Using Multidetector CT. Radiographics 2013, 33, 1691–1716. [Google Scholar] [CrossRef]
- Chen, Y.; Zhang, J.; Dai, J.; Feng, X.; Lu, H.; Zhou, C. Angiogenesis of Renal Cell Carcinoma: Perfusion CT Findings. Abdom. Imaging 2010, 35, 622–628. [Google Scholar] [CrossRef]
- Reiner, C.S.; Goetti, R.; Eberli, D.; Klotz, E.; Boss, A.; Pfammatter, T.; Frauenfelder, T.; Moch, H.; Sulser, T.; Alkadhi, H. CT Perfusion of Renal Cell Carcinoma: Impact of Volume Coverage on Quantitative Analysis. Invest. Radiol. 2012, 47, 33–40. [Google Scholar] [CrossRef]
- Ng, C.S.; Xiaohong, W.; Silvana, C.F.; Lin, E.; Chusilp, C.; Nizar, M.T. Perfusion CT in Patients with Metastatic Renal Cell Carcinoma Treated with Interferon. AJR 2010, 194, 166–171. [Google Scholar] [CrossRef]
- Reiner, C.S.; Matthias, R.; Thore, T.; Daniel, E.; Ernst, K.; Thomas, F.; Tullio, S.; Holger, M.; Hatem, A. Computed Tomography Perfusion Imaging of Renal Cell Carcinoma: Systematic Comparison with Histopathological Angiogenic and Prognostic Markers. Invest. Radiol. 2013, 48, 183–191. [Google Scholar] [CrossRef]
- Kaneoya, K.; Ueda, T.; Suito, H.; Nanazawa, Y.; Tamaru, J.; Isobe, K.; Naya, Y.; Tobe, T.; Motoori, K.; Yamamoto, S.; et al. Functional Computed Tomography Imaging of Tumor-Induced Angiogenesis: Preliminary Results of New Tracer Kinetic Modeling Using a Computer Discretization Approach. Radiat. Med. 2008, 26, 213–221. [Google Scholar] [CrossRef]
- Joachim, D.; Inga, H.; Harald, H.; Christine, W.; Helmut, M.; Marianne, M.; Jeanette, W.; Georg, M.-B.; Clemens, U.; Dieter, M. Effects of PTK787/ZK 222584, a Specific Inhibitor of Vascular Endothelial Growth Factor Receptor Tyrosine Kinases, on Primary Tumor, Metastasis, Vessel Density, and Blood Flow in a Murine Renal Cell Carcinoma Model. Cancer Res. 2000, 60, 4819–4824. [Google Scholar]
- Patnaik, A.; Swanson, K.D.; Csizmadia, E.; Solanki, A.; Landon-Brace, N.; Gehring, M.P.; Helenius, K.; Olson, B.M.; Pyzer, A.R.; Wang, L.C.; et al. Cabozantinib Eradicates Advanced Murine Prostate Cancer by Activating Antitumor Innate Immunity. Cancer Discov. 2017, 7, 750–765. [Google Scholar] [CrossRef]
- Huang, D.; Ding, Y.; Li, Y.; Luo, W.M.; Zhang, Z.F.; Snider, J.; Vandenbeldt, K.; Qian, C.N.; The, B.T. Sunitinib Acts Primarily on Tumor Endothelium rather than Tumor Cells to Inhibit the Growth of Renal Cell Carcinoma. Cancer Res. 2010, 70, 1053–1062. [Google Scholar] [CrossRef]
- Batchelor, T.T.; Sorensen, A.G.; di Tomaso, E.; Zhang, W.T.; Duda, D.G.; Cohen, K.S.; Kozak, K.R.; Cahill, D.P.; Chen, P.J.; Zhu, M.; et al. AZD2171, a Pan-VEGF Receptor Tyrosine Kinase Inhibitor, Normalizes Tumor Vasculature and Alleviates Edema in Glioblastoma Patients. Cancer Cell 2007, 11, 83–95. [Google Scholar] [CrossRef]
- Morgan, B.; Thomas, A.L.; Drevs, J.; Hennig, J.; Buchert, M.; Jivan, A.; Horsfield, M.A.; Mross, K.; Ball, H.A.; Lee, L.; et al. Dynamic Contrast-Enhanced Magnetic Resonance Imaging as a Biomarker for the Pharmacological Response of PTK787/ZK 222584, an Inhibitor of the Vascular Endothelial Growth Factor Receptor Tyrosine Kinases, in Patients with Advanced Colorectal Cancer and Liver Metastases: Results from Two Phase I Studies. J. Clin. Oncol. 2003, 21, 3955–3964. [Google Scholar]
- Laird, A.D.; Christensen, J.G.; Li, G.; Carver, J.; Smith, K.; Xin, X.; Moss, K.G.; Louie, S.G.; Mendel, D.B.; Cherrington, J.M. SU6668 Inhibits Flk-1/KDR and PDGFRbeta in Vivo, Resulting in Rapid Apoptosis of Tumor Vasculature and Tumor Regression in Mice. FASEB J. 2002, 16, 681–690. [Google Scholar] [CrossRef]
- Christiane, J.B.; Wenbiao, L.; Darren, W.D.; Raymond, M.S.; David, J.M.; Michael, R.W.; Corazon, D.B.; Daniel, J.H.; Lee, M.E. Vascular Endothelial Growth Factor Is an in Vivo Survival Factor for Tumor Endothelium in a Murine Model of Colorectal Carcinoma Liver Metastases. Cancer 2000, 89, 488–499. [Google Scholar]
- Nielsen, T.K.; Østraat, Ø.; Graumann, O.; Pedersen, B.G.; Andersen, G.; Høyer, S.; Borre, M. Computed Tomography Perfusion, Magnetic Resonance Imaging, and Histopathological Findings After Laparoscopic Renal Cryoablation: An In Vivo Pig Model. Technol. Cancer Res. Treat. 2017, 16, 406–413. [Google Scholar] [CrossRef]
- Luna, A.; Vilanova, J.C.; Da Cruz, L.C.H., Jr.; Rossi, S.E. (Eds.) Functional Imaging in Oncology: Clinical Applications; Springer: Berlin, Germany, 2014. [Google Scholar]
- Mains, J.R.; Donskov, F.; Pedersen, E.M.; Madsen, H.H.T.; Thygesen, J.; Thorup, K.; Rasmussen, F. Use of patient outcome endpoints to identify the best functional CT imaging parameters in metastatic renal cell carcinoma patients. Br. J. Radiol. 2018, 91, 20160795. [Google Scholar] [CrossRef]
- Hellbach, K.; Sterzik, A.; Sommer, W.; Karpitschka, M.; Hummel, N.; Casuscelli, J.; Ingrisch, M.; Schlemmer, M.; Graser, A.; Staehler, M. Dual energy CT allows for improved characterization of response to antiangiogenic treatment in patients with metastatic renal cell cancer. Eur. Radiol. 2017, 27, 2532–2537. [Google Scholar] [CrossRef]
- Choueiri, T.K.; Xie, W.; Kollmannsberger, C.; North, S.; Knox, J.J.; Lampard, J.G.; McDermott, D.F.; Rini, B.I.; Heng, D.Y. The impact of cytoreductive nephrectomy on survival of patients with metastatic renal cell carcinoma receiving vascular endothelial growth factor targeted therapy. J. Urol. 2011, 185, 60–66. [Google Scholar] [CrossRef]
- Méjean, A.; Ravaud, A.; Thezenas, S.; Colas, S.; Beauval, J.-B.; Bensalah, K.; Lionnel, G.; Antoine, T.-V.; Luc, C.; Hervé, L. Sunitinib Alone or after Nephrectomy in Metastatic Renal-Cell Carcinoma. N. Engl. J. Med. 2018, 379, 417–427. [Google Scholar] [CrossRef]


| Mean Age | 53.5 |
|---|---|
| Gender | 4F/6M |
| Tumor Type | clear cell |
| Tumor Location | 5 patients (pts) with primary renal masses 4 pts with RCC metastasis (single or multiple) 1 pt with primary RCC and 1 metastasis |
| Treatment Type | 2 axitinib 2 sunitinib 5 pazopanib 1 sunitinib and gemcitabine |
| Parameter | Primary Renal Mass (n = 6) | Metastatic Mass (n = 7) | ||||
|---|---|---|---|---|---|---|
| Baseline | Day 8 | Difference | Baseline | Day 8 | Difference | |
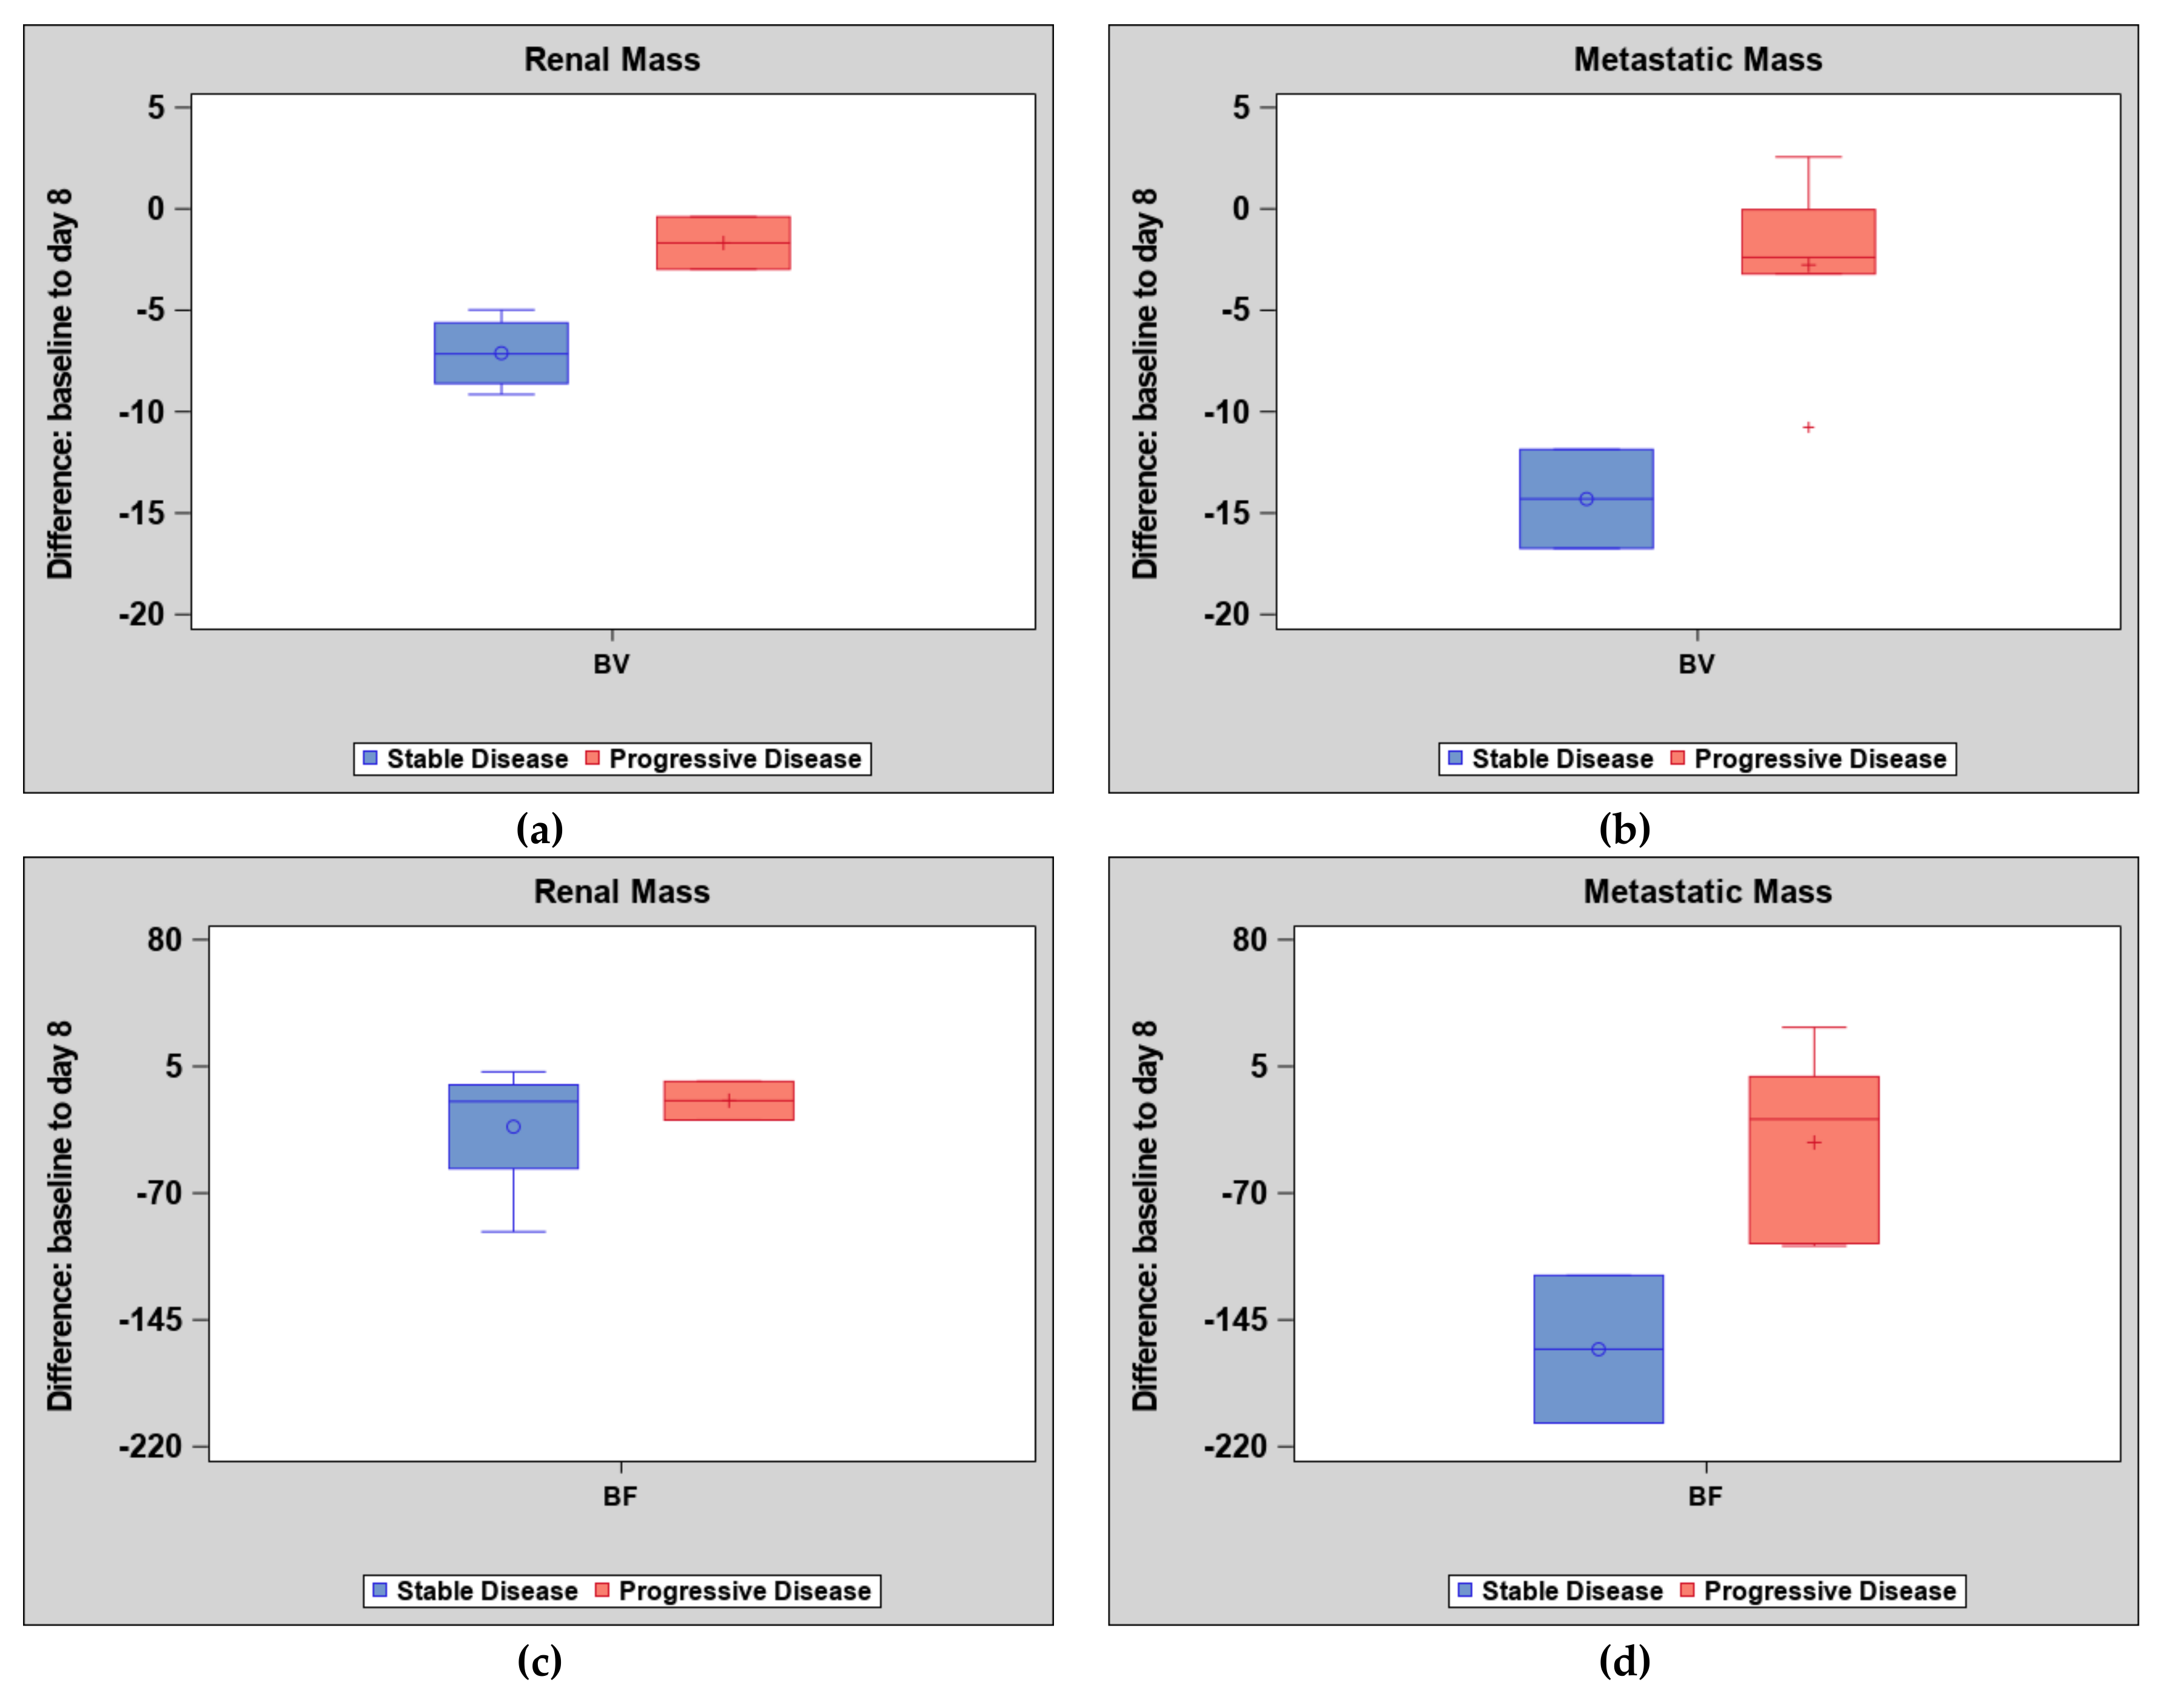
| Blood volume | ||||||
| Mean (SD) | 13.4 (8.20) | 8.1 (5.61) | −5.3 (3.25) | 17.3 (9.4) | 11.3 (8.60) | −6.1 (7.1) |
| Median (IQR) | 15.9 (6.0, 17.9) | 8.2 (3.0, 12.9) | −5.6 (−8.1, −3.0) | 15.6 (10.1, 27.8) | 7.7 (4.2, 18.2) | −3.2 (−11.9, −0.03) |
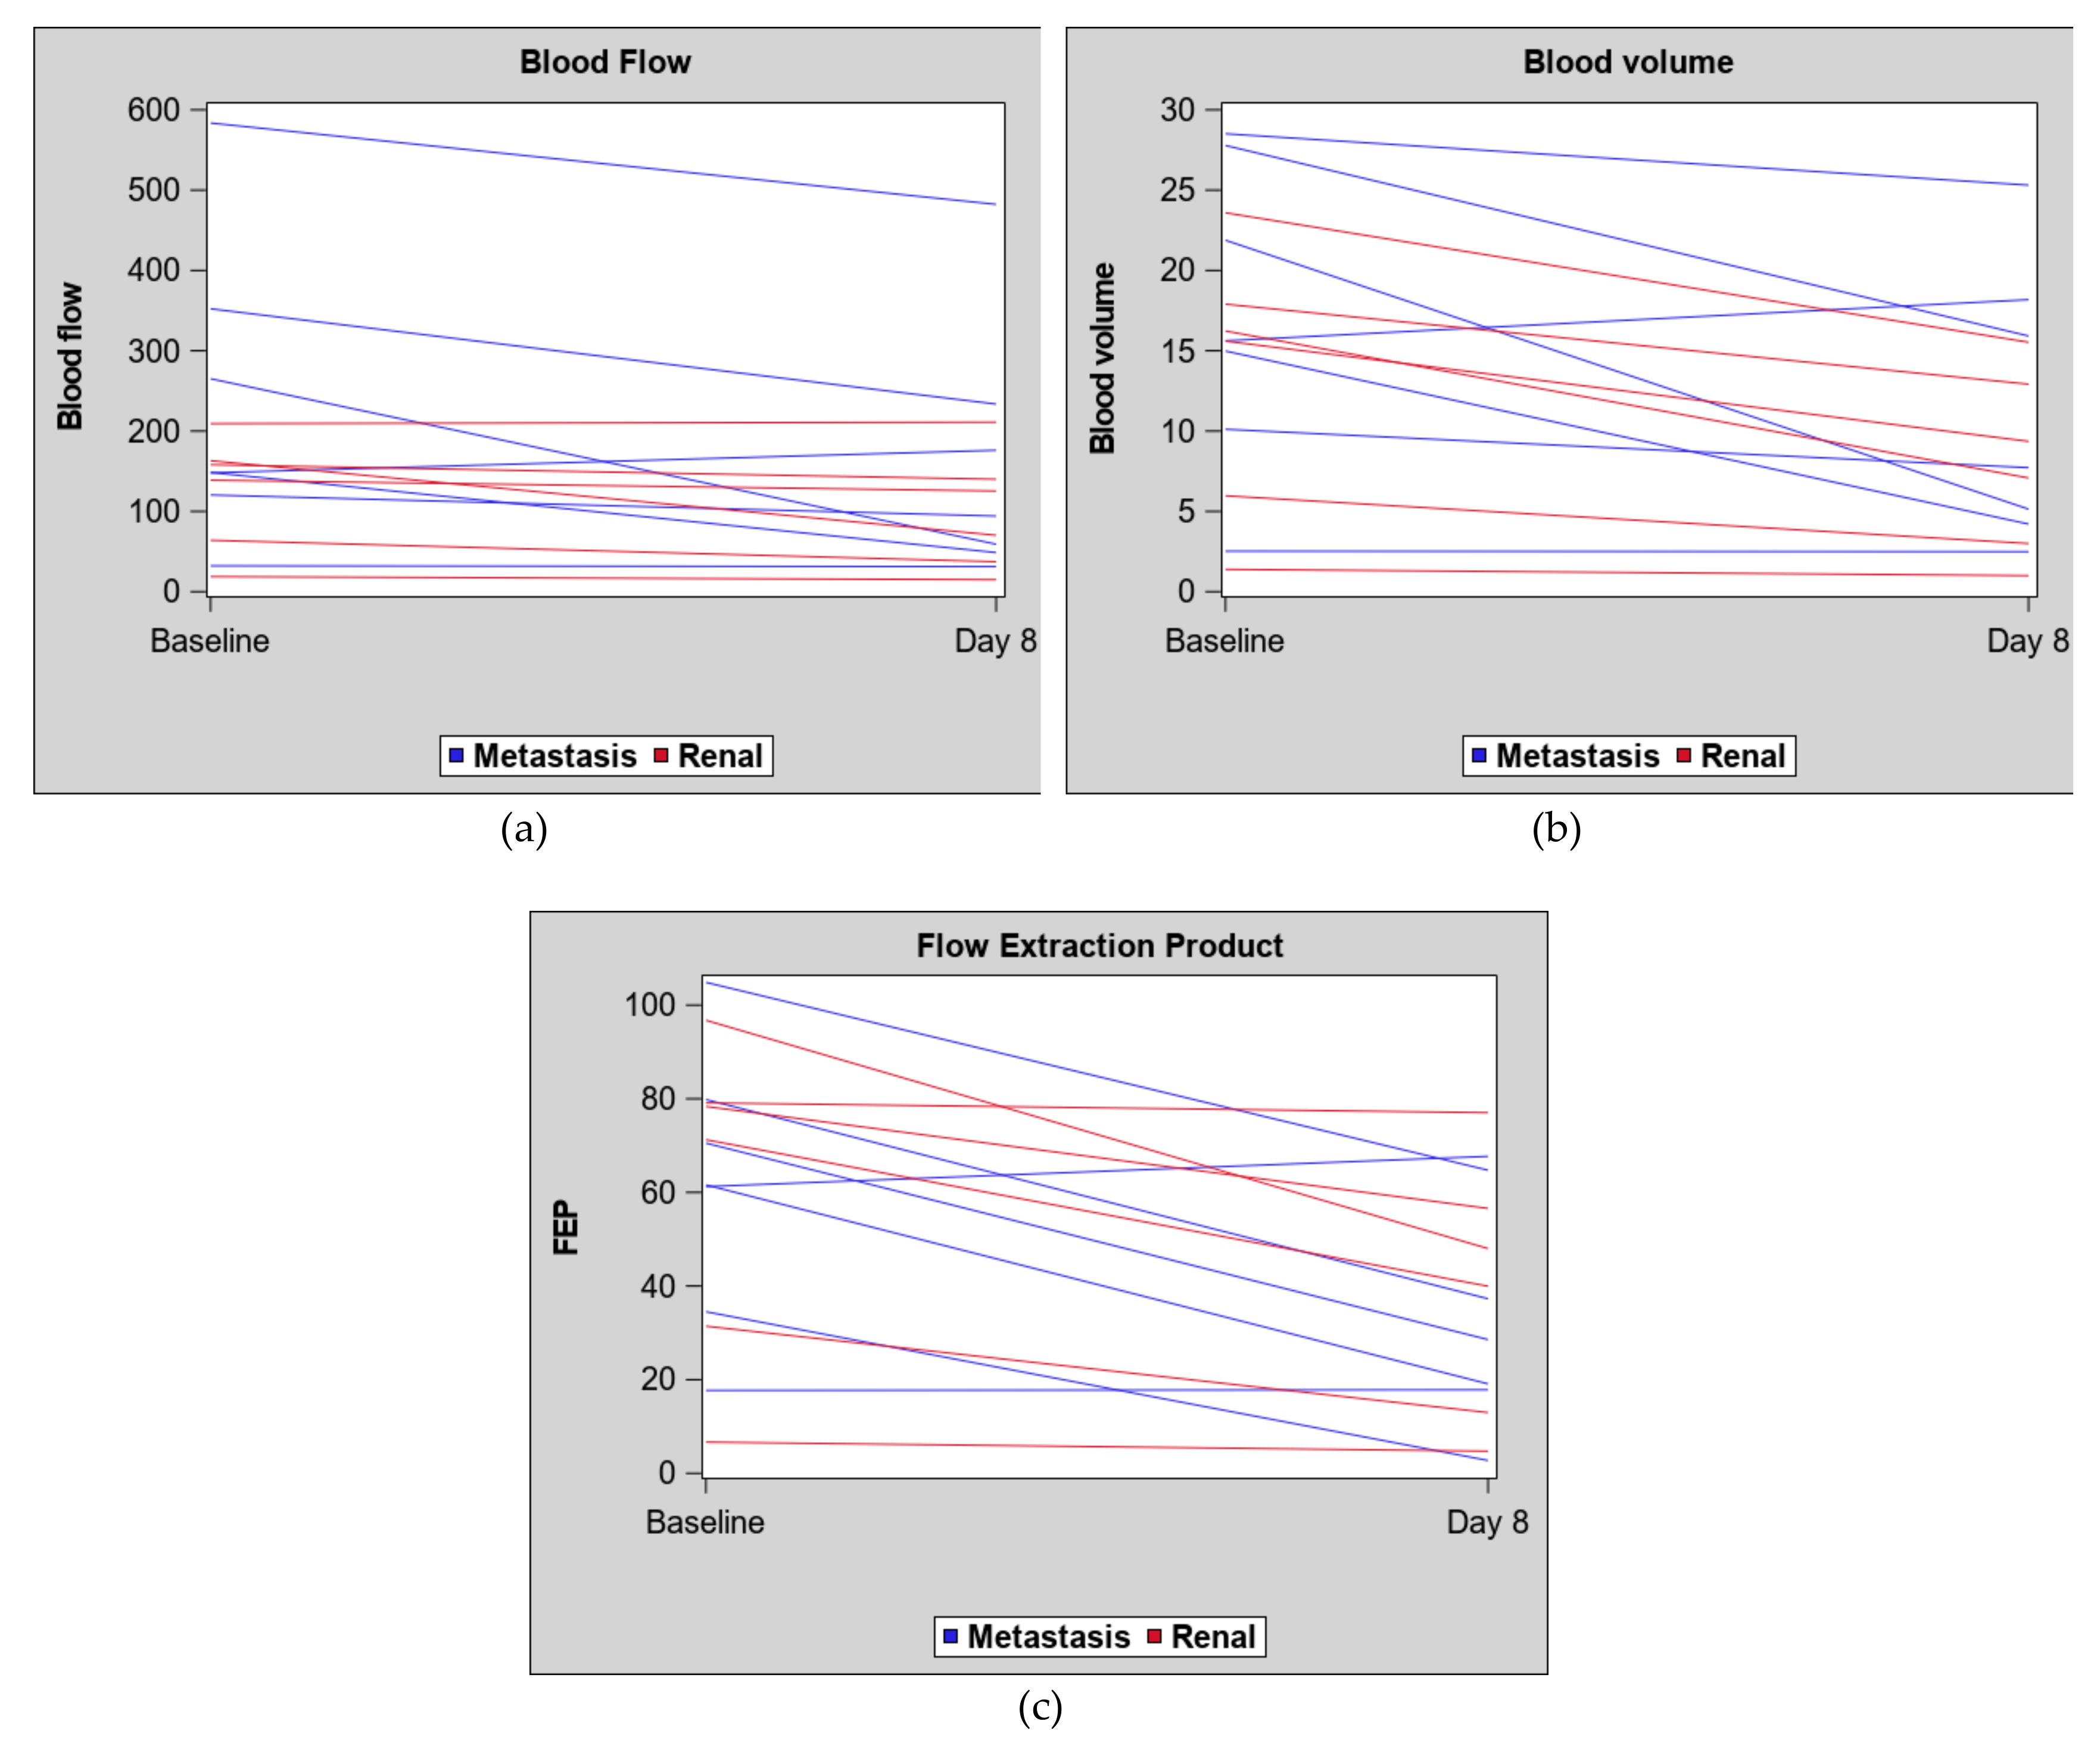
| Blood flow | ||||||
| Mean (SD) | 125.4 (70.5) | 99.8 (73.0) | −25.5 (34.51) | 235.7 (185.05) | 160.7 (159.70) | −75.0 (80.47) |
| Median (IQR) | 148.5 (64.0, 163.1) | 97.8 (37.3, 140.0) | −15.7 (−26.7, −3.8) | 148.4 (120.4, 352.3) | 94.2 (48.7, 233.6) | −99.7 (−118.7, −1.0) |
| Flow extraction product | ||||||
| Mean (SD) | 60.6 (34.18) | 39.9 (27.14) | −20.7 (17.91) | 61.5 (28.70) | 34.0 (24.43) | −27.5 (21.43) |
| Median (IQR) | 74.8 (31.4, 79.1) | 44.0 (13.0, 56.6) | −20.1 (−31.3, −2.09) | 61.6 (34.5, 79.8) | 28.6 (17.8, 64.7) | −40.1 (−42.5, 0.12) |
© 2019 by the authors. Licensee MDPI, Basel, Switzerland. This article is an open access article distributed under the terms and conditions of the Creative Commons Attribution (CC BY) license (http://creativecommons.org/licenses/by/4.0/).
Share and Cite
Fan, A.C.; Sundaram, V.; Kino, A.; Schmiedeskamp, H.; Metzner, T.J.; Kamaya, A. Early Changes in CT Perfusion Parameters: Primary Renal Carcinoma Versus Metastases After Treatment with Targeted Therapy. Cancers 2019, 11, 608. https://doi.org/10.3390/cancers11050608
Fan AC, Sundaram V, Kino A, Schmiedeskamp H, Metzner TJ, Kamaya A. Early Changes in CT Perfusion Parameters: Primary Renal Carcinoma Versus Metastases After Treatment with Targeted Therapy. Cancers. 2019; 11(5):608. https://doi.org/10.3390/cancers11050608
Chicago/Turabian StyleFan, Alice C., Vandana Sundaram, Aya Kino, Heiko Schmiedeskamp, Thomas J. Metzner, and Aya Kamaya. 2019. "Early Changes in CT Perfusion Parameters: Primary Renal Carcinoma Versus Metastases After Treatment with Targeted Therapy" Cancers 11, no. 5: 608. https://doi.org/10.3390/cancers11050608
APA StyleFan, A. C., Sundaram, V., Kino, A., Schmiedeskamp, H., Metzner, T. J., & Kamaya, A. (2019). Early Changes in CT Perfusion Parameters: Primary Renal Carcinoma Versus Metastases After Treatment with Targeted Therapy. Cancers, 11(5), 608. https://doi.org/10.3390/cancers11050608