Article

Expression Profiling of Calcium Channels and Calcium-Activated Potassium Channels in Colorectal Cancer

by
Sajida Ibrahim
1,†,
Hassan Dakik
1,2,†,
Christophe Vandier
3,
Romain Chautard
1,4,
Gilles Paintaud
1,5,
Frédéric Mazurier
1,2,*,
Thierry Lecomte
1,4,
Maxime Guéguinou
1,‡ and
William Raoul
1,*,‡
1
Université de Tours, EA 7501 GICC, 37032 Tours CEDEX 01, France
2
CNRS ERL 7001 LNOx, 37032 Tours CEDEX 01, France
3
Inserm UMR 1069, Nutrition Croissance et Cancer (N2C), 37032 Tours CEDEX 01, France
4
CHRU de Tours, Department of Hepato-Gastroenterology and Digestive Oncology, 37044 Tours CEDEX 09, France
5
CHRU de Tours, Department of Medical Pharmacology, 37044 Tours CEDEX 9, France
*
Authors to whom correspondence should be addressed.
These two authors contributed equally to this work as the first author.
These two authors contributed equally to this work as the last author.
Cancers 2019, 11(4), 561; https://doi.org/10.3390/cancers11040561
Submission received: 1 April 2019 / Revised: 15 April 2019 / Accepted: 17 April 2019 / Published: 19 April 2019
(This article belongs to the Special Issue Colorectal Cancers)

Abstract

:
Background: Colorectal cancer (CRC) is a highly devastating cancer. Ca2+-dependent channels are now considered key regulators of tumor progression. In this study, we aimed to investigate the association of non-voltage gated Ca2+ channels and Ca2+-dependent potassium channels (KCa) with CRC using the transcriptional profile of their genes. Methods: We selected a total of 35 genes covering KCa channels KCNN14, KCNMA1 and their subunits KCNMB14, endoplasmic reticulum (ER) calcium sensors STIM1 and STIM2, Ca2+ channels ORAI1–3 and the family of cation channels TRP (TRPC1–7, TRPA1, TRPV1/2,4–6 and TRPM1–8). We analyzed their expression in two public CRC datasets from The Cancer Genome Atlas (TCGA) and GSE39582. Results: KCNN4 and TRPM2 were induced while KCNMA1 and TRPM6 were downregulated in tumor tissues comparing to normal tissues. In proximal tumors, STIM2 and KCNN2 were upregulated while ORAI2 and TRPM6 were downregulated. ORAI1 decreased in lymph node metastatic tumors. TRPC1 and ORAI3 predicted poor prognosis in CRC patients. Moreover, we found that ORAI3/ORAI1 ratio is increased in CRC progression and predicted poor prognosis. Conclusions: KCa and Ca2+ channels could be important contributors to CRC initiation and progression. Our results provide new insights on KCa and Ca2+ channels remodeling in CRC.

Graphical Abstract

1. Introduction

Colorectal cancer (CRC) is the third most common cancer in western countries, with a highly metastatic proportion at diagnosis (20% to 25%) [1,2]. Understanding the mechanisms behind tumor migration, invasion and metastasis is essential to the search for drugs that will help prevent the spread of the disease and thereby reduce related mortality. Indeed, cell migration and invasion are Ca2+-dependent processes orchestrated through many Ca2+-sensitive effector molecules in both normal and pathological conditions. However, even though the role of Ca2+ signaling has long been suspected in these processes, ion channel proteins were largely understudied until recently [3,4]. Over the last two decades, it became evident that Ca2+ channels act as novel and important regulators of specific steps in tumor progression covering all major hallmarks of cancer progression [5,6]. Non-voltage gated Ca2+ channels are the major Ca2+ entry pathways in non-excitable cells and can be divided into two groups: Store Operated Channels (SOCs) and Store-independent Ca2+ channels (SICs).
The concept of Store Operated Calcium Entry (SOCE) was proposed by Putney three decades ago [7]. Briefly, upon stimulation, phospholipase C (PLC)-linked receptors produce inositol trisphosphate (IP3), which then interacts with IP3 receptors (IP3R) on the membrane of the endoplasmic reticulum (ER) and induces the release of Ca2+ [8]. The decrease in ER Ca2+ concentration is followed by the activation of two transmembrane proteins located in the ER membrane: stromal interaction molecule 1 (STIM1) and STIM2. The dissociation of Ca2+ from the EF hand domains of STIM1 and STIM2 results in conformational changes that enable them to activate ORAI and TRPC1 channels in the plasma membrane [9].
On the other hand, SICs include three different subtypes of channels: Receptor Operated Channels (ROCs), Second Messenger Operated Channels (SMOCs) and Constitutive Ca2+ Channels (CCCs). While CCCs are active without any stimulation [10], ROCs and SMOCs are active upon stimulation. ROCs, i.e., the P2X receptor, are directly activated in response to extracellular signals. SMOCs, i.e., TRP, are activated by intracellular ligands, such as diacyglycerol (DAG) or phospholipase A2 (PLA2).
Moreover, Shuttleworth and colleagues have identified a Ca2+-conductance activated by low concentration of exogenous AA and named it “Arachidonate Regulated Ca2+ Channel” (ARC channel) [11]. ARC channels were also found to be activated by low concentrations of agonists in which oscillatory Ca2+ signals are induced in murine parotid and pancreatic acinar cells [12]. It was later suggested that the ARC channel is formed by a combination of ORAI1 and ORAI3 subunits and regulated by STIM1 that constitutively resides in the plasma membrane [13,14].
The increase of cytosolic Ca2+ concentration through SOCs and SICs channels activates Ca2+-activated potassium channels, KCa, that are ranked according to their conductance: small-conductance potassium channels (SKCa) including KCa2.1 (SK1), 2.2 (SK2) and 2.3 (SK3) coded by KCNN1, KCNN2 and KCNN3 genes, respectively; intermediate-conductance potassium channels (IKCa), including KCa3.1 (SK4) coded by the KCNN4 gene; and big-conductance potassium channels, including BKCa coded by the KCNMA1 gene [15]. Indeed, the activation of KCa channels in non-excitable cells increases Ca2+ entry through SOCs and SICs by increasing the Ca2+ driving force. This positive feedback loop induced by KCa contributes to an increase in cytosolic Ca2+ concentration and amplifies the effects of Ca2+ signaling. However, the normal functions of the KCa channels are hijacked by cancer cells in order to promote their proliferation and metastasis. It became evident that an association of KCa and Ca2+ channels is found in cholesterol enriched nanodomains (also named lipid rafts) in cancer cells and contributes to cancer-associated functions, such as cell proliferation, migration and metastasis capacity [16]. In normal colonic cells, SOC is mediated by STIM1, STIM2 and ORAI1 [17], while in CRC cells, SOCE is mediated by STIM1, ORAI1, TRPC1 and SK3 [18]. Noteworthy, targeting the SK3/TRPC1/ORAI1 complex inhibited CRC cell migration [19,20]. Moreover, Villalobos and colleagues showed that the remodeling of SOCE is associated with increased expression of ORAI1, STIM1 and TRPC1 in HT29 CRC cells compared to immortalized NCM460 normal colon epithelial cell line [17]. Therefore, Villalobos et al. proposed that SOCE could be a novel key player in CRC and its inhibition by salicylate and that other nonsteroidal anti-inflammatory drugs (NSAIDs) could be a possible mechanism of cancer chemoprevention [21]. Recently, Moccia and colleagues showed that STIM1 and ORAI3 are upregulated in metastatic CRC cells with reduced constitutive Ca2+ entry and SOCE compared to primary CRC cells [22].
In this study, we aimed to investigate the transcriptional profile of genes coding for non-voltage gated Ca2+ channels and Ca2+-dependent potassium channels in CRC. For this purpose, we selected a total of 35 genes covering KCa channels KCNN1–4, KCNMA1 and its subunits KCNMB1–4, as well as ER Ca2+ sensors STIM1 and STIM2, Ca2+ channels ORAI1–3 and the family of cation channels TRP (TRPC1–7, TRPA1, TRPV1/2,4–6 and TRPM1–8) (Table S1). We analyzed their expression in two well-annotated public CRC datasets from The Cancer Genome Atlas (TCGA, RNAseq dataset) and La Ligue Contre le Cancer (GSE39582, microarray dataset). First, we studied the association of gene expression profiles with CRC initiation by comparing the expression between normal and tumor tissues. Next, we investigated their co-expression and their association with tumor primary sites, lymph node metastases and prognostic capacity. We found that KCa and Ca2+ channels could be important contributors to CRC initiation and progression. Our results also provide new insights about Ca2+ remodeling in CRC.

2. Results

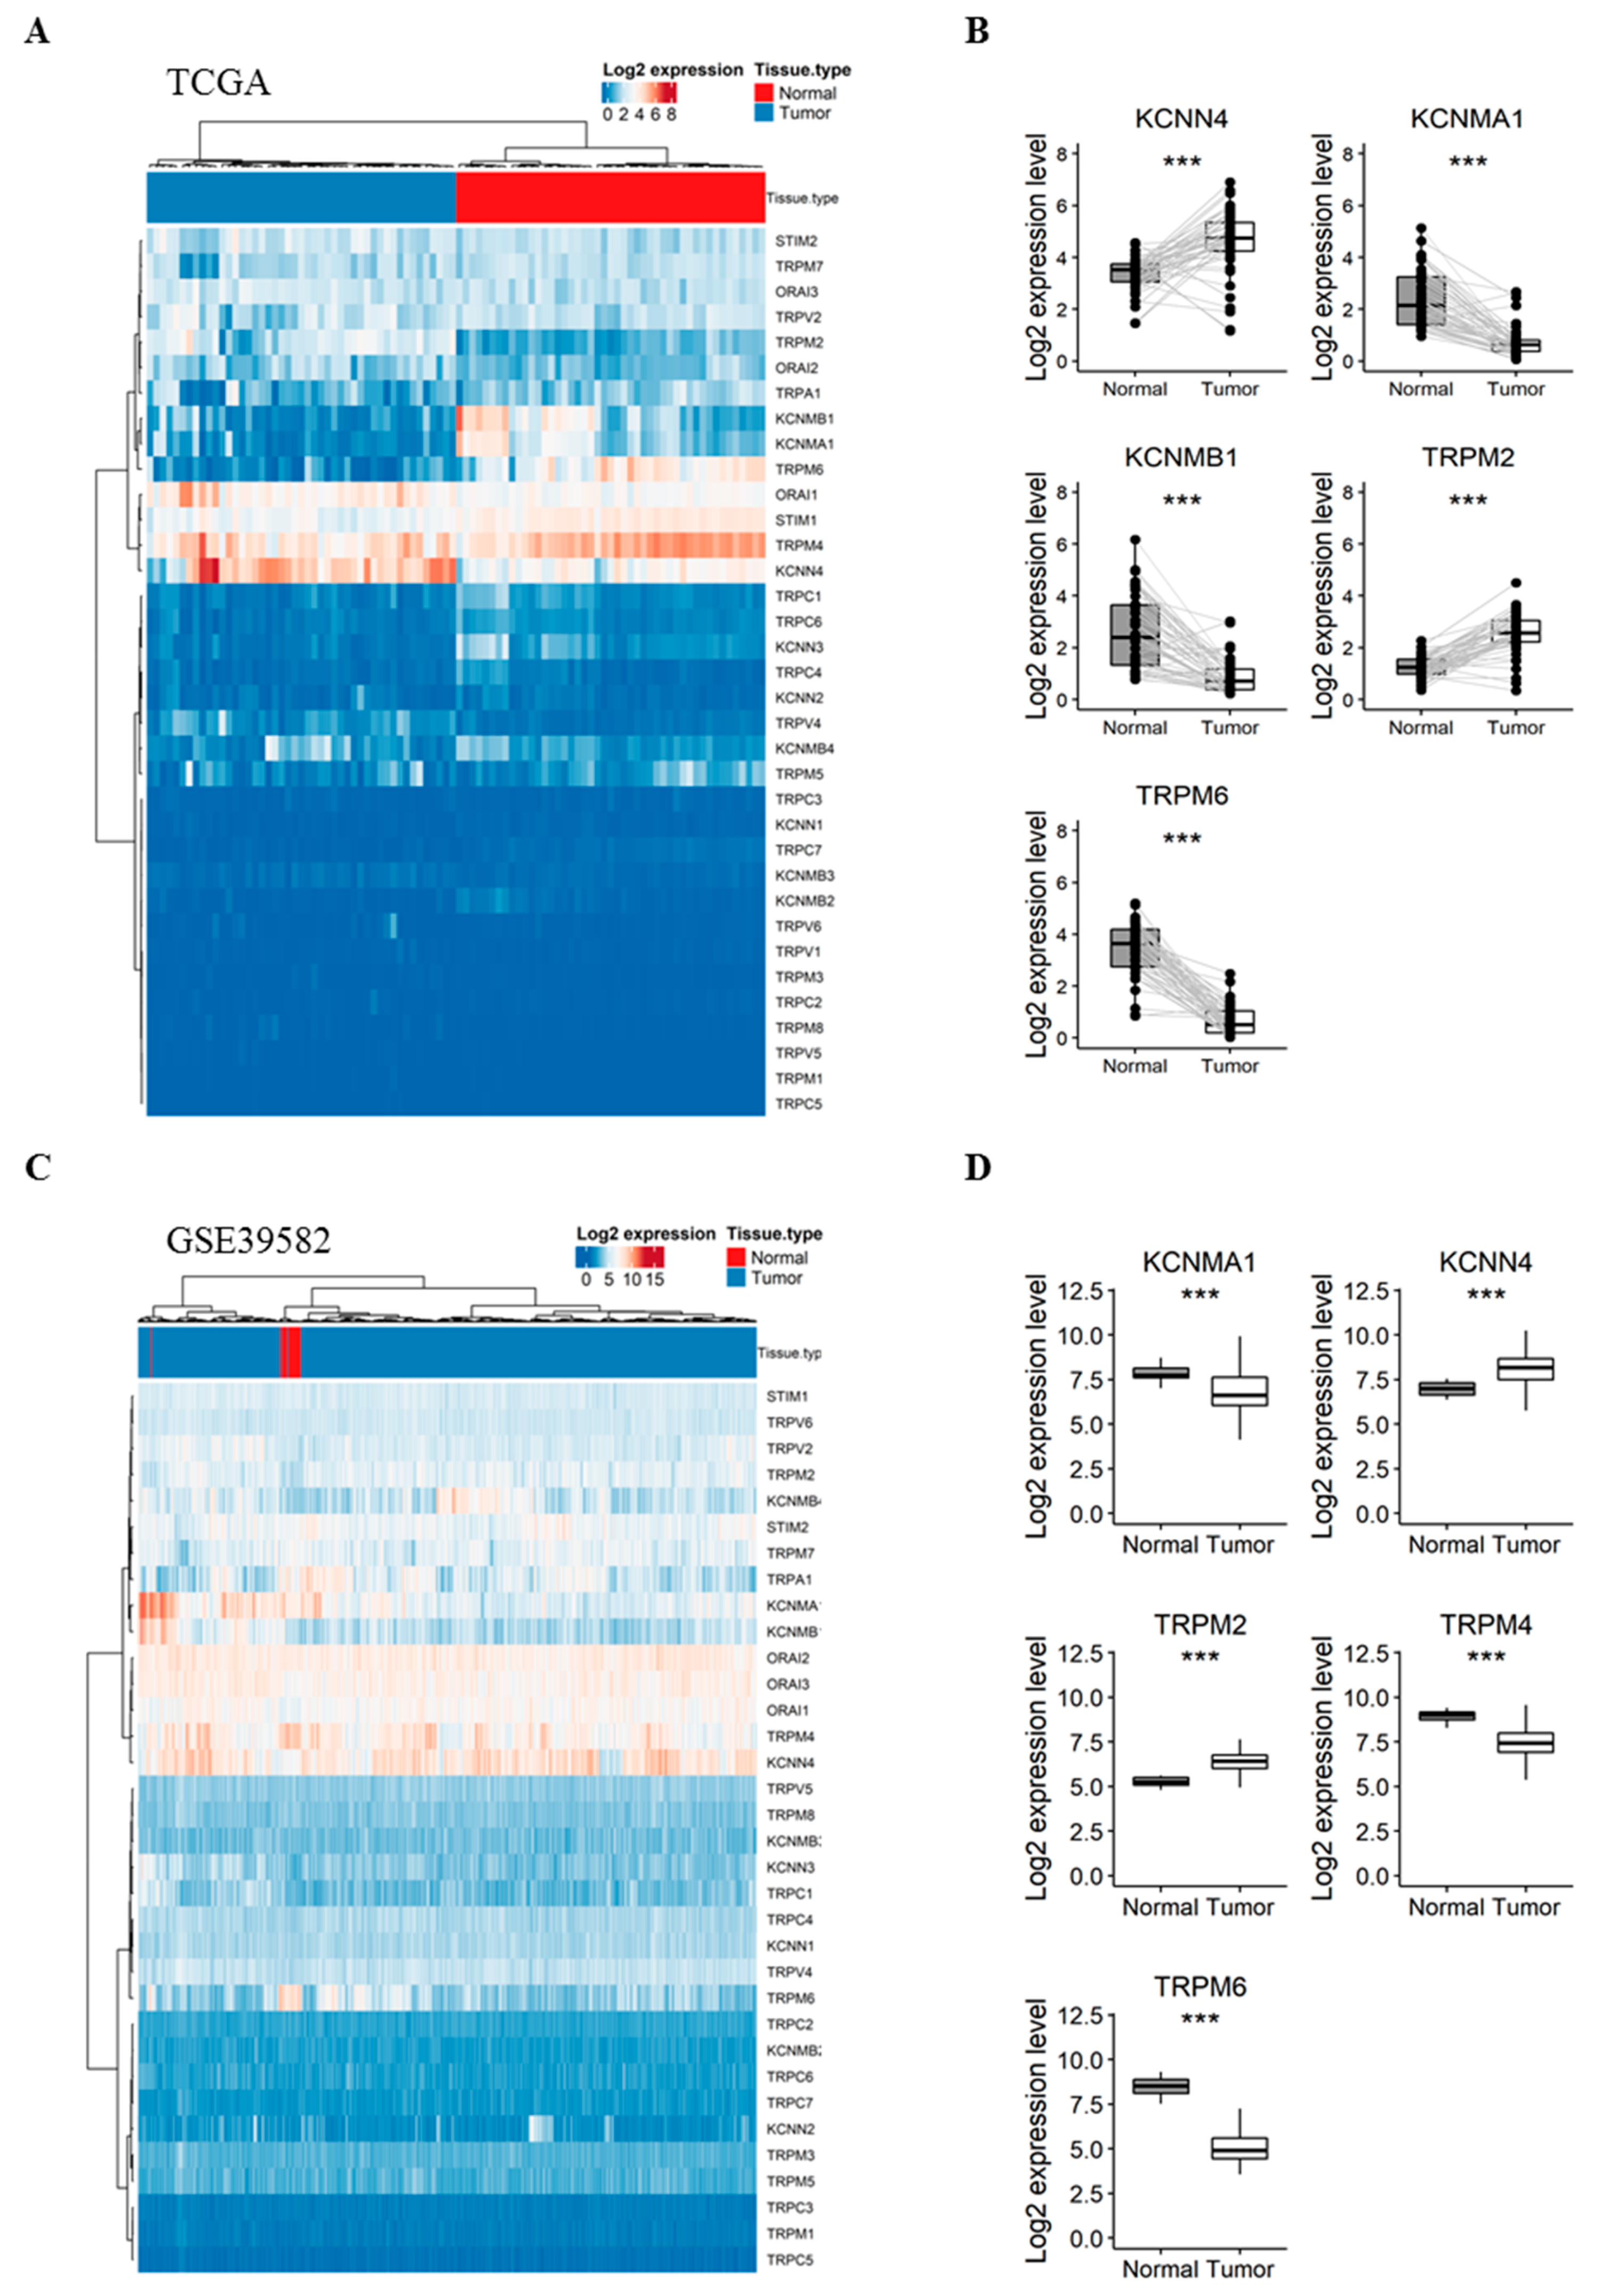
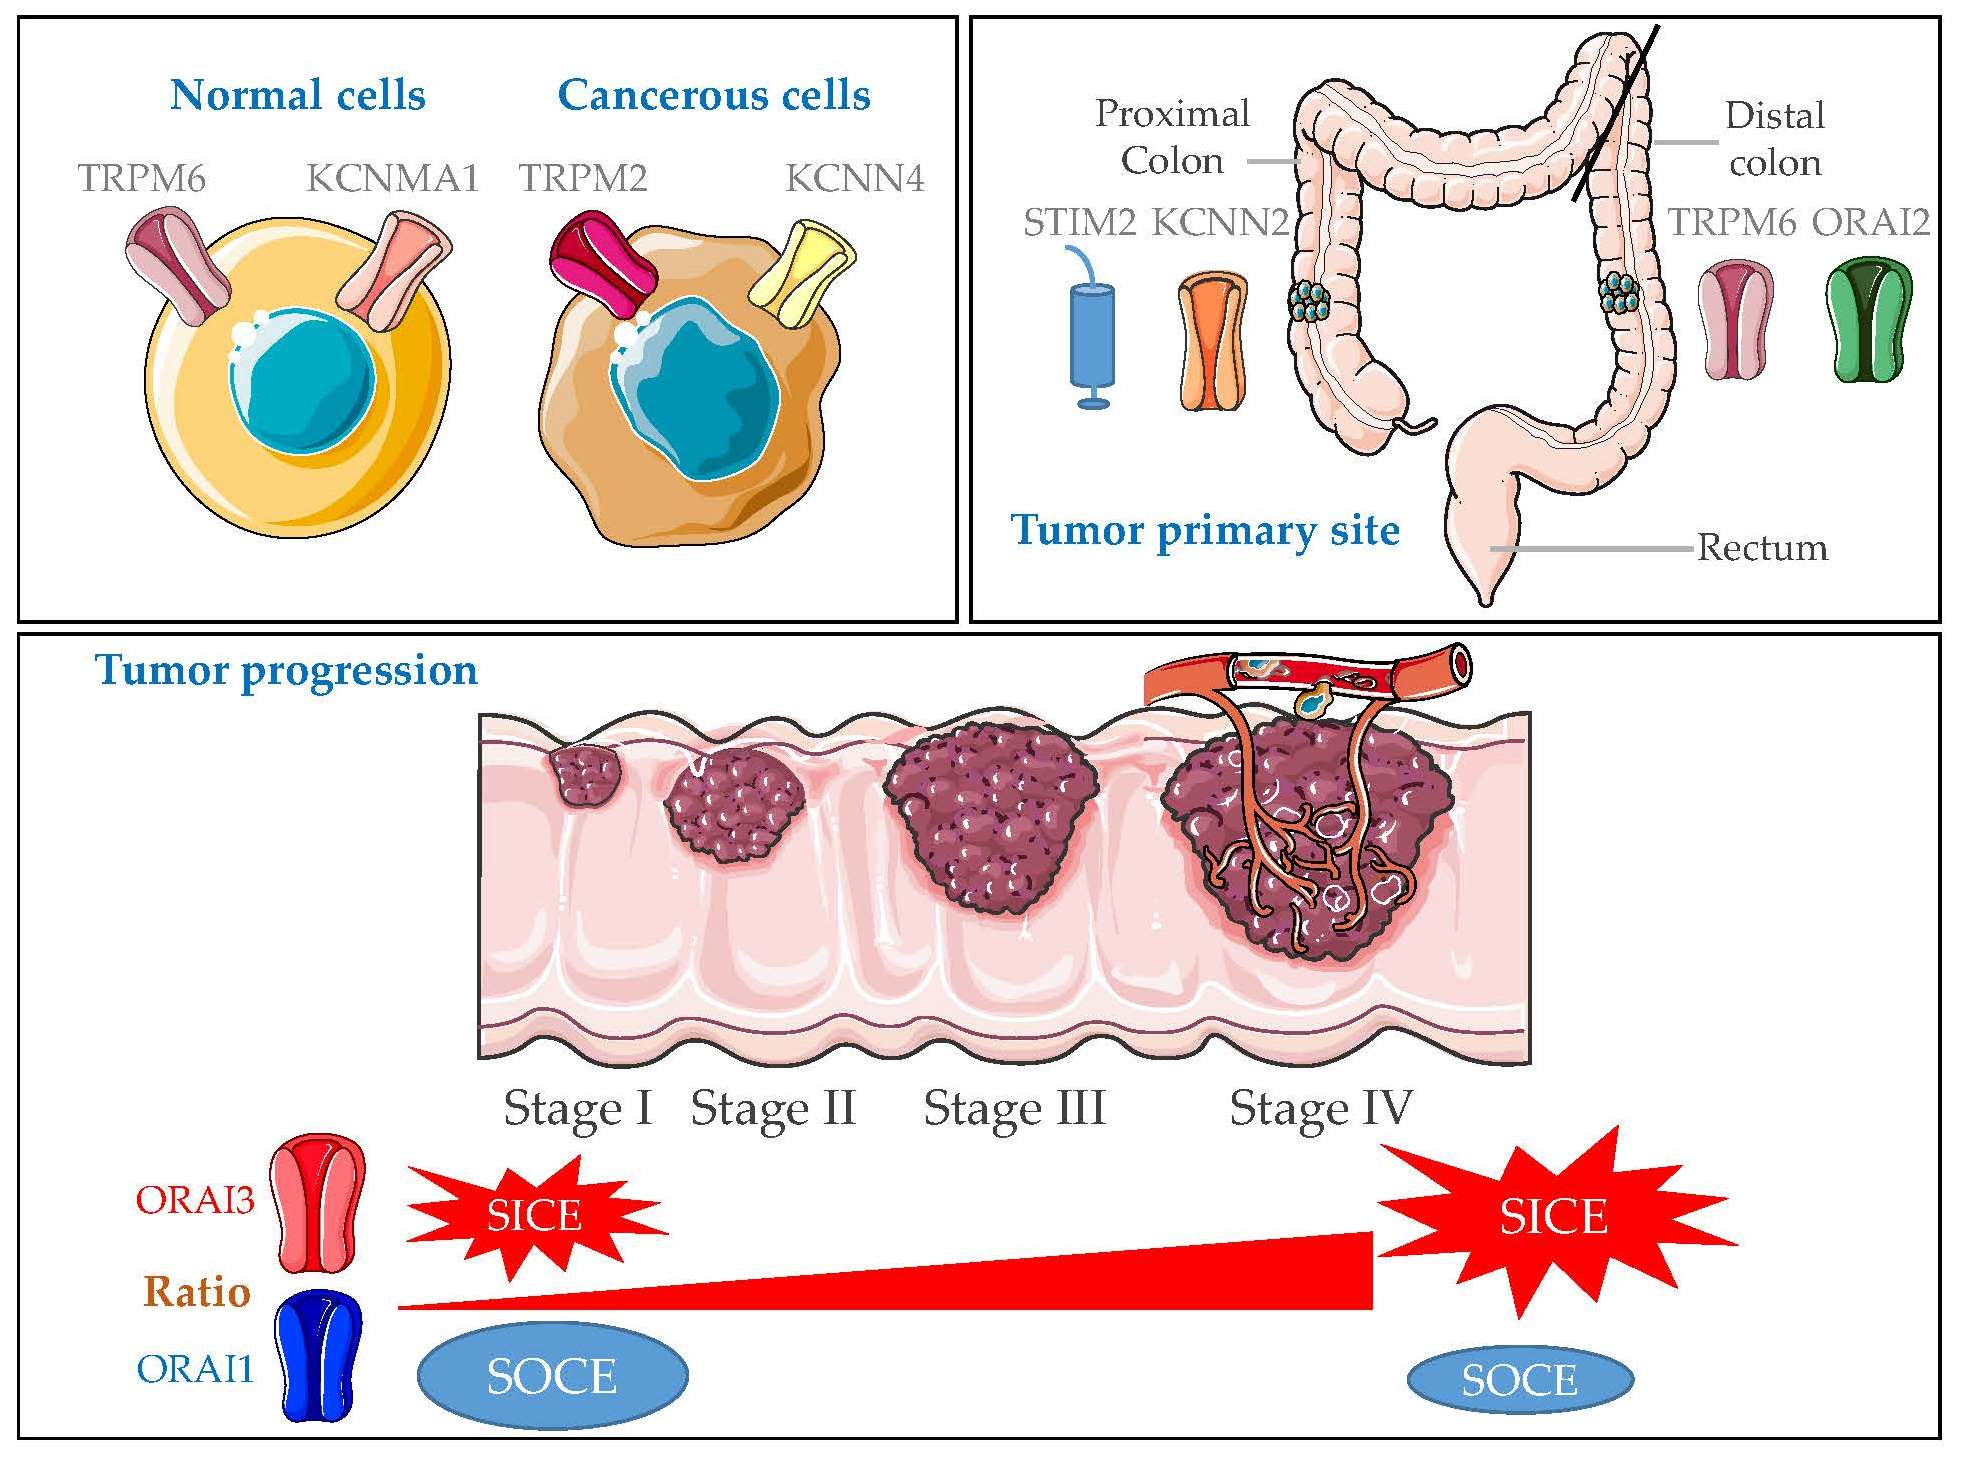
2.1. Gene Expression of KCa and Ca2+ Channels in Normal Mucosa versus CRC Tissues

Our first aim was to analyze whether the expression of selected genes varies between normal colorectal mucosa and CRC tissues. Therefore, we compared their expression in 47 pairs of matched normal mucosa and tumor tissues from the TCGA dataset. Interestingly, the expression profile of the 35 genes was sufficient to perfectly discriminate normal samples from tumor ones when performing unsupervised hierarchical clustering (Figure 1A). Interestingly, five genes were highly deregulated between the two tissues (Figure 1B): (i) KCNN4 and TRPM2 were upregulated in tumor tissues with a fold-change of 1.24 and 1.28 (Table S2), respectively; (ii) while KCNMA1, KCNMB1 and TRPM6 were significantly downregulated in tumor tissues by −1.66, −1.73 and −2.76 fold, respectively (Table S2).
To validate these results, we next compared the expression profile of the genes in unmatched normal (n = 19) and tumor (n = 566) tissues from the GSE39582 dataset. The studied genes were again efficient to separate normal and tumor samples into distinct clusters (Figure 1C). Pairwise analysis showed that five genes were significantly deregulated between normal and tumor samples (Figure 1D), among which, four genes previously identified in the TCGA dataset: (1) KCNN4 and TRPM2 were again upregulated in tumor tissues with a 1.02 and 1.12-fold-change, respectively (Table S3). (2) KCNMA1, TRPM6 and TRPM4 were downregulated with a −1.13, −3.34 and −1.42 fold-change, respectively (Table S3). Indeed, TRPM4, which we found significantly down-regulated in tumor tissues (fold-change < −1) in the microarray dataset, was also down-regulated with a fold-change of −0.8 in the TCGA dataset (Table S2).
Given that the genes were able to discriminate between normal and tumor samples in both datasets, we next investigated the co-expression of Ca2+ and KCa channels and the possible correlation between their expression and the progression of CRC.

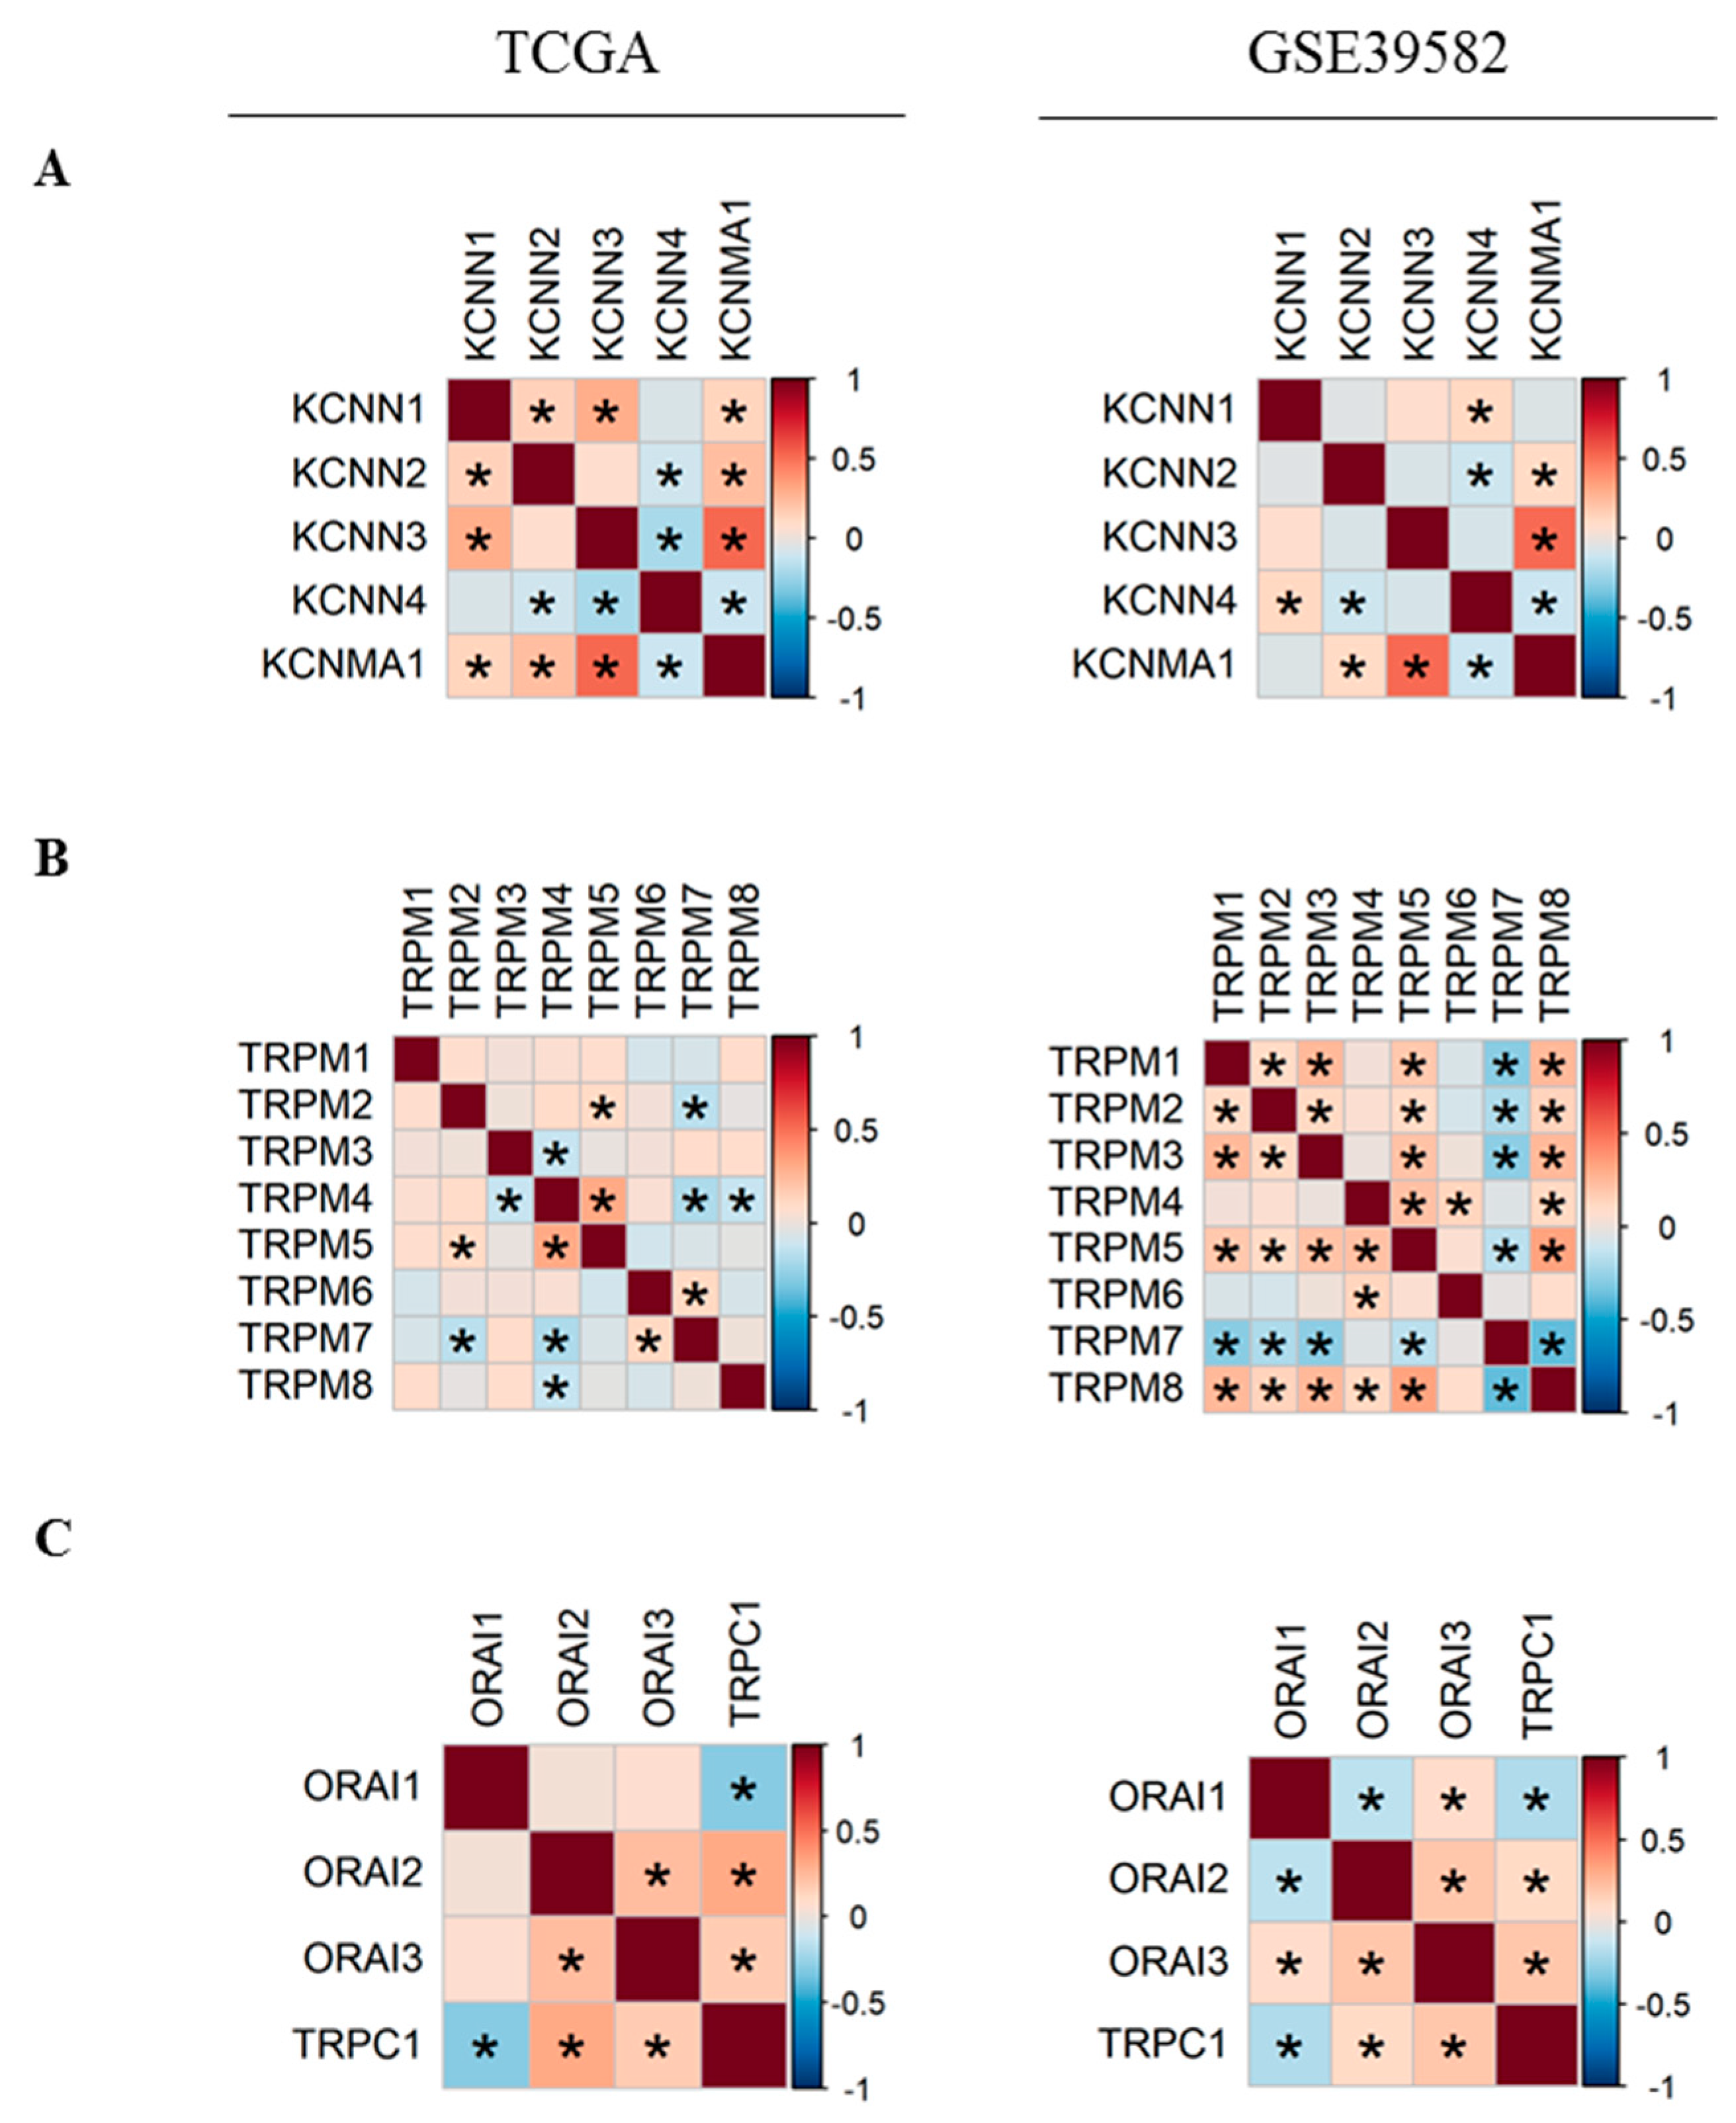
2.2. Co-Expression of Ca2+ and KCa Channels in CRC

In order to better understand the relationship between Ca2+ and KCa channels coding-genes, we analyzed their pairwise co-expressions by performing Pearson’s correlation analysis. A global matrix summarizing all pairwise correlations is presented in Supplementary Figure S1. Hierarchical clustering resulted in two clusters of positively-correlated genes in each dataset (Figure S1), suggesting the existence of possible co-regulation at the transcriptional level by common transcription factors. Since two KCa and two TRPM channels were differentially expressed between normal and tumor tissues, we decided to study more closely the co-expression of members within each of KCa and TRPM channel families (Figure 2). We found that the expression of KCNMA1 is positively correlated with KCNN2 and KCNN3 expression (Figure 2A). In addition, KCNN4 is negatively correlated with KCNN2 and KCNMA1 (Figure 2A). Moreover, we found that in both datasets, KCNMA1 expression is positively correlated with the expression of both regulatory subunits KCNMB1 and KCNMB2 (Figure S1B). Moreover, TRPM5 expression level is positively correlated with TRPM2 and TRPM4, while TRPM7 is negatively correlated with TRPM2 and TRPM5 in both datasets (Figure 2B). We also studied the co-expression of the most selective Ca2+ channels. We found that ORAI2 and ORAI3 are positively correlated (Figure 2C). TRPC1 is positively correlated with both ORAI2 and ORAI3 and is negatively correlated with ORAI1. No correlation is found between the expression of STIM1 and STIM2 (Figure S1C).

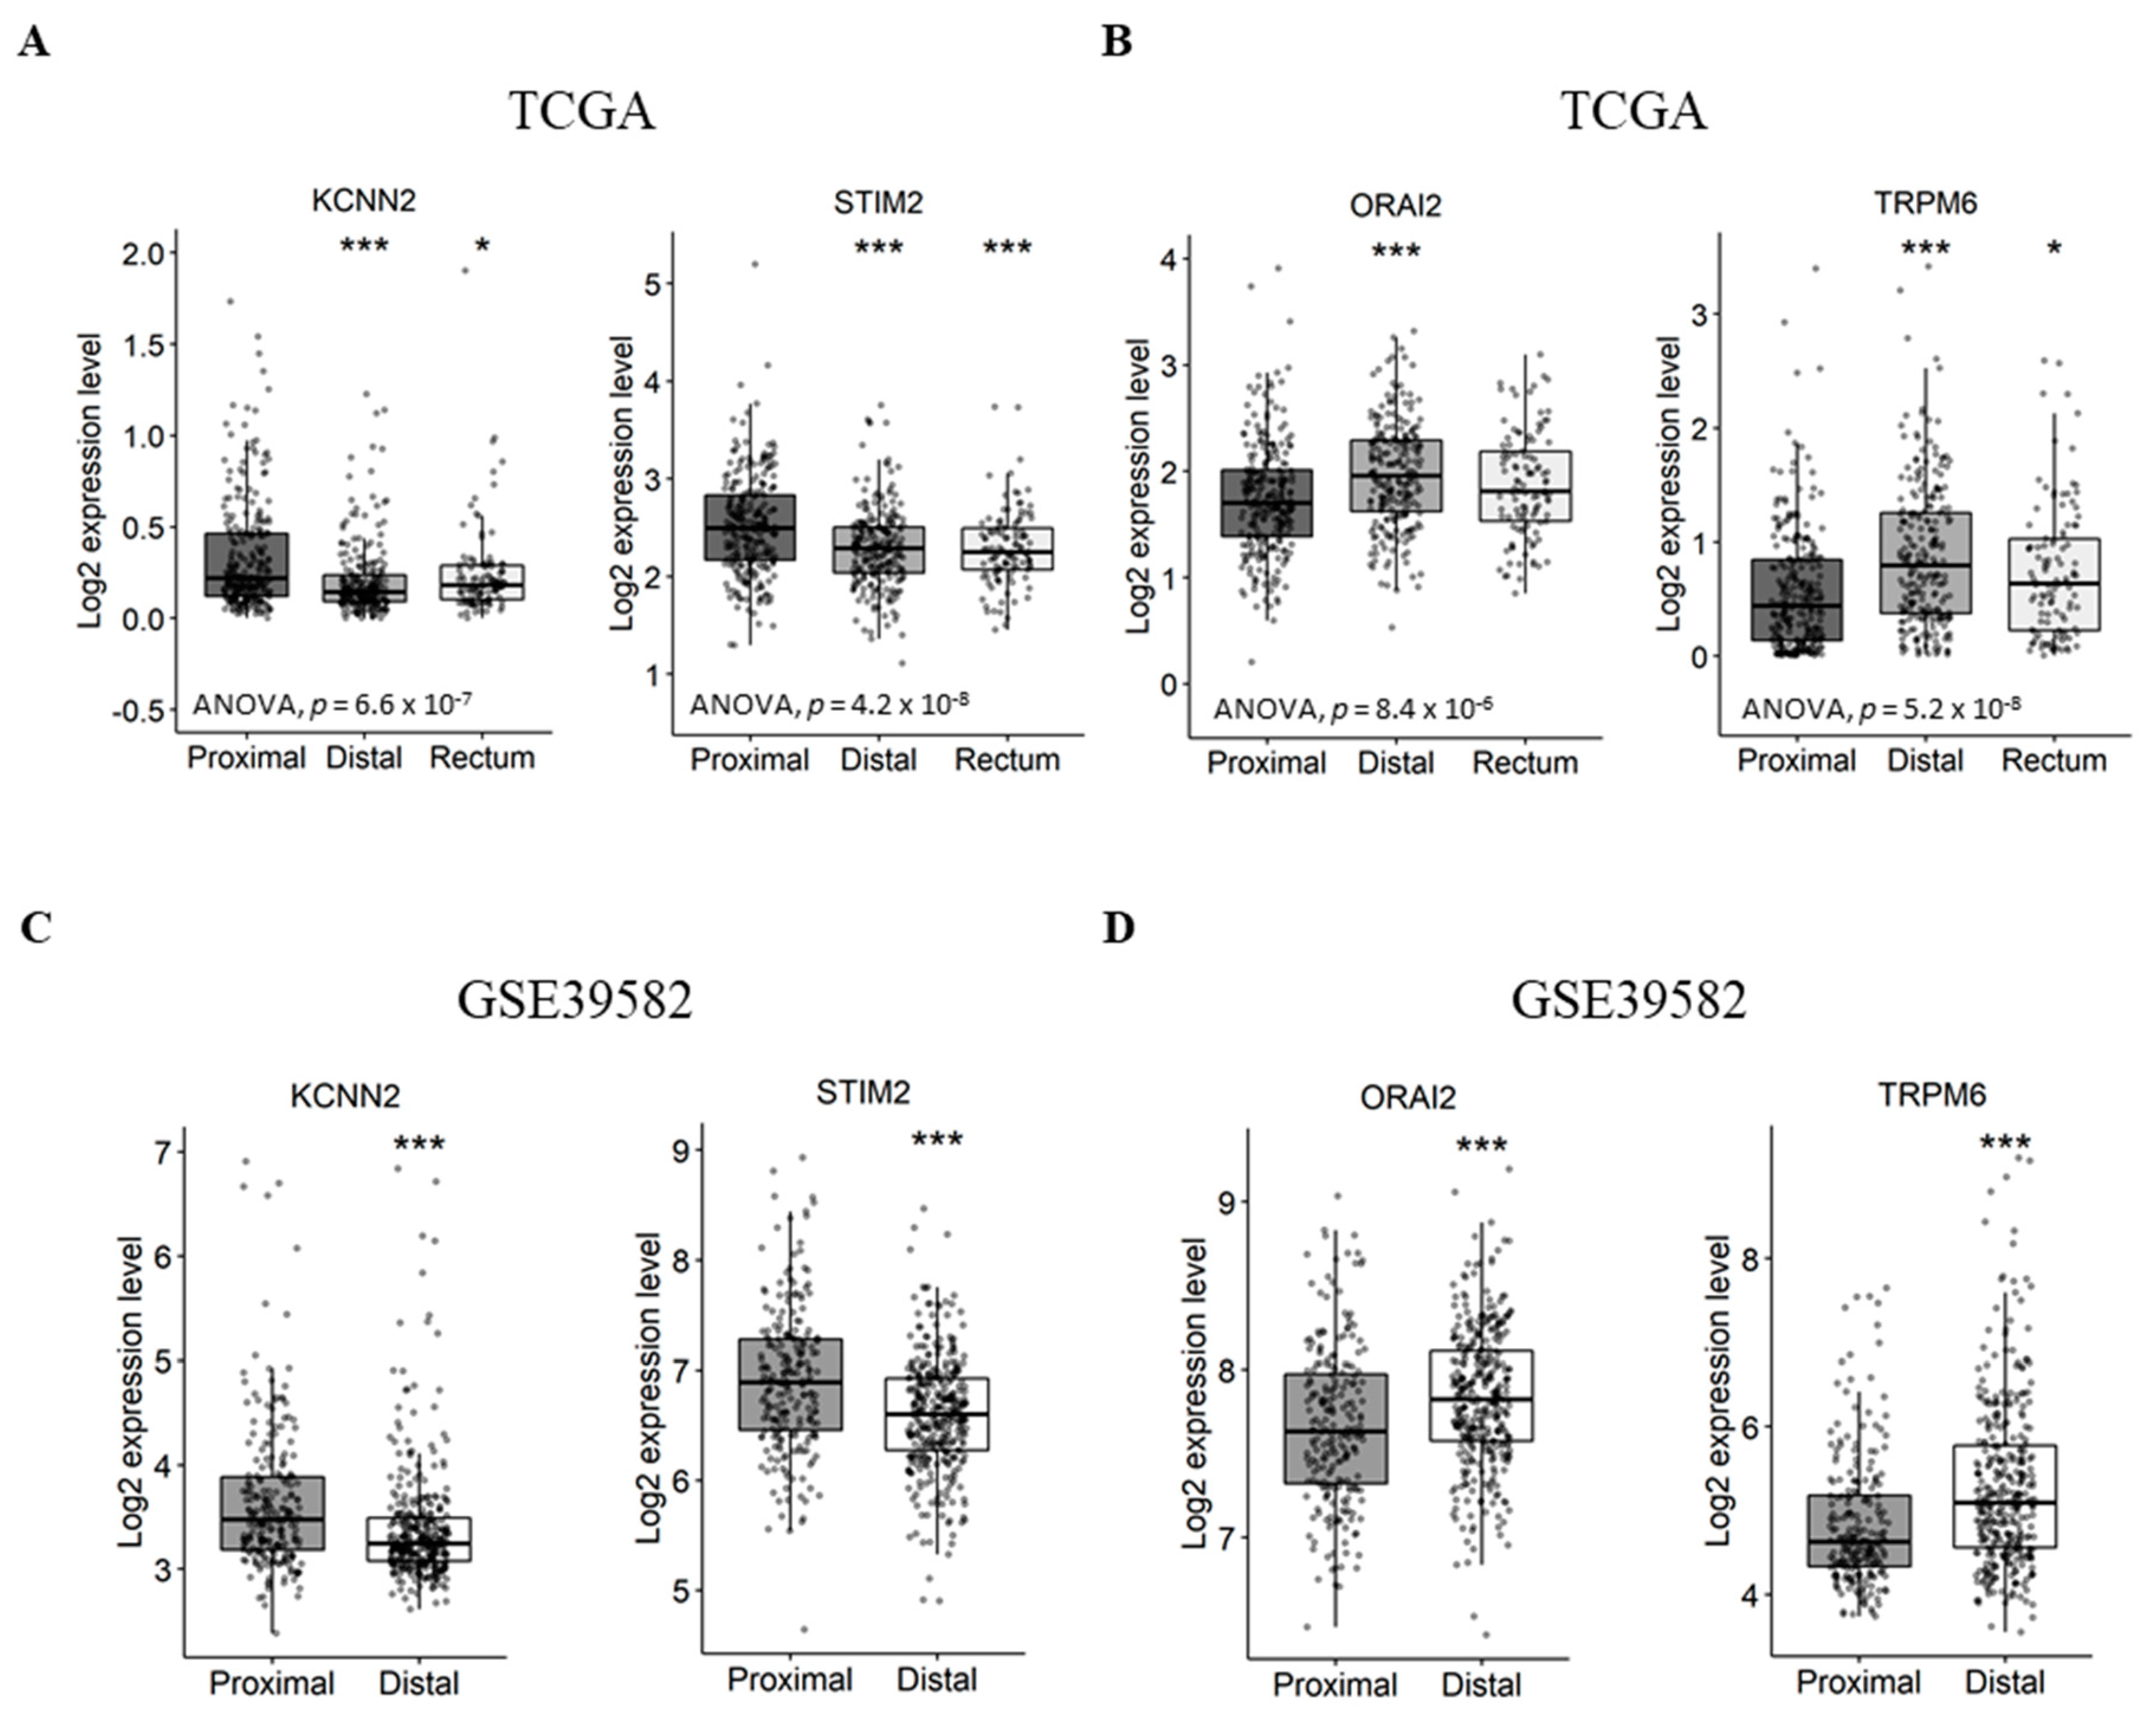
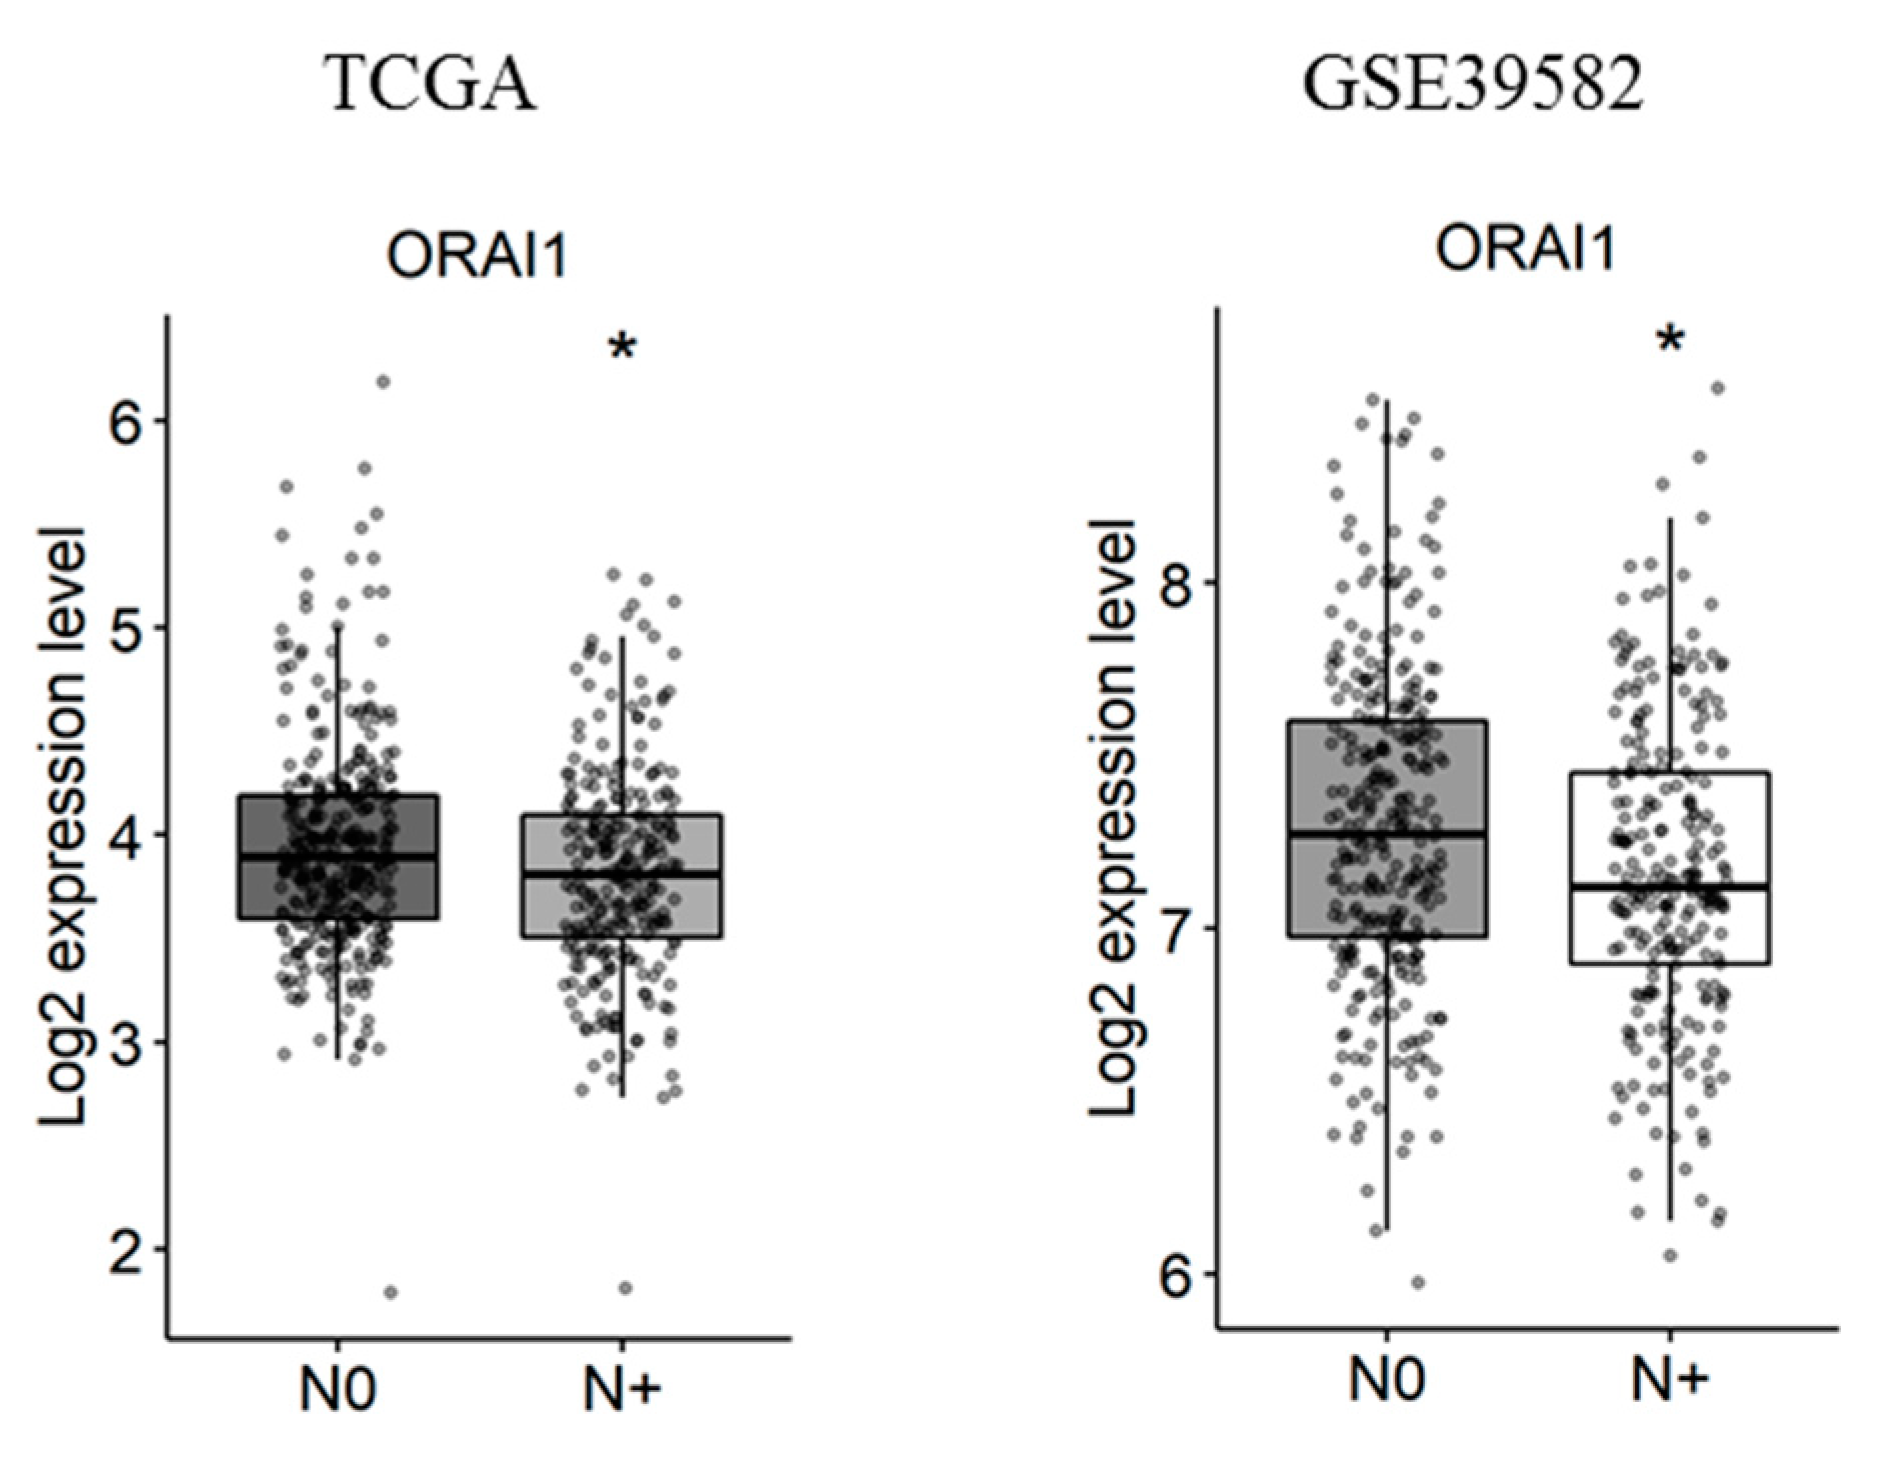
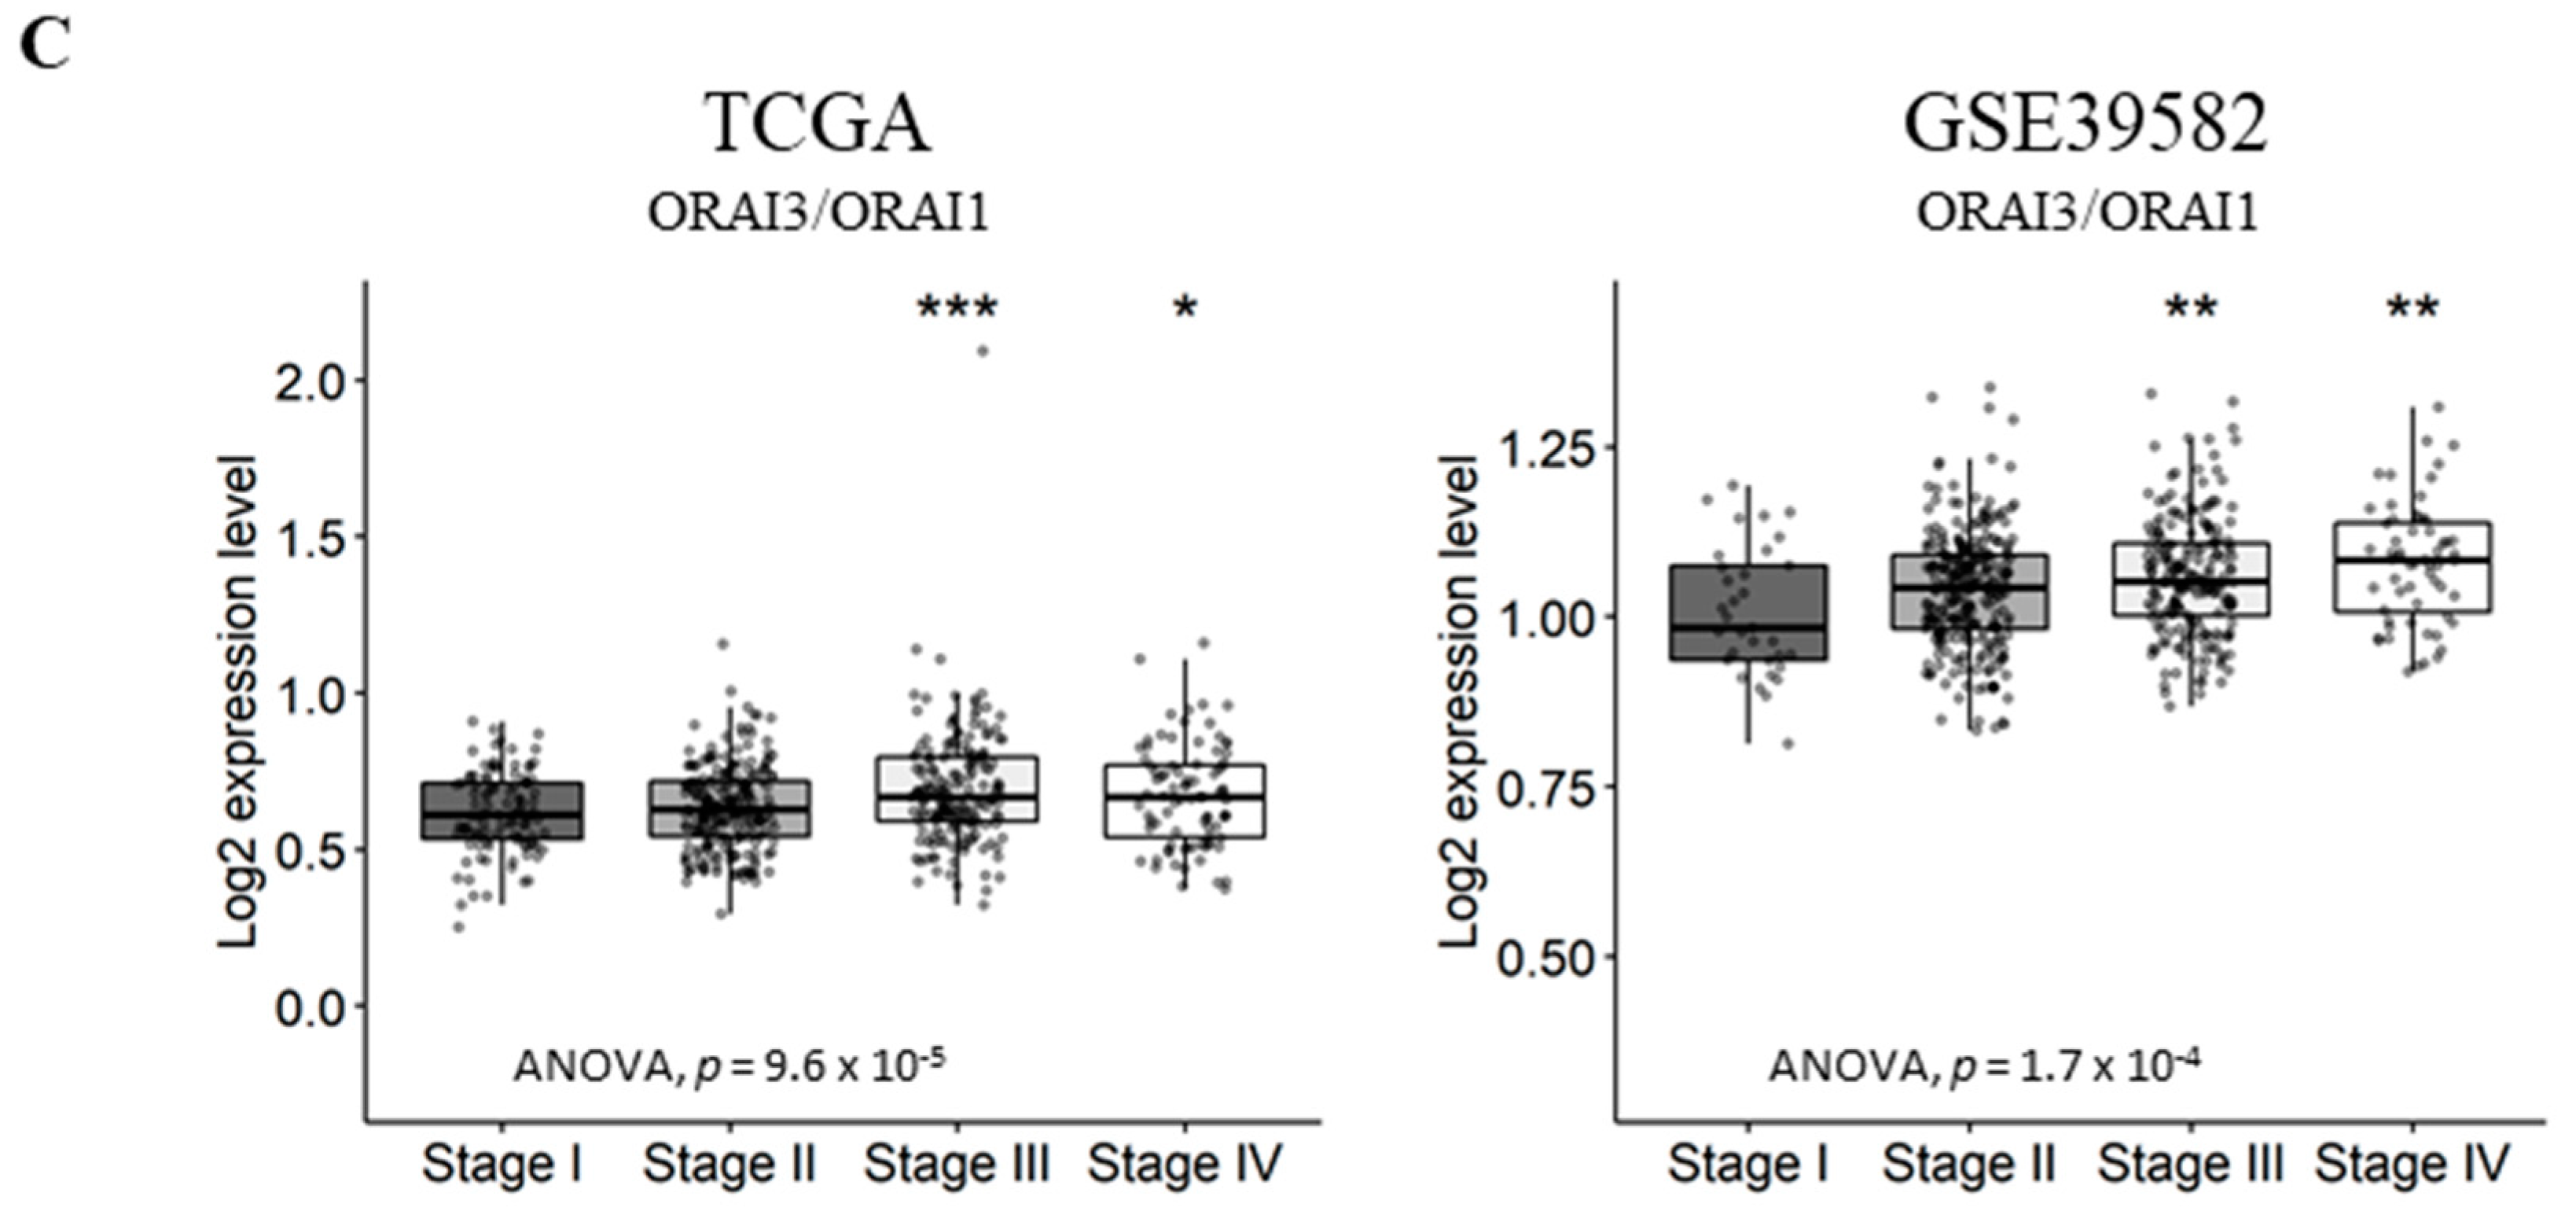
2.3. Gene Expression Analysis According to Tumor Primary Site, Lymph Node Metastases and Tumor Stage

First, we aimed to verify if the expression of Ca2+ and KCa channel coding-genes was correlated with tumor primary sites. In this way we compared gene expression levels between distal/rectal tumors and proximal tumors. Interestingly, we found that STIM2 and KCNN2 are more expressed in proximal tumors compared to distal tumors, both in the TCGA dataset (Figure 3A and Table S4. STIM2: fold-change −0.22 with p ≤ 0.001; KCNN2: fold-change −0.13 with p < 0.001) and the GSE39582 dataset (Figure 3C and Figure S5. STIM2: fold-change −0.31 with p < 0.001; KCNN2: fold-change −0.25 with p < 0.001). On the other hand, the results show that ORAI2 and TRPM6 are less expressed in proximal tumors compared to distal tumors, both, in the TCGA dataset (Figure 3B and Figure S4. ORAI2: fold-change 0.23 with p < 0.001; TRPM6: fold-change 0.31 with p < 0.001) and GSE39582 dataset (Figure 3D and Table S5. ORAI2: fold-change 0.16 with p < 0.001; TRPM6: fold-change 0.44 with p < 0.001). However, only the TCGA dataset contained rectum tumor samples, in which the expression profiles of KCNN2, STIM2 and TRPM6 followed that of the distal tumor samples (Figure 3A).
Next, the correlation of Ca2+ and KCa channels coding-gene expressions with lymph node metastases was studied. We found that, among the studied genes, only ORAI1 is deregulated in tumors with lymph node metastases in both the TCGA and the GSE39582 datasets (Figure 4 and Tables S6 and S7. fold-change of −0.13 and 0.13 with p = 0.016 and p = 0.03, respectively).
Afterwards, we investigated the correlation of gene expression with CRC progression. For this purpose, we decided to compare gene expression in stage IV, the most aggressive stage with distant metastases, to that of stages I, II and III combined which are less advanced. Unfortunately, none of the genes were concomitantly deregulated in the two datasets (Tables S8 and S9).

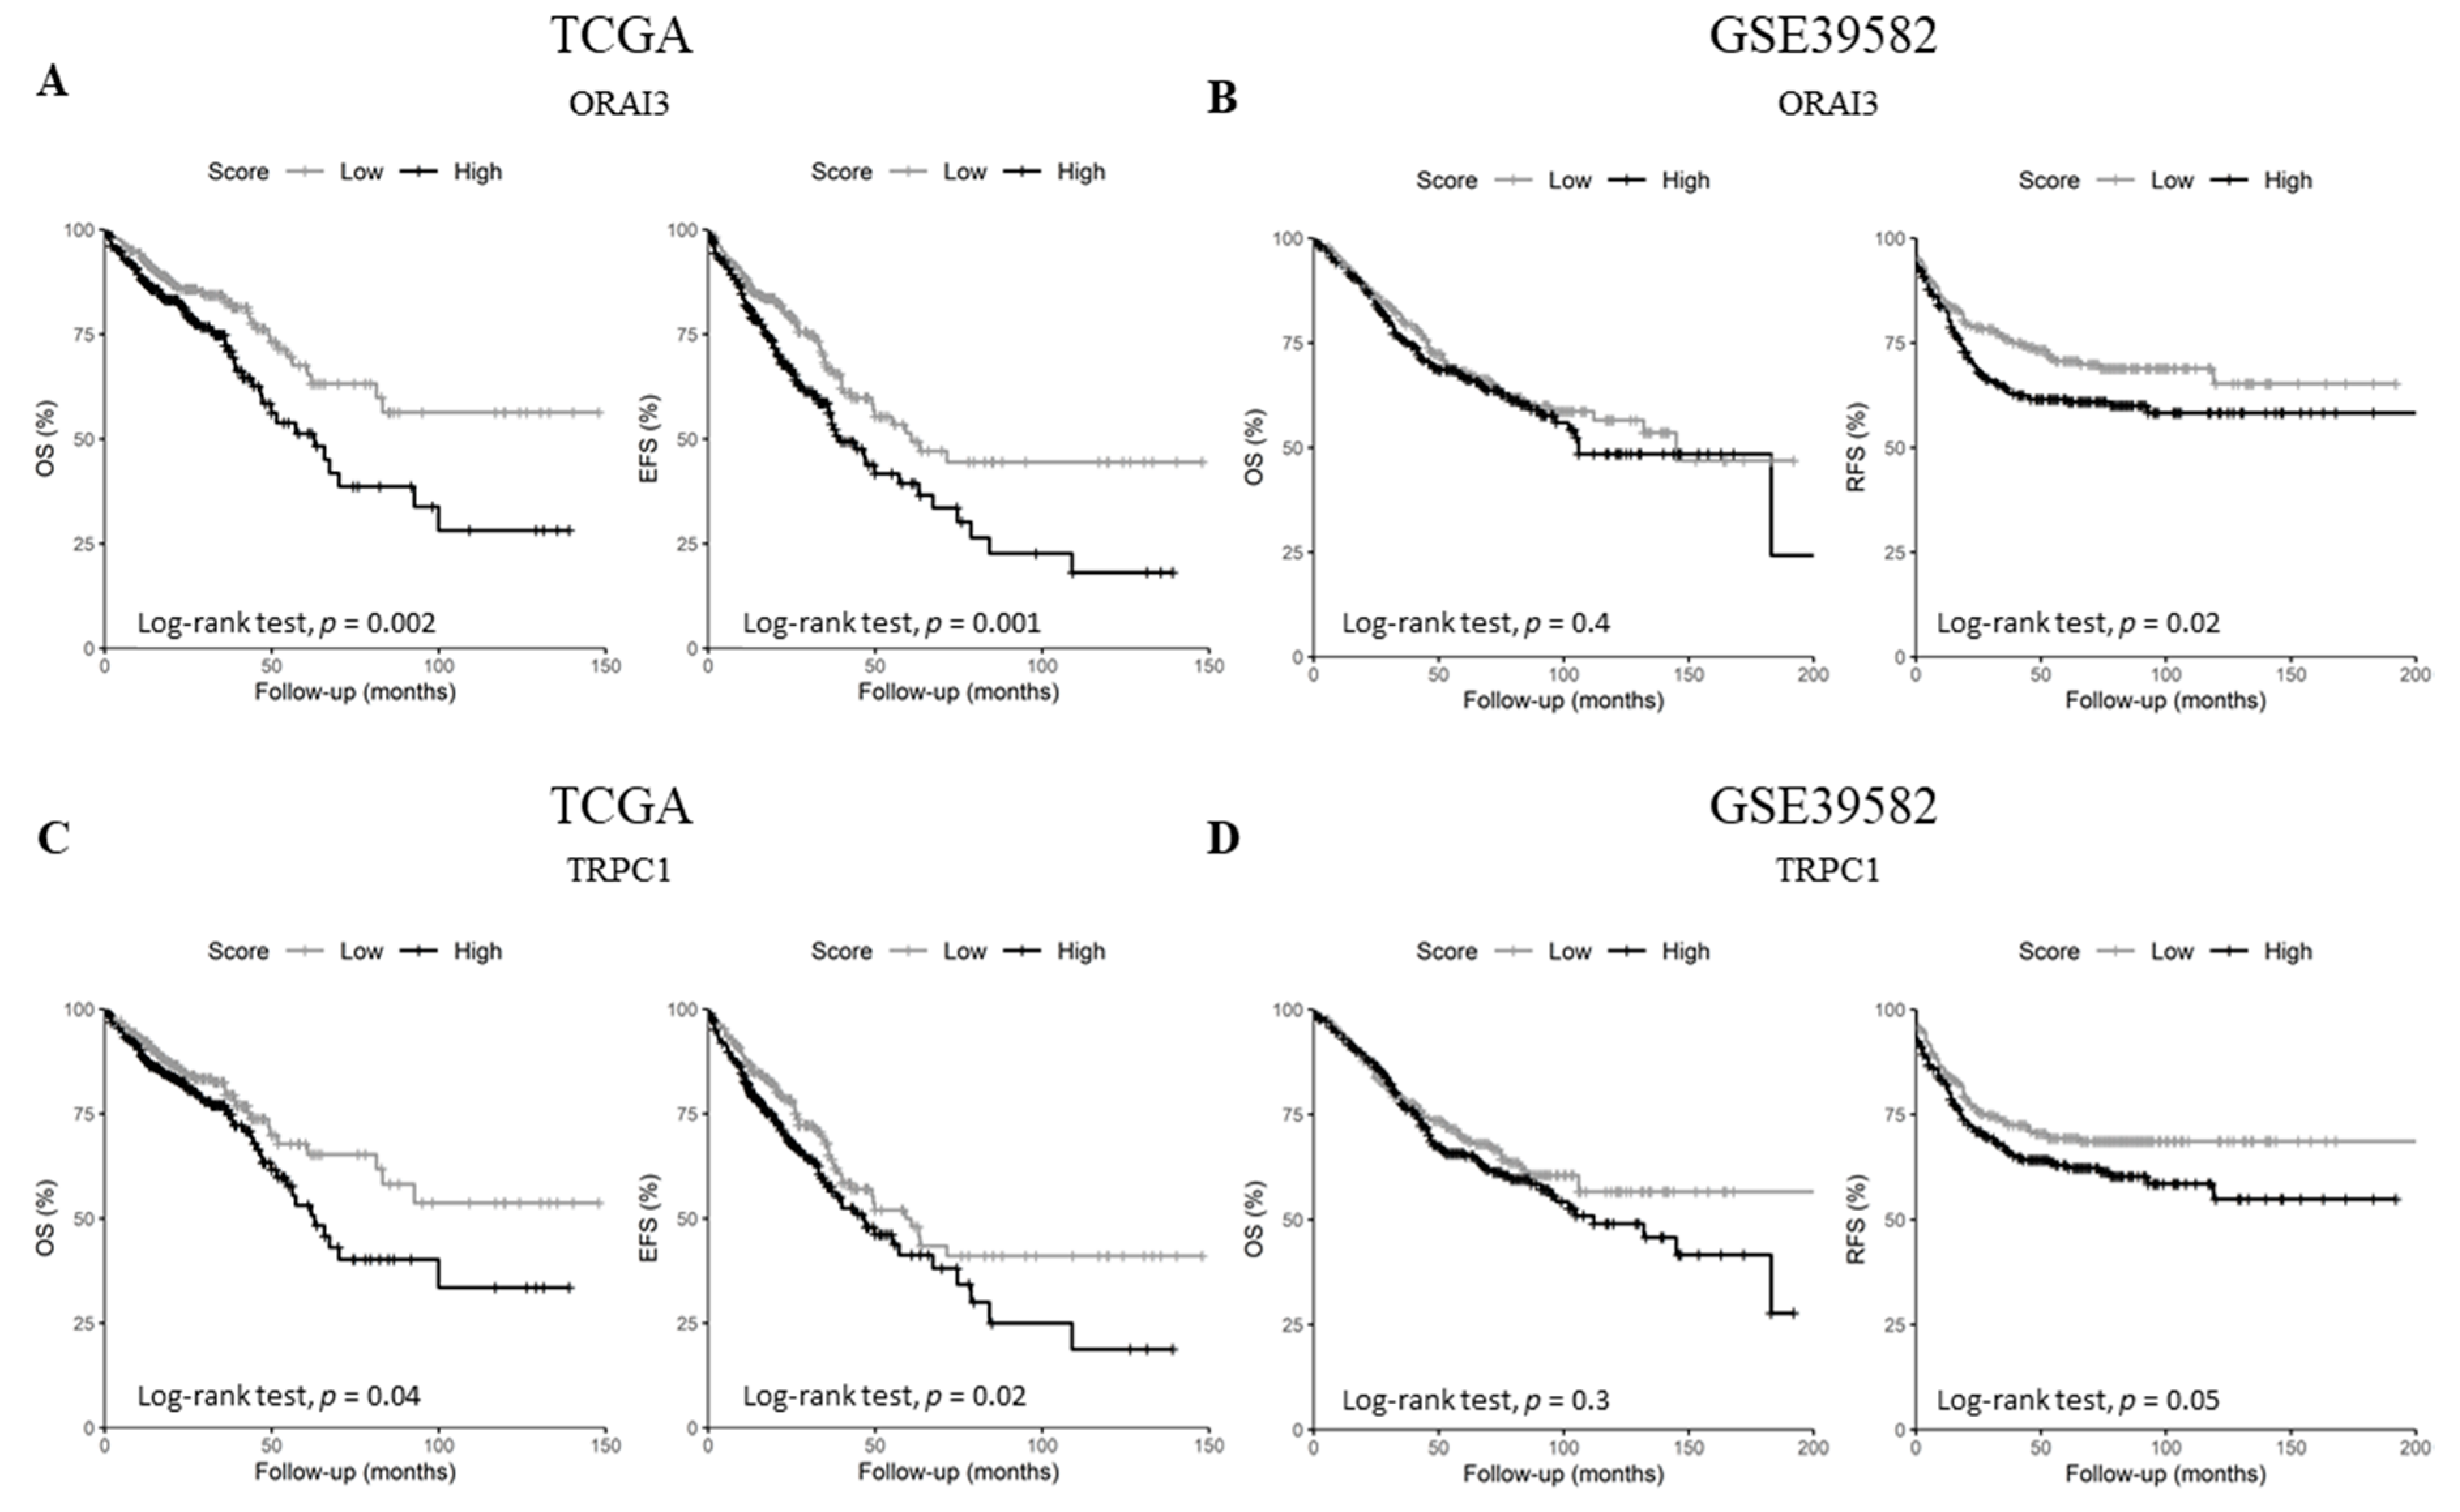
2.4. ORAI3 and TRPC1 Expression Predict Poor Prognosis of CRC Patients

Since the expression of the selected genes did not correlate with tumor stage, we questioned whether they could harbor some prognostic information. Therefore, we checked the genes’ prognostic values on overall survival (OS) in both datasets, in addition to event-free survival (EFS) and relapse-free survival (RFS) for either TCGA or GSE39582 datasets, respectively. Univariate Cox regression analysis showed that ORAI3 and TRPC1 are the only genes that are concomitantly prognostic factors in both datasets (Table 1 and Tables S10 and S11). In fact, ORAI3 correlated with a poor outcome for both OS and EFS in the TCGA dataset (Table 1. OS HR = 1.72 with p = 0.003 and EFS HR = 1.6 with p = 0.001; and Figure 5A. OS Log-Rank p = 0.002 and EFS Log-Rank p = 0.001) whereas it only correlated with RFS in the GSE39582 dataset (Table 1. RFS HR = 1.6 with p = 0.001; and Figure 5B. RFS Log-Rank p = 0.02). Likewise, TRPC1 was correlated with poor outcome for OS and EFS in the TCGA dataset (Table 1. OS HR = 1.44 with p = 0.042 and EFS HR = 1.39 with p = 0.025; and Figure 5C. OS Log-Rank p = 0.04 and EFS Log-Rank p = 0.02), whereas it was only correlated with RFS in the GSE38582 dataset (Table 1. RFS HR = 1.43 with p = 0.05; and Figure 5D. RFS Log-Rank p = 0.05).

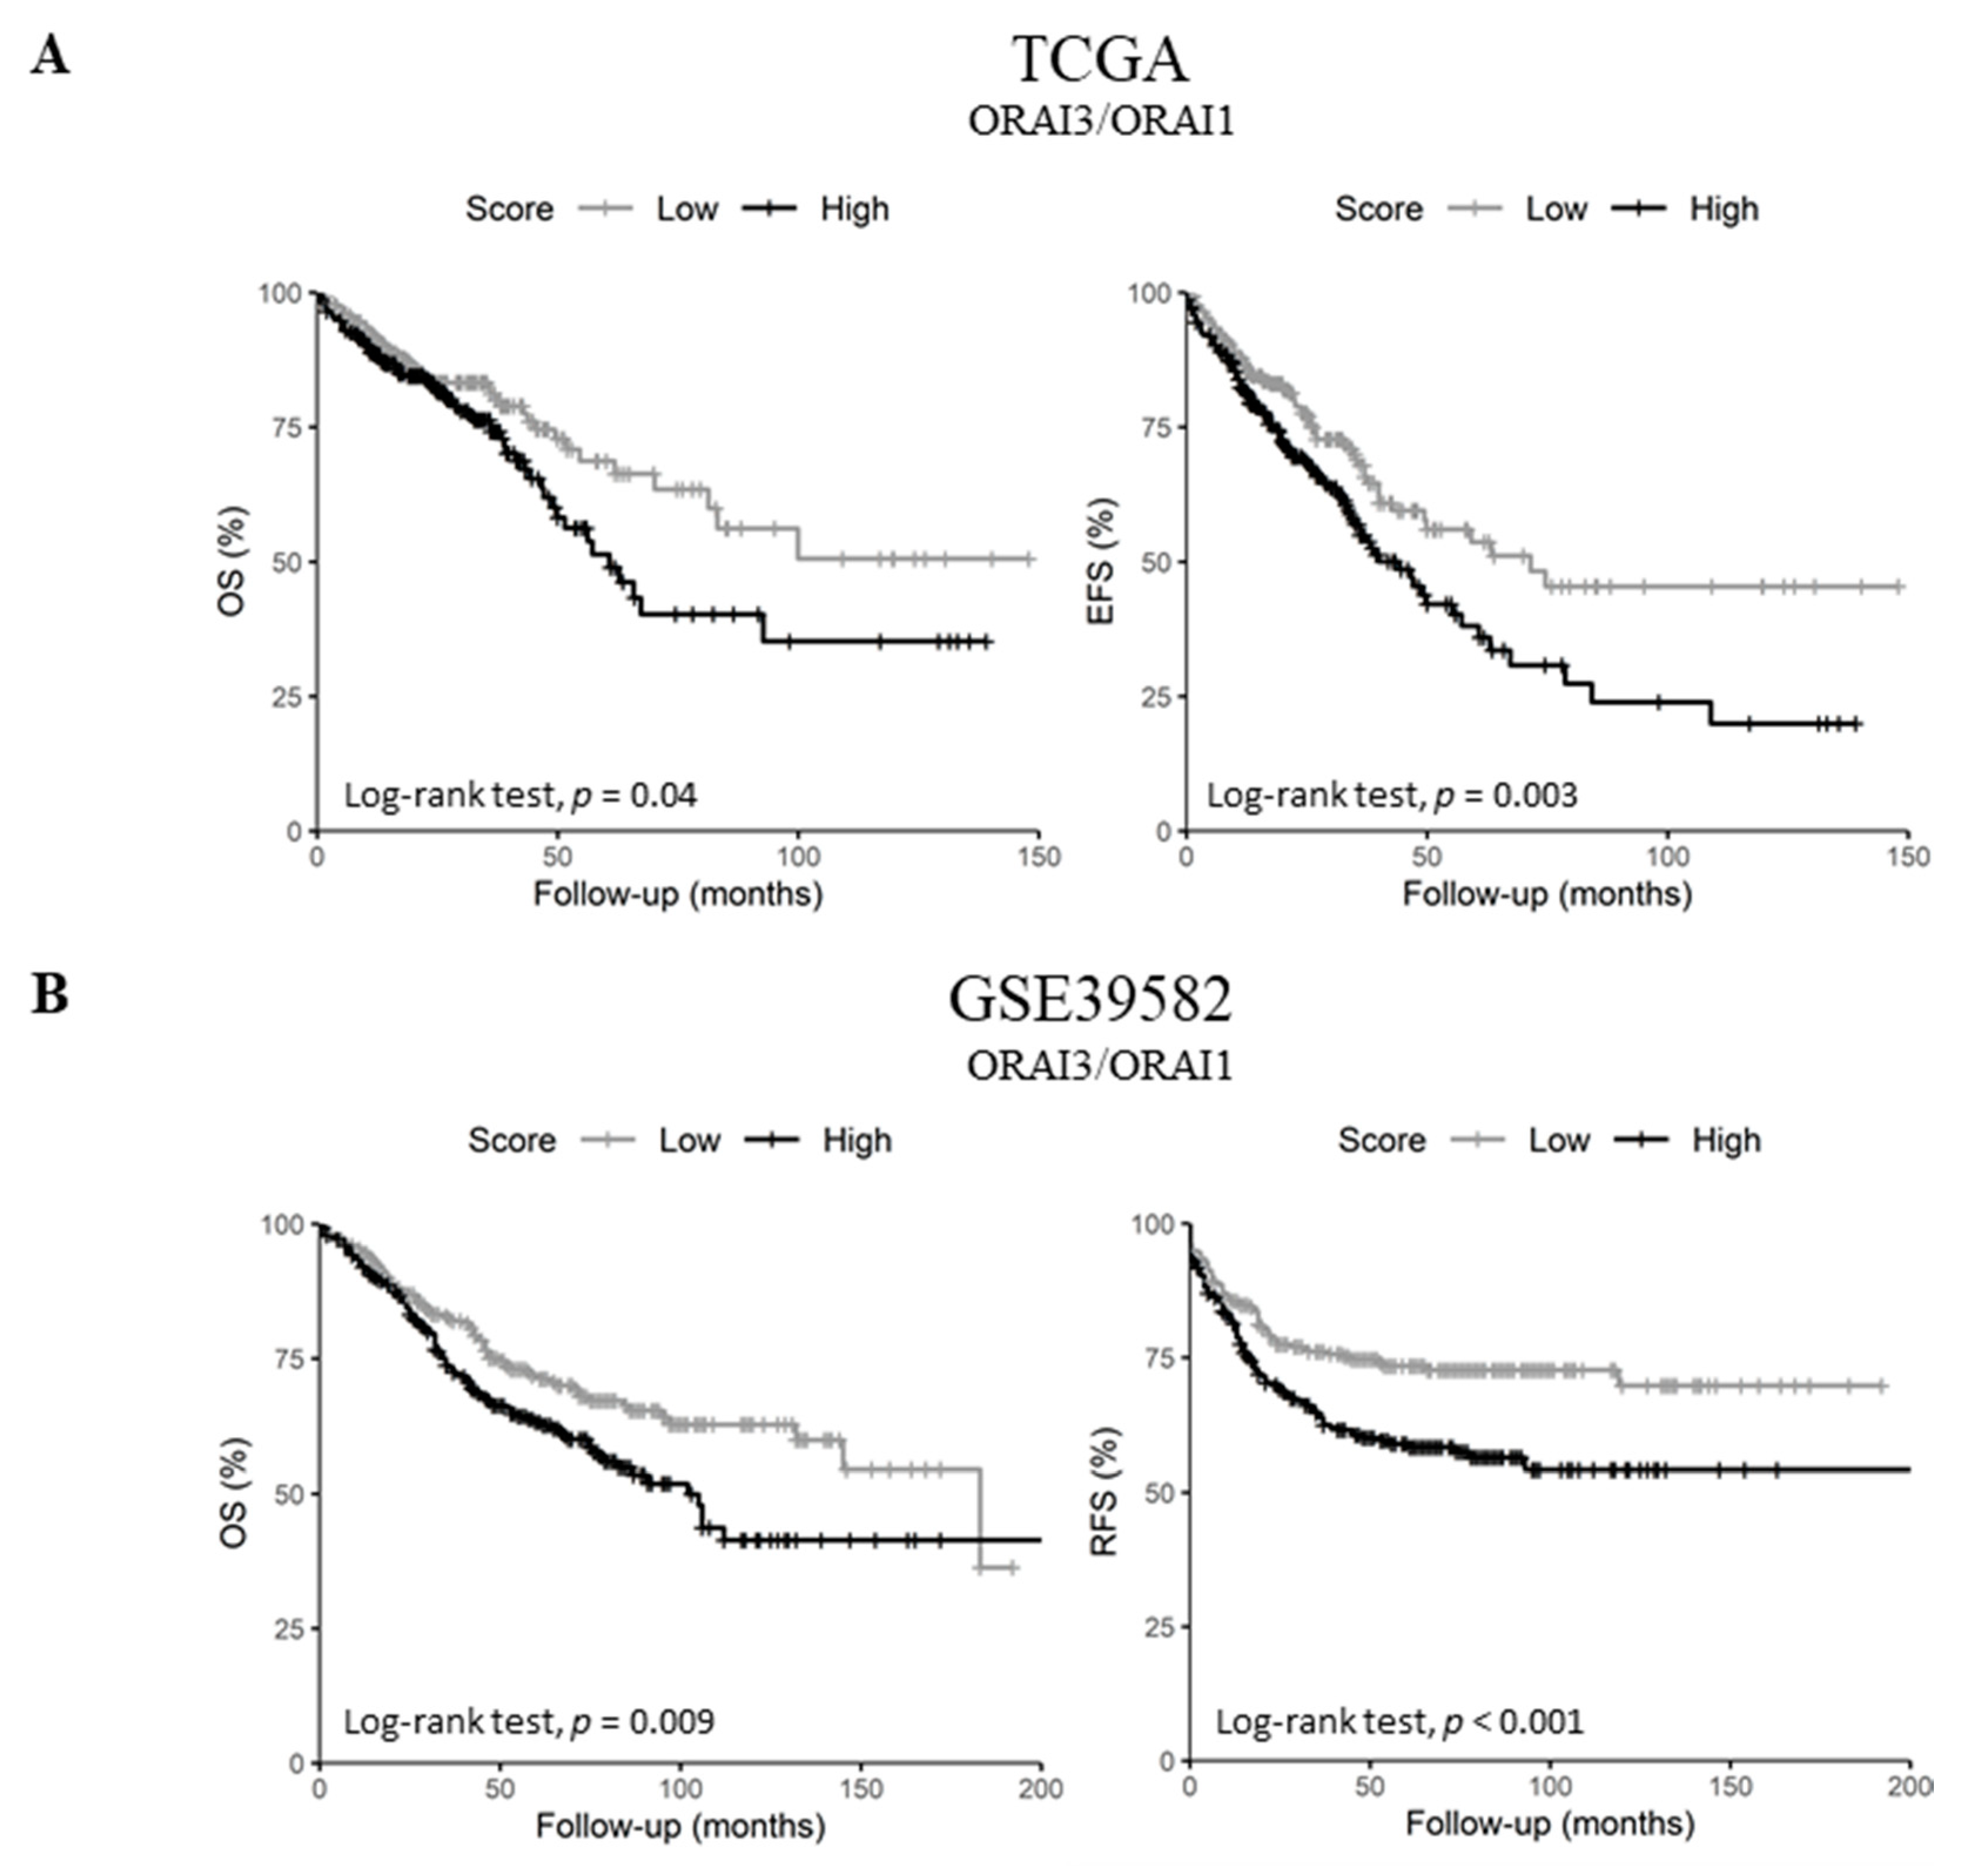
2.5. Upregulated ORAI3/ORAI1 Ratio Predicts Poor Prognosis of CRC Patients

Since ORAI1 expression decreased in lymph node metastatic tumors and high ORAI3 expression was a predictor of poor prognosis in both datasets, we investigated the possibility of a functional shift in the Ca2+ entry from SOCE (ORAI1-dependent) to Store-independent Ca2+ channel entry SICE (ORAI3-dependent) and its association with a poor outcome, as described in prostate and breast cancers [23,24]. Therefore, we investigated whether the ratio of ORAI3/ORAI1 is correlated with the survival of CRC patients. Indeed, Pearson’s correlation showed that ORAI1 and ORAI3 expression levels are poorly correlated in both datasets (Figure 2C and Figure S1D. R = 0.07 with p = 0.095 for the TCGA dataset and R = 0.09 with p = 0.032 for GSE39582 dataset). However, despite the lack of apparent correlation, we found that a high ORAI3/ORAI1 ratio correlated with a poor outcome for OS and EFS in the TCGA dataset (Table 2. OS HR = 1.45 with p = 0.037 and EFS HR = 1.54 with p = 0.003; and Figure 6A. OS Log-Rank p = 0.04 and EFS Log-Rank p = 0.003). In addition, this ratio also correlated with a poor outcome for OS and RFS in the GSE39582 dataset (Table 2. OS HR = 1.47 with p = 0.009 and RFS HR = 1.69 with p = 0.001; and Figure 6B. OS Log-Rank p = 0.009 and RFS Log-Rank p < 0.001).
Next, we investigated the correlation of ORAI3/ORAI1 ratio with CRC progression by studying its variation according to tumor stages. Interestingly, although the genes individually did not correlate with tumor progression (Tables S8 and S9), the ORAI3/ORAI1 Ratio was significantly increased in stages III and IV compared to Stage I in both TCGA and GSE39582 datasets (Figure 6C). Taken together, those results indicate that a Ca2+ influx switch could exist between ORAI3 and ORAI1 expressions in favor of the former during the progression of CRC, explaining its association with a poor outcome.

3. Discussion

Several studies investigated the role of ion channels in cancer, providing evidence of their important roles in cell proliferation, migration, apoptosis and differentiation, and thus the designation “onco-channels” [25,26]. In this study, we investigated the transcriptional expression profile of Ca2+ and KCa channels in CRC by exploring two expression datasets: RNAseq (TCGA) and microarray (GSE39582). Those two datasets were selected because they are both large (n > 500), diverse (contain normal and CRC samples of various stages) and annotated for patients’ survival beside other clinical information. Although many genes gave significant results in one of the two datasets individually, we only focused our analysis on robust results that were constantly significant in both datasets.
The expression of the selected Ca2+ and KCa channels coding genes discriminated between tumor and normal tissues. Four consistent genes were differentially expressed in tumor tissues compared to normal tissues: two Ca2+-activated channels coding genes were induced (KCNN4, TRPM2) while KCNMA1 and TRPM6 were downregulated during the malignant transformation. The decrease in KCNMA1 expression level is in agreement with observations showing that it is downregulated in CRC patients through epigenetic and microRNA regulations [27]. Nonetheless, a murine study with the adenomatous polyposis coli (APC) mutation model had shown increased KCNMB1 and KCNMB2 expression, suggesting a possible increase of KCNMA1 activity in CRC initiation [28].
Likewise, increased expression of KCNN4 was reported in various cancers [29]. Taken together, those results propose a switch in the expression of Ca2+ and voltage activated potassium channels (KCNMA1) to Ca2+ and non-voltage activated potassium channels (KCNN4) in CRC. Indeed, a similar switch was reported in restenosis leading to an increased proliferation and migration of smooth muscle cells [30]. Interestingly, SK4 was found in the inner mitochondrial membrane of human CRC cells where it may control Ca2+ signaling [31]. Besides, SK4 was found to induce epithelial mesenchymal transition in CRC cell lines in vitro and was suggested to promote cancer metastasis [32].
Our results showed that TRPM6 is decreased in CRC cells in contrary to TRPM2 and remarkably, we also found that TRPM2 is negatively correlated with TRMP7. Indeed, TRPM6 and TRPM7 are implicated in Mg2+ uptake in normal epithelial colon cells [33]. Besides, colon cancer cells that are resistant to doxorubicin expressed lower amounts of TRPM6 and TRPM7 [34]. Those results suggest that the Mg2+ homeostasis could be lost during the malignant transformation of CRC. On the other hand, TRPM2 is known to promote cell survival and protect against oxidative stress in various cell types [35]. It is also highly expressed in many solid cancers such as pancreatic, melanoma, neuroblastoma, breast and prostate cancer [35]. Interestingly, TRPM2 was found to be activated by cytosolic adenosine diphosphate ribose (ADP-ribose) and cytosolic Ca2+ [36,37] contrarily to TRPM6 that is only activated by cytosolic Mg2+ depletion. Moreover, the activation of TRPM2 induces the expression of transcription factors such as hypoxia-inducible factor 1 alpha (HIF1α) and nuclear factor (erythroid-derived 2)-related factor-2 (Nrf2) [35]. These factors are implicated in cell proliferation, survival and chemoresistance of CRC cells [38,39]. Our results, together with those findings, suggest that Ca2+-activated (SK4) and Ca2+-permeable channels (TRPM2) could be induced in CRC malignant transformations.
Colorectal carcinoma localization is associated with differences in key molecular features and clinical implications. Generally, patients with proximal colon cancers have a worse prognosis [40], whereas only patients with metastases from a distal carcinoma respond to anti- epithelial growth factor receptor (anti-EGFR) therapy [41]. Our results showed that STIM2 and KCNN2 are upregulated while ORAI2 and TRPM6 are downregulated in proximal tumors. The variation of Ca2+ and KCa channels gene expression according to tumor primary site suggests their implication in CRC biology and heterogeneity.
The Villalobos group found that normal mucosa cells showed an ICRAC current mediated by ORAI1. Conversely, colon carcinoma cells showed mixed currents composed of enhanced ICRAC besides a nonselective Ca2+ current mediated by TRPC1 [17]. Moreover, the expression of TRPC1, ORAI1, ORAI2, ORAI3 and STIM1 was increased in tumor cells in contrary to STIM2 protein which was found to be depleted [17]. Our study showed that TRPC1 is negatively correlated with ORAI1 and positively correlated with ORAI2 and ORAI3, and that TRPC1 expression predicted a poor prognosis in CRC. This result suggests a SOCE remodeling during CRC progression and could be the subject of further analysis.
Our results show that ORAI1 decreased with lymph node metastases, one of the first signs of metastatic spread. Also, ORAI3 predicted a poor prognosis for RFS in GSE39582 but not for OS, and ORAI1 predicted poor prognosis in TCGA but not in GSE39582 (Table S10). However, by inspecting the ratio of ORAI3/ORAI1, we found that a high ORAI3/ORAI1 ratio predicted a poor prognosis for EFS and OS in TCGA, as well as for RFS and EFS in GSE39582, with a higher HR than that of ORAI1 or ORAI3 separately. Thus, the ORAI3/ORAI1 ratio is a better predictor of survival than ORAI3 alone. This finding is consistent with two other studies that described a change in Ca2+ influx from ORAI1 to ORAI3 in cancer. In prostate cancer, it was suggested that ORAI1 is implicated in a dynamic machinery of Ca2+ remodeling between ORAI1 and ORAI3 [23]. It was postulated that ORAI3 increases limits SOCE and enhances ORAI1-ORAI3 ARC Ca2+ entry [23]. Moreover, high ORAI3/ORAI1 ratio was shown to correlate with poor prognosis in breast cancer [24]. However, this ratio should not undermine the pro-tumor role of ORAI1. Indeed, we have previously shown that ORAI1 contributes to CRC cell migration [20], and significantly, it was found that ORAI1 expression is increased in CRC tissues compared to adjacent non-cancerous tissues and is correlated with distant metastases [42].
To our knowledge, our study is the first to widely analyze Ca2+ and Ca2+-activated K+ channels remodeling in CRC using high throughput data analysis. Our results provide new insights about the voltage gating of KCa channels and Ca2+ remodeling in CRC initiation and progression.

4. Materials and Methods

4.1. Public Datasets

Two CRC datasets, available from public databases, were used in this paper: an RNAseq dataset (TCGA, n = 656 including 47 normal samples) and an expression microarray dataset (GSE39582, n = 585 including 19 normal samples) [43]. The two datasets were selected because of their large size, diversity and the availability of clinical annotations. For the RNAseq dataset, Fragment Per Kilobase Million (FPKM) values were downloaded from The Cancer Genome Atlas (TCGA) database (https://portal.gdc.cancer.gov/repository) [44] and were log2 transformed after the addition of one (log2(x + 1)) prior to analysis. Clinical annotations were acquired from cbioportal for Cancer Genomics website (http://cbioportal.org) using the the Cancer Genomics Data Server package (cgdsr) in R environment [45,46]. GSE39582 microarray dataset (RMA-normalized, Affimetrix Human Genome U133 Plus 2.0 Array) was downloaded from the Gene Expression Omnibus (GEO) database (https://www.ncbi.nlm.nih.gov/geo/). For each gene, the probeset with the average expression was used. Thirty-five genes related to Ca2+ and KCa channels were selected for analysis when available (TRPV1 was missing from the microarray dataset). Gene names and functions are summarized in Supplementary Table S1.

4.2. Statistical Analysis

Heatmaps Boxplots and correlation plots were generated in R using ComplexHeatmap [47], ggpubr (https://CRAN.R-project.org/package=ggpubr) and corrplot (https://github.com/taiyun/corrplot) packages, respectively. Hierarchical clustering was done using Euclidean distance and average linkage method for both genes and samples. Pearson’s test was used for gene correlation analysis. Wilcoxon’s signed-rank test was used to compare matched normal and tumor tissues in the TCGA dataset. A student’s t-test was used for the other pairwise comparisons in the paper. The Benjamini and Hochberg method was used to adjust for multiple comparisons [48], and adjusted p-values below 0.05 were considered significant.

4.3. Survival Analysis

Overall survival (OS) was defined by the time from CRC diagnosis (in months) until death (patients alive at last follow-up were censored). Event-free survival (EFS) was defined as the time from diagnosis until the occurrence of an event (progression, recurrence or death), and patients with no reported events were censored at last follow-up. For patients achieving complete remission, relapse-free survival (RFS) was defined as the time from surgery to the first recurrence (Patients with no recurrence were censored upon death or last follow-up).
For each gene, High and Low expression scores were assigned to patients using median expression as cut-off threshold. For the ORAI3/ORAI1 ratio, High and Low scores were assigned using the median ratio as cut-off threshold. Cox proportional hazard regression was used to perform dichotomic univariate analyses. Wald’s test was used to estimate prognostic significance of model’s parameters. Schoenfeld residuals were used to check for violation of proportional hazards assumption [49]. Kaplan-Meier survival curves were used to plot High and Low score groups for prognostic genes. Groups were compared using the Log-Rank test. Survival analyses were done in R environment using survival and survminer packages (https://CRAN.R-project.org/package=survival, https://CRAN.R-project.org/package=survminer).

5. Conclusions

In summary, we found that KCa and Ca2+ channels could be important contributors to CRC initiation. Our results suggested a switch from voltage gating in KCa channels (KCNMA1) to two different types of channels activated by cytosolic Ca2+ and voltage-insensitive (KCNN4, TRPM2) during the malignant transformation. We also showed that KCa and Ca2+ channels are differentially expressed according to tumor site. Most of the literature focused on the role of ORAI1 in CRC. However, our results highlighted that ORAI3/ORAI1 ratio predicts poor prognosis in CRC patients and could be considered as biomarker for Ca2+ remodeling during the CRC progression. Hence, future studies about ORAI3 are needed to understand the switch from SOCE influx to SICE influx in CRC progression and aggressiveness.

Supplementary Materials

The following are available online at https://www.mdpi.com/2072-6694/11/4/561/s1, Figure S1: Pearson’s correlation of gene expression in TCGA and GSE39582 datasets. (A) Pearson’s correlation heatmaps of Ca2+ and KCa channels family coding genes; (B) Scatter plots of KCNMA1 and KCNMB subunits correlation; (C) Scatter plots of STIM1 and STIM2 correlation; (D) Scatter plots of ORAI1 and ORAI3 correlation, Table S1: Symbols, names and functions of the selected genes, Table S2: Comparison of gene expression levels in normal mucosa versus tumor samples in TCGA dataset, Table S3: Comparison of gene expression levels in normal mucosa versus tumor samples in GSE39582, Table S4: Comparison of gene expression levels between proximal and distal/rectal tumors in TCGA dataset, Table S5: Comparison of gene expression levels between proximal and distal tumors in GSE39582 dataset, Table S6: Comparison of gene expression levels between N0 and N+ (lymph node metastatic) tumors in TCGA dataset, Table S7: Comparison of gene expression levels between N0 and N+ (lymph node metastatic) tumors in GSE39582 dataset, Table S8: Comparison of gene expression levels between stage IV and stages I + II + III in TCGA dataset, Table S9: Comparison of gene expression levels between stage IV and stages I + II + III in GSE39582 dataset, Table S10: Univariate analysis of OS and EFS in TCGA dataset, Table S11: Univariate analysis of OS and RFS in GSE39582 dataset.

Author Contributions

Conceptualization, S.I., H.D., T.L., M.G. and W.R.; Methodology, S.I., H.D., C.V., T.L., F.M. and M.G.; Validation, S.I., H.D., M.G. and W.R.; Formal analysis, S.I., H.D., C.V., R.C., G.P., F.M., T.L., M.G. and W.R.; Data curation, S.I., H.D., T.L., M.G. and W.R.; Writing original draft preparation, S.I., H.D., C.V., M.G. and W.R.; Writing—review and editing, S.I., H.D., C.V., R.C., G.P., F.M., T.L., M.G. and W.R.; Supervision, F.M., T.L. and W.R.; Project administration, S.I., M.G. and W.R.; Funding Acquisition, G.P., T.L. and W.R.

Funding

This work was partly supported by grants on behalf of the following french department committees of Ligue Contre le cancer Grand-Ouest: 16 (Charente), 37 (Indre-et-Loire), 41 (Loir-et-Cher), 53 (Mayenne), 56 (Morbihan), 72 (Sarthe) and 86 (Vienne). M.G. is a recipient of 3-years postdoctoral grant from Région Centre—Val de Loire.

Acknowledgments

We thank Cancéropôle Grand Ouest (CGO) and Association pour la Recherche et la Formation dans les Maladies de l’Appareil Digestif (ARFMAD) for their support.

Conflicts of Interest

The authors declare no conflict of interest.

References

  1. Siegel, R.L.; Miller, K.D.; Fedewa, S.A.; Ahnen, D.J.; Meester, R.G.S.; Barzi, A.; Jemal, A. Colorectal cancer statistics, 2017. Cancer J. Clin. 2017, 67, 177–193. [Google Scholar] [CrossRef]
  2. Morris, E.J.A.; Forman, D.; Thomas, J.D.; Quirke, P.; Taylor, E.F.; Fairley, L.; Cottier, B.; Poston, G. Surgical management and outcomes of colorectal cancer liver metastases. Br. J. Surg. 2010, 97, 1110–1118. [Google Scholar] [CrossRef]
  3. Schwab, A.; Stock, C. Ion channels and transporters in tumour cell migration and invasion. Philos. Trans. R. Soc. 2014, 369, 1–8. [Google Scholar] [CrossRef]
  4. Déliot, N.; Constantin, B. Plasma membrane calcium channels in cancer: Alterations and consequences for cell proliferation and migration. Biochim. Biophys. Acta Biomembr. 2015, 1848, 2512–2522. [Google Scholar] [CrossRef]
  5. Prevarskaya, N.; Skryma, R.; Shuba, Y. Calcium in tumour metastasis: New roles for known actors. Nat. Rev. Cancer 2011, 11, 609–618. [Google Scholar] [CrossRef] [PubMed]
  6. Xie, J.; Pan, H.; Yao, J.; Zhou, Y.; Han, W. SOCE and cancer: Recent progress and new perspectives. Int. J. Cancer 2016, 138, 2067–2077. [Google Scholar] [CrossRef] [PubMed]
  7. Putney, J.W. A model for receptor-regulated calcium entry. Cell Calcium 1986, 7, 1–12. [Google Scholar] [CrossRef]
  8. Berridge, M.J.; Lipp, P.; Bootman, M.D. The versatility and universality of calcium signalling. Nat. Rev. Mol. Cell Biol. 2000, 1, 11–21. [Google Scholar] [CrossRef]
  9. Prakriya, M.; Lewis, R.S. Store-Operated Calcium Channels. Physiol. Rev. 2015, 95, 1383–1436. [Google Scholar] [CrossRef]
  10. Mignen, O.; Constantin, B.; Potier-Cartereau, M.; Penna, A.; Gautier, M.; Guéguinou, M.; Renaudineau, Y.; Shoji, K.F.; Félix, R.; Bayet, E.; et al. Constitutive calcium entry and cancer: Updated views and insights. Eur. Biophys. J. 2017, 46, 395–413. [Google Scholar] [CrossRef]
  11. Shuttleworth, T.J.; Thompson, J.L. Discriminating between capacitative and arachidonate-activated Ca(2+) entry pathways in HEK293 cells. J. Biol. Chem. 1999, 274, 31174–31178. [Google Scholar] [CrossRef]
  12. Mignen, O.; Thompson, J.L.; Yule, D.I.; Shuttleworth, T.J. Agonist activation of arachidonate-regulated Ca2+-selective (ARC) channels in murine parotid and pancreatic acinar cells. J. Physiol. 2005, 564, 791–801. [Google Scholar] [CrossRef] [PubMed]
  13. Mignen, O.; Thompson, J.L.; Shuttleworth, T.J. Both Orai1 and Orai3 are essential components of the arachidonate-regulated Ca2+-selective (ARC) channels. J. Physiol. 2008, 586, 185–195. [Google Scholar] [CrossRef]
  14. Mignen, O.; Thompson, J.L.; Shuttleworth, T.J. STIM1 regulates Ca2+ entry via arachidonate-regulated Ca2+-selective (ARC) channels without store depletion or translocation to the plasma membrane. J. Physiol. 2007, 579, 703–715. [Google Scholar] [CrossRef]
  15. Vergara, C.; Latorre, R.; Marrion, N.V.; Adelman, J.P. Calcium-activated potassium channels. Curr. Opin. Neurobiol. 1998, 8, 321–329. [Google Scholar] [CrossRef]
  16. Guéguinou, M.; Gambade, A.; Félix, R.; Chantôme, A.; Fourbon, Y.; Bougnoux, P.; Weber, G.; Potier-Cartereau, M.; Vandier, C. Lipid rafts, KCa/ClCa/Ca2+ channel complexes and EGFR signaling: Novel targets to reduce tumor development by lipids? Biochim. Biophys. Acta Biomembr. 2015, 1848, 2603–2620. [Google Scholar] [CrossRef] [PubMed]
  17. Sobradillo, D.; Hernández-Morales, M.; Ubierna, D.; Moyer, M.P.; Núñez, L.; Villalobos, C. A reciprocal shift in transient receptor potential channel 1 (TRPC1) and stromal interaction molecule 2 (STIM2) contributes to Ca2+ remodeling and cancer hallmarks in colorectal carcinoma cells. J. Biol. Chem. 2014, 289, 28765–28782. [Google Scholar] [CrossRef] [PubMed]
  18. Villalobos, C.; Sobradillo, D.; Hernández-Morales, M.; Núñez, L. Calcium remodeling in colorectal cancer. Biochim. Biophys. Acta Mol. Cell Res. 2017, 1864, 843–849. [Google Scholar] [CrossRef] [PubMed]
  19. Harnois, T.; Crottes, D.; Uguen, A.; Deliot, N.; Gambade, A.; Chantôme, A.; Haelters, J.P.; Jaffrès, P.A.; Jourdan, M.L.; Weber, G.; et al. SK3/TRPC1/Orai1 complex regulates SOCE-dependent colon cancer cell migration: A novel opportunity to modulate anti-EGFR mAb action by the alkyl-lipid Ohmline. Oncotarget 2016, 7, 36168–36184. [Google Scholar]
  20. Gueguinou, M.; Crottès, D.; Chantôme, A.; Rapetti-Mauss, R.; Potier-Cartereau, M.; Clarysse, L.; Girault, A.; Fourbon, Y.; Jézéquel, P.; Guérin-Charbonnel, C.; et al. The SigmaR1 chaperone drives breast and colorectal cancer cell migration by tuning SK3-dependent Ca2+ homeostasis. Oncogene 2017, 36, 3640–3647. [Google Scholar] [CrossRef]
  21. Hernández-Morales, M.; Sobradillo, D.; Valero, R.A.; Muñoz, E.; Ubierna, D.; Moyer, M.P.; Núñez, L.; Villalobos, C.; Hernández-Morales, M.; Sobradillo, D.; et al. Mitochondria sustain store-operated currents in colon cancer cells but not in normal colonic cells: Reversal by non-steroidal anti-inflammatory drugs. Oncotarget 2017, 8, 55332–55352. [Google Scholar] [CrossRef]
  22. Zuccolo, E.; Laforenza, U.; Ferulli, F.; Pellavio, G.; Scarpellino, G.; Tanzi, M.; Turin, I.; Faris, P.; Lucariello, A.; Maestri, M.; et al. Stim and Orai mediate constitutive Ca2+ entry and control endoplasmic reticulum Ca2+ refilling in primary cultures of colorectal carcinoma cells. Oncotarget 2018, 9, 31098–31119. [Google Scholar] [CrossRef]
  23. Dubois, C.; Abeele, F.V.; Lehen’kyi, V.; Gkika, D.; Guarmit, B.; Lepage, G.; Slomianny, C.; Borowiec, A.S.; Bidaux, G.; Benahmed, M.; et al. Remodeling of Channel-Forming ORAI Proteins Determines an Oncogenic Switch in Prostate Cancer. Cancer Cell 2014, 26, 19–32. [Google Scholar] [CrossRef]
  24. Azimi, I.; Milevskiy, M.; Chalmers, S.; Yapa, K.; Robitaille, M.; Henry, C.; Baillie, G.; Thompson, E.; Roberts-Thomson, S.; Monteith, G.; et al. ORAI1 and ORAI3 in Breast Cancer Molecular Subtypes and the Identification of ORAI3 as a Hypoxia Sensitive Gene and a Regulator of Hypoxia Responses. Cancers 2019, 11, 208. [Google Scholar] [CrossRef]
  25. Litan, A.; Langhans, S.A. Cancer as a channelopathy: Ion channels and pumps in tumor development and progression. Front. Cell. Neurosci. 2015, 9, 86. [Google Scholar] [CrossRef] [PubMed]
  26. Prevarskaya, N.; Skryma, R.; Shuba, Y. Ion Channels in Cancer: Are Cancer Hallmarks Oncochannelopathies? Physiol. Rev. 2018, 98, 559–621. [Google Scholar] [CrossRef] [PubMed]
  27. Basile, M.S.; Fagone, P.; Mangano, K.; Mammana, S.; Magro, G.; Salvatorelli, L.; Destri, G.L.; la Greca, G.; Nicoletti, F.; Puleo, S.; et al. KCNMA1 Expression is Downregulated in Colorectal Cancer via Epigenetic Mechanisms. Cancers 2019, 11, 245. [Google Scholar] [CrossRef] [PubMed]
  28. Ousingsawat, J.; Spitzner, M.; Schreiber, R.; Kunzelmann, K. Upregulation of colonic ion channels in APC Min/+ mice. Pflügers Arch. Eur. J. Physiol. 2008, 456, 847–855. [Google Scholar] [CrossRef] [PubMed]
  29. Mohr, C.J.; Steudel, F.A.; Gross, D.; Ruth, P.; Lo, W.-Y.; Hoppe, R.; Schroth, W.; Brauch, H.; Huber, S.M.; Lukowski, R.; et al. Cancer-Associated Intermediate Conductance Ca2+-Activated K+ Channel KCa3.1. Cancers 2019, 11, 109. [Google Scholar] [CrossRef]
  30. Köhler, R.; Wulff, H.; Eichler, I.; Kneifel, M.; Neumann, D.; Knorr, A.; Grgic, I.; Kämpfe, D.; Si, H.; Wibawa, J.; et al. Blockade of the Intermediate-Conductance Calcium-Activated Potassium Channel as a New Therapeutic Strategy for Restenosis. Circulation 2003, 108, 1119–1125. [Google Scholar] [CrossRef]
  31. De Marchi, U.; Sassi, N.; Fioretti, B.; Catacuzzeno, L.; Cereghetti, G.M.; Szabò, I.; Zoratti, M. Intermediate conductance Ca2+-activated potassium channel (KCa3.1) in the inner mitochondrial membrane of human colon cancer cells. Cell Calcium 2009, 45, 509–516. [Google Scholar] [CrossRef] [PubMed]
  32. Lai, W.; Liu, L.; Zeng, Y.; Wu, H.; Xu, H.; Chen, S.; Chu, Z. KCNN4 Channels participate in the EMT induced by PRL-3 in colorectal cancer. Med. Oncol. 2013, 30, 566. [Google Scholar] [CrossRef]
  33. Luongo, F.; Pietropaolo, G.; Gautier, M.; Dhennin-Duthille, I.; Ouadid-Ahidouch, H.; Wolf, F.I.; Trapani, V. TRPM6 is Essential for Magnesium Uptake and Epithelial Cell Function in the Colon. Nutrients 2018, 10, 784. [Google Scholar] [CrossRef]
  34. Castiglioni, S.; Cazzaniga, A.; Trapani, V.; Cappadone, C.; Farruggia, G.; Merolle, L.; Wolf, F.I.; Iotti, S.; Maier, J.A.M. Magnesium homeostasis in colon carcinoma LoVo cells sensitive or resistant to doxorubicin. Sci. Rep. 2015, 5, 16538. [Google Scholar] [CrossRef]
  35. Miller, B.A. TRPM2 in Cancer. Cell Calcium 2019. [Google Scholar] [CrossRef] [PubMed]
  36. Csanády, L.; Törőcsik, B. Four Ca2+ Ions Activate TRPM2 Channels by Binding in Deep Crevices near the Pore but Intracellularly of the Gate. J. Gen. Physiol. 2009, 133, 189. [Google Scholar] [CrossRef]
  37. Du, J.; Xie, J.; Yue, L. Intracellular calcium activates TRPM2 and its alternative spliced isoforms. Proc. Natl. Acad. Sci. USA 2009, 106, 7239–7244. [Google Scholar] [CrossRef] [PubMed]
  38. Sadeghi, M.R.; Jeddi, F.; Soozangar, N.; Somi, M.H.; Samadi, N. The role of Nrf2-Keap1 axis in colorectal cancer, progression and chemoresistance. Tumor Biol. 2017, 39, 101042831770551. [Google Scholar] [CrossRef]
  39. Imamura, T.; Kikuchi, H.; Herraiz, M.-T.; Park, D.-Y.; Mizukami, Y.; Mino-Kenduson, M.; Lynch, M.P.; Rueda, B.R.; Benita, Y.; Xavier, R.J.; et al. HIF-1alpha and HIF-2alpha have divergent roles in colon cancer. Int. J. Cancer 2009, 124, 763–771. [Google Scholar] [CrossRef]
  40. Benedix, F.; Kube, R.; Meyer, F.; Schmidt, U.; Gastinger, I.; Lippert, H. Colon/Rectum Carcinomas (Primary Tumor) Study Group, Comparison of 17,641 patients with right- and left-sided colon cancer: Differences in epidemiology, perioperative course, histology and survival. Dis. Colon Rectum 2010, 53, 57–64. [Google Scholar] [CrossRef]
  41. Missiaglia, E.; Jacobs, B.; D’Ario, G.; di Narzo, A.F.; Soneson, C.; Budinska, E.; Popovici, V.; Vecchione, L.; Gerster, S.; Yan, P.; et al. Distal and proximal colon cancers differ in terms of molecular, pathological and clinical features. Ann. Oncol. 2014, 25, 1995–2001. [Google Scholar] [CrossRef] [PubMed]
  42. Deng, W.; Wang, J.; Zhang, J.; Cai, J.; Bai, Z.; Zhang, Z. Orai1, a Direct Target of microRNA-519, Promotes Progression of Colorectal Cancer via Akt/GSK3β Signaling Pathway. Dig. Dis. Sci. 2016, 61, 1553–1560. [Google Scholar] [CrossRef] [PubMed]
  43. Marisa, L.; de Reyniès, A.; Duval, A.; Selves, J.; Gaub, M.P.; Vescovo, L.; Etienne-Grimaldi, M.-C.; Schiappa, R.; Guenot, D.; Ayadi, M.; et al. Gene expression classification of colon cancer into molecular subtypes: Characterization, validation and prognostic value. PLoS Med. 2013, 10, e1001453. [Google Scholar] [CrossRef]
  44. Grossman, R.L.; Heath, A.P.; Ferretti, V.; Varmus, H.E.; Lowy, D.R.; Kibbe, W.A.; Staudt, L.M. Toward a Shared Vision for Cancer Genomic Data. N. Engl. J. Med. 2016, 375, 1109–1112. [Google Scholar] [CrossRef]
  45. Cerami, E.; Gao, J.; Dogrusoz, U.; Gross, B.E.; Sumer, S.O.; Aksoy, B.A.; Jacobsen, A.; Byrne, C.J.; Heuer, M.L.; Larsson, E.; et al. The cBio cancer genomics portal: An open platform for exploring multidimensional cancer genomics data. Cancer Discov. 2012, 2, 401–404. [Google Scholar] [CrossRef] [PubMed]
  46. Gao, J.; Aksoy, B.A.; Dogrusoz, U.; Dresdner, G.; Gross, B.; Sumer, S.O.; Sun, Y.; Jacobsen, A.; Sinha, R.; Larsson, E.; et al. Integrative analysis of complex cancer genomics and clinical profiles using the cBioPortal. Sci. Signal. 2013, 6, pl1. [Google Scholar] [CrossRef] [PubMed]
  47. Gu, Z.; Eils, R.; Schlesner, M. Complex heatmaps reveal patterns and correlations in multidimensional genomic data. Bioinformatics 2016, 32, 2847–2849. [Google Scholar] [CrossRef]
  48. Benjamini, Y.; Hochberg, Y. Controlling the False Discovery Rate: A Practical and Powerful Approach to MultipleTesting. J. R. Stat. Soc. Ser. B 1995, 57, 289–300. [Google Scholar] [CrossRef]
  49. Schoenfeld, D. Biometrika Trust Partial Residuals for The Proportional Hazards Regression Model Author(s): David Schoenfeld Published by: Oxford University Press on Behalf of Biometrika Trust Stable. Biometrika 1982, 69, 239–241. Available online: http://www.jstor.org/stable/2335876 (accessed on 8 April 2016). [CrossRef]
Figure 1. Comparison of the gene expression between CRC tumors vs. adjacent normal mucosa in TCGA (A,B) and GSE39582 (C,D) patients. (A) Heatmap presenting the expression profile of 35 Ca2+ and KCa channels coding-genes between CRC and matched normal tissues from the TCGA dataset; (B) Boxplots of differentially expressed genes between normal and CRC tissues in the TCGA dataset; (C) Heatmap presenting the expression profile of 34 Ca and KCa channels coding-genes between CRC and unmatched normal tissues from GSE39582 dataset; (D) Boxplots of differentially expressed genes between normal and CRC tissues in the GSE39582 dataset. Hierarchical clustering was done using Euclidean distance and average linkage method from both genes and samples. Signed-rank Wilcoxon’s test and unpaired t-test were used to perform pairwise comparisons between CRC and normal tissues in the TCGA and GSE39582 datasets, respectively and were followed by BH adjustment, respectively. (***: BH-adjusted p < 0.001). CRC: colorectal cancer; TCGA: The Cancer Genome Atlas; Ca: calcium; KCa: Ca2+-dependent potassium channels. BH: Benjamini-Hochberg.
Cancers 11 00561 g001
Figure 2. Pearson’s correlation heatmaps of gene expression in TCGA and GSE39582 datasets. (A) Pearson’s correlation heatmaps of KCa channels family coding genes; (B) Pearson’s correlation heatmaps of TRPM channels family coding genes; (C) Pearson’s correlation heatmaps of ORAI family and TRPC1 genes. Pearson’s correlation coefficients were shown with continuous gradient colors. Red represents positive correlation whereas blue represents negative correlation. Asterisk symbol correspond to correlations with BH-adjusted p-value < 0.05. TCGA: The Cancer Genome Atlas; KCa: Ca2+-dependent potassium channels. BH: Benjamini-Hochberg.
Cancers 11 00561 g002
Figure 3. Differentially expressed genes between proximal and distal/rectal tumors in TCGA and GSE39582 datasets. (A) Boxplots of genes downregulated in distal/rectal tumors compared to proximal tumors in TCGA. (B) Boxplots of genes upregulated in distal/rectal tumors compared to proximal tumors in TCGA. (C) Boxplots of genes downregulated in distal tumors compared to proximal tumors in GSE39582. (D) Boxplots of genes upregulated in distal tumors compared to proximal tumors in GSE39582. ANOVA test was used for multiple comparisonsThe student’s t-test was used for pairwise comparison. (* p < 0.05; *** p < 0.001). ANOVA: analysis of variance; TCGA: The Cancer Genome Atlas.
Cancers 11 00561 g003
Figure 4. ORAI1 is downregulated with lymph node metastases in TCGA and GSE39582 datasets. N0 represents tumors with no lymph node metastases and N+ represents tumors with N1 or N2 lymph node metastases. The student’s t-test was used for pairwise comparison. (* p < 0.05). TCGA: The Cancer Genome Atlas.
Cancers 11 00561 g004
Figure 5. Kaplan-Meier survival curves of ORAI3 and TRPC1 genes in TCGA and GSE39582. (A) OS and EFS survival curves for ORAI3 in the TCGA dataset; (B) OS and RFS survival curves for ORAI3 in the GSE39582 dataset; (C) OS and EFS survival curves for TRPC1 in the TCGA dataset; (D) OS and RFS survival curves for ORAI3 in the GSE39582 dataset. High and Low scores were attributed to patients using gene-median expression as a threshold. Comparison between High and Low categories was done using a Log-Rank test. Abbreviations: OS: Overall survival. EFS: Event-free survival. RFS: Relapse-free survival.
Cancers 11 00561 g005
Figure 6. ORAI3/ORAI1 ratio predicts poor prognosis in CRC. High and Low scores were attributed to patients using ratio ORAI3/ORAI1 median expression as a threshold. High and Low categories were done using a Log-Rank test; (A) OS and EFS survival curves of ORAI3/ORAI1 ratio in the TCGA dataset. (B) OS and RFS survival curves of ORAI3/ORAI1 ratio in the GSE39582; (C) ORAI3/ORAI1 ratio expression according to tumor stages. The ANOVA test was used for multiple comparisons. The BH-adjusted student t-test was used for pairwise comparisons (Stage I was considered a reference). (* p < 0.05; ** p < 0.01; *** p < 0.001).
Cancers 11 00561 g006aCancers 11 00561 g006b
Table 1. Univariate analysis of genes correlated with survival in TCGA and GSE39582.
VariableHazard Ratio95% CIWald’s p-Value
TCGA (OS n = 602)
ORAI3 (High vs. Low)1.72(1.21–2.45)0.003
TRPC1 (High vs. Low)1.44(1.01–2.06)0.042
TCGA (EFS n = 602)
ORAI3 (High vs. Low)1.6(1.2–2.13)0.001
TRPC1 (High vs. Low)1.39(1.04–1.85)0.025
GSE39582 (OS n = 562)
ORAI3 (High vs. Low)1.12(0.84–1.48)0.443
TRPC1 (High vs. Low)1.18(0.89–1.57)0.258
GSE39582 (RFS n = 557)
ORAI3 (High vs. Low)1.43(1.06–1.92)0.02
TRPC1 (High vs. Low)1.34(1–1.81)0.05
Abbreviations: OS: Overall survival. EFS: Event-free survival. RFS: Relapse-free survival. CI: confidence interval.
Table 2. Univariate analysis of ORAI3/ORAI1 ratio with survival in TCGA and GSE39582.
VariableHazard Ratio95% CIWald’s p-Value
TCGA (OS n = 602)
ORAI3/1 ratio (High vs. Low)1.45(1.02–2.07)0.037
TCGA (EFS n = 602)
ORAI3/1 ratio (High vs. Low)1.54(1.15–2.06)0.003
GSE39582 (OS n = 562)
ORAI3/1 ratio (High vs. Low)1.47(1.1–1.95)0.009
GSE39582 (RFS n = 557)
ORAI3/1 ratio (High vs. Low)1.69(1.25–2.28)0.001
Abbreviations: OS: Overall survival. EFS: Event-free survival. RFS: Relapse-free survival. CI: confidence interval.

