Abstract
Loss of heterozygosity (LOH) on chromosome 18q23 is associated with significantly decreased survival in head and neck cancer. In agreement with such tumor suppressive roles, the loss of function of genes located in this region can be achieved through LOH and promotor hypermethylation. In this study, the methylation status of promoters of 18q23 genes in 243 head and neck cancer patients was assessed by quantitative methylation-specific PCR. Promoter methylation was then compared to various clinical characteristics and patient survival. GALR1 and SALL3 promoter methylation correlated with reduced disease-free survival (log-rank test, p = 0.018 and p = 0.013, respectively). Furthermore, based on multivariate Cox proportional hazards analysis, these methylation events were associated with poor disease-free survival, with hazard ratios of 1.600 (95% confidence interval: CI, 1.027–2.493; p = 0.038) and 1.911 (95% CI, 1.155–3.162; p = 0.012), respectively. By comparison, GALR1 and SALL3 methylation were not prognostic for overall survival in The Cancer Genome Atlas (TCGA) cohort. Our findings suggest that the methylation status of 18q23 genes could serve as important biomarkers for the prediction of clinical outcomes in well-annotated head and neck squamous cell carcinoma cohorts. GALR1 and SALL3 methylation could thus help to facilitate risk stratification for individualized treatment.
1. Introduction
In head and neck squamous cell carcinoma (HNSCC), epigenomic inactivation linked to tumor suppressor genes (TSGs) is more frequent compared to somatic mutations in cancer and might drive tumorigenic initiation and progression [1]. Several studies have used gene-specific and genome-wide approaches to examine epigenetic changes and methylation in HNSCC [2,3]. It is widely accepted that understanding such epigenetic events is critical to elucidate the mechanisms through which environmental factors contribute to the development and progression of human cancer [4]. Increasing evidence supports the existence of specific epigenetic changes related to associated risk-factor exposure, which might be exploited to discover new biomarkers that could ultimately improve the prevention, diagnosis, and treatment of cancer [5].
Clinical staging and histological grading systems are convenient but imperfect predictors of recurrence. Risk factors for HNSCC development include tobacco and alcohol abuse, sexual promiscuity, and human papilloma virus (HPV) infection [6]. Patients with HPV-associated oropharyngeal SCC (OPSCC) have a better prognosis than patients with HPV-negative tumors when treated with multimodal therapies [7,8]. Thus, there is a need to further refine and apply concerted approaches to molecular biomarkers for HNSCC, which might help to facilitate early detection, improved monitoring, and the delivery of individualized cancer therapy.
Loss of heterozygosity (LOH) on chromosome 18q is associated with significantly decreased survival in HNSCC [9]. The commonly lost region of 18q is 18q23, which is lost in 53% (D18S461) to 75% (D18S70) of cases [10]. Our preliminary analyses indicated that methylation-induced galanin receptor type 1 (GALR1) gene silencing is a critical event in HNSCC progression and that restoring expression inhibits tumor cell growth [11]. Furthermore, transcriptional inactivation of Sal-like protein 3 (SALL3) was found to be associated with aberrant methylation of other tumor-related genes and ten-eleven translocation (TET) family genes, as well as DNA methyltransferase 3 alpha (DNMT3A) levels, in HNSCC [12]. These findings are consistent with the notion that the methylation status and inactivation of other 18q23 genes might contribute to aggressive tumor behavior in HNSCC.
To test this hypothesis, we investigated the methylation status of 18q23 genes based on two prospective cohort studies (original cohort of 243 patients and The Cancer Genome Atlas (TCGA) comprising 516 cases). We assessed such epigenetic events at diagnosis and during follow-up to assess their clinical significance and potential as prognostic biomarkers for tumor recurrence and patient survival. Furthermore, we carefully reviewed the literature with respect to the association between the methylation of 18q23 genes and survival in patients with human cancers. To our knowledge, this study is the first to implicate 18q23 gene methylation in the prognosis of HNSCC.
2. Results
2.1. Initial Screening: Promoter Methylation Status of 12 Genes Located on 18q23 in Matched Pairs of Head and Neck Tumors and Adjacent Normal Mucosal Tissues
Initially, the promoter methylation status of 12 genes was analyzed in 36 cancerous and paired noncancerous mucosae by quantitative methylation-specific PCR (Q-MSP). Promoter methylation levels were represented by normalized methylation values (NMVs), which are the ratios of methylated DNA at the target sequence in each specimen to fully methylated control DNA. We noted distinct methylation patterns as follows: (a) a higher frequency and quantity of methylated genes was noted in HNSCCs compared to that in controls with the absence of methylation in a subset of normal samples (p < 0.05), including ATPase phospholipid transporting 9B (ATP9B), GALR1, potassium voltage-gated channel modifier subfamily G member 2 (KCNG2), par-6 family cell polarity regulator gamma (PARD6G), and SALL3; (b) a higher frequency of methylated genes was noted in HNSCC compared to that in controls but with similar quantities in both groups (p < 0.10), including heat shock factor binding protein 1 like 1 (HSBP1L1) and nuclear factor of activated T cells 1 (NFATC1); (c) methylation of genes was noted in both HNSCC and controls at a similar frequency with no difference in methylation levels (p ≥ 0.10), including CTD phosphatase subunit 1 (CTDP1), PQ loop repeat containing 1 (PQLC1), ribosome binding factor A (RBFA), thioredoxin like 4A (TXNL4A), and zinc finger protein 516 (ZNF516) (Figure 1a and Figure S1). Based on these results, seven genes (ATP9B, GALR1, HSBP1L1, KCNG2, NFATC1, PARD6G and SALL3) could distinguish HNSCC samples from normal samples, and these were selected for further testing using the expanded cohort.
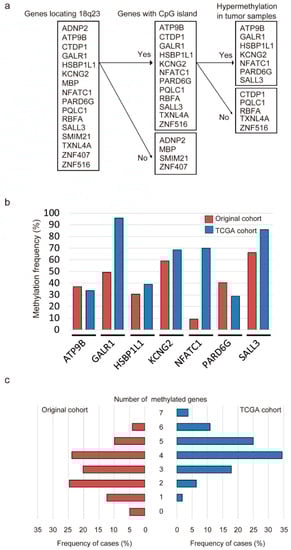
Figure 1.
Methylation of genes located on 18q23 in head and neck squamous cell carcinoma (HNSCC) samples. (a) flow chart of the selection of candidate genes; (b) bar graph showing the methylation frequencies of the seven genes in the original cohort (red bars) and TCGA cohort (blue bars). (c) bar graph comparing the number of HNSCC cases to the number of methylated genes in the original cohort (red bars) and TCGA cohort (blue bars).
2.2. Promoter Methylation Status of Seven Genes in Original and TCGA Cohorts
Q-MSP was next used to assess the promoter methylation status of seven genes located on 18q23 in 243 primary HNSCC samples. The methylation rates for these genes were as follows: ATP9B, 37.0%; GALR1, 49.4%; HSBP1L1, 30.5%; KCNG2, 59.3%; NFATC1, 9.1%; PARD6G, 40.3% and SALL3, 66.3% in original cohort. In the TCGA cohort, we also detected frequent methylation of ATP9B (33.7%), GALR1 (95.9%), HSBP1L1 (39.0%), KCNG2 (68.6%), NFATC1 (70.0%), PARD6G (28.9%) and SALL3 (85.9%) in HNSCC (Figure 1b). The mean number of methylated genes per sample (original cohort and TCGA cohort) was 2.72 (range, 0–6) and 4.22 (range, 1–7), respectively. In the original cohort, at least one of these genes was methylated in most samples (231 of 243 samples, 95.1%). In the TCGA cohort, aberrant methylation of at least one of the seven genes was detected in all cases (Figure 1c). Regarding the relationships between mRNA expression and DNA methylation, Pearson correlation analysis revealed significant inverse correlations for GALR1 and SALL3, positive correlations for HSBP1L1, and no correlations of ATP9B, KCNG2, NFATC1 and PARD6G in the TCGA cohort (Figure S2). From the TCGA database, the average β values for GALR1, NFATC1 and SALL3 methylation were significantly higher in the HNSCC samples than in the normal samples (p < 0.001). Furthermore, the methylation of ATP9B, HSBP1L1, KCNG2 and PARD6G promoters was not associated with HNSCC and normal control groups (Figure S3).
2.3. Correlation between the Methylation Status of Seven Gene Promoters Located on 18q23 and Clinicopathological Parameters
The associations between the methylation status of target genes and clinicopathological features in the original cohort are summarized in Table 1. A higher recurrence rate was observed for patients with methylated GALR1 (p = 0.007). Methylation of SALL3 was also associated with recurrence events (p = 0.033) (Table 1). In the TCGA cohort, methylation of the ATP9B promoter was significantly correlated with tumor size (p = 0.023) and clinical stage (p = 0.006), methylation of the GALR1 promoter was significantly correlated with lymph node status (p = 0.024), and methylation of the HSBP1L1 promoter was significantly correlated with sex (p < 0.001) and smoking status (p = 0.002) (Table 2). Continuous marker methylation analyses showed no association between the methylation index (MI) of any of the seven target genes and age at disease onset, sex, alcohol consumption, smoking status, tumor size, lymph node status, clinical stage, or recurrence (Figure S4a,b).

Table 1.
Distribution of methylation status by selected epidemiologic and clinical characteristics in the original cohort.
Table 2.
Distribution of methylation status by selected epidemiologic and clinical characteristics in the TCGA cohort.
2.4. Kaplan–Meier Analysis
Based on the original cohort, Kaplan–Meier survival curves for each of the seven genes are shown in Figure 2. Disease-free survival (DFS) time did not significantly differ between patients with methylated genes and those with unmethylated genes, with two notable exceptions; this was significantly shorter when GALR1 was methylated (p = 0.018; Figure 2b) and when SALL3 was methylated (p = 0.013; Figure 2g). For GALR1 and SALL3, the DFS rates for both unmethylated genes, either methylated genes, and both methylated genes, were 66.9%, 59.5% and 0%, respectively (p = 0.010; Figure 2h). Based on log-rank tests, a trend in poorer DFS for patients with the methylation phenotype, defined as ≥5 methylated genes, was observed (p = 0.056; Table S1). To validate the prognostic implications of the methylation of the seven target genes, we examined the data for the 507 HNSCC patients in TCGA database. Methylation of any gene was not associated with an altered overall survival rate when compared to that for samples harboring low levels of methylation (Figure S5).
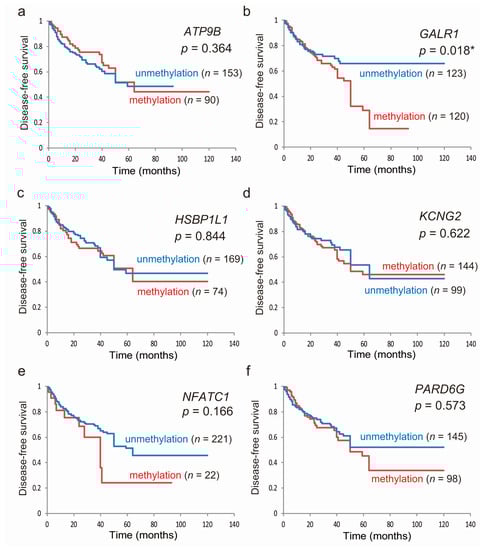
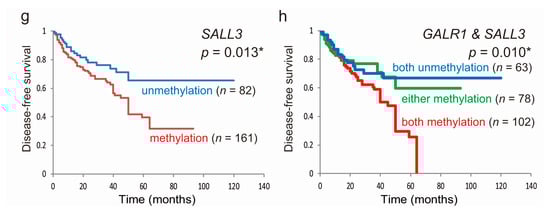
Figure 2.
Kaplan–Meier survival curves for the 243 patients with HNSCC according to the methylation status of the seven target genes. Disease-free survival based on (a) ATP9B, (b) GALR1, (c) HSBP1L1, (d) KCNG2, (e) NFATC1, (f) PARD6G, and (g) SALL3 methylation; methylated (red lines) and unmethylated (blue lines) cases are shown; (h) joint analysis of GALR1 and SALL3 genes. blue line: patients with both unmethylated genes; green line: patients with either methylated gene; red line: patients with both methylated genes. A probability of <0.05 (* p < 0.05) was considered a statistically significant difference.
2.5. Prognostic Value of the Methylation Status of Seven Genes Located on 18q23
The association between methylation and risk of recurrence was estimated via multivariate analysis using a Cox proportional hazards model adjusted for age, HPV status, smoking status, alcohol consumption, and clinical stage. In patients exhibiting GLAR1 promoter methylation (120/243, 49.4%), the adjusted odds ratio (OR) for recurrence was 1.600 (95% confidence interval [CI]: 1.027–2.493, p = 0.038). SALL3 methylation (161/243, 66.3%) also showed a significant association with recurrence (OR = 1.911, 95% CI: 1.155–3.162, p = 0.012; Table 3).
Table 3.
Methylation status of individual genes and associations with disease-free survival using Cox proportional hazards model in 243 patients.
3. Discussion
The identification of epigenetic modifications of 18q23 genes is important to elucidate the mechanisms underlying tumorigenesis and to assess recurrence risk; we studied this in 243 HNSCC patients. We found that aberrant methylation of GALR1 and SALL3 promoters was positively correlated with recurrence in patients with HNSCCs. To our knowledge, this study is the first to show that the epigenetic regulation of 18q23 genes can provide insights into the aggressive tumor behavior and the risk of disease recurrence in HNSCC.
It was reported that the loss of chromosome 18q develops with tumor progression and is associated with significantly decreased survival in HNSCC patients [10,13]. The missing portion of 18q23 can vary from 53% (D18S461) to 75% (D18S70) and encompasses the GALR1 and SALL3 locus [10]. Somatic gene mutations are not the only mechanism of biallelic inactivation. Loss of 18q occurs frequently in HNSCC, with the loss of 18q23 reported in 55% of HNSCCs in the TCGA database [14]. In laryngeal carcinoma, loss of heterozygosity at 18q23 was found to be associated with lymph node involvement and worse prognosis [15].
Interestingly, we found that aberrant methylation of GALR1 and SALL3 is associated with worse DFS and that this might be a critical event in HNSCC. Based on the TCGA cohort of HNSCC, GALR1 and SALL3 mutations occurred at low frequencies, in three (0.58%) and nine (1.75%) of 515 patients, respectively [16]. Furthermore, for GALR1 and SALL3, significant inverse correlations were found between mRNA expression and DNA methylation in this cohort. Furthermore, for the TCGA cohort, we found that GALR1 and SALL3 were the best prognostic markers for patients with HNSCC. Our findings provide evidence that GALR1 and SALL3 methylation might represent a good biomarker to predict HNSCC recurrence. This could facilitate HNSCC screening and the development of surveillance programs.
GALR1 is one of three G-protein coupled receptors (GPCRs) for galanin, a neuropeptide encoded by the GALR1 gene that is widely expressed in several peripheral tissues including the gastrointestinal tract, skeletal muscle, heart, kidney, uterus, ovary, and testis, in addition to the central nervous system [17]. GALR1-transfected HNSCC cells demonstrated decreased cell proliferation and colony formation after galanin stimulation [18]. Thus, GALR1 might represent a tumor suppressor in HNSCC. Recently, it was reported that aberrant GALR1 promoter methylation is significantly associated with shortened survival in salivary duct carcinoma patients [19]. The presence of GALR1 methylation in vaginal swabs also indicates the presence of endometrial malignancy with a sensitivity of 92.7% and a specificity of 78.9% [20]. Therefore, GALR1 DNA methylation is one common molecular alteration in human cancers (Table 4).
Table 4.
Published studies of 18q23 genes and biomarkers for patients.
The product of NFATC1 is a component of the nuclear factor of activated T cells DNA-binding transcription complex. Hypomethylation of the promoter region of NFATC1 was identified in chronic lymphocytic leukemia patients and found to correlate with disease stage [21]. Strong NFATC1 expression was also found to be significantly associated with worse patient outcomes in urothelial carcinoma [22]. Furthermore, NFATC1 overexpression in high-grade serous ovarian carcinoma is an independent prognostic factor of poor overall survival and early relapse [23]. NFATC1 might thus play a causative role in oncogenesis (Table 4). In HNSCC, NFATC1 comprises a region that still needs to be explored. Our results indicated that NFATC1 hypermethylation occurs with extremely low frequency and is not associated with outcome.
Vertebrate spalt proteins are classified into four groups, encoded by four genes in humans, namely SALL1–4 [24]. Four genes have also been identified in mice, namely Sall1–4, whereas three have been found in chickens, three in zebrafish, and five in xenopus [24]. SALL3 is an epigenetic hotspot for aberrant DNA methylation and is associated with abnormal placental development in mice [25]. Several clinical studies have been carried out to investigate the association between SALL3 and carcinogenesis. Shikauchi et al. reported that SALL3 can be silenced by DNA methylation and that the encoded protein interacts with DNA methyltransferases 3 alpha (DNMT3A) in hepatocellular carcinoma [26]. Aberrant hypermethylation of SALL3 is also positively associated with HPV infection in cervical cancer [27]. Furthermore, recurrent bladder cancer patients were found to display higher proportions of SALL3 DNA methylation compared to that in non-recurrent bladder cancer patients [28]. Accordingly, methylation profiling of urine sediments, to detect the top four frequently methylated genes, namely SALL3, CFTR, ABCC6, and HPP1, together can detect bladder cancer with 82.6% sensitivity and 100% specificity [29]. The SALL3 gene might thus play a role in the tumorigenesis and could serve as an important biomarker for human cancers (Table 4).
In this study, we present a more comprehensive epigenetic analysis of chromosome 18q23 including its methylation patterns in HNSCC and normal mucosal tissues. Our study is the first to investigate the pattern of DNA methylation at chromosome 18q23, as well as its relationship with poor survival and early relapse. Regarding cancer risk, we also showed that there might also be a role for DNA methylation at this important cancer susceptibility locus.
4. Methods
4.1. Tumor Samples of Original Cohort
In total, 243 primary HNSCC samples were obtained from patients during surgery at the Department of Otolaryngology, Hamamatsu University School of Medicine. The samples were obtained soon after diagnosis and were thus from untreated tumors. Pertinent information including age, sex, smoking status, alcohol consumption, primary tumor site, tumor size, lymph node status, and clinical stage was obtained from the patients’ medical records. The male:female ratio in the patient cohort was 208:35. The mean age was 65.1 years (range, 32–92 years). Primary tumors were in the hypopharynx (n = 58), larynx (n = 47), oropharynx (n = 66), or oral cavity (n = 72). All patients provided written informed consent, and the study protocol was approved by the Institutional Review Board of the Hamamatsu University School of Medicine (date of board approval: 2 October 2015, ethic code: 25-149).
4.2. Target Gene Selection
Examination of the number and size of CpG islands and the density of CpG sites in upstream and downstream flanking sequences of the transcription start sites of ADNP homeobox 2 (ADNP2), myelin basic protein (MBP), small integral membrane protein 21 (SMIM21), and zinc finger protein 407 (ZNF407) was eliminated from the study targets since they did not contain CpG islands within the target regions. We therefore selected 12 genes located on 18q23 (ATP9B, CTDP1, GALR1, HSBP1L1, KCNG2, NFATC1, PARD6G, PQLC1, RBFA, SALL3, TXNL4A and ZNF516), which had CpG islands in their transcription start sites. A CpG island is defined as a DNA segment fulfilling the following three conditions: (i) length of the segment is at least 200 bp, (ii) G and C contents are ≥50%, and (iii) the observed CpG to expected CpG ratio is ≥0.6 [30].
4.3. Q-MSP Analysis
Extraction and bisulfite conversion of genomic DNA from 243 primary HNSCC and 36 noncancerous mucosal samples were performed using the MethylEasy Xceed Rapid DNA Bisulfite Modification Kit (TaKaRa, Tokyo, Japan), as per the manufacturer’s instructions [31,32]. The bisulfite-modified DNA was used as a template for fluorescence-based real-time PCR [2]. The methylation levels of the CpG islands in the promoters of the 12 genes located on 18q23 were determined via Q-MSP with the TaKaRa Thermal Cycler Dice Real Time System TP800 (TaKaRa). A list of the primer sequences for Q-MSP analysis is shown in Table S2. Exon structures and CpG sites within the expanded views of the promoter region relative to the transcription start site are presented in Figure S6. A standard curve was constructed by plotting known concentrations of serially-diluted EpiScope Methylated HeLa gDNA (TaKaRa). NMVs were determined as follows: NMV = (target gene-S/target gene-FM)/(ACTB-S/ACTB-FM), where target gene-S and target gene-FM represent target gene methylation levels in the tumor sample and universal methylated DNA control, respectively, and ACTB-S and ACTB-FM represent ACTB (which encodes β-actin) methylation levels in the sample and control, respectively. For amplification reactions, 2 μL (0.01 μg/μL) of bisulfite-treated genomic DNA, 12.5 μL of SYBR® Premix DimerEraser TM Perfect Real Time (TaKaRa), and 0.5 μL (10 μM) of each primer were added to a final volume of 25 μL. The PCR conditions were as follows: one denaturing cycle at 95 °C for 10 s, followed by 40 cycles of denaturing at 95 °C for 5 s and annealing/extension at 58 °C for 30 s (two-step reaction). Dissociation curves were carried out at the end of each PCR by following a 3-step procedure. Analysis was performed using the software (version 1.03A) for the Thermal Cycler Dice Real Time System TP800 (TaKaRa), according to the manufacturer’s directions [33,34].
4.4. Analysis of HPV Status
To assess HPV status, samples were also subjected to PCR using specific primers for HPV types 16, 18, 31, 33, 35, 52 and 58. The PCR HPV Typing Set (TaKaRa) method was performed according to the manufacturer’s protocol. The PCR products were separated using 9% polyacrylamide gel electrophoresis followed by ethidium bromide staining.
4.5. Collection of Publicly Available Data from TCGA
Aberrant DNA methylation data available in TCGA (January 2019) were collected via the MethHC database (http://methhc.mbc.nctu.edu.tw/php/index.php) using the Infinium HumanMethylation450 platform (Illumina, Inc., San Diego, CA, USA) and were expressed as β values. The β value is a number between 0 (not methylated) and 1 (completely methylated) that represents the ratio of methylated allele intensity to overall intensity [35]. A conservative cut-off comprising β-values > the median values of normal TCGA samples was used to call samples as methylated. Cutoff levels were determined to be 0.029 for ATP9B, 0.143 for GALR1, 0.083 for HSBP1L1, 0.873 for KCNG2, 0.044 for NFATC1, 0.067 for PARD6G and 0.099 for SALL3.
4.6. Literature Review
A search of the PubMed database using the following terms was performed to identify studies reporting genes in which the detection of methylation or expression was significantly associated with their use as a biomarker for prognosis and diagnosis: “target gene name” AND “cancer” AND “survival” OR “diagnosis” (Table 4).
4.7. Data Analysis and Statistics
The Q-MSP results and patient characteristics (age of onset, sex, smoking status, alcohol consumption, HPV status, tumor size, lymph node status, clinical stage and recurrence events) were compared using a Student’s t-test. Receiver-operator characteristic (ROC) curve analysis was conducted using the NMVs for 36 HNSCC and 36 adjacent normal mucosal samples with the Stata/SE 13.0 system (Stata Corporation, College Station, TX, USA). Prediction accuracy was assessed using the area under the ROC curve. Cut-off values showing the greatest accuracy were determined based on sensitivity/specificity, as indicated in Table S3. The cut-off values were used to determine the methylation frequencies of the target genes. The overall methylation rates in the individual samples were determined by calculating the MI. The MI was defined as the ratio of the number of methylated genes to the number of tested genes in each sample [34,36].
DFS was measured from the date of the initial treatment to the date of diagnosis of first recurrence, either locoregional or systemic. Survival curves were plotted using the Kaplan–Meier method and significance was assessed by the log-rank test. The prognostic value of methylation status was assessed by performing multivariate Cox proportional hazards analysis adjusting for age (≥70 versus <70 years), HPV status, smoking status, alcohol intake, and tumor stage (I, II and III versus IV). A p-value less than 0.05 was considered statistically significant. All statistical analyses were performed using StatMate IV software (IV version, ATMS Co. Ltd., Tokyo, Japan).
5. Conclusions
The current study provides evidence that detecting aberrant GALR1 and SALL3 methylation can serve as a means to identify critical events in HNSCC progression. As such, the promoter methylation status of 18q23 genes might be an important marker to explain distinct tumor patterns and behaviors with HNSCC. Our findings support the use of methylation markers to select patients for adjuvant therapy after initial surgical treatment; however, our preliminary findings need to be validated in larger and more homogeneous HNSCC patient cohorts.
Supplementary Materials
The following are available online at https://www.mdpi.com/2072-6694/11/3/401/s1, Figure S1: Methylation status in 36 matched pairs of head and neck tumor and adjacent normal tissue samples, Figure S2: Methylation and expression status of the seven 18q23 genes in HNSCCs in the TCGA database, Figure S3: Methylation status of the seven 18q23 genes in HNSCC (T) and normal (N) samples in the TCGA database, Figure S4: Association between methylation index (MI) and the selected clinical parameters, Figure S5: Kaplan–Meier survival curves based on TCGA data, Figure S6: Schematic representation of (a) ATP9B, (b) GALR1, (c) HSBP1L1, (d) KCNG2, (e) NFATC1, (f) PARD6G, and (g) SALL3 genes; Table S1: Results of log-rank tests for effect of number of methylated genes on disease free survival in 243 HNSCC, Table S2: Real Time MSP Primer List. Table S3. Results of the ROC curve analysis, the sensitivity, specificity, and cutoff value.
Author Contributions
K.M. (Kiyoshi Misawa) and T.K. conceived and designed the study. K.M. (Kiyoshi Misawa) wrote the paper, and K.M. (Kiyoshi Misawa), D.M., A.I., M.M., S.Y., K.M. (Kotaro Morita), Y.M., K.S. and H.M. made final revisions and gave final approval.
Funding
This study was funded by a Grant-in-Aid for Scientific Research (No. 16K11228, No. 16K20239, No. 17K11380, No. 17K16903 and No. 17K16904) from the Ministry of Education, Culture, Sports, Science, and Technology of Japan.
Acknowledgments
The authors would like to thank Yuko Mohri for her excellent technical support.
Conflicts of Interest
The authors declare no conflict of interest.
References
- Guerrero-Preston, R.; Michailidi, C.; Marchionni, L.; Pickering, C.R.; Frederick, M.J.; Myers, J.N.; Yegnasubramanian, S.; Hadar, T.; Noordhuis, M.G.; Zizkova, V.; et al. Key tumor suppressor genes inactivated by “greater promoter” methylation and somatic mutations in head and neck cancer. Epigenetics 2014, 9, 1031–1046. [Google Scholar] [CrossRef] [PubMed]
- Misawa, K.; Mochizuki, D.; Imai, A.; Mima, M.; Misawa, Y.; Mineta, H. Analysis of site-specific methylation of tumor-related genes in head and neck cancer: Potential utility as biomarkers for prognosis. Cancers 2018, 10, 27. [Google Scholar] [CrossRef] [PubMed]
- Nakagawa, T.; Matsusaka, K.; Misawa, K.; Ota, S.; Takane, K.; Fukuyo, M.; Rahmutulla, B.; Shinohara, K.I.; Kunii, N.; Sakurai, D.; et al. Frequent promoter hypermethylation associated with human papillomavirus infection in pharyngeal cancer. Cancer Lett. 2017, 407, 21–31. [Google Scholar] [CrossRef]
- Herceg, Z.; Vaissiere, T. Epigenetic mechanisms and cancer: An interface between the environment and the genome. Epigenetics 2011, 6, 804–819. [Google Scholar] [CrossRef]
- Lima, S.C.; Hernandez-Vargas, H.; Herceg, Z. Epigenetic signatures in cancer: Implications for the control of cancer in the clinic. Curr. Opin. Mol. Ther. 2010, 12, 316–324. [Google Scholar]
- Kumar, B.; Cordell, K.G.; Lee, J.S.; Worden, F.P.; Prince, M.E.; Tran, H.H.; Wolf, G.T.; Urba, S.G.; Chepeha, D.B.; Teknos, T.N.; et al. Egfr, p16, hpv titer, bcl-xl and p53, sex, and smoking as indicators of response to therapy and survival in oropharyngeal cancer. J. Clin. Oncol. 2008, 26, 3128–3137. [Google Scholar] [CrossRef] [PubMed]
- Vermorken, J.B.; Stohlmacher-Williams, J.; Davidenko, I.; Licitra, L.; Winquist, E.; Villanueva, C.; Foa, P.; Rottey, S.; Skladowski, K.; Tahara, M.; et al. Cisplatin and fluorouracil with or without panitumumab in patients with recurrent or metastatic squamous-cell carcinoma of the head and neck (spectrum): An open-label phase 3 randomised trial. Lancet Oncol. 2013, 14, 697–710. [Google Scholar] [CrossRef]
- Rosenthal, D.I.; Harari, P.M.; Giralt, J.; Bell, D.; Raben, D.; Liu, J.; Schulten, J.; Ang, K.K.; Bonner, J.A. Association of human papillomavirus and p16 status with outcomes in the imcl-9815 phase iii registration trial for patients with locoregionally advanced oropharyngeal squamous cell carcinoma of the head and neck treated with radiotherapy with or without cetuximab. J. Clin. Oncol. 2016, 34, 1300–1308. [Google Scholar]
- Takebayashi, S.; Hickson, A.; Ogawa, T.; Jung, K.Y.; Mineta, H.; Ueda, Y.; Grenman, R.; Fisher, S.G.; Carey, T.E. Loss of chromosome arm 18q with tumor progression in head and neck squamous cancer. Genes Chromosomes Cancer 2004, 41, 145–154. [Google Scholar] [CrossRef]
- Takebayashi, S.; Ogawa, T.; Jung, K.Y.; Muallem, A.; Mineta, H.; Fisher, S.G.; Grenman, R.; Carey, T.E. Identification of new minimally lost regions on 18q in head and neck squamous cell carcinoma. Cancer Res. 2000, 60, 3397–3403. [Google Scholar] [PubMed]
- Misawa, K.; Ueda, Y.; Kanazawa, T.; Misawa, Y.; Jang, I.; Brenner, J.C.; Ogawa, T.; Takebayashi, S.; Grenman, R.A.; Herman, J.G.; et al. Epigenetic inactivation of galanin receptor 1 in head and neck cancer. Clin. Cancer Res. 2008, 14, 7604–7613. [Google Scholar] [CrossRef] [PubMed]
- Misawa, K.; Mochizuki, D.; Imai, A.; Misawa, Y.; Endo, S.; Mima, M.; Kawasaki, H.; Carey, T.E.; Kanazawa, T. Epigenetic silencing of sall3 is an independent predictor of poor survival in head and neck cancer. Clin. Epigenet. 2017, 9, 64. [Google Scholar] [CrossRef] [PubMed]
- Golde, T.E. The therapeutic importance of understanding mechanisms of neuronal cell death in neurodegenerative disease. Mol. Neurodegener. 2009, 4, 8. [Google Scholar] [CrossRef] [PubMed]
- Beroukhim, R.; Mermel, C.H.; Porter, D.; Wei, G.; Raychaudhuri, S.; Donovan, J.; Barretina, J.; Boehm, J.S.; Dobson, J.; Urashima, M.; et al. The landscape of somatic copy-number alteration across human cancers. Nature 2010, 463, 899–905. [Google Scholar] [CrossRef] [PubMed]
- Ambrosio, E.P.; Silveira, C.G.; Drigo, S.A.; Sacomano Vde, S.; Molck, M.C.; Rocha, R.M.; Domingues, M.A.; Soares, F.A.; Kowalski, L.P.; Rogatto, S.R. Chromosomal imbalances exclusively detected in invasive front area are associated with poor outcome in laryngeal carcinomas from different anatomical sites. Tumour Biol. 2013, 34, 3015–3026. [Google Scholar] [CrossRef]
- Comprehensive genomic characterization of head and neck squamous cell carcinomas. Nature 2015, 517, 576–582. [CrossRef]
- Barreda-Gomez, G.; Giralt, M.T.; Rodriguez-Puertas, R. G protein-coupled galanin receptor distribution in the rat central nervous system. Neuropeptides 2005, 39, 153–156. [Google Scholar] [CrossRef]
- Kanazawa, T.; Iwashita, T.; Kommareddi, P.; Nair, T.; Misawa, K.; Misawa, Y.; Ueda, Y.; Tono, T.; Carey, T.E. Galanin and galanin receptor type 1 suppress proliferation in squamous carcinoma cells: Activation of the extracellular signal regulated kinase pathway and induction of cyclin-dependent kinase inhibitors. Oncogene 2007, 26, 5762–5771. [Google Scholar] [CrossRef]
- Kanazawa, T.; Misawa, K.; Fukushima, H.; Misawa, Y.; Sato, Y.; Maruta, M.; Imayoshi, S.; Kusaka, G.; Kawabata, K.; Mineta, H.; et al. Epigenetic inactivation of galanin receptors in salivary duct carcinoma of the parotid gland: Potential utility as biomarkers for prognosis. Oncol. Lett. 2018, 15, 9043–9050. [Google Scholar] [CrossRef]
- Doufekas, K.; Hadwin, R.; Kandimalla, R.; Jones, A.; Mould, T.; Crowe, S.; Olaitan, A.; Macdonald, N.; Fiegl, H.; Wik, E.; et al. Galr1 methylation in vaginal swabs is highly accurate in identifying women with endometrial cancer. Int. J. Gynecol. Cancer 2013, 23, 1050–1055. [Google Scholar] [CrossRef]
- Wolf, C.; Garding, A.; Filarsky, K.; Bahlo, J.; Robrecht, S.; Becker, N.; Zucknick, M.; Rouhi, A.; Weigel, A.; Claus, R.; et al. Nfatc1 activation by DNA hypomethylation in chronic lymphocytic leukemia correlates with clinical staging and can be inhibited by ibrutinib. Int. J. Cancer 2018, 142, 322–333. [Google Scholar] [CrossRef]
- Kawahara, T.; Inoue, S.; Fujita, K.; Mizushima, T.; Ide, H.; Yamaguchi, S.; Fushimi, H.; Nonomura, N.; Miyamoto, H. Nfatc1 expression as a prognosticator in urothelial carcinoma of the upper urinary tract. Transl. Oncol. 2017, 10, 318–323. [Google Scholar] [CrossRef] [PubMed]
- Li, L.; Duan, Z.; Yu, J.; Dang, H.X. NFATc1 regulates cell proliferation, migration, and invasion of ovarian cancer SKOV3 cells in vitro and in vivo. Oncol Rep. 2016, 36, 918–928. [Google Scholar] [CrossRef][Green Version]
- Sweetman, D.; Munsterberg, A. The vertebrate spalt genes in development and disease. Dev. Biol. 2006, 293, 285–293. [Google Scholar] [CrossRef] [PubMed]
- Ohgane, J.; Wakayama, T.; Senda, S.; Yamazaki, Y.; Inoue, K.; Ogura, A.; Marh, J.; Tanaka, S.; Yanagimachi, R.; Shiota, K. The sall3 locus is an epigenetic hotspot of aberrant DNA methylation associated with placentomegaly of cloned mice. Genes Cells 2004, 9, 253–260. [Google Scholar] [CrossRef]
- Shikauchi, Y.; Saiura, A.; Kubo, T.; Niwa, Y.; Yamamoto, J.; Murase, Y.; Yoshikawa, H. Sall3 interacts with dnmt3a and shows the ability to inhibit cpg island methylation in hepatocellular carcinoma. Mol. Cell. Biol. 2009, 29, 1944–1958. [Google Scholar] [CrossRef]
- Wei, X.; Zhang, S.; Cao, D.; Zhao, M.; Zhang, Q.; Zhao, J.; Yang, T.; Pei, M.; Wang, L.; Li, Y.; et al. Aberrant hypermethylation of sall3 with hpv involvement contributes to the carcinogenesis of cervical cancer. PLoS ONE 2015, 10, e0145700. [Google Scholar] [CrossRef] [PubMed]
- Van der Heijden, A.G.; Mengual, L.; Ingelmo-Torres, M.; Lozano, J.J.; van Rijt-van de Westerlo, C.C.M.; Baixauli, M.; Geavlete, B.; Moldoveanud, C.; Ene, C.; Dinney, C.P.; et al. Urine cell-based DNA methylation classifier for monitoring bladder cancer. Clin. Epigenet. 2018, 10, 71. [Google Scholar] [CrossRef] [PubMed]
- Yu, J.; Zhu, T.; Wang, Z.; Zhang, H.; Qian, Z.; Xu, H.; Gao, B.; Wang, W.; Gu, L.; Meng, J.; et al. A novel set of DNA methylation markers in urine sediments for sensitive/specific detection of bladder cancer. Clin. Cancer Res. 2007, 13, 7296–7304. [Google Scholar] [CrossRef]
- Gardiner-Garden, M.; Frommer, M. Cpg islands in vertebrate genomes. J. Mol. Biol. 1987, 196, 261–282. [Google Scholar] [CrossRef]
- Misawa, K.; Misawa, Y.; Imai, A.; Mochizuki, D.; Endo, S.; Mima, M.; Ishikawa, R.; Kawasaki, H.; Yamatodani, T.; Kanazawa, T. Epigenetic modification of sall1 as a novel biomarker for the prognosis of early stage head and neck cancer. J. Cancer 2018, 9, 941–949. [Google Scholar] [CrossRef] [PubMed]
- Misawa, K.; Mochizuki, D.; Imai, A.; Endo, S.; Mima, M.; Misawa, Y.; Kanazawa, T.; Carey, T.E.; Mineta, H. Prognostic value of aberrant promoter hypermethylation of tumor-related genes in early-stage head and neck cancer. Oncotarget 2016, 7, 26087–26098. [Google Scholar] [CrossRef] [PubMed][Green Version]
- Misawa, K.; Imai, A.; Mochizuki, D.; Mima, M.; Endo, S.; Misawa, Y.; Kanazawa, T.; Mineta, H. Association of tet3 epigenetic inactivation with head and neck cancer. Oncotarget 2018, 9, 24480–24493. [Google Scholar] [CrossRef] [PubMed]
- Misawa, K.; Imai, A.; Mochizuki, D.; Misawa, Y.; Endo, S.; Hosokawa, S.; Ishikawa, R.; Mima, M.; Shinmura, K.; Kanazawa, T.; et al. Genes encoding neuropeptide receptors are epigenetic markers in patients with head and neck cancer: A site-specific analysis. Oncotarget 2017, 8, 76318–76328. [Google Scholar] [CrossRef]
- Huang, W.Y.; Hsu, S.D.; Huang, H.Y.; Sun, Y.M.; Chou, C.H.; Weng, S.L.; Huang, H.D. Methhc: A database of DNA methylation and gene expression in human cancer. Nucleic Acids Res. 2015, 43, D856–D861. [Google Scholar] [CrossRef] [PubMed]
- Misawa, K.; Mima, M.; Imai, A.; Mochizuki, D.; Misawa, Y.; Endo, S.; Ishikawa, R.; Kanazawa, T.; Mineta, H. The neuropeptide genes sst, tac1, hcrt, npy, and gal are powerful epigenetic biomarkers in head and neck cancer: A site-specific analysis. Clin. Epigenet. 2018, 10, 52. [Google Scholar] [CrossRef] [PubMed]
© 2019 by the authors. Licensee MDPI, Basel, Switzerland. This article is an open access article distributed under the terms and conditions of the Creative Commons Attribution (CC BY) license (http://creativecommons.org/licenses/by/4.0/).