Article

The mRNA-binding Protein TTP/ZFP36 in Hepatocarcinogenesis and Hepatocellular Carcinoma

1
Department of Pharmacy, Pharmaceutical Biology, Saarland University, 66123 Saarbrücken, Germany
2
Institute of Pharmacy, Department of Pharmacology for Natural Sciences, Martin Luther University Halle-Wittenberg, 06120 Halle, Germany
3
Department for Computational Biology and Applied Algorithmics, Max Planck Institute for Informatics, Saarland Informatics Campus, 66123 Saarbrücken, Germany
4
Big Data in BioMedicine Group, Chair of Experimental Bioinformatics, TUM School of Life Sciences Weihenstephan, Technical University of Munich, 85354 Freising, Germany
5
School of Electrical Engineering and Information Technology, German Jordanian University, Amman 11180, Jordan
6
Center for Bioinformatics, Saarland University, 66123 Saarbrücken, Germany
7
The Laboratory of Signal Transduction, National Institute of Environmental Health Sciences, Research Triangle Park, NC 27709, USA
8
Department of Comparative Biomedical Sciences, School of Veterinary Medicine, Louisiana State University, Baton Rouge, LA 70803, USA
9
Department of Microbial Natural Products, Helmholtz Institute for Pharmaceutical Research Saarland, Helmholtz Centre for Infection Research, 66123 Saarbrücken, Germany
10
Department of Pathology, Medical Faculty, Otto-von-Guericke University Magdeburg, 39106 Magdeburg, Germany
11
Department of Pathology, Neuropathology and Molecular Pathology, Medical University of Innsbruck, Innsbruck 6020, Austria
12
Institute of Pathology, Medical University of Graz, Graz 8036, Austria
13
Cluster of Excellence in Multimodal Computing and Interaction, Saarland Informatics Campus, 66123 Saarbrücken, Germany
14
Institute for Cardiovascular Regeneration, Goethe-University Hospital, 60590 Frankfurt, Germany
15
German Centre for Cardiovascular Research (DZHK), Partner site Rhine-Main, 60590 Frankfurt, Germany
*
Author to whom correspondence should be addressed.
These authors contributed equally to this work.
Cancers 2019, 11(11), 1754; https://doi.org/10.3390/cancers11111754
Submission received: 13 October 2019 / Revised: 4 November 2019 / Accepted: 5 November 2019 / Published: 8 November 2019

Abstract

:
Hepatic lipid deposition and inflammation represent risk factors for hepatocellular carcinoma (HCC). The mRNA-binding protein tristetraprolin (TTP, gene name ZFP36) has been suggested as a tumor suppressor in several malignancies, but it increases insulin resistance. The aim of this study was to elucidate the role of TTP in hepatocarcinogenesis and HCC progression. Employing liver-specific TTP-knockout (lsTtp-KO) mice in the diethylnitrosamine (DEN) hepatocarcinogenesis model, we observed a significantly reduced tumor burden compared to wild-type animals. Upon short-term DEN treatment, modelling early inflammatory processes in hepatocarcinogenesis, lsTtp-KO mice exhibited a reduced monocyte/macrophage ratio as compared to wild-type mice. While short-term DEN strongly induced an abundance of saturated and poly-unsaturated hepatic fatty acids, lsTtp-KO mice did not show these changes. These findings suggested anti-carcinogenic actions of TTP deletion due to effects on inflammation and metabolism. Interestingly, though, investigating effects of TTP on different hallmarks of cancer suggested tumor-suppressing actions: TTP inhibited proliferation, attenuated migration, and slightly increased chemosensitivity. In line with a tumor-suppressing activity, we observed a reduced expression of several oncogenes in TTP-overexpressing cells. Accordingly, ZFP36 expression was downregulated in tumor tissues in three large human data sets. Taken together, this study suggests that hepatocytic TTP promotes hepatocarcinogenesis, while it shows tumor-suppressive actions during hepatic tumor progression.

Graphical Abstract

1. Introduction

Hepatocellular carcinoma (HCC), the predominant form of liver cancer, is the second most common cause of cancer-related death worldwide [1,2]. Besides viral hepatitis in North Africa and East Asia [3], alcohol abuse, obesity, type 2 diabetes, and metabolic disorders represent the major risk factors for the development of HCC in Northern Europe, the USA, and Canada [4,5].
The initiation and progression of cancer are provoked by a dysregulated expression of proteins controlling diverse cellular phenotypes: cell cycle, differentiation, apoptosis, angiogenesis, and cell invasiveness [6]. Biosynthesis of these proteins is strongly regulated by the concentrations of their respective mRNAs in the cytoplasm, which depend on both mRNA synthesis and degradation. The cytoplasmic stability of many mRNAs is controlled by mRNA-binding proteins (RBPs), some of which have been shown to be deregulated in HCC. However, most of the studies focus on upregulated RBPs [7,8,9,10]. A subgroup of RBPs are so-called adenosine-uridine-rich (AU-rich) element binding proteins (ARE-BPs), which control the stability of mRNAs by binding to the AU-rich elements (ARE) located within their 3′-untranslated region (3′-UTR) [11]. A prominent member of these ARE-BPs, tristetraprolin (TTP, gene name ZFP36), accelerates the decay of transcripts [12]. TTP expression is repressed in several human cancers [13,14] and a loss of functional TTP can impact patient prognosis [15].
HCC usually develops in the course of metabolic changes. Recent evidence showed that hepatocytic TTP seems to rather amplify metabolic disorders by promoting insulin resistance, quite in contrast to its tumor suppressor role [16]. Since, to the best of our knowledge, nothing is known about a potential role of TTP in tumor initiation, we conducted this study to address the potential role of TTP in hepatocarcinogenesis. We analyzed the effect of a liver-specific TTP-knockout (lsTtp-KO) in mice treated with the tumor-inducing agent diethylnitrosamine (DEN). In addition, we investigated the impact of TTP overexpression in a set of hallmarks of cancer in order to study cancer progression. Our findings revealed tumor-promoting actions of TTP in tumor initiation, due to metabolic and inflammatory action, but tumor-suppressive actions in HCC progression.

2. Results

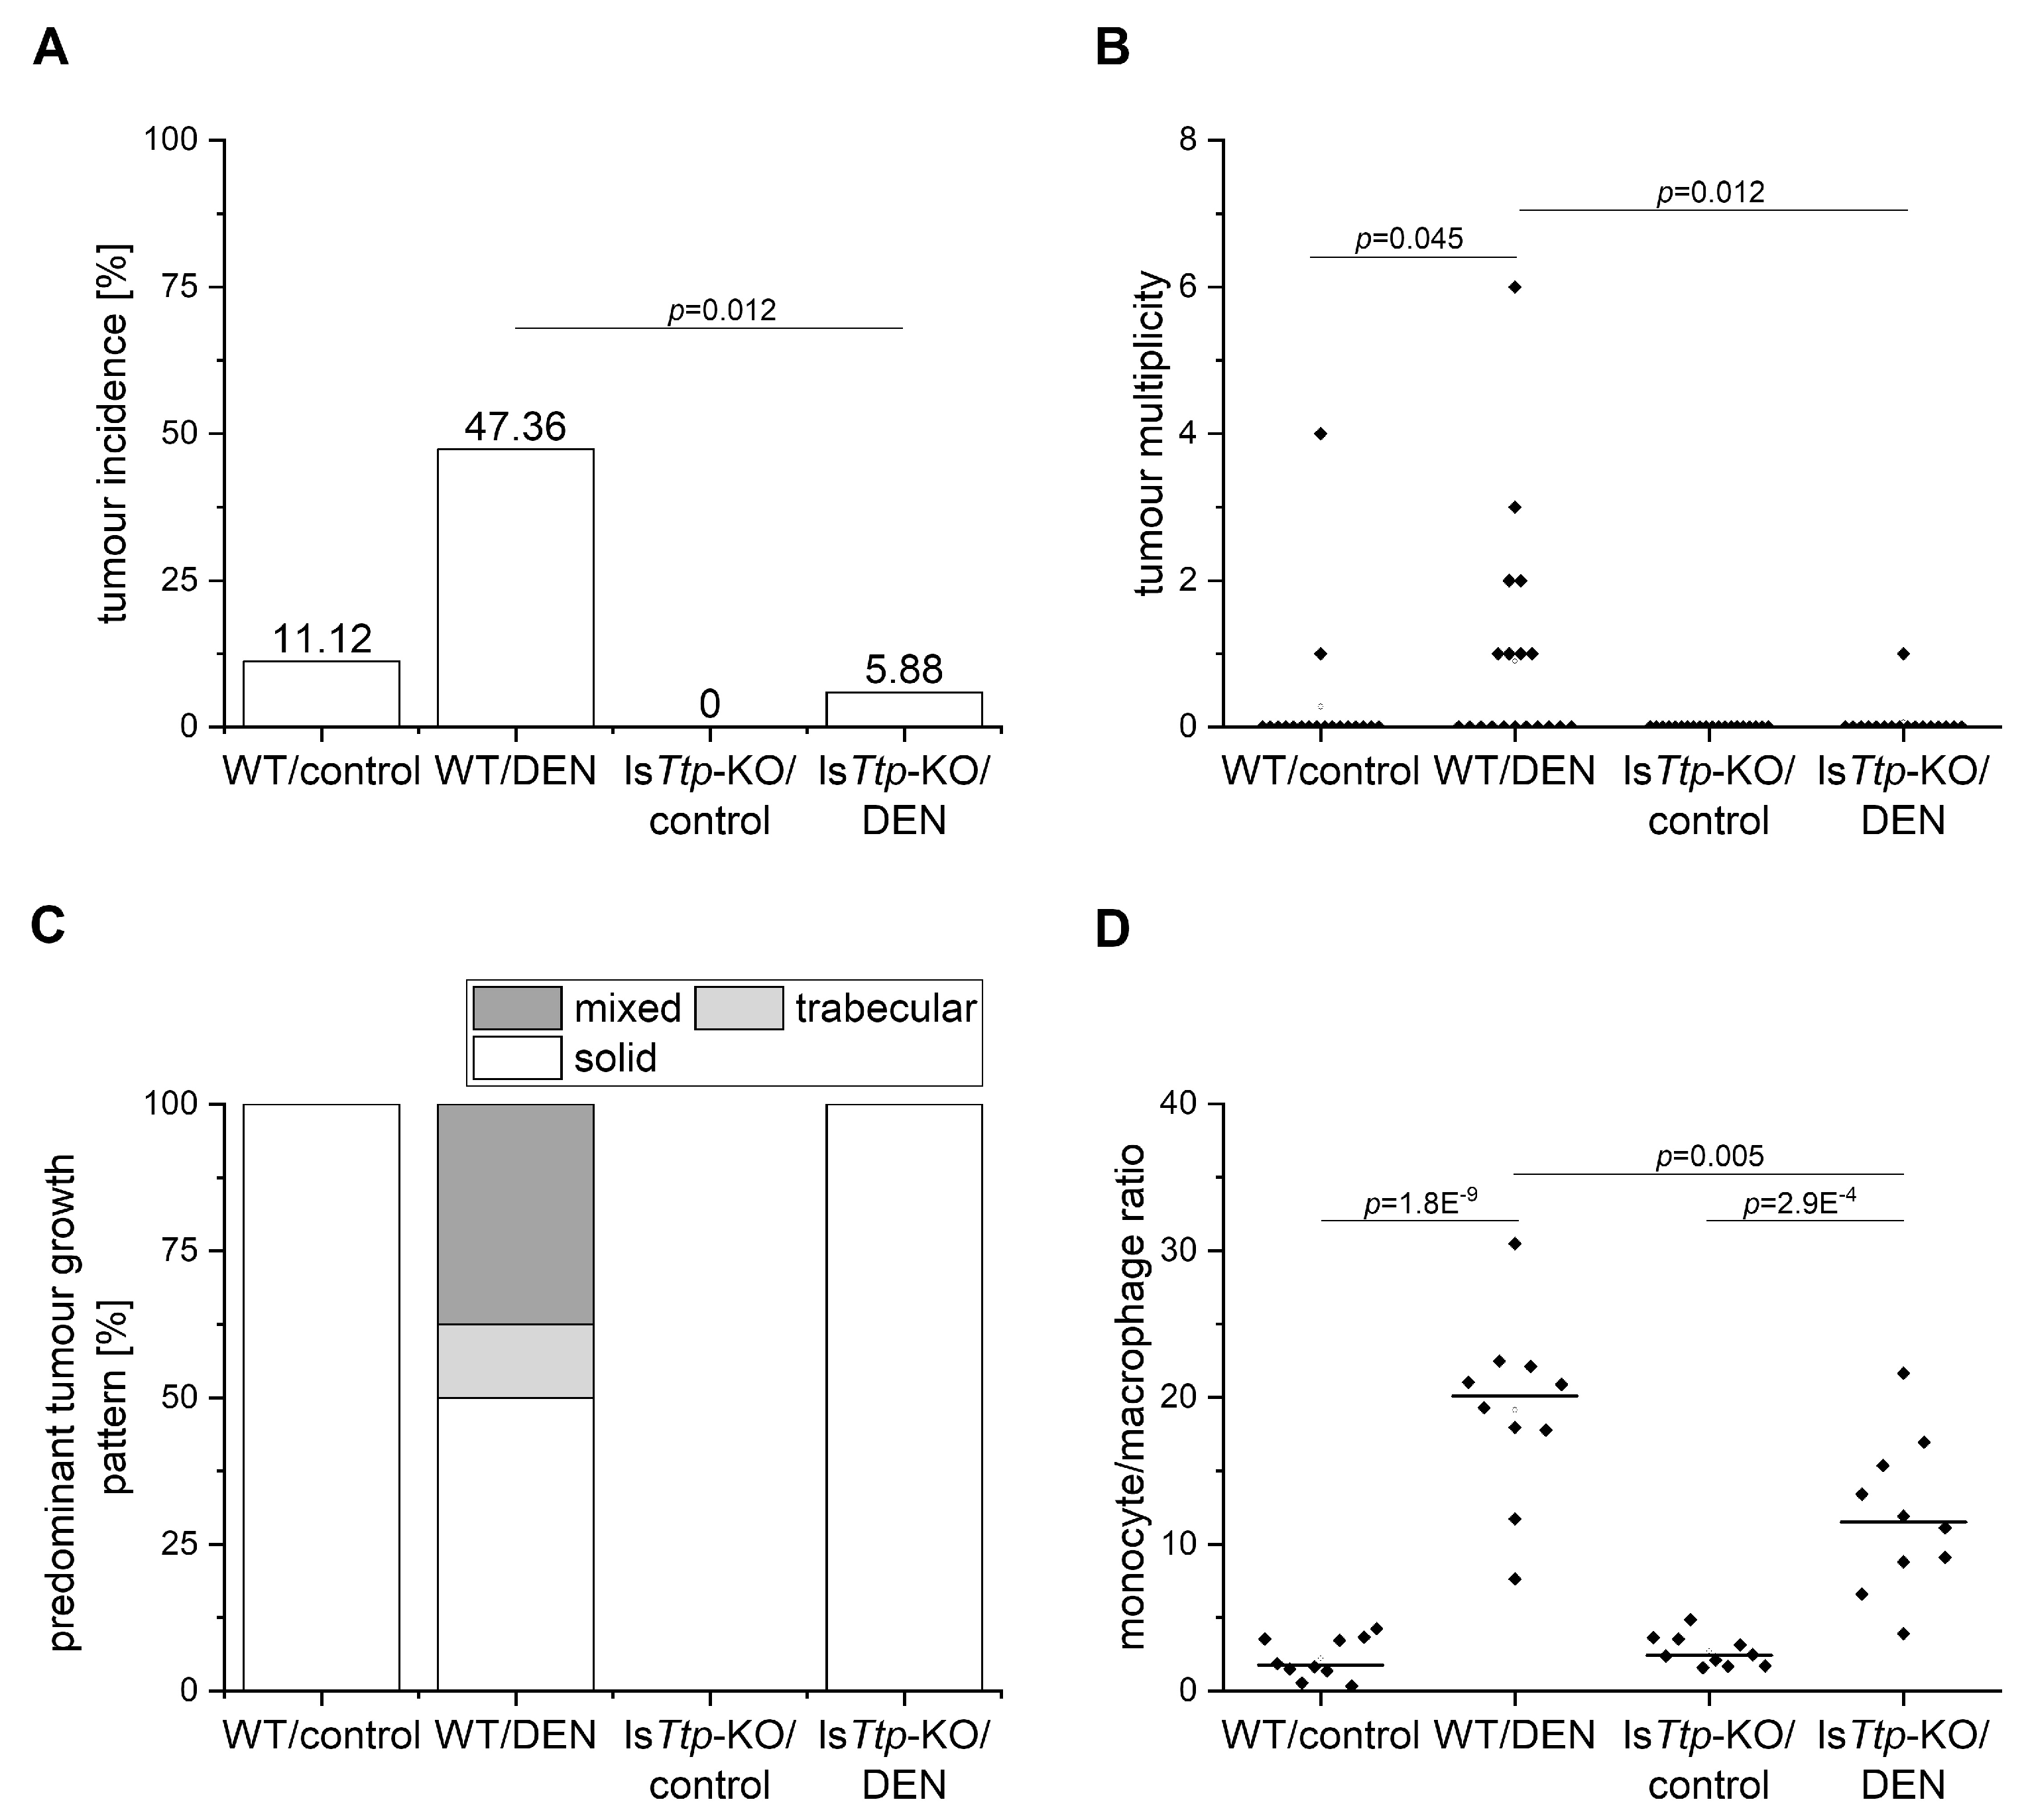
2.1. TTP and Tumor Initiation

In order to study the role of TTP in liver tumor initiation, we employed liver-specific Ttp-KO (lsTtp-KO) mice [16] in the diethylnitrosamine (DEN) hepatocarcinogenesis mouse model. Wild-type and lsTtp-KO mice were treated with DEN at the age of two weeks to induce tumors, and were sacrificed at the age of six months, representing an early time point and therefore rather modelling tumor initiation [17]. The tumor incidence was significantly lower in DEN-treated lsTtp-KO animals compared to DEN-treated wild type animals (Figure 1A), while there was no statistical difference regarding tumor incidence between the genotypes in the sham-treated groups. The number of tumors per animal was significantly lower in the DEN-treated lsTtp-KO animals compared to DEN-treated wild type mice (Figure 1B). While tumors of DEN-treated lsTtp-KO mice showed a solid growth pattern, tumors of wild-type animals were of trabecular, solid, or mixed pattern (Figure 1C).

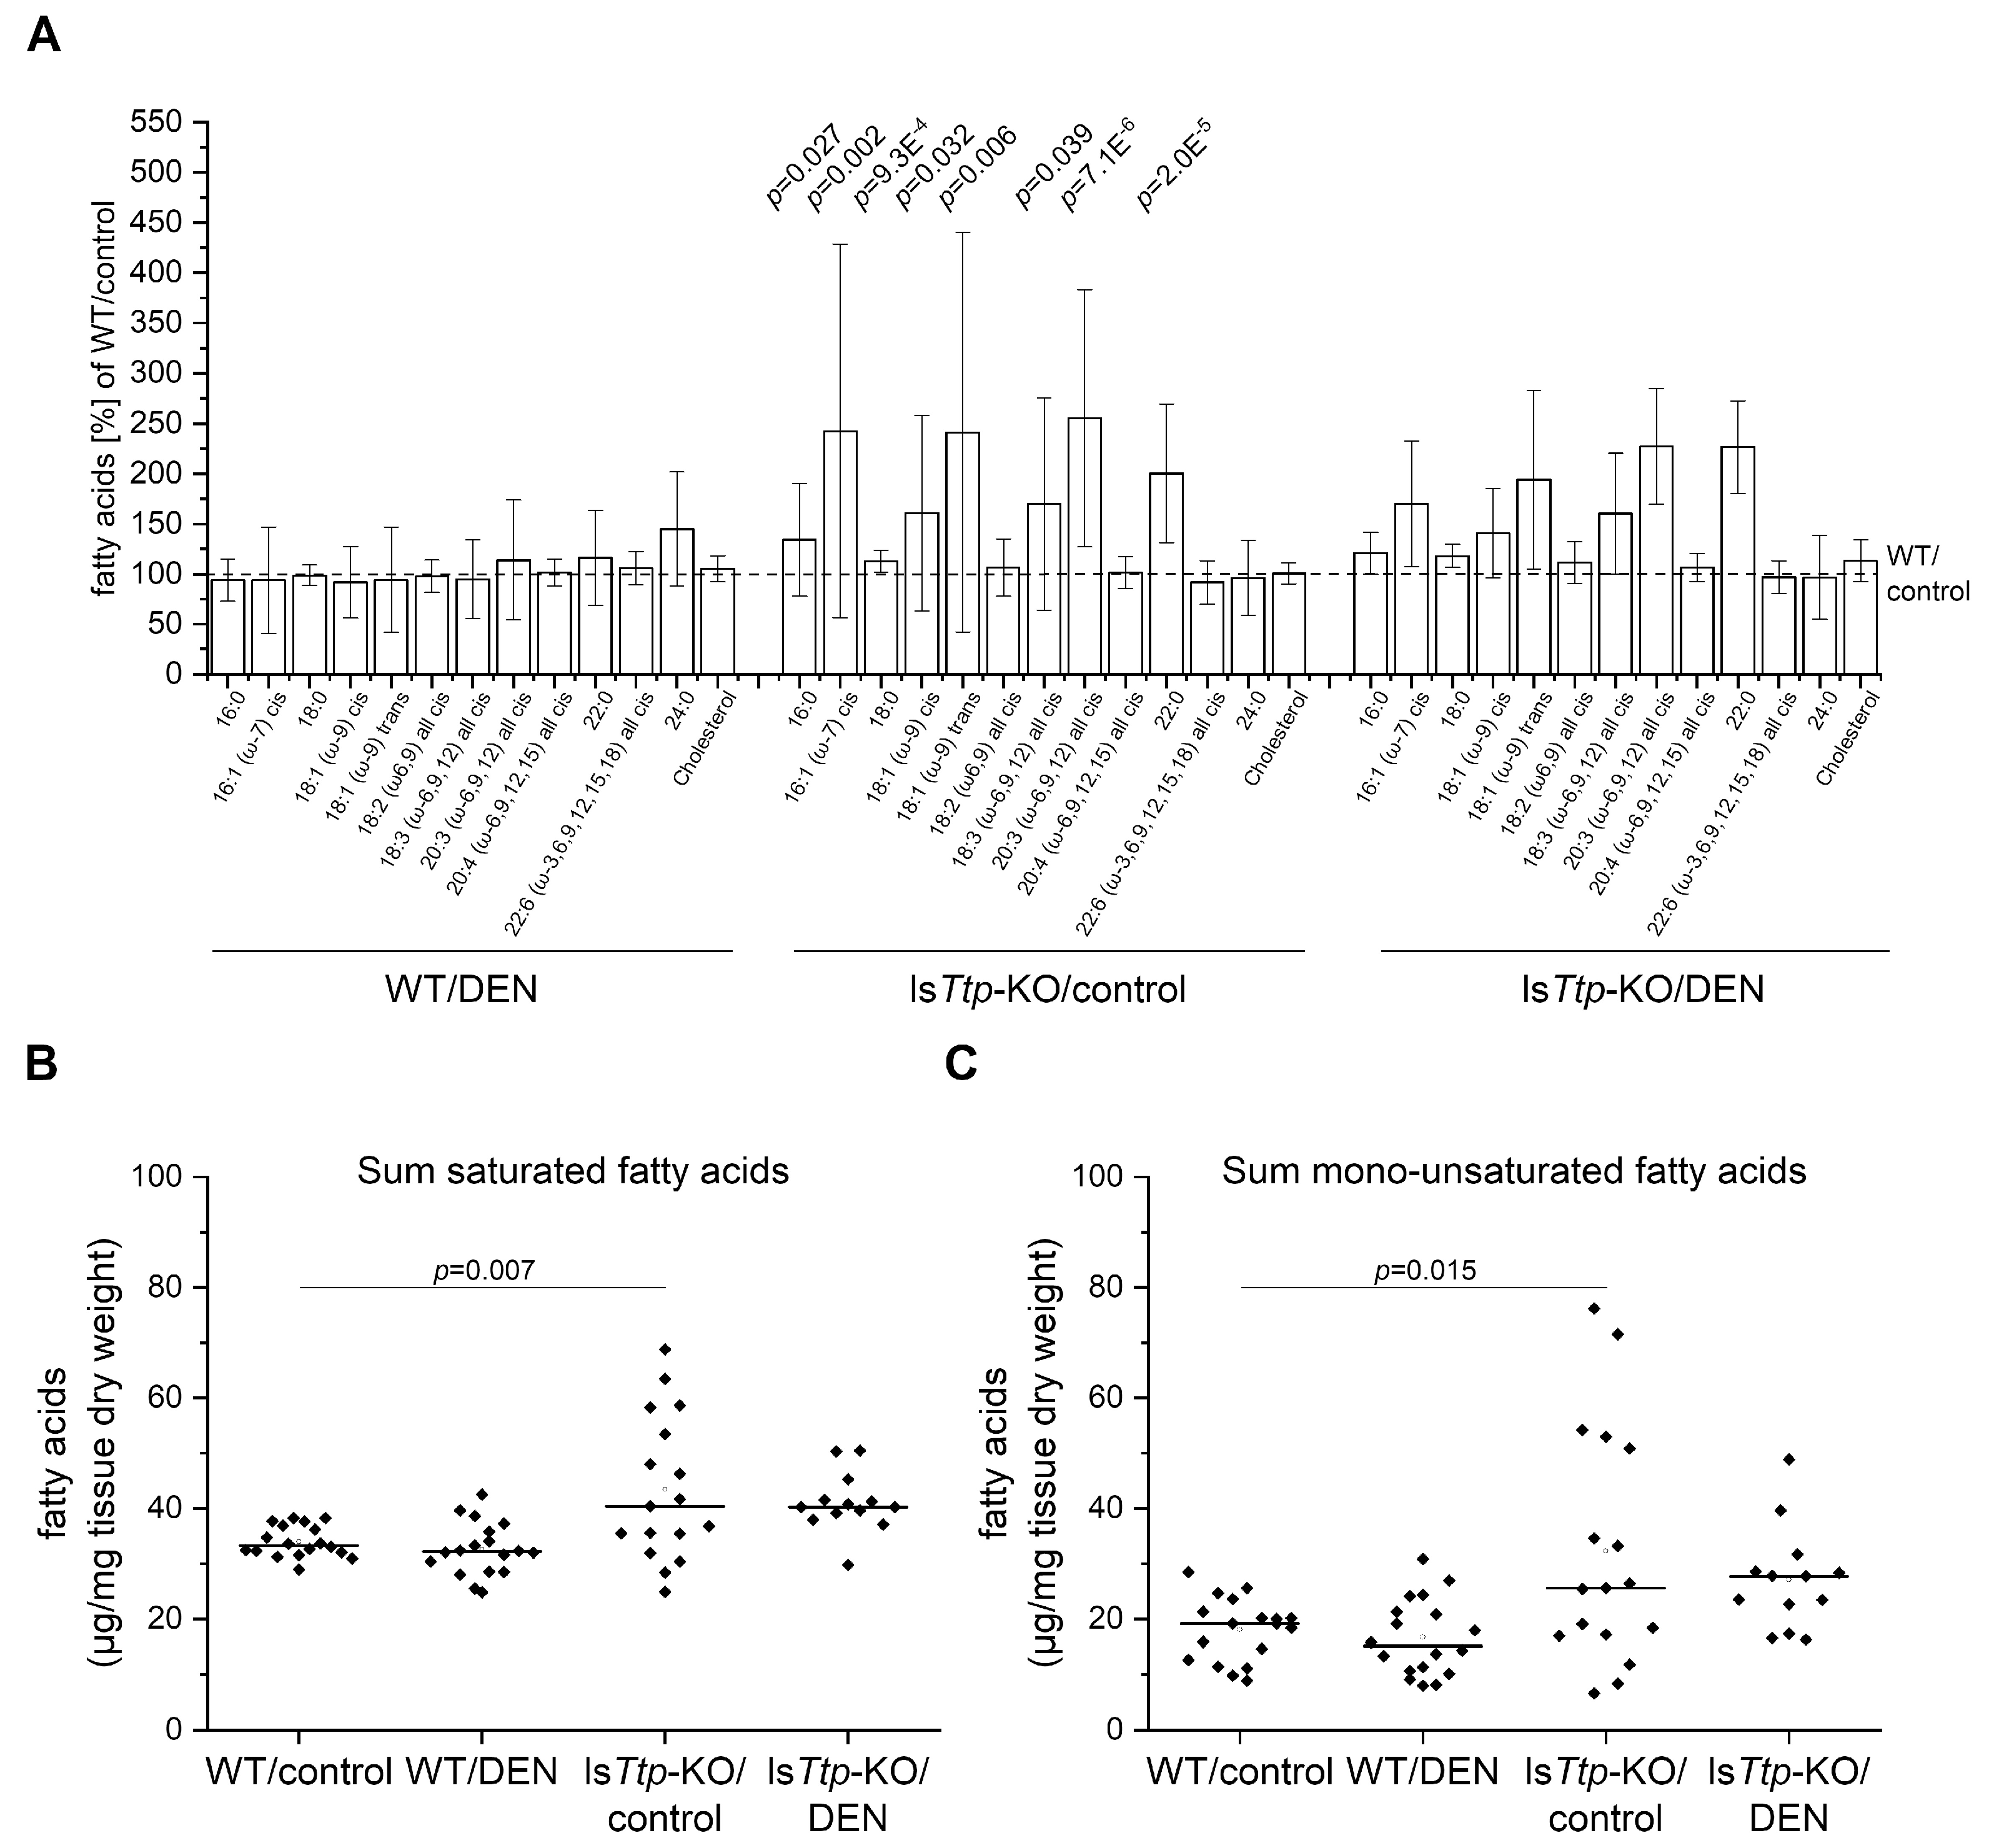
2.2. DEN-Induced Leukocyte Recruitment and Hepatic Lipids

Short-term (48 hh) DEN treatment represents a well-established approach to modeling metabolic and inflammatory events in early hepatocarcinogenesis [18,19]. We hypothesized that protection from DEN-induced liver cancer in lsTtp-KO mice is a consequence of attenuated leukocyte recruitment and lipogenesis. Short-term DEN treatment is characterized by a highly increased monocyte/macrophage ratio [20]. While both genotypes exhibited such an increased monocyte/macrophage ratio as assessed by flow cytometric analysis, the ratio was significantly lower in lsTtp-KO mice compared to wild-types (Figure 1D). No difference could be observed between the genotypes in the sham-treated group (Figure 1D). In the long-term model, there is only a very mild inflammation, which was somewhat lower in lsTtp-KO mice.
The amount and pattern of hepatic lipids are altered during inflammatory conditions and contribute to hepatocarcinogenesis [18,21,22]. Accordingly, short-term DEN treatment also induces lipogenesis [18]. Fatty acid profiling revealed a significant increase in the sum of both saturated fatty acids and poly-unsaturated fatty acids in DEN-treated wild-type livers (Figure 2A–C). However, this increase was less pronounced in lsTtp-KO livers (Figure 2A–C). Profiling of individual fatty acids revealed an increase of individual, but not all, fatty acids, which was almost abrogated in the DEN-treated lsTtp-KO mice (Figure 2A, supplementary Figure S1).
Since reprogramming of energy metabolism has been described as a hallmark of cancer [6], we also assessed fatty acid profiles in livers after long-term (six months) DEN treatment. However, no significant difference in the amount of fatty acids upon DEN treatment was observed in either genotype (Figure 3A–C, supplementary Figure S2). Interestingly, though, sham-treated lsTtp-KO mice showed distinctly increased levels of saturated and mono-unsaturated fatty acids compared to wild-types (Figure 3A–C, supplementary Figure S2), suggesting that lsTtp-KO mice change their phenotype over time.

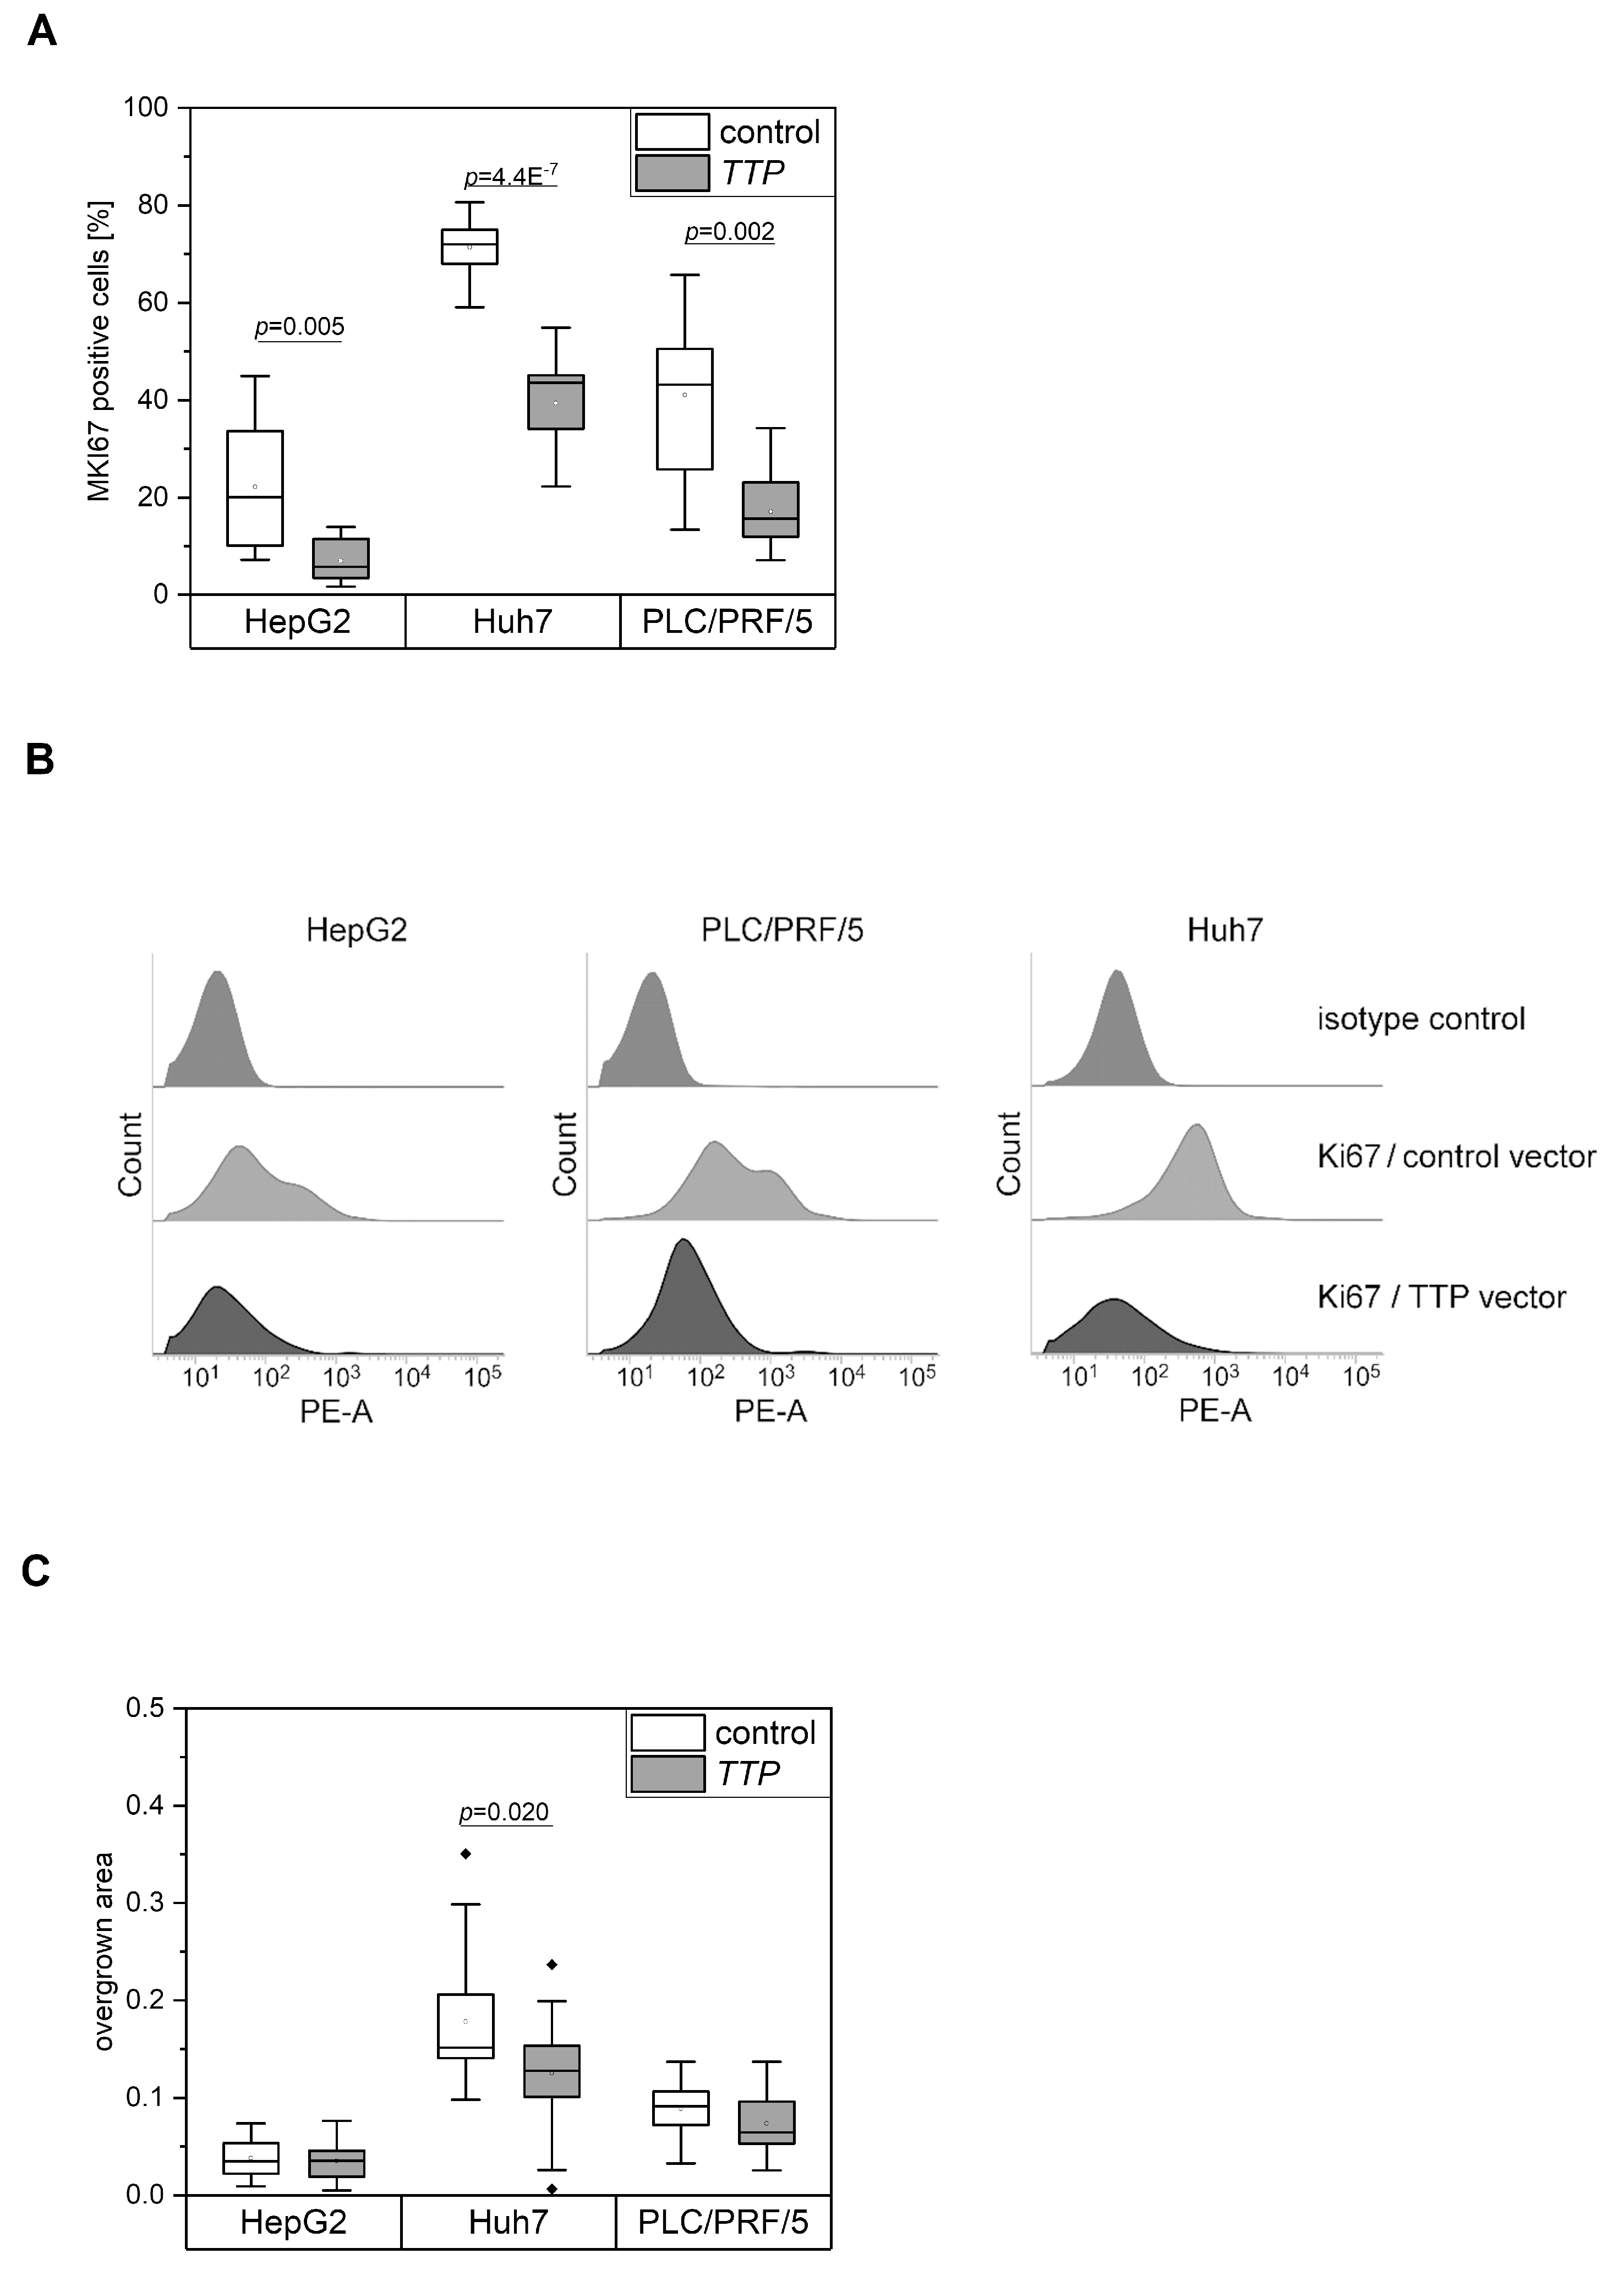
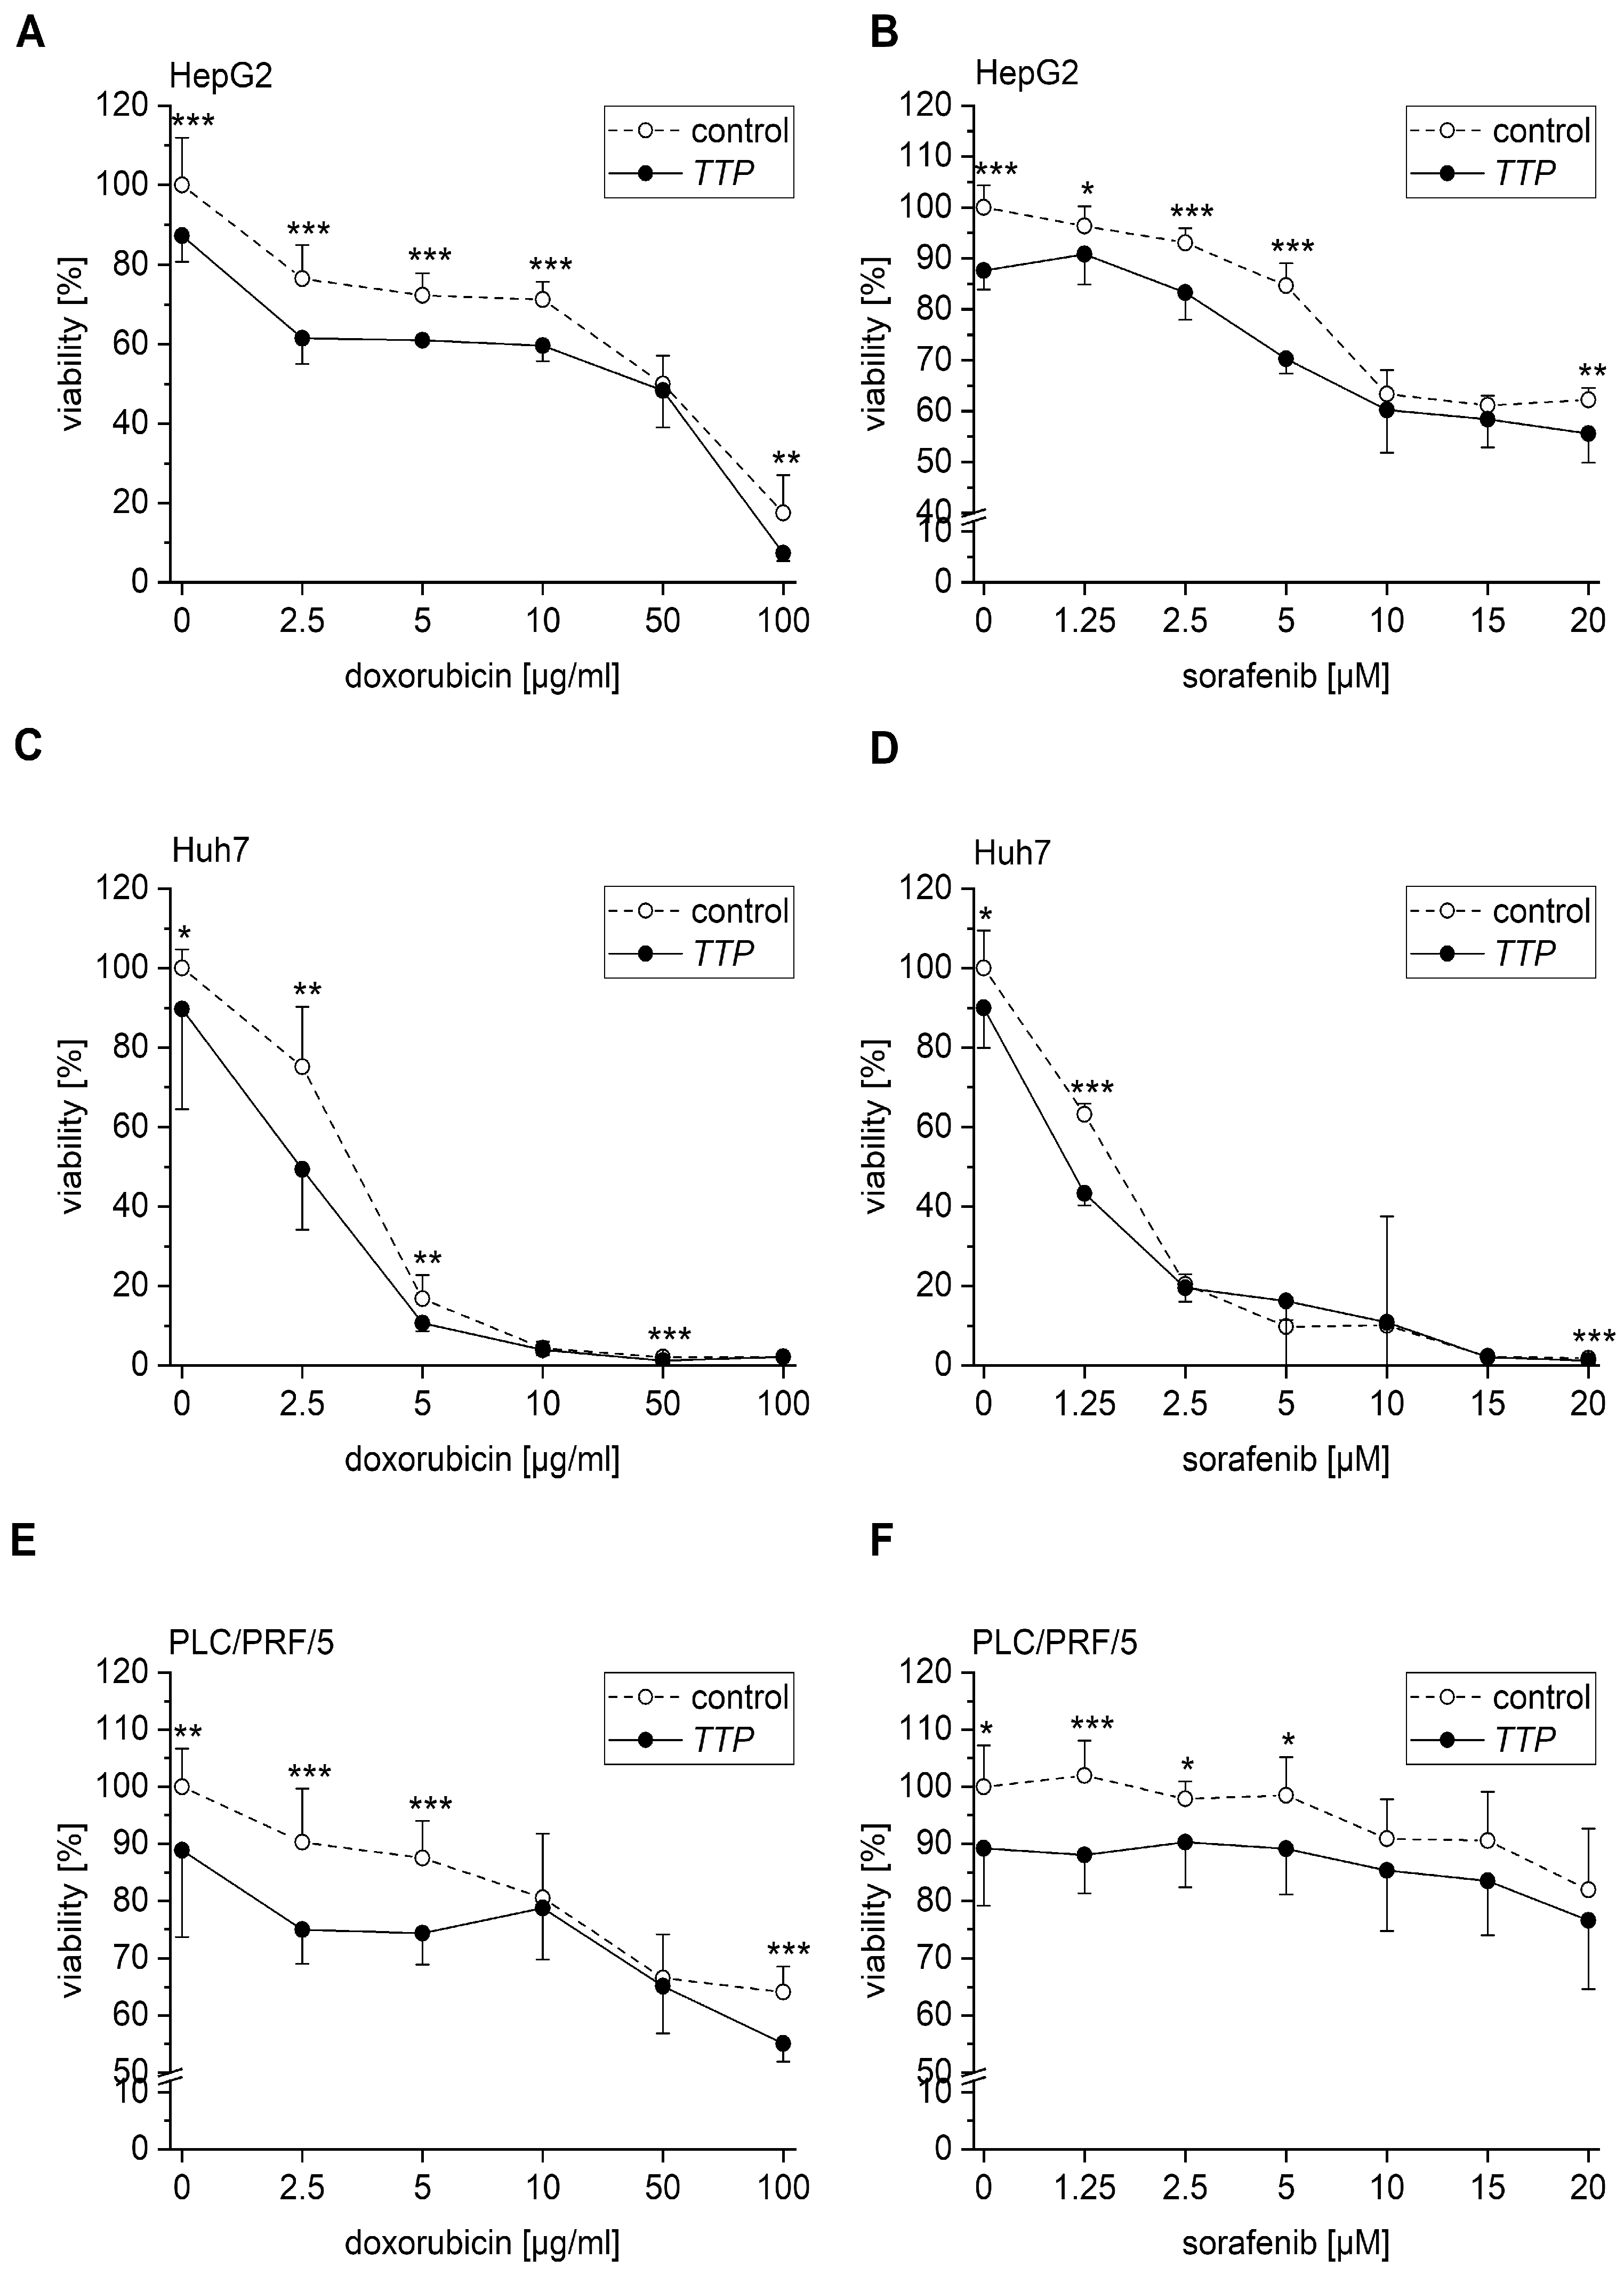
2.3. Effects of TTP on Hallmarks of Cancer

Our data suggested tumor-promoting actions of TTP by supporting tumor initiation. In order to clarify the role of TTP during tumor progression, TTP expression was investigated with respect to several hallmarks of cancer, among which sustaining proliferation might be the most important one. We therefore aimed to investigate a potential action of TTP on cell proliferation by MKI67 staining and flow cytometry in stably overexpressing cell lines. However, cells stably transfected with the overexpressing plasmid did not grow at all. Thus, the proliferation ability of transiently TTP-overexpressing cells was investigated. The proliferation in three different human hepatoma cell lines, i.e., HepG2, PLC/PRF/5, and Huh7 cells was dramatically decreased after TTP overexpression (Figure 4A,B), rather suggesting tumor-suppressing actions of TTP. In line with these findings, we observed that baseline expression of TTP was almost absent in all three cancer cell lines.
Migration as another hallmark of cancer represents a prerequisite of tumor cells to metastasize [6]. We determined the migratory potential of the cells by a scratch assay in TTP-overexpressing or vector control cells. The migratory ability of PLC/PRF/5 and HepG2 cells, but not of Huh7 cells, was inhibited by TTP (Figure 4C), further supporting the tumor-suppressing actions of TTP.
As a parameter of chemosensitivity, TTP-overexpressing cells, as well as control HepG2, PLC/PRF/5, and Huh7 cells, were treated with either sorafenib or doxorubicin. The results suggested an impact of TTP overexpression on chemosensitivity in all three cell lines (Figure 5A–F). However, the viability of untreated TTP-overexpressing cells was significantly lower than the number of untreated control cells in all three cell lines (Figure 5A–F). Therefore, the evaluation was adjusted in a way that TTP-overexpressing and control cells were normalized to the control cells. This revealed a less dramatically decreased, but still significantly different chemosensitivity (Supplementary Figure S3).

2.4. Expression Changes of Potential TTP Targets

Since TTP represents an mRNA destabilizing factor, we hypothesized that TTP’s tumor-suppressing actions were caused by an altered expression of its target genes, i.e., that TTP overexpression resulted in a downregulation of oncogenes, some of which are able to induce angiogenesis as a hallmark of cancer [6]. Therefore, the expression of the oncogenes B-cell lymphoma 2 (BCL2), c-Myc (MYC), transcription factor E2F1 (E2F1), vascular endothelial growth factor A (VEGFA), and X-linked inhibitor of apoptosis protein (XIAP), which have been shown to be TTP targets in non-liver tissues [23,24], was checked. To confirm the validity of these targets, we analyzed the sequences of their 3’-UTRs and found TTP binding-motifs [25] in abundance (Supplementary Material 1). Interestingly, AREs were also predicted in several yet unknown TTP targets, which had been suggested as tumor promoting genes and were therefore also analyzed in TTP-overexpressing cells. One of them is the long transcript variant of nuclear enriched abundant transcript 1 (NEAT1_v1/v2), NEAT1_v2 (Supplementary Material). Two other ARE containing genes represent RBPs themselves: the insulin-like growth factor 2 mRNA-binding protein 1 (IGF2BP1) and the insulin-like growth factor 2 mRNA-binding protein 3 (IGF2BP3) (Supplementary Material), which both promote hepatic tumor progression [8,26]. In HepG2 and Huh7 cells, all analyzed genes tended to be less expressed after TTP overexpression (Figure 6A). MYC, IGF2BP3, and VEGFA were significantly lowered in TTP-overexpressing HepG2 cells (Figure 6A). In TTP-overexpressing Huh7 cells, IGF2BP1 was the only gene that was significantly decreased (Figure 6A). BCL2, IGF2BP1, NEAT1_v2, and VEGFA were significantly lowered in PLC/PRF/5 cells (Figure 6A). Since VEGFA, a promoter of invasion in HCC [27], was less expressed in HepG2 and PLC/PRF/5 cells, we hypothesized that TTP might play a role in HCC vascular invasion. Therefore, TTP (gene name ZFP36) expression was evaluated in gene expression data from human HCC samples showing vascular invasion compared to samples without vascular invasion. In fact, TTP expression was slightly but significantly decreased in cancer tissues showing vascular invasion (Figure 6B).

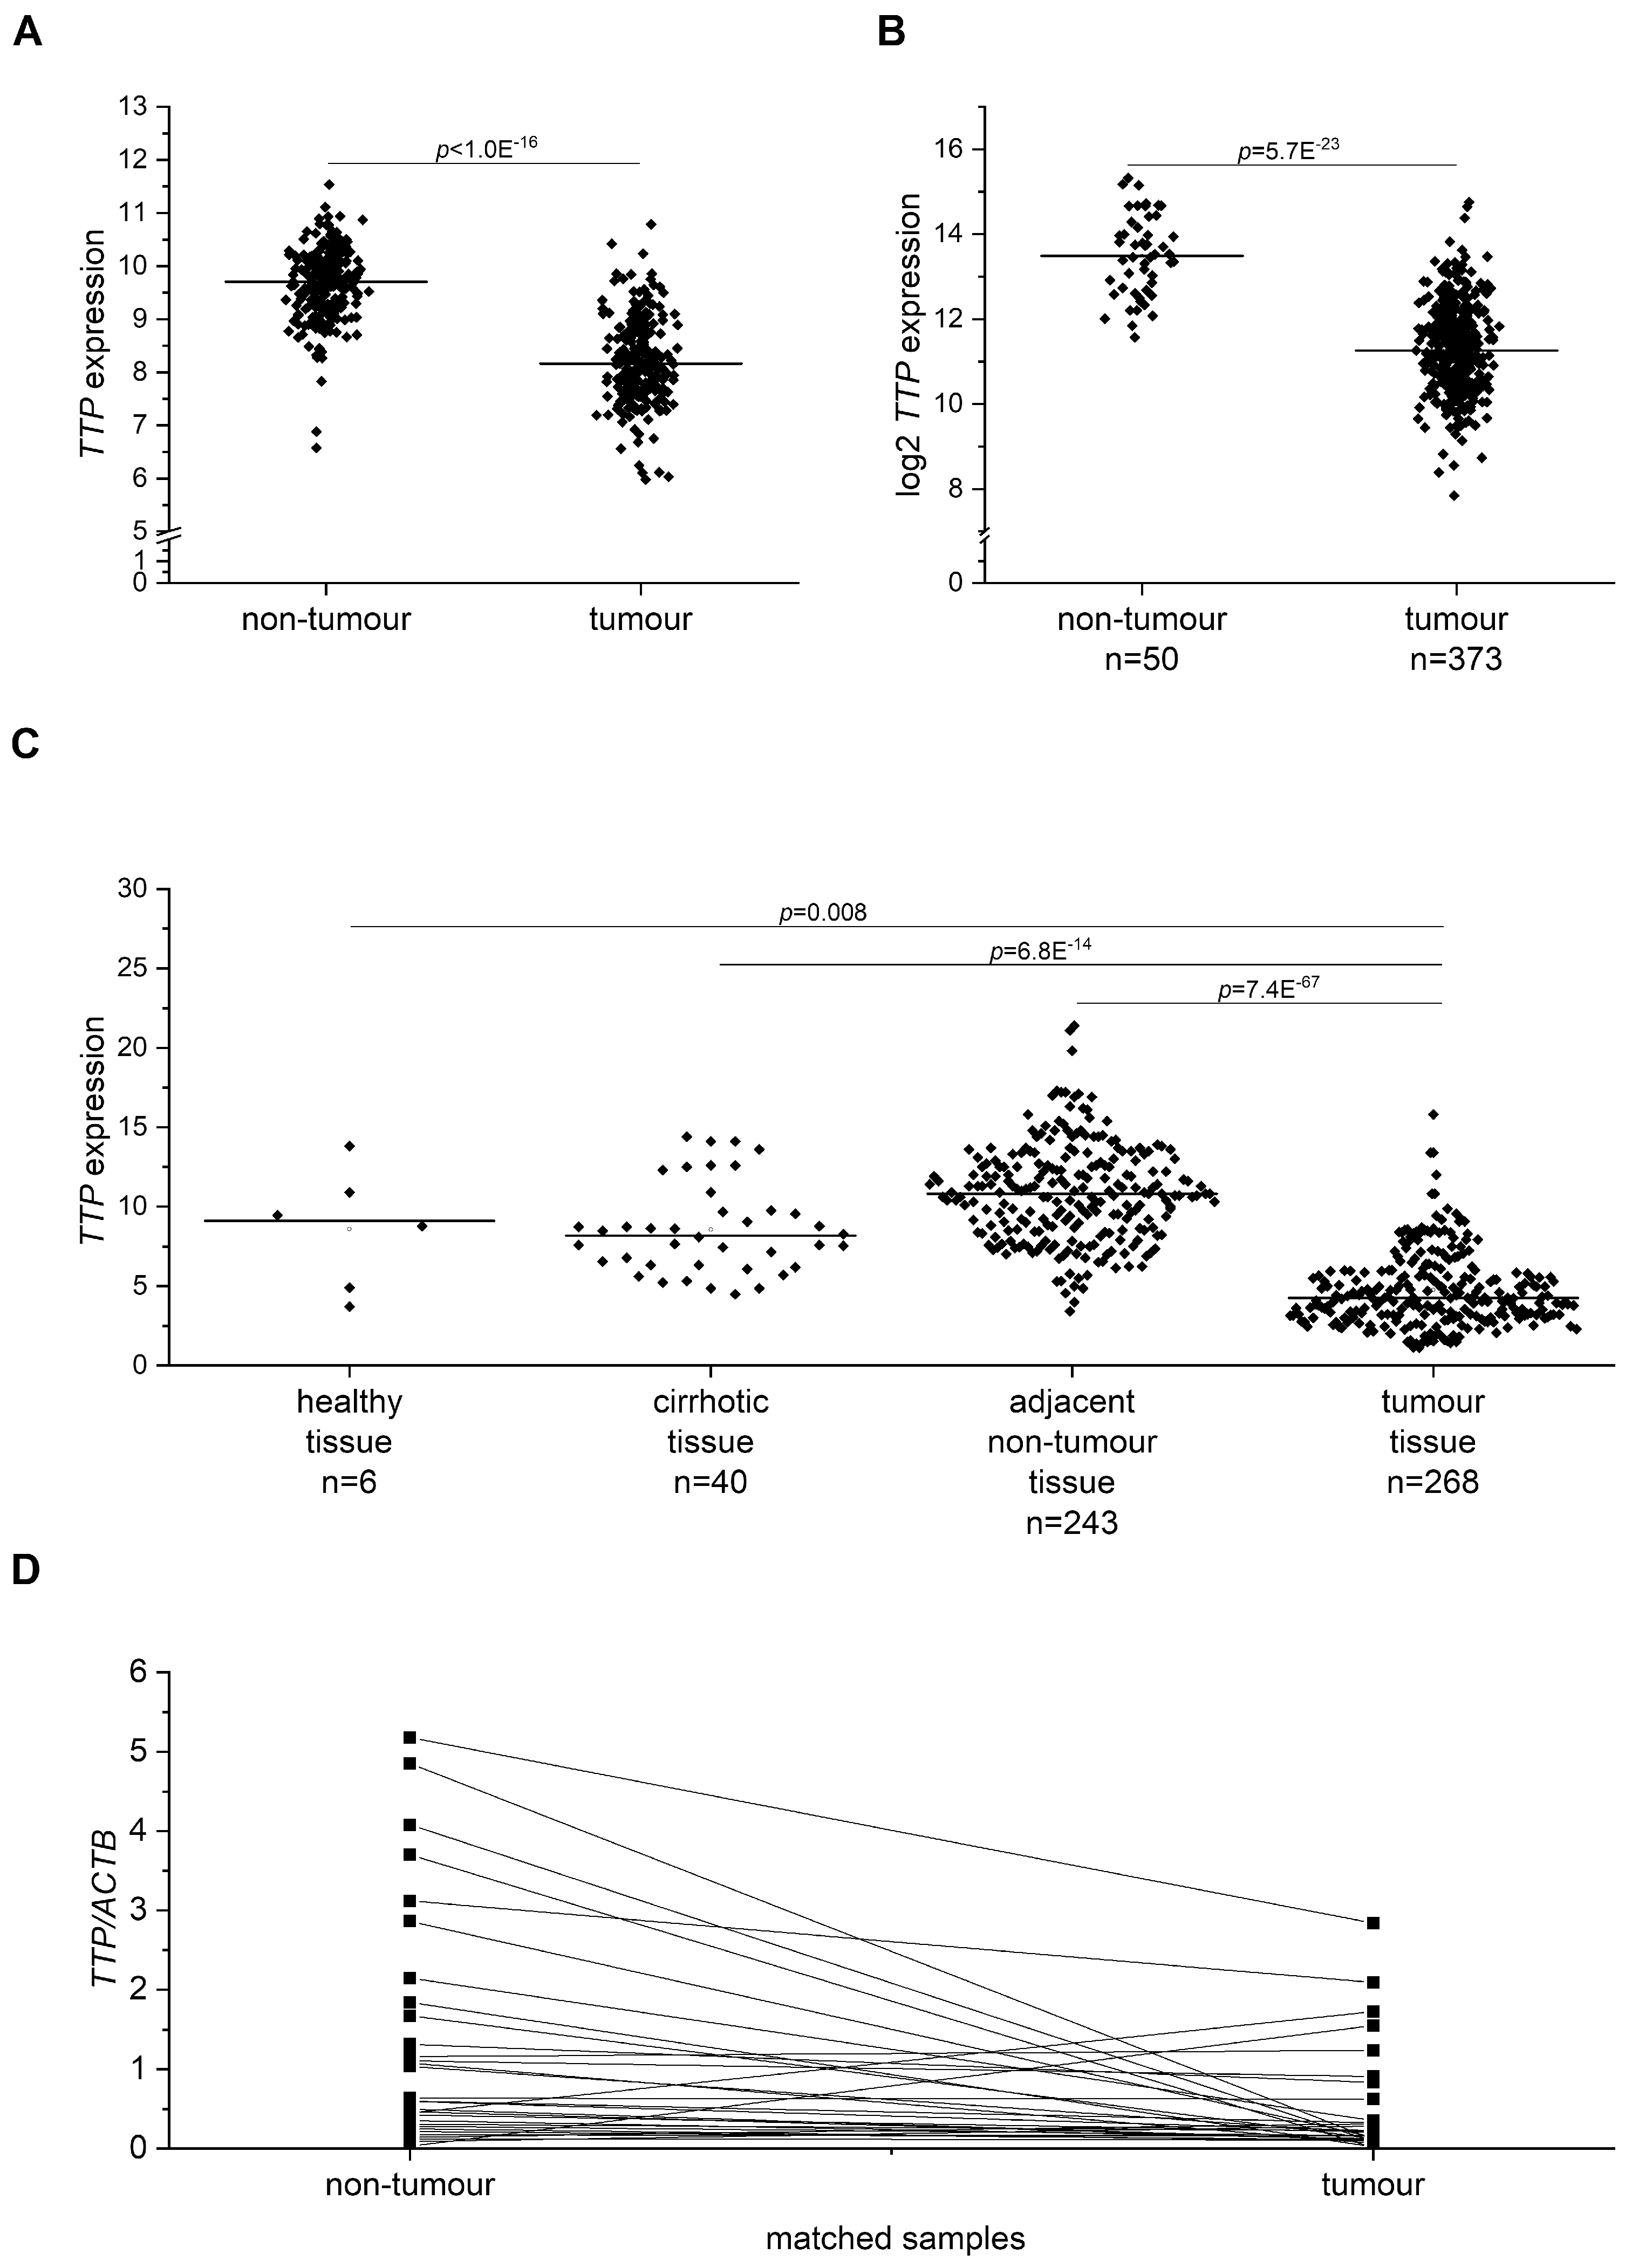
2.5. TTP (gene name ZFP36) Expression in Human HCC Tissue

Since TTP (gene name ZFP36) has been shown to be downregulated in different human cancer types, including HCC [14], an extensive expression analysis of TTP mRNA in publicly available HCC data sets was performed: In a microarray data set comprising almost 250 human hepatitis B virus(HBV)-derived HCC samples, in The Cancer Genome Atlas (TCGA) data comparing 373 HCC with 50 non-tumor liver tissue samples, and in a data set comparing HCC tissue with healthy, cirrhotic, and non-tumor tissue of HCC patients. In all data sets, TTP mRNA levels were significantly lower in HCC than in non-tumor tissue (Figure 7A–C). No differential expression was observed for cirrhotic tissue, but the number of normal liver tissue samples was very low (Figure 7C). qPCR analysis of TTP mRNA expression in a set of human liver tumor samples from mixed etiologies and matched normal samples confirmed downregulation of TTP in tumor tissue (Figure 7D).

3. Discussion

TTP repression has been described in different human cancers [13,14], and a loss of functional TTP can modulate diverse tumorigenic phenotypes [15]. In this study, we were able to confirm a downregulation of TTP (gene name ZFP36) in HCC tissues and tumor suppressor functions of TTP in a set of hallmarks of cancer employing three different hepatoma cell lines [13].
Employing an in vivo hepatocarcinogenesis model, our findings are the first to report a role of TTP in carcinogenesis. Since HCC develops based on chronic inflammation and metabolic alterations, a lower number of tumors in lsTtp-KO animals might be connected to the recently described promotion of metabolic liver disease by TTP [16].
Although total lsTtp-KO mice show a severe inflammatory phenotype [28] and myeloid-specific lsTtp-KO mice are highly susceptible to lipopolysaccharide treatment [29], a hepatocyte-specific knockout of TTP seemed to have a rather inhibitory effect on inflammation as observed in the short-term mouse experiment: the monocyte to macrophage ratio of DEN-treated knockout mice was decreased compared to the DEN-treated wild type mice. This increase in the monocyte to macrophage ratio has been reported before in DEN-treated animals [20].
Although TTP knockdown has been shown to induce monocyte infiltration into three-dimensional tumor spheroids and macrophage infiltration into murine breast cancer xenografts [30], our data rather suggest that hepatocytic TTP promotes tumorigenesis by driving monocyte infiltration and thus tumor-promoting inflammation. This is further strengthened by TTP-dependent alterations in the hepatic fatty acid profile, which might promote tumorigenesis. During hepatocarcinogenesis in obesity-associated chronic liver disease, lipid accumulation can promote inflammation and vice versa [31]. Feeding lsTtp-KO mice a high-fat diet to model steatohepatitis was described to improve insulin resistance [16]. Thus, hepatocytic TTP, which accounts for more than 95% of the hepatic TTP levels ([16] and supplementary Figure S4), seems to rather facilitate metabolic liver disease. For tumor progression, however, lipid alterations in normal adjacent tissue might be less important than elevated lipids in tumor tissue and tumor stroma [32].
In contrast to tumor initiation, our study suggests an inhibitory role of TTP in a set of hallmarks of cancer as characteristics of tumor progression. In fact, other factors promoting lipid deposition and inflammation can be beneficial for cancer progression. One example represents the fatty acid elongase ELOVL6, which contributes to the progression of pre-tumorous conditions, such as steatosis and steatohepatitis [33]. However, it is downregulated in human liver cancer and its downregulation represents a negative clinical predictor [17,34].
So far, downregulation of TTP in HCC has only been shown in one study using a very small patient cohort with n = 24 samples [35]. We herewith were able to confirm the results from the latter study in several large HCC patient cohorts.
It is well known that cell migration is a critical factor for cancer metastasis [36], which can occur already in the early stages of tumor progression [37,38]. TTP has been shown to inhibit the migration ability in prostate cancer, ovarian cancer, gastric cancer, and head and neck squamous cell carcinoma cells [24,39,40,41]. Additionally, TTP was suggested to decrease the metastatic potential in breast cancer [42]. To the best of our knowledge, this study is the first to show a migration- and proliferation-inhibitory effect of TTP in hepatic cells. Others were able to show a TTP-induced decrease of metabolic activity in a methylthiazoletetrazolium assay and adherence in a crystal violet assay [35]. The observed inhibition of proliferation may be the major reason why we failed to establish a stable overexpression of the TTP-containing plasmid in HepG2, Huh7, and PLC/PRF/5 cells.
TTP has been shown to downregulate several well-established markers for tumor progression like BCL2, VEGFA, and MYC in non-liver tissue [24,43,44]. In line with these findings, we observed a decreased expression of MYC, VEGFA, and BCL2 in liver cancer cells overexpressing TTP. The decreased TTP expression in vascularized HCC tissue further supports the hypothesis that TTP might play a role in angiogenesis, which is a hallmark of tumor progression [6].
The different expression levels of the analyzed genes comparing the three cell lines might be explained by the distinct heterogeneity of liver cancer itself [45]. According to this, the three analyzed cell lines also have rather different phenotypes [46,47,48].
Several targets of TTP (e.g., BCL2, VEGFA, and MYC) are associated with a poor chemosensitivity [24]. Chemoresistance is widespread in HCC and characterizes tumor progression [49]. Interestingly, TTP overexpression in PLC/PRF/5 cells decreased the expression of the long transcript variant of the long-non coding RNA NEAT1, NEAT1_v2, which has been reported to enhance chemoresistance in different cancer cell lines, including hepatoma cells [50,51]. NEAT1 is one of the least stable long non-coding RNAs [52], a presumed tumor promoter, and associated with chemoresistance [50,53]. TTP has been described to mediate chemosensitivity to cisplatin in head and neck cancer cells [44]. In line with these findings, TTP improved chemoresistance towards sorafenib, an approved drug for systemic liver cancer therapy, as well as towards doxorubicin, which is widely used in chemoembolization [49,54]. A connection between chemoresistance and TTP has also previously been suggested for breast cancer [55]. However, the main effect could be explained by a reduced viability due to TTP overexpression.

4. Materials and Methods

4.1. Animals

All animal procedures were performed in accordance with the local animal welfare committee (permission no. 37/2014). Male C57BL/6 mice were kept under controlled conditions regarding temperature, humidity, 12 h day/night rhythm, and food access. C57BL/6 Ttpfl/fl mice carrying flox sites flanking exon 2 of TTP were crossed with albumin-Cre transgenic mice in order to generate liver-specific lsTtp-KO mice [16]. Hepatocyte specific lsTtp-KO was confirmed via qPCR (Supplementary Figure S4). TTP expression was almost absent in lsTtp-KO, suggesting that the predominant TTP expression in the liver is found in hepatocytes. For the long-term experiment, which mimics hepatocarcinogenesis [56,57], wild type and two-week-old male lsTtp-KO mice were intraperitoneally injected with either a 5 mg/kg body weight diethylnitrosamine (DEN) solution or a 0.9% NaCl solution as a sham-control to determine the effects of TTP on hepatic tumor initiation. 22 weeks after the injection, the mice were sacrificed. For the short-term experiment mimicking acute hepatic inflammation, wild type and nine-week-old male lsTtp-KO mice were intraperitoneally injected with either a 100 mg/kg body weight DEN solution or with a 0.9% NaCl solution as a sham-control [9,18,19]. 48 h after the injection, the mice were sacrificed.

4.2. Histology

For histological analysis, paraffin-embedded liver tissue specimens were cut into 5 µm sections and stained with hematoxylin and eosin (HE) [9,56,58]. Based on histological analysis, macroscopic tumors were confirmed as tumors.

4.3. Determination of Hepatic Fatty Acid Profile in Mice

The fatty acid profile was measured by gas chromatography-mass spectrometry (GC-MS) as previously described [18,59,60,61]. In short, snap-frozen liver tissue samples were pestled in liquid nitrogen and freeze-dried overnight. Aliquots of two to five milligrams of tissue dry weight were hydrolyzed using the fatty acid methyl ester method (FAME) according to Bode et. al. [62]. GC-MS was carried out on an Agilent 6890N gas chromatograph (Agilent Technologies, Waldbronn, Germany) equipped with a 7683B split/splitless injector with autosampler (Agilent Technologies) and coupled to a 5973 electron impact mass selective detector (Agilent Technologies) as previously described [18]. Absolute amounts of FAs were quantified by integration of the peaks in relation to the integral of methyl-nonadecanoate (74208, Merck, Taufkirchen, Germany) as an internal standard and to liver tissue dry weight.

4.4. Cell Culture

HepG2, PLC/PRF/5, and Huh7 cells were cultured in RPMI-1640 medium with 10% fetal calf serum, 1% penicillin/streptomycin, and 1% glutamine (Sigma–Aldrich, Taufkirchen, Germany) at 37 °C and 5% CO2.

4.5. Transient TTP Overexpression

For overexpression experiments, a vector (pZeoSV2(–)) containing the human TTP coding sequence tagged with the human influenza hemagglutinin tag or the vector with the antisense sequence as a control (Ref. No.: V855-01, Invitrogen, Carlsbad, California, USA) was used [63]. The vectors were kindly provided by Prof. Dr. Hartmut Kleinert [64], and the sequence was verified by sequencing. Transient TTP overexpression in hepatoma cells was established by transfection with the vector using jetPEITM Hepatocyte reagent (102-05N, Polyplus transfection, Illkirch, France) as recommended by the manufacturer. Successful TTP overexpression was confirmed via Western Blot for each experiment.

4.6. Cytotoxicity Assay (MTT Assay)

Hepatoma cells were seeded into 96-well plates, transfected with TTP or a control vector, and treated with different concentrations of doxorubicin (Sigma–Aldrich) or sorafenib (Biomol GmbH, Hamburg, Germany) and the respective solvent control. 24 h after the treatment, the cytostatic substances were removed and 5 mg/mL MTT (3-[4,5-dimethylthiazol-2-yl]-2,5- diphenyltetrazolium bromide; thiazolyl blue) (Sigma–Aldrich, Taufkirchen, Germany) in medium were added. After 2 h incubation, the formazan crystals were solved in dimethyl sulfoxide, and the absorbance was measured at 550 nm with 690 nm as reference wavelength in a microplate reader (Tecan Sunrise™, Tecan Group Ltd., Männedorf, Switzerland).

4.7. Scratch Assay

Cells were seeded into 12-well plates, transfected with TTP or a control vector, and scratched 48 h after transfection with a pipet tip. The first image was taken immediately after the scratch; the second image was taken 24 h after the scratch using a 5× objective. Images were obtained and analyzed with an Axio Observer Z1 epifluorescence microscope equipped with an AxioCam Mrm (Zeiss, Oberkochen, Germany) using a 5× objective. Data were analyzed with the TScratch software (CSElab, Zürich, Switzerland).

4.8. Human HCC

Paraffin-embedded liver samples (n = 31) from randomly selected pseudonymized HCC patients who underwent liver resection at the Saarland University Medical Center between 2005 and 2010 were obtained as described previously [65]. The study protocol was approved by the local Ethics Committee (47/07). Samples had a mixed etiology, including non-alcoholic steatohepatitis (NASH), alcoholic liver disease, viral hepatitis, hemochromatosis, porphyria, and cryptogenic cirrhosis [65].
For differential ZFP36 expression between tumor (n =247) and non-tumor (n = 239) samples, the log2 of an RMA-normalized data set (GSE14520 [66]) of an AffymetrixGeneChip HG-U133A 2.0 was analyzed. Similarly, differential gene expression was analyzed in data set GSE25097 [67] between healthy (n = 6), cirrhotic (n = 40), adjacent non-tumor (n = 243), and tumor tissue (n = 268), and in data set GSE20238 [68] between vascular invasive (n = 45) and non-invasive (n = 34) HCC samples. Differential expression analysis was based on the Kolmogorov–Smirnov test. Pearson correlation was applied to detect correlations between genes of interest.
RNAseq expression data from The Cancer Genome Atlas (TCGA) pan cancer dataset, comparing ZFP36 expression in tumor and non-tumor liver tissue, was produced via Toil [69]. RSEM [70] reported transcripts per million values were downloaded via the UCSC Xena Browser (https://xenabrowser.net) and comprised 373 primary solid tumor as well as 50 matched non-tumor tissue samples.

4.9. qPCR

RNA isolation and reverse transcription were performed as previously described [71]. All samples were estimated in triplicate. Primers and conditions are listed in Supplementary Table S1. The absolute gene expression was normalized to ACTB (actin beta, for human samples) or Ppia/Cyclophilin (peptidylprolyl isomerase A, for murine samples) mRNA values. Stability of the housekeeping genes was tested according to geNorm [72] and NormFinder [73].

4.10. Flow Cytometry

Flow cytometric analysis of murine liver leukocyte composition was performed as described previously [20,74]. To determine the amount of leukocytes, 1 µg of the FITC (fluorescein isothiocyanate) mouse anti-mouse CD45.2 Clone 104 antibody (#561874, BD Biosciences, Heidelberg, Germany) in 100 µL was used. To detect the composition of leukocytes, 0.5 µg of each antibody were added: APC rat anti-mouse Ly6G Clone 1A8 (#560599), APC-R700 rat anti-mouse CD11b Clone M1/70 (#564985), BV421 rat anti-mouse Ly6C Clone AL-21 (#562727), BV510 mouse anti-mouse NK 1.1 Clone PK136 (#563096), PE hamster anti-mouse CD11c Clone HL3 (#55740, all from BD Biosciences), and FITC human anti-mouse F4/80 clone REA126 (#130-102-327 from Miltenyi, Bergisch Gladbach, Germany). To determine the composition of the leukocytes, the following gating strategy was applied: FSClow debris and erythrocytes, and multiplets with a non-linear SSC-A/SSC-H ratio were excluded. Viability was determined by 7-AAD staining. Viable cells (7-AAD) were analyzed for CD11b and Cd11c expression. Myeloid dendritic cells were defined as CD11b+ CD11chi cells, and neutrophils were identified as Ly6G+ cells within the CD11b+ CD11c population. CD11b+ CD11c Ly6G NK1.1 cells were further divided into subpopulations according to their Ly6C and F4/80 expression, i.e. macrophages (Ly6Clo F4/80hi) and monocytes (Ly6Chi F4/80lo), following Blériot et. al. and Ramachandran et al. [75,76]. All gates were defined by using fluorescence minus one (FMO) controls. Flow cytometric analysis of human hepatoma cell proliferation was performed as described previously [56] using the PE (phycoerythrin) Mouse Anti-Human Ki-67 Set (#5113743, BD Biosciences). Graphical illustrations were performed with FACSuite.

4.11. Statistical Analysis

Data analysis and statistics of experimental data were performed using the Origin software (OriginPro 8.6G, 2018b, and 2019; OriginLabs, Northampton, MA, USA). All data are displayed either as columns with mean values ± SD or as individual values and boxplots (± interquartile) range with mean (square) and median (line). Normality was tested with the Shapiro–Wilk algorithm. Grubbs test was performed to identify possible outliers. Depending on normality, one-way ANOVA followed by Bonferroni post-hoc test or Kruskal–Wallis–ANOVA followed by Mann–Whitney test was performed. Two-way ANOVA followed by Scheffe post-hoc test was performed on data belonging to four different comparison groups (Figure 1, Figure 2 and Figure 3 and supplementary Figures S1, S2 and S4). Fisher’s-exact test was used for categorical data. Differences were considered statistically significant with p ≤ 0.05.

5. Conclusions

In conclusion, our data suggest that hepatocytic TTP plays an inflammation- and lipid-dependent role in promoting hepatic tumor initiation. In liver cancer progression, TTP exerts a major inhibitory effect. The potential limit of translatability of rodent models in HCC research due to differences in anatomy, physiology, and mechanisms of carcinogenesis [76] has to be addressed in future studies.

Supplementary Materials

The following are available online at https://www.mdpi.com/2072-6694/11/11/1754/s1, Figure S1: Hepatic fatty acids (FAs) in short-term sham- (control) or DEN-treated WT and lsTtp-KO mice, Figure S2: Hepatic fatty acids (FAs) in long-term sham- (control) or DEN-treated WT and lsTtp-KO mice, Figure S3: Effects of TTP overexpression on chemoresistance in hepatoma cells (normalised to control vector), Figure S4: Zfp36 mRNA levels in lsTtp-KO and WT animals, Table S1: Primer sequences of human and murine genes, Other Supplementary Material: ARE in TTP target genes, Supplementary Material 1: ARE in TTP target genes.

Author Contributions

Conceptualization, A.K.K.; data curation, S.M.K., K.H., T.K., A.B., and M.L.; formal analysis, A.K.K., S.M.K., K.H., T.K., A.B., S.L., K.G., J.H. (Jessica Hoppstädter), M.L., and J.H. (Johannes Haybaeck); investigation, S.M.K., K.H., T.K., S.L., and J.H. (Jessica Hoppstädter); methodology, S.M.K., K.H., T.K., S.P., K.G., J.H. (Jessica Hoppstädter), R.M., V.H., M.H.S., and J.H. (Johannes Haybaeck); project administration, A.K.K.; resources, S.P. and P.J.B.; software, A.B. and M.L.; supervision, R.M., V.H., M.H.S., J.H. (Johannes Haybaeck), P.J.B., and A.K.K.; validation, S.M.K., K.H., and T.K.; visualization, S.M.K., K.H., T.K., A.B., M.L., and J.H. (Jessica Hoppstädter); writing—original draft, S.M.K., K.H., and A.K.K.; writing—review and editing, T.K., A.B., S.P., S.L., K.G., J.H. (Jessica Hoppstädter), M.L., R.M., V.H., M.H.S., J.H. (Johannes Haybaeck), and P.J.B.

Funding

This research received no external funding.

Acknowledgments

This work was supported by Hilmer Stiftung—part of Deutsches Stiftungszentrum (to K.H.). This work was supported, in part, by the Deutsche Forschungsgemeinschaft (DFG, to A.K.K., KI702). We acknowledge support by the Deutsche Forschungsgemeinschaft (DFG, German Research Foundation) and Saarland University within the funding program Open Access Publishing (#413932926). We thank Verena Körting for providing the illustrations for the graphical abstract.

Conflicts of Interest

The authors declare no conflict of interest. The funders had no role in the design of the study; in the collection, analyses, or interpretation of data; in the writing of the manuscript, or in the decision to publish the results.

References

  1. Bruix, J.; Han, K.H.; Gores, G.; Llovet, J.M.; Mazzaferro, V. Liver cancer: Approaching a personalized care. J. Hepatol. 2015, 62, S144–S156. [Google Scholar] [CrossRef] [PubMed] [Green Version]
  2. Tang, A.; Hallouch, O.; Chernyak, V.; Kamaya, A.; Sirlin, C.B. Epidemiology of hepatocellular carcinoma: Target population for surveillance and diagnosis. Abdom. Radiol. (NY) 2017, 43, 13–25. [Google Scholar] [CrossRef] [PubMed]
  3. Farazi, P.A.; DePinho, R.A. Hepatocellular carcinoma pathogenesis: From genes to environment. Nat. Rev. Cancer 2006, 6, 674–687. [Google Scholar] [CrossRef] [PubMed]
  4. El-Serag, H.B. Surveillance for hepatocellular carcinoma: Long way to achieve effectiveness. Dig. Dis. Sci. 2012, 57, 3050–3051. [Google Scholar] [CrossRef]
  5. Reeves, H.L.; Zaki, M.Y.; Day, C.P. Hepatocellular carcinoma in obesity, type 2 diabetes, and NAFLD. Dig. Dis. Sci. 2016, 61, 1234–1245. [Google Scholar] [CrossRef]
  6. Hanahan, D.; Weinberg, R.A. Hallmarks of cancer: The next generation. Cell 2011, 144, 646. [Google Scholar] [CrossRef]
  7. Dang, H.; Takai, A.; Forgues, M.; Pomyen, Y.; Mou, H.; Xue, W.; Ray, D.; Ha, K.C.H.; Morris, Q.D.; Hughes, T.R.; et al. Oncogenic activation of the RNA binding protein NELFE and MYC signaling in hepatocellular carcinoma. Cancer Cell 2017, 32, 101–114.e8. [Google Scholar] [CrossRef]
  8. Gutschner, T.; Hammerle, M.; Pazaitis, N.; Bley, N.; Fiskin, E.; Uckelmann, H.; Heim, A.; Grobeta, M.; Hofmann, N.; Geffers, R.; et al. Insulin-like growth factor 2 mRNA-binding protein 1 (IGF2BP1) is an important protumorigenic factor in hepatocellular carcinoma. Hepatology 2014, 59, 1900–1911. [Google Scholar] [CrossRef]
  9. Kessler, S.M.; Laggai, S.; Barghash, A.; Schultheiss, C.S.; Lederer, E.; Artl, M.; Helms, V.; Haybaeck, J.; Kiemer, A.K. Imp2/p62 induces genomic instability and an aggressive hepatocellular carcinoma phenotype. Cell Death Dis. 2015, 6, e1894. [Google Scholar] [CrossRef]
  10. Li, T.; Li, S.; Chen, D.; Chen, B.; Yu, T.; Zhao, F.; Wang, Q.; Yao, M.; Huang, S.; Chen, Z.; et al. Transcriptomic analyses of RNA-binding proteins reveal eif3c promotes cell proliferation in hepatocellular carcinoma. Cancer Sci. 2017, 108, 877–885. [Google Scholar] [CrossRef]
  11. Guhaniyogi, J.; Brewer, G. Regulation of mRNA stability in mammalian cells. Gene 2001, 265, 11–23. [Google Scholar] [CrossRef] [Green Version]
  12. Blackshear, P.J. Tristetraprolin and other CCCH tandem zinc-finger proteins in the regulation of mRNA turnover. Biochem. Soc. Trans. 2002, 30, 945–952. [Google Scholar] [CrossRef] [PubMed]
  13. Hitti, E.; Bakheet, T.; Al-Souhibani, N.; Moghrabi, W.; Al-Yahya, S.; Al-Ghamdi, M.; Al-Saif, M.; Shoukri, M.M.; Lanczky, A.; Grepin, R.; et al. Systematic analysis of AU-rich element expression in cancer reveals common functional clusters regulated by key RNA-binding proteins. Cancer Res. 2016, 76, 4068–4080. [Google Scholar] [CrossRef] [PubMed]
  14. Sanduja, S.; Blanco, F.F.; Young, L.E.; Kaza, V.; Dixon, D.A. The role of tristetraprolin in cancer and inflammation. Front. Biosci. (Landmark Ed.) 2012, 17, 174–188. [Google Scholar] [CrossRef] [PubMed]
  15. Brennan, S.E.; Kuwano, Y.; Alkharouf, N.; Blackshear, P.J.; Gorospe, M.; Wilson, G.M. The mRNA-destabilizing protein tristetraprolin is suppressed in many cancers, altering tumorigenic phenotypes and patient prognosis. Cancer Res. 2009, 69, 5168–5176. [Google Scholar] [CrossRef] [PubMed]
  16. Sawicki, K.T.; Chang, H.-C.; Shapiro, J.S.; Bayeva, M.; De Jesus, A.; Finck, B.N.; Wertheim, J.A.; Blackshear, P.J.; Ardehali, H. Hepatic tristetraprolin promotes insulin resistance through RNA destabilization of FGF21. JCI Insight 2018, 3, e95948. [Google Scholar] [CrossRef] [PubMed]
  17. Kessler, S.M.; Laggai, S.; Barghash, A.; Helms, V.; Kiemer, A.K. Lipid metabolism signatures in nash-associated hcc-letter. Cancer Res. 2014, 74, 2903. [Google Scholar] [CrossRef]
  18. Kessler, S.M.; Simon, Y.; Gemperlein, K.; Gianmoena, K.; Cadenas, C.; Zimmer, V.; Pokorny, J.; Barghash, A.; Helms, V.; van Rooijen, N.; et al. Fatty acid elongation in non-alcoholic steatohepatitis and hepatocellular carcinoma. Int. J. Mol. Sci. 2014, 15, 5762–5773. [Google Scholar] [CrossRef]
  19. Naugler, W.E.; Sakurai, T.; Kim, S.; Maeda, S.; Kim, K.; Elsharkawy, A.M.; Karin, M. Gender disparity in liver cancer due to sex differences in MyD88-dependent Il-6 production. Science 2007, 317, 121–124. [Google Scholar] [CrossRef]
  20. Kessler, S.M.; Hoppstädter, J.; Hosseini, K.; Laggai, S.; Haybaeck, J.; Kiemer, A.K. Lack of kupffer cell depletion in diethylnitrosamine-induced hepatic inflammation. J. Hepatol. 2019, 70, 813–815. [Google Scholar] [CrossRef]
  21. Dembek, A.; Laggai, S.; Kessler, S.M.; Czepukojc, B.; Simon, Y.; Kiemer, A.K.; Hoppstädter, J. Hepatic interleukin-6 production is maintained during endotoxin tolerance and facilitates lipid accumulation. Immunobiology 2017, 222, 786–796. [Google Scholar] [CrossRef] [PubMed]
  22. Horie, Y.; Suzuki, A.; Kataoka, E.; Sasaki, T.; Hamada, K.; Sasaki, J.; Mizuno, K.; Hasegawa, G.; Kishimoto, H.; Iizuka, M.; et al. Hepatocyte-specific Pten deficiency results in steatohepatitis and hepatocellular carcinomas. J. Clin. Investig. 2004, 113, 1774. [Google Scholar] [CrossRef] [PubMed]
  23. Selmi, T.; Alecci, C.; dell’ Aquila, M.; Montorsi, L.; Martello, A.; Guizzetti, F.; Volpi, N.; Parenti, S.; Ferrari, S.; Salomoni, P.; et al. Zfp36 stabilizes RIP1 via degradation of XIAP and cIAP2 thereby promoting ripoptosome assembly. BMC Cancer 2015, 15, 357. [Google Scholar] [CrossRef] [PubMed]
  24. Wang, H.; Ding, N.; Guo, J.; Xia, J.; Ruan, Y. Dysregulation of TTP and HuR plays an important role in cancers. Tumour Biol. 2016, 37, 14451–14461. [Google Scholar] [CrossRef]
  25. Mukherjee, N.; Jacobs, N.C.; Hafner, M.; Kennington, E.A.; Nusbaum, J.D.; Tuschl, T.; Blackshear, P.J.; Ohler, U. Global target mRNA specification and regulation by the RNA-binding protein ZFP36. Genome Biol. 2014, 15, R12. [Google Scholar] [CrossRef]
  26. Jeng, Y.M.; Chang, C.C.; Hu, F.C.; Chou, H.Y.; Kao, H.L.; Wang, T.H.; Hsu, H.C. RNA-binding protein insulin-like growth factor II mRNA-binding protein 3 expression promotes tumor invasion and predicts early recurrence and poor prognosis in hepatocellular carcinoma. Hepatology 2008, 48, 1118. [Google Scholar] [CrossRef]
  27. Li, X.M.; Tang, Z.Y.; Zhou, G.; Lui, Y.K.; Ye, S.L. Significance of vascular endothelial growth factor mRNA expression in invasion and metastasis of hepatocellular carcinoma. J. Exp. Clin. Cancer Res. 1998, 17, 13–17. [Google Scholar]
  28. Carballo, E.; Lai, W.S.; Blackshear, P.J. Feedback inhibition of macrophage tumor necrosis factor-alpha production by tristetraprolin. Science 1998, 281, 1001–1005. [Google Scholar] [CrossRef]
  29. Qiu, L.-Q.; Stumpo, D.J.; Blackshear, P.J. Myeloid-specific tristetraprolin deficiency in mice results in extreme lipopolysaccharide sensitivity in an otherwise minimal phenotype. J. Immunol. 2012, 188, 5150–5159. [Google Scholar] [CrossRef]
  30. Milke, L.; Schulz, K.; Weigert, A.; Sha, W.; Schmid, T.; Brüne, B. Depletion of tristetraprolin in breast cancer cells increases interleukin-16 expression and promotes tumor infiltration with monocytes/macrophages. Carcinogenesis 2013, 34, 850–857. [Google Scholar] [CrossRef]
  31. Karagozian, R.; Derdák, Z.; Baffy, G. Obesity-associated mechanisms of hepatocarcinogenesis. Metabolism 2014, 63, 607–617. [Google Scholar] [CrossRef] [PubMed]
  32. Beloribi-Djefaflia, S.; Vasseur, S.; Guillaumond, F. Lipid metabolic reprogramming in cancer cells. Oncogenesis 2016, 5, e189. [Google Scholar] [CrossRef] [PubMed]
  33. Matsuzaka, T.; Atsumi, A.; Matsumori, R.; Nie, T.; Shinozaki, H.; Suzuki-Kemuriyama, N.; Kuba, M.; Nakagawa, Y.; Ishii, K.; Shimada, M.; et al. Elovl6 promotes nonalcoholic steatohepatitis. Hepatology 2012, 56, 2199. [Google Scholar] [CrossRef] [PubMed]
  34. Li, Y.; Pang, Y.; Xiang, X.; Du, J.; Mai, K.; Ai, Q. Molecular cloning, characterization, and nutritional regulation of Elovl6 in large yellow croaker (Larimichthys crocea). Int. J. Mol. Sci. 2019, 20, 1801. [Google Scholar] [CrossRef] [PubMed]
  35. Sohn, B.H.; Park, I.Y.; Lee, J.J.; Yang, S.J.; Jang, Y.J.; Park, K.C.; Kim, D.J.; Lee, D.C.; Sohn, H.A.; Kim, T.W.; et al. Functional switching of TGF-β1 signaling in liver cancer via epigenetic modulation of a single CpG site in TTP promoter. Gastroenterology 2010, 138, 1898–1908.e1812. [Google Scholar] [CrossRef] [PubMed]
  36. Vicente-Manzanares, M.; Horwitz, A.R. Cell migration: An overview. Methods Mol. Biol. 2011, 769, 1–24. [Google Scholar] [CrossRef]
  37. Balic, M.; Lin, H.; Young, L.; Hawes, D.; Giuliano, A.; McNamara, G.; Datar, R.H.; Cote, R.J. Most early disseminated cancer cells detected in bone marrow of breast cancer patients have a putative breast cancer stem cell phenotype. Clin. Cancer Res. 2006, 12, 5615–5621. [Google Scholar] [CrossRef]
  38. Li, F.; Tiede, B.; Massague, J.; Kang, Y. Beyond tumorigenesis: Cancer stem cells in metastasis. Cell Res. 2007, 17, 3–14. [Google Scholar] [CrossRef]
  39. Lee, H.H.; Lee, S.R.; Leem, S.H. Tristetraprolin regulates prostate cancer cell growth through suppression of e2f1. J. Microbiol. Biotechnol. 2014, 24, 287–294. [Google Scholar] [CrossRef]
  40. Van Tubergen, E.; Vander Broek, R.; Lee, J.; Wolf, G.; Carey, T.; Bradford, C.; Prince, M.; Kirkwood, K.L.; D’Silva, N.J. Tristetraprolin regulates interleukin-6, which is correlated with tumor progression in patients with head and neck squamous cell carcinoma. Cancer 2011, 117, 2677–2689. [Google Scholar] [CrossRef]
  41. Yoon, N.A.; Jo, H.G.; Lee, U.H.; Park, J.H.; Yoon, J.E.; Ryu, J.; Kang, S.S.; Min, Y.J.; Ju, S.A.; Seo, E.H.; et al. Tristetraprolin suppresses the EMT through the down-regulation of Twist1 and Snail1 in cancer cells. Oncotarget 2016, 7, 8931–8943. [Google Scholar] [CrossRef] [PubMed]
  42. Al-Souhibani, N.; Al-Ahmadi, W.; Hesketh, J.E.; Blackshear, P.J.; Khabar, K.S. The RNA-binding zinc-finger protein tristetraprolin regulates au-rich mRNAs involved in breast cancer-related processes. Oncogene 2010, 29, 4205–4215. [Google Scholar] [CrossRef] [PubMed]
  43. Lee, H.H.; Son, Y.J.; Lee, W.H.; Park, Y.W.; Chae, S.W.; Cho, W.J.; Kim, Y.M.; Choi, H.-J.; Choi, D.H.; Jung, S.W.; et al. Tristetraprolin regulates expression of VEGF and tumorigenesis in human colon cancer. Int. J. Cancer 2010, 126, 1817–1827. [Google Scholar] [CrossRef] [PubMed]
  44. Park, S.B.; Lee, J.H.; Jeong, W.W.; Kim, Y.H.; Cha, H.J.; Joe, Y.; Chung, H.T.; Cho, W.J.; Do, J.W.; Lee, B.J.; et al. Ttp mediates cisplatin-induced apoptosis of head and neck cancer cells by down-regulating the expression of Bcl-2. J. Chemother. 2015, 27, 174–180. [Google Scholar] [CrossRef] [PubMed]
  45. Li, L.; Wang, H. Heterogeneity of liver cancer and personalized therapy. Cancer Lett. 2016, 379, 191–197. [Google Scholar] [CrossRef] [PubMed]
  46. Ghasemi, R.; Ghaffari, S.H.; Momeny, M.; Pirouzpanah, S.; Yousefi, M.; Malehmir, M.; Alimoghaddam, K.; Ghavamzadeh, A. Multitargeting and antimetastatic potentials of silibinin in human HepG-2 and PLC/PRF/5 hepatoma cells. Nutr. Cancer 2013, 65, 590–599. [Google Scholar] [CrossRef] [PubMed]
  47. Hsu, I.C.; Tokiwa, T.; Bennett, W.; Metcalf, R.A.; Welsh, J.A.; Sun, T.; Harris, C.C. p53 gene mutation and integrated hepatitis b viral DNA sequences in human liver cancer cell lines. Carcinogenesis 1993, 14, 987–992. [Google Scholar] [CrossRef]
  48. Kanno, S.; Kurauchi, K.; Tomizawa, A.; Yomogida, S.; Ishikawa, M. Pifithrin-alpha has a p53-independent cytoprotective effect on docosahexaenoic acid-induced cytotoxicity in human hepatocellular carcinoma HepG2 cells. Toxicol. Lett. 2015, 232, 393–402. [Google Scholar] [CrossRef] [Green Version]
  49. Worns, M.A.; Weinmann, A.; Schuchmann, M.; Galle, P.R. Systemic therapies in hepatocellular carcinoma. Dig. Dis. 2009, 27, 175–188. [Google Scholar] [CrossRef]
  50. Adriaens, C.; Standaert, L.; Barra, J.; Latil, M.; Verfaillie, A.; Kalev, P.; Boeckx, B.; Wijnhoven, P.W.G.; Radaelli, E.; Vermi, W.; et al. p53 induces formation of NEAT1 lncRNA-containing paraspeckles that modulate replication stress response and chemosensitivity. Nat. Med. 2016, 22, 861–868. [Google Scholar] [CrossRef]
  51. Kessler, S.M.; Hosseini, K.; Hussein, U.K.; Kim, K.M.; List, M.; Schultheiß, C.S.; Schulz, M.H.; Laggai, S.; Jang, K.Y.; Kiemer, A.K. Hepatocellular carcinoma and nuclear paraspeckles: Induction in chemoresistance and prediction for poor survival. Cell. Physiol. Biochem. 2019, 52, 787–801. [Google Scholar] [CrossRef] [PubMed]
  52. Clark, M.B.; Johnston, R.L.; Inostroza-Ponta, M.; Fox, A.H.; Fortini, E.; Moscato, P.; Dinger, M.E.; Mattick, J.S. Genome-wide analysis of long noncoding RNA stability. Genome Res. 2012, 22, 885–898. [Google Scholar] [CrossRef] [PubMed] [Green Version]
  53. Guo, S.; Chen, W.; Luo, Y.; Ren, F.; Zhong, T.; Rong, M.; Dang, Y.; Feng, Z.; Chen, G. Clinical implication of long non-coding RNA NEAT1 expression in hepatocellular carcinoma patients. Int. J. Clin. Exp. Pathol. 2015, 8, 5395–5402. [Google Scholar] [PubMed]
  54. Dhanasekaran, R.; Kooby, D.A.; Staley, C.A.; Kauh, J.S.; Khanna, V.; Kim, H.S. Comparison of conventional transarterial chemoembolization (TACE) and chemoembolization with doxorubicin drug eluting beads (DEB) for unresectable hepatocelluar carcinoma (HCC). J. Surg. Oncol. 2010, 101, 476–480. [Google Scholar] [CrossRef]
  55. Lee, J.Y.; Kim, H.J.; Yoon, N.A.; Lee, W.H.; Min, Y.J.; Ko, B.K.; Lee, B.J.; Lee, A.; Cha, H.J.; Cho, W.J.; et al. Tumor suppressor p53 plays a key role in induction of both tristetraprolin and let-7 in human cancer cells. Nucleic Acids Res. 2013, 41, 5614–5625. [Google Scholar] [CrossRef] [Green Version]
  56. Schultheiss, C.S.; Laggai, S.; Hussein, U.K.; Golob-Schwarzl, N.; Czepukojc, B.; Tierling, S.; List, M.; Schulz, M.; Barghash, A.; Zimmer, V.; et al. The long non-coding RNA H19 suppresses carcinogenesis and chemoresistance in hepatocellular carcinoma. Cell Stress 2017, 1, 37–54. [Google Scholar] [CrossRef] [Green Version]
  57. Vesselinovitch, S.D. Perinatal mouse liver carcinogenesis as a sensitive carcinogenesis model and the role of the sex hormonal environment in tumor development. Prog. Clin. Biol. Res. 1990, 331, 53–68. [Google Scholar]
  58. Tybl, E.; Shi, F.-D.; Kessler, S.M.; Tierling, S.; Walter, J.; Bohle, R.M.; Wieland, S.; Zhang, J.; Tan, E.M.; Kiemer, A.K. Overexpression of the IGF2-mRNA binding protein p62 in transgenic mice induces a steatotic phenotype. J. Hepatol. 2011, 54, 994–1001. [Google Scholar] [CrossRef] [Green Version]
  59. Fengler, V.H.I.; Macheiner, T.; Kessler, S.M.; Czepukojc, B.; Gemperlein, K.; Müller, R.; Kiemer, A.K.; Magnes, C.; Haybaeck, J.; Lackner, C.; et al. Susceptibility of different mouse wild type strains to develop diet-induced NAFLD/AFLD-associated liver disease. PLoS ONE 2016, 11, e0155163. [Google Scholar] [CrossRef]
  60. Laggai, S.; Kessler, S.M.; Boettcher, S.; Lebrun, V.; Gemperlein, K.; Lederer, E.; Leclercq, I.A.; Mueller, R.; Hartmann, R.W.; Haybaeck, J.; et al. The IGF2 mRNA binding protein p62/IGF2BP2-2 induces fatty acid elongation as a critical feature of steatosis. J. Lipid Res. 2014, 55, 1087–1097. [Google Scholar] [CrossRef] [Green Version]
  61. Simon, Y.; Kessler, S.M.; Gemperlein, K.; Bohle, R.M.; Müller, R.; Haybaeck, J.; Kiemer, A.K. Elevated free cholesterol as a hallmark of non-alcoholic steatohepatitis in p62/insulin-like growth factor 2 mRNA binding protein 2-2 transgenic animals. World J. Gastroenterol. 2014, 20, 17839–17850. [Google Scholar] [CrossRef] [PubMed]
  62. Bode, H.B.; Ring, M.W.; Schwär, G.; Kroppenstedt, R.M.; Kaiser, D.; Müller, R. 3-Hydroxy-3-methylglutaryl-coenzyme a (CoA) synthase is involved in biosynthesis of isovaleryl-CoA in the myxobacterium Myxococcus xanthus during fruiting body formation. J. Bacteriol. 2006, 188, 6524. [Google Scholar] [CrossRef] [PubMed]
  63. Hoppstädter, J.; Diesel, B.; Eifler, L.K.; Schmid, T.; Brüne, B.; Kiemer, P.A.K. Glucocorticoid-induced leucine zipper is downregulated in human alveolar macrophages upon toll-like receptor activation. Eur. J. Immunol. 2012, 42, 1282. [Google Scholar] [CrossRef] [PubMed]
  64. Fechir, M.; Linker, K.; Pautz, A.; Hubrich, T.; Forstermann, U.; Rodriguez-Pascual, F.; Kleinert, H. Tristetraprolin regulates the expression of the human inducible nitric-oxide synthase gene. Mol. Pharmacol. 2005, 67, 2148–2161. [Google Scholar] [CrossRef]
  65. Kessler, S.M.; Pokorny, J.; Zimmer, V.; Laggai, S.; Lammert, F.; Bohle, R.M.; Kiemer, A.K. IGF2 mRNA binding protein p62/IMP2-2 in hepatocellular carcinoma: Antiapoptotic action is independent of IGF2/PI3K signaling. Am. J. Physiol. Gastrointest. Liver Physiol. 2013, 304, G328–G336. [Google Scholar] [CrossRef]
  66. Roessler, S.; Jia, H.-L.; Budhu, A.; Forgues, M.; Ye, Q.-H.; Lee, J.-S.; Thorgeirsson, S.S.; Sun, Z.; Tang, Z.-Y.; Qin, L.-X.; et al. A unique metastasis gene signature enables prediction of tumor relapse in early-stage hepatocellular carcinoma patients. Cancer Res. 2010, 70, 10202–10212. [Google Scholar] [CrossRef] [PubMed]
  67. Tung, E.K.-K.; Mak, C.K.-M.; Fatima, S.; Lo, R.C.-L.; Zhao, H.; Zhang, C.; Dai, H.; Poon, R.T.-P.; Yuen, M.-F.; Lai, C.-L.; et al. Clinicopathological and prognostic significance of serum and tissue Dickkopf-1 levels in human hepatocellular carcinoma. Liver Int. 2011, 31, 1494–1504. [Google Scholar] [CrossRef]
  68. Mínguez, B.; Hoshida, Y.; Villanueva, A.; Toffanin, S.; Cabellos, L.; Thung, S.; Mandeli, J.; Sia, D.; April, C.; Fan, J.-B.; et al. Gene-expression signature of vascular invasion in hepatocellular carcinoma. J. Hepatol. 2011, 55, 1325. [Google Scholar] [CrossRef]
  69. Vivian, J.; Rao, A.A.; Nothaft, F.A.; Ketchum, C.; Armstrong, J.; Novak, A.; Pfeil, J.; Narkizian, J.; Deran, A.D.; Musselman-Brown, A.; et al. Toil enables reproducible, open source, big biomedical data analyses. Nat. Biotechnol. 2017, 35, 314–316. [Google Scholar] [CrossRef] [Green Version]
  70. Li, B.; Dewey, C.N. Rsem: Accurate transcript quantification from RNA-seq data with or without a reference genome. BMC Bioinform. 2011, 12, 323. [Google Scholar] [CrossRef]
  71. Hoppstädter, J.; Kessler, S.M.; Bruscoli, S.; Huwer, H.; Riccardi, C.; Kiemer, A.K. Glucocorticoid-induced leucine zipper: A critical factor in macrophage endotoxin tolerance. J. Immunol. 2015, 194, 6057–6067. [Google Scholar] [CrossRef] [PubMed]
  72. Vandesompele, J.; De Preter, K.; Pattyn, F.; Poppe, B.; Van Roy, N.; De Paepe, A.; Speleman, F. Accurate normalization of real-time quantitative RT-PCR data by geometric averaging of multiple internal control genes. Genome Biol. 2002, 3. [Google Scholar] [CrossRef] [PubMed] [Green Version]
  73. Andersen, C.L.; Jensen, J.L.; Ørntoft, T.F. Normalization of real-time quantitative reverse transcription-PCR data: A model-based variance estimation approach to identify genes suited for normalization, applied to bladder and colon cancer data sets. Cancer Res. 2004, 64, 5245–5250. [Google Scholar] [CrossRef] [PubMed]
  74. Wang, N.; Strugnell, R.; Wijburg, O.; Brodnicki, T. Measuring bacterial load and immune responses in mice infected with Listeria monocytogenes. J. Vis. Exp. 2011, 54, e3076. [Google Scholar] [CrossRef] [PubMed]
  75. Blériot, C.; Dupuis, T.; Jouvion, G.; Eberl, G.; Disson, O.; Lecuit, M. Liver-resident macrophage necroptosis orchestrates type 1 microbicidal inflammation and type-2-mediated tissue repair during bacterial infection. Immunity 2015, 42, 145–158. [Google Scholar] [CrossRef]
  76. Ramachandran, P.; Pellicoro, A.; Vernon, M.A.; Boulter, L.; Aucott, R.L.; Ali, A.; Hartland, S.N.; Snowdon, V.K.; Cappon, A.; Gordon-Walker, T.T.; et al. Differential Ly-6c expression identifies the recruited macrophage phenotype, which orchestrates the regression of murine liver fibrosis. Proc. Natl. Acad. Sci. USA 2012, 109, E3186–E3195. [Google Scholar] [CrossRef]
Figure 1. Amount and pattern of tumors and hepatic monocyte to macrophage ratio in diethylnitrosamine (DEN)- or sham-treated wild type (WT) and tristetraprolin (TTP)-knockout (lsTtp-KO) mice. (A): Tumor incidence. (B): Tumor multiplicity. (C): Predominant tumor growth pattern. (D): Monocyte/macrophage ratio analyzed by multi-color flow cytometry (short-term experiment). n = 10, each.
Cancers 11 01754 g001
Figure 2. Hepatic fatty acid (FA) profile in short-term DEN-treated lsTtp-KO mice. (A): Overview of hepatic FAs in the four comparison groups. The values for the represented FAs are normalized to the corresponding FA in the WT/control, which is set to 100% and is illustrated by the dashed line. Statistical differences refer to the respective control, which means that WT/DEN is compared with the WT/control, and lsTtp-KO/DEN is compared with the lsTtp-KO/control. Error bars indicate SD. Graphs for single FAs are shown in supplementary Figure S1. (B): Sum-saturated FAs (14:0, 16:0, 17:0, 18:0, 20:0, 22:0, 24:0). (C): Sum-polyunsaturated FAs (18:2 (ω-6,9) all cis, 20:2 (ω-6,9) all cis, 20:3 (ω-6,9,12) all cis, 20:4 (ω-6,9,12,15) all cis, 22:5 (ω-3,6,9,12,15) all cis, 22:6 (ω-3,6,9,12,15,18) all cis). n = 6 (WT/control), 6 (WT/DEN), 4 (lsTtp-KO/control), 6 (lsTtp-KO/DEN). Rhombi illustrate single data points, horizontal black lines illustrate median, and white rectangles illustrate means. Significant p values (α < 0.05) are shown. (14:0 = myristic acid, 16:0 = palmitic acid, 16:1 (ω-7) cis = palmitoleic acid, 17:0 = margaric acid, 18:0 = stearic acid, 18:1 (ω-9) cis = oleic acid, 18:2 (ω-6,9) all cis = linoleic acid, 20:0 = arachidic acid, 20:2 (ω-6,9) all cis = eicosadienoic acid, 20:3 (ω-6,9,12) all cis = eicosatrienoic acid, 20:4 (ω-6,9,12,15) all cis = arachidonic acid, 22:0 = behenic acid, 22:5 (ω-3,6,9,12,15) all cis = docasapentaenoic acid, 22:6 (ω-3,6,9,12,15,18) all cis = docosahexaenoic acid, 24:0 = lignoceric acid).
Cancers 11 01754 g002
Figure 3. Hepatic fatty acid (FA) profile in long-term DEN-treated lsTtp-KO mice. (A): Overview of hepatic FAs in the four comparison groups. The values for the represented FAs are normalized to the corresponding FA in the WT/control, which is set to 100% and is illustrated by the dashed line. Statistical differences refer to the respective partner undergoing the same treatment but different genotype, which means that the WT/control is compared with the lsTtp-KO/control and WT/DEN is compared with lsTtp-KO/DEN. Error bars indicate SD. Graphs for single FAs are shown in supplementary Figure S2. (B): Sum saturated FAs (14:0, 16:0, 17:0, 18:0, 20:0, 22:0, 24:0). (C): Sum-polyunsaturated FAs (18:2 (ω-6,9) all cis, 20:2 (ω-6,9) all cis, 20:3 (ω-6,9,12) all cis, 20:4 (ω-6,9,12,15) all cis, 22:5 (ω-3,6,9,12,15) all cis, 22:6 (ω-3,6,9,12,15,18) all cis). (B)+(C): n = 6 (WT/control), 6 (WT/DEN), 4 (lsTtp-KO/control), 6 (lsTtp-KO/DEN). Rhombi illustrate single data points, horizontal black lines illustrate median, and white rectangles illustrate means. Significant p values (α < 0.05) are shown. (14:0 = myristic acid, 16:0 = palmitic acid, 16:1 (ω-7) cis = palmitoleic acid, 17:0 = margaric acid, 18:0 = stearic acid, 18:1 (ω-9) cis = oleic acid, 18:2 (ω-6,9) all cis = linoleic acid, 20:0 = arachidic acid, 20:2 (ω-6,9) all cis = eicosadienoic acid, 20:3 (ω-6,9,12) all cis = eicosatrienoic acid, 20:4 (ω-6,9,12,15) all cis = arachidonic acid, 22:0 = behenic acid, 22:5 (ω-3,6,9,12,15) all cis = docasapentaenoic acid, 22:6 (ω-3,6,9,12,15,18) all cis = docosahexaenoic acid, 24:0 = lignoceric acid).
Cancers 11 01754 g003
Figure 4. Proliferation and migration of TTP-overexpressing hepatoma cells. (A): Proliferation of cells transfected with either TTP (gene name ZFP36) or a control vector. (B): Flow cytometric analysis of the proliferation marker MKI67 in TTP-overexpressing (TTP vector) and control cells (control vector). The isotype controls represent the control cells. Representative histograms of MKI67 flow cytometric analyses are shown. n = 3; triplicates. (C): Migration of HepG2, Huh7, and PLC/PRF/5 cells transfected with either a TTP or a control vector. The difference between the open image area t(0) and t(24) was considered as an overgrown area. n = 5–6; quadruplicates. Statistical difference: *: p ≤ 0.05; **: p ≤ 0.01; ***: p ≤ 0.001.
Cancers 11 01754 g004
Figure 5. Effects of TTP overexpression on chemoresistance in hepatoma cells. Cells were transfected with either TTP (gene name ZFP36) or a control vector. 24 h after transfection, cells were treated with different concentrations of doxorubicin or sorafenib. Cell viability was determined via 3-(4,5-dimethylthiazol-2-yl)-2,5-diphenyltetrazolium bromide (MTT) assay. (A,B): HepG2 cells treated with doxorubicin (A) or sorafenib (B). (C,D): Huh7 cells treated with doxorubicin (C) or sorafenib (D). (E,F): PLC/PRF/5 cells treated with doxorubicin (E) or sorafenib (F). n = 3 (for untreated controls n = 6); quadruplicates. Statistical difference: *: p ≤ 0.05; **: p ≤ 0.01; ***: p ≤ 0.001.
Cancers 11 01754 g005
Figure 6. Oncogene expression in TTP-overexpressing hepatoma cells. (A) Expression levels normalized to cells treated with a control vector were determined in HepG2, Huh7, and PLC/PRF/5 cells by qPCR. BCL2 was not determined in Huh7 cells since mRNA expression was below the detection limit. n = 2; triplicates. (B): TTP (gene name ZFP36) expression in human hepatocellular carcinoma (HCC) grouped into tumors positive (n = 45) or negative (n = 34) regarding vascular invasion (GSE20238). Statistical difference: *: p ≤ 0.05; **: p ≤ 0.01; ***: p ≤ 0.001. (BCL2: B-cell lymphoma 2, MYC: c-Myc, E2F1: transcription factor E2F1, IGF2BP1: insulin-like growth factor 2 mRNA-binding protein 1, IGF2BP3: insulin-like growth factor 2 mRNA-binding protein 3, NEAT1_v1/v2: nuclear enriched abundant transcript 1, NEAT1_v2: long transcript variant of nuclear enriched abundant transcript 1, VEGFA: vascular endothelial growth factor A, XIAP: X-linked inhibitor of apoptosis protein).
Cancers 11 01754 g006
Figure 7. TTP (gene name ZFP36) mRNA expression in human tumor and non-tumor liver tissue. (A): TTP mRNA expression in 247 human HCC samples relative to the mean of 239 non-tumor liver tissue samples (µ normal) (GSE14520). (B): TTP mRNA expression in tumor (n = 373) and non-tumor (n = 50) tissue (The Cancer Genome Atlas (TCGA)). (C): TTP mRNA expression in healthy, cirrhotic, adjacent non-tumor, and tumor liver tissues (500 samples; GSE25097). (D): TTP mRNA levels isolated of tumor and matched adjacent non-tumor tissues (n = 31).
Cancers 11 01754 g007

