[18F] Clofarabine for PET Imaging of Hepatocellular Carcinoma

 and
and
Abstract
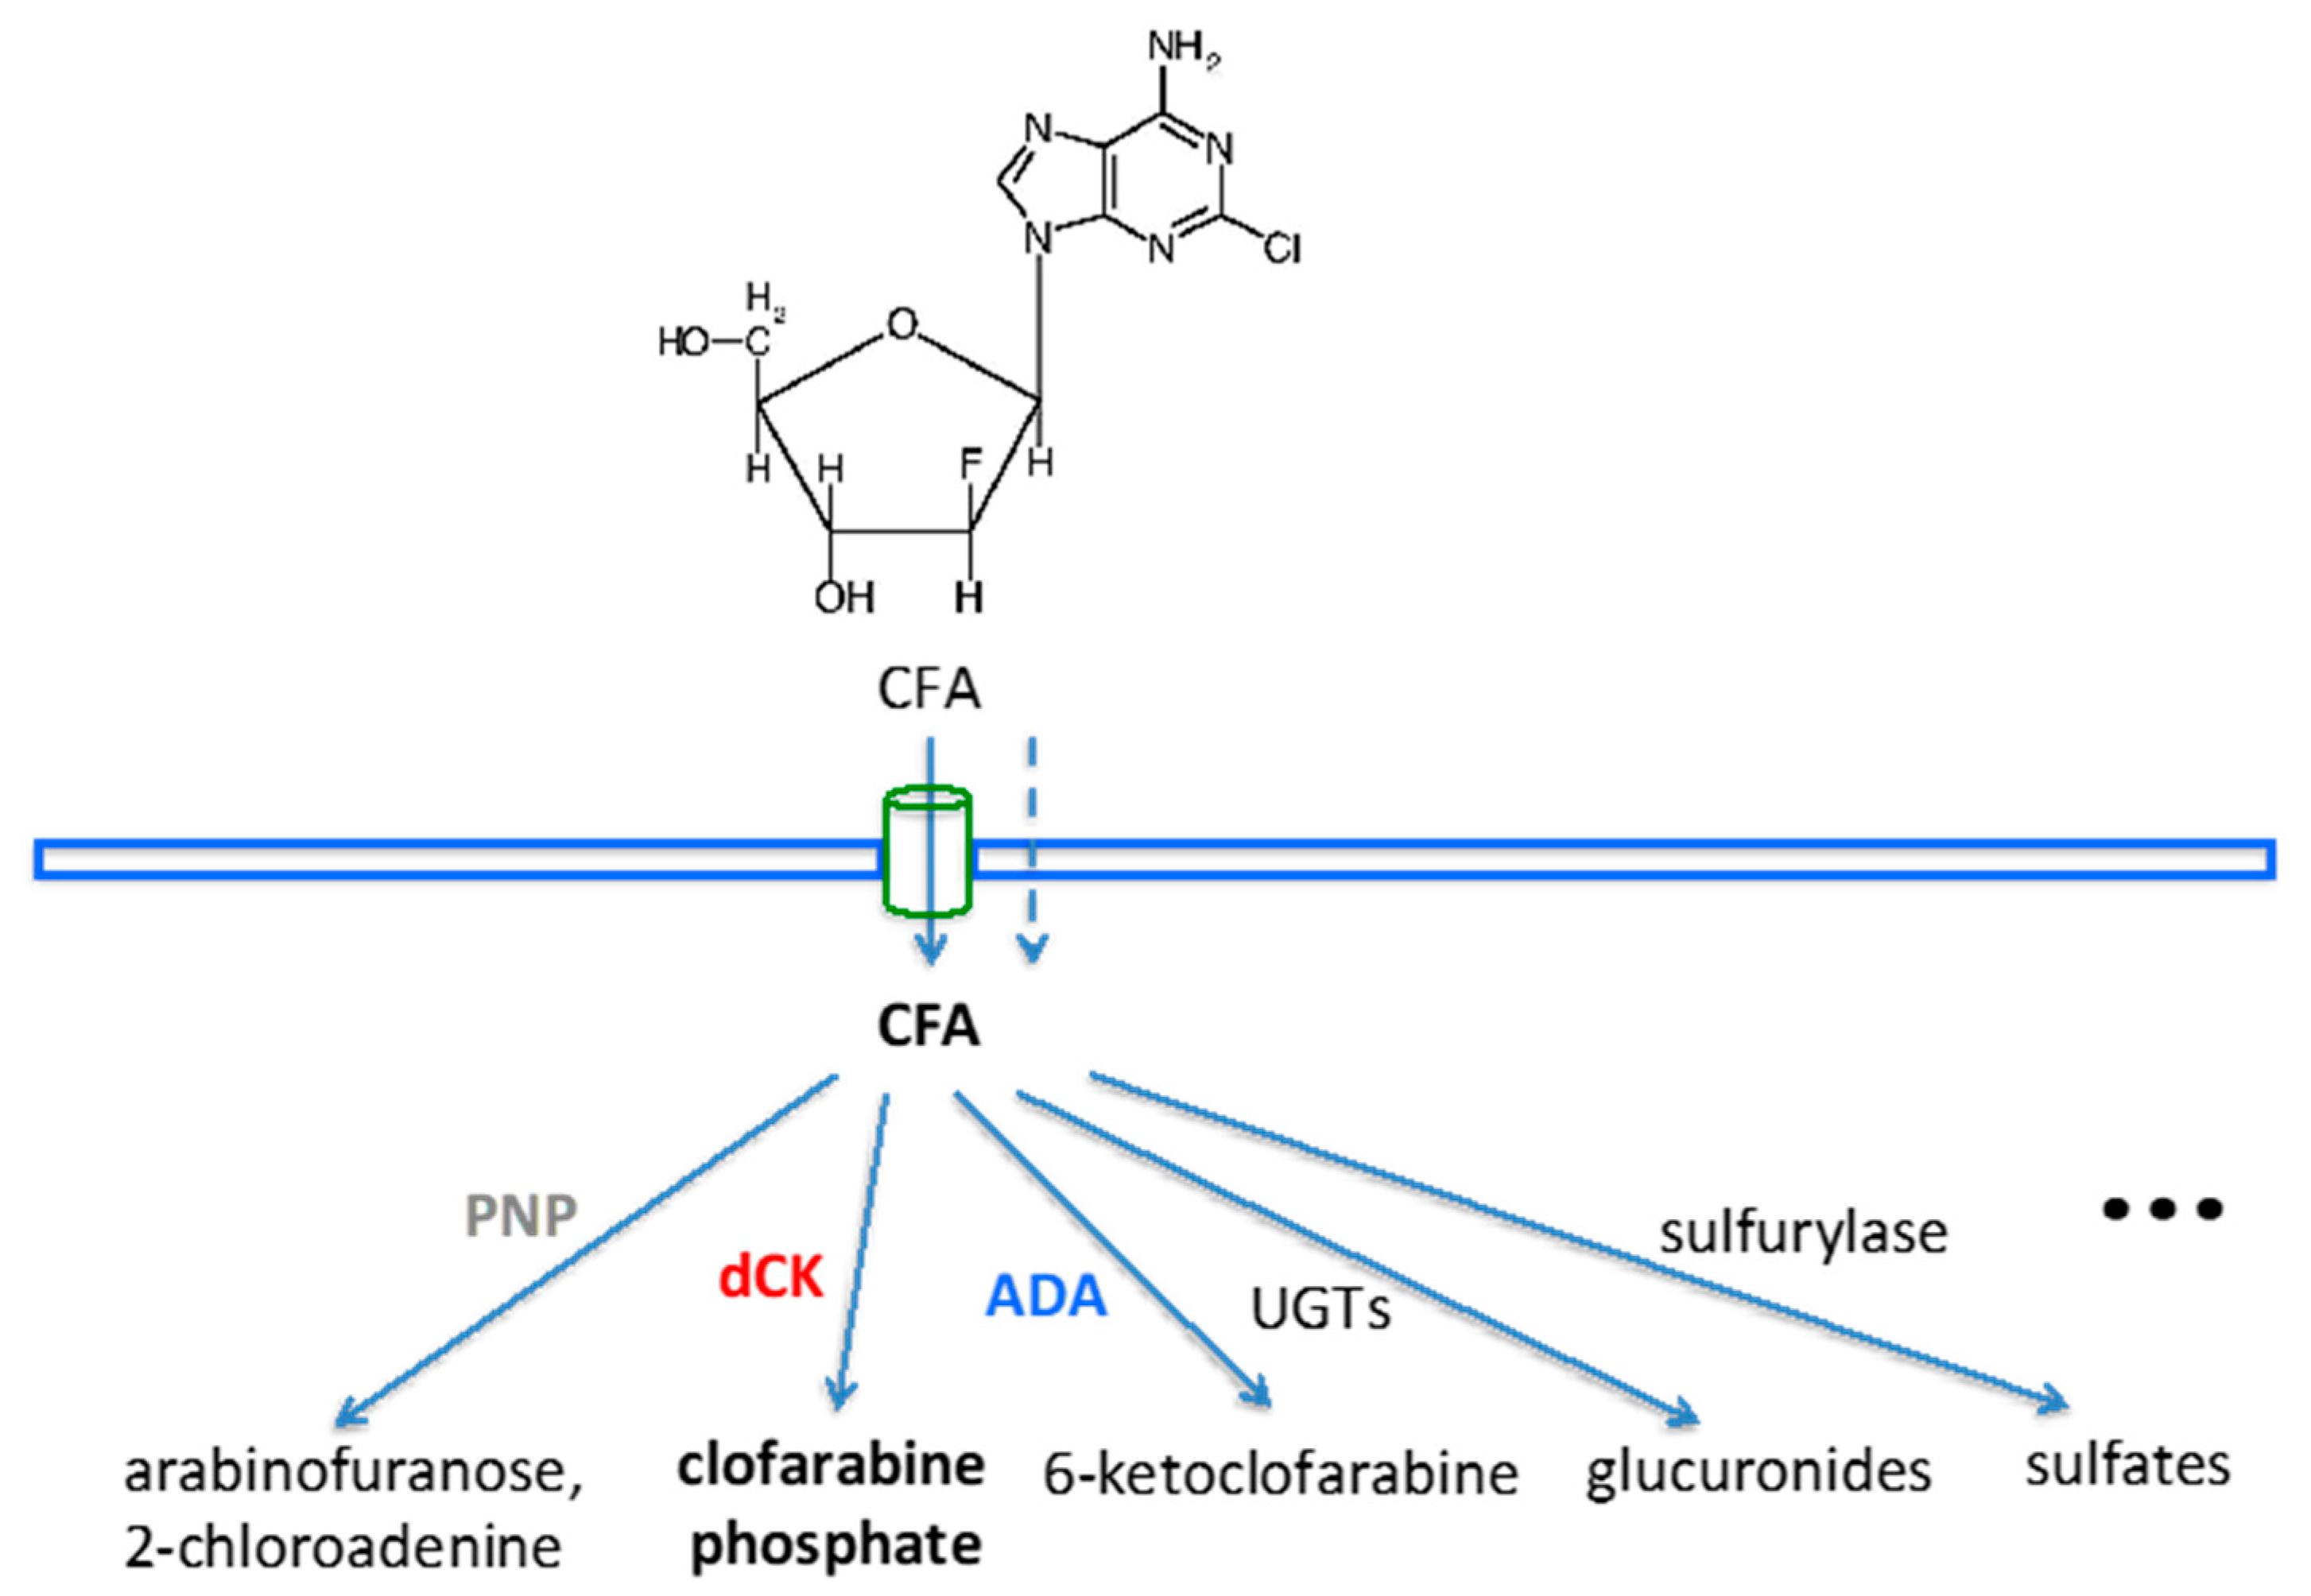
:1. Introduction
2. Results
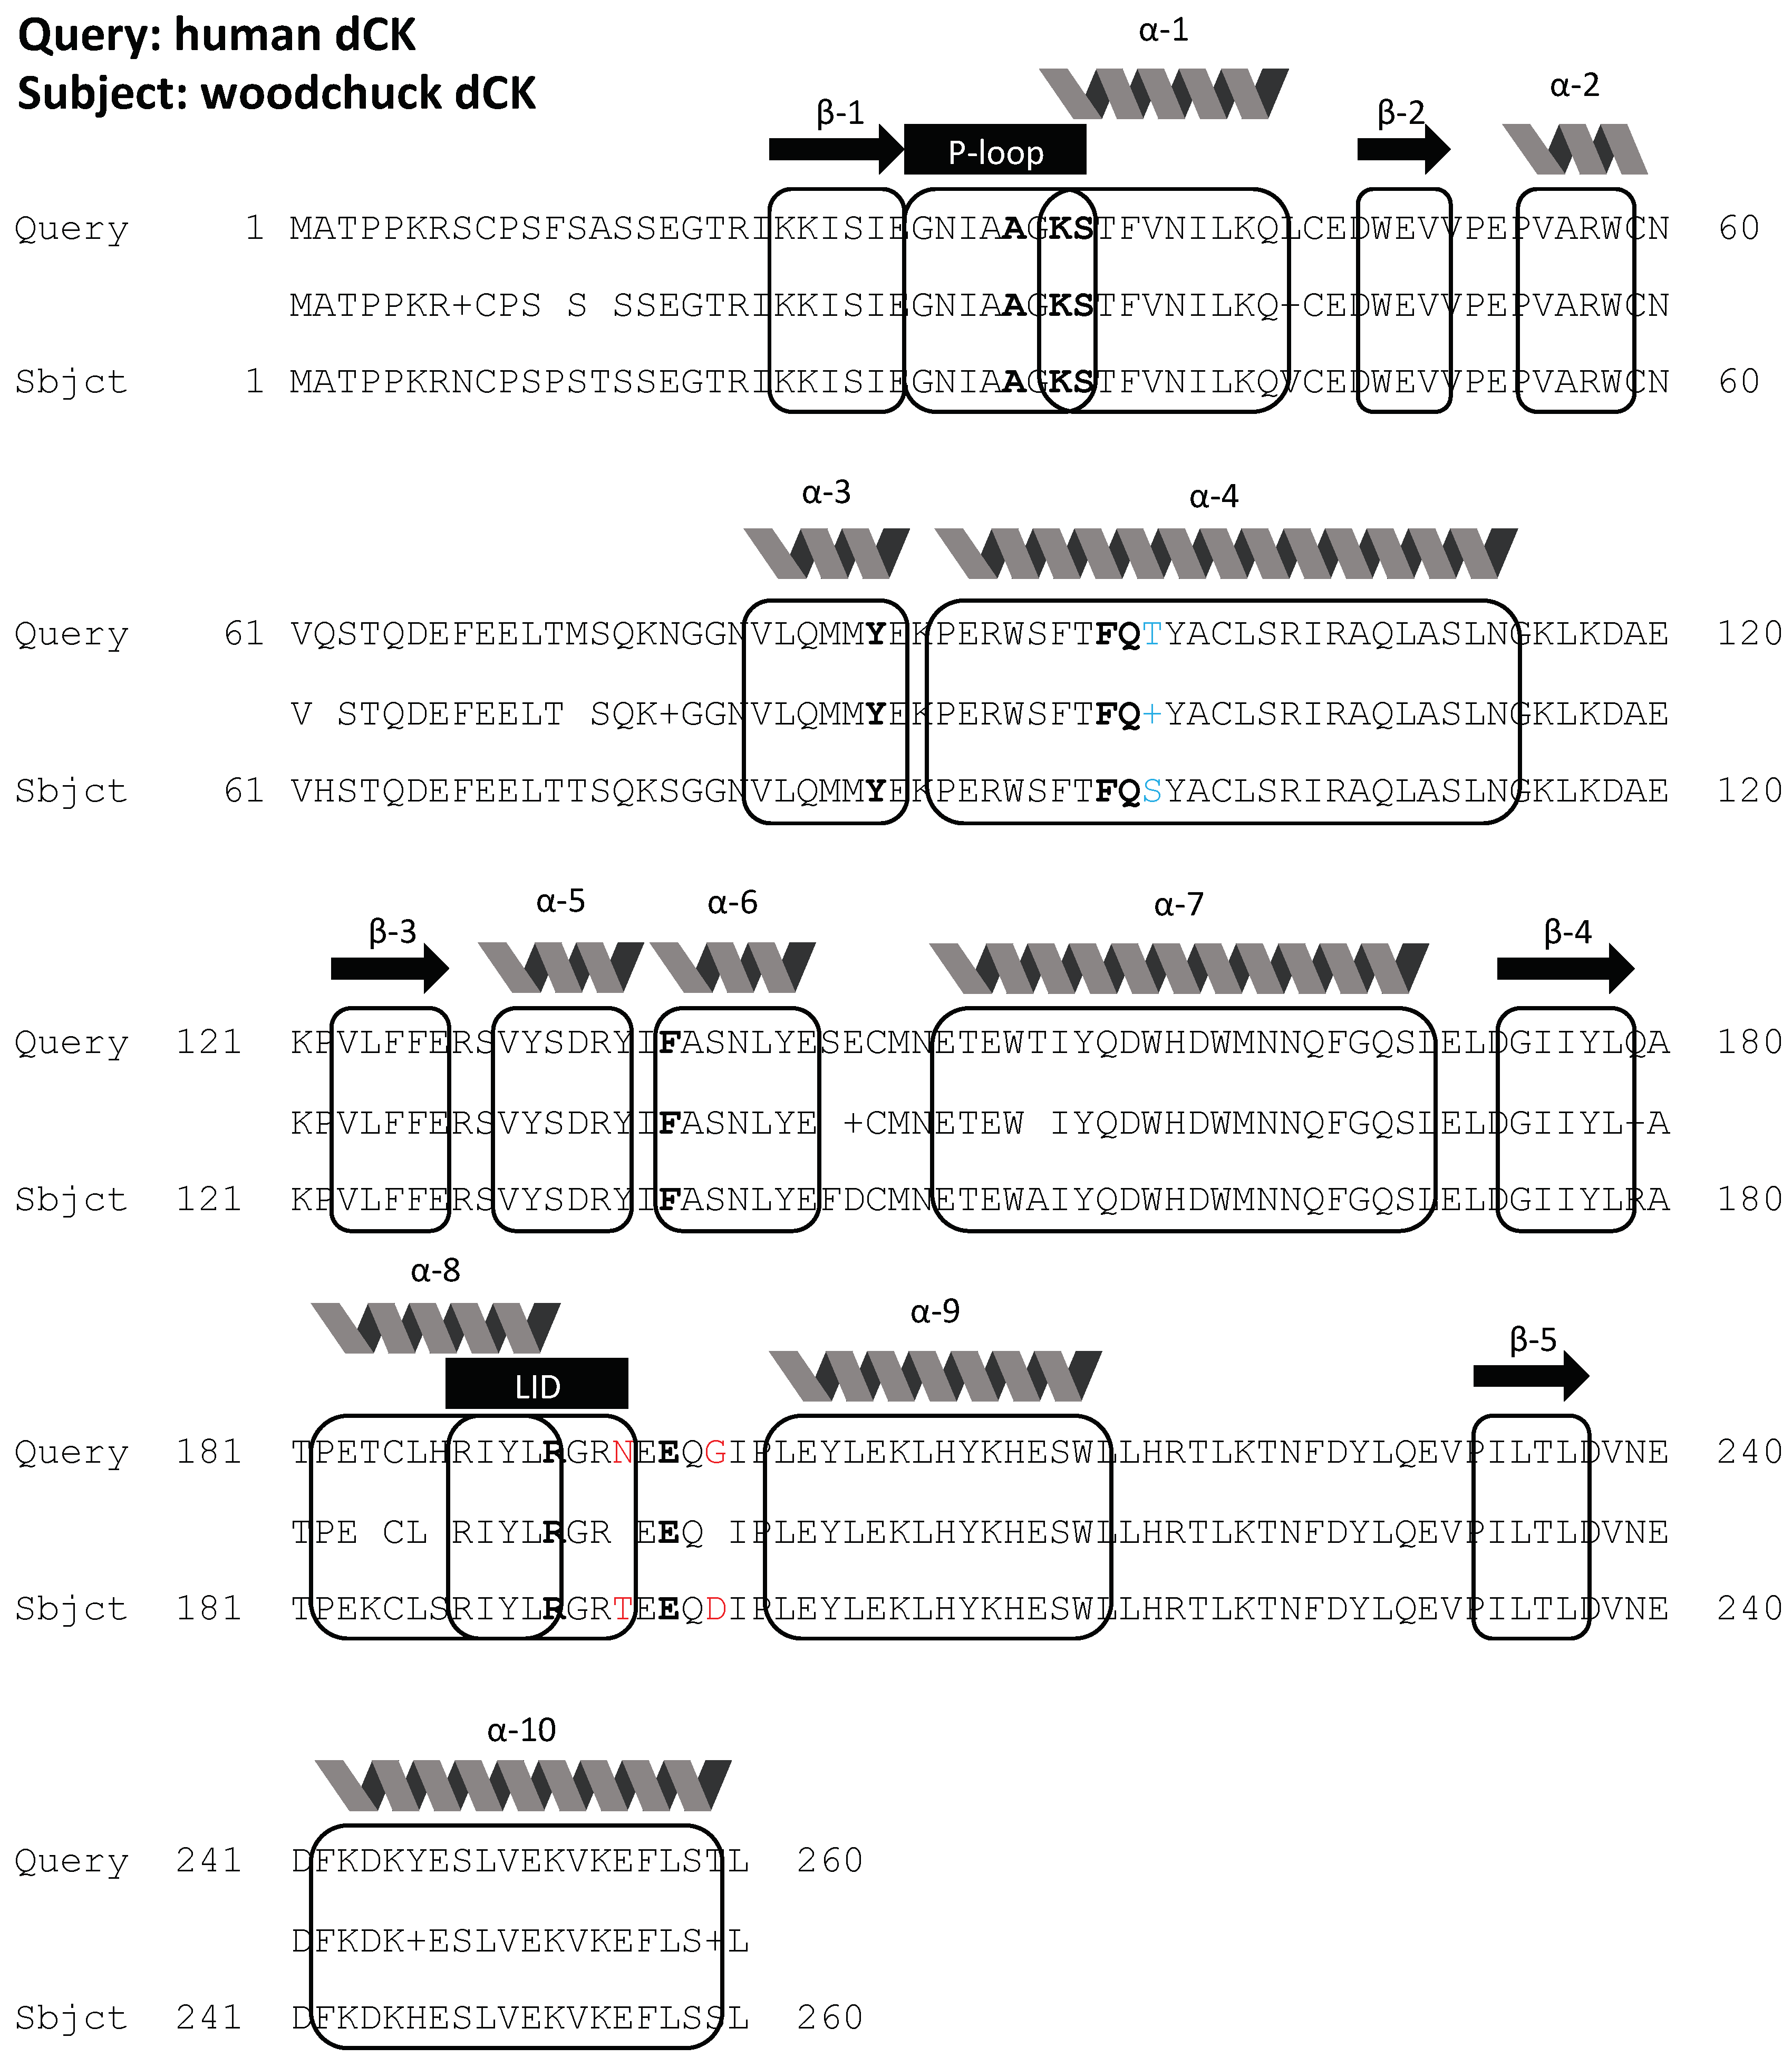
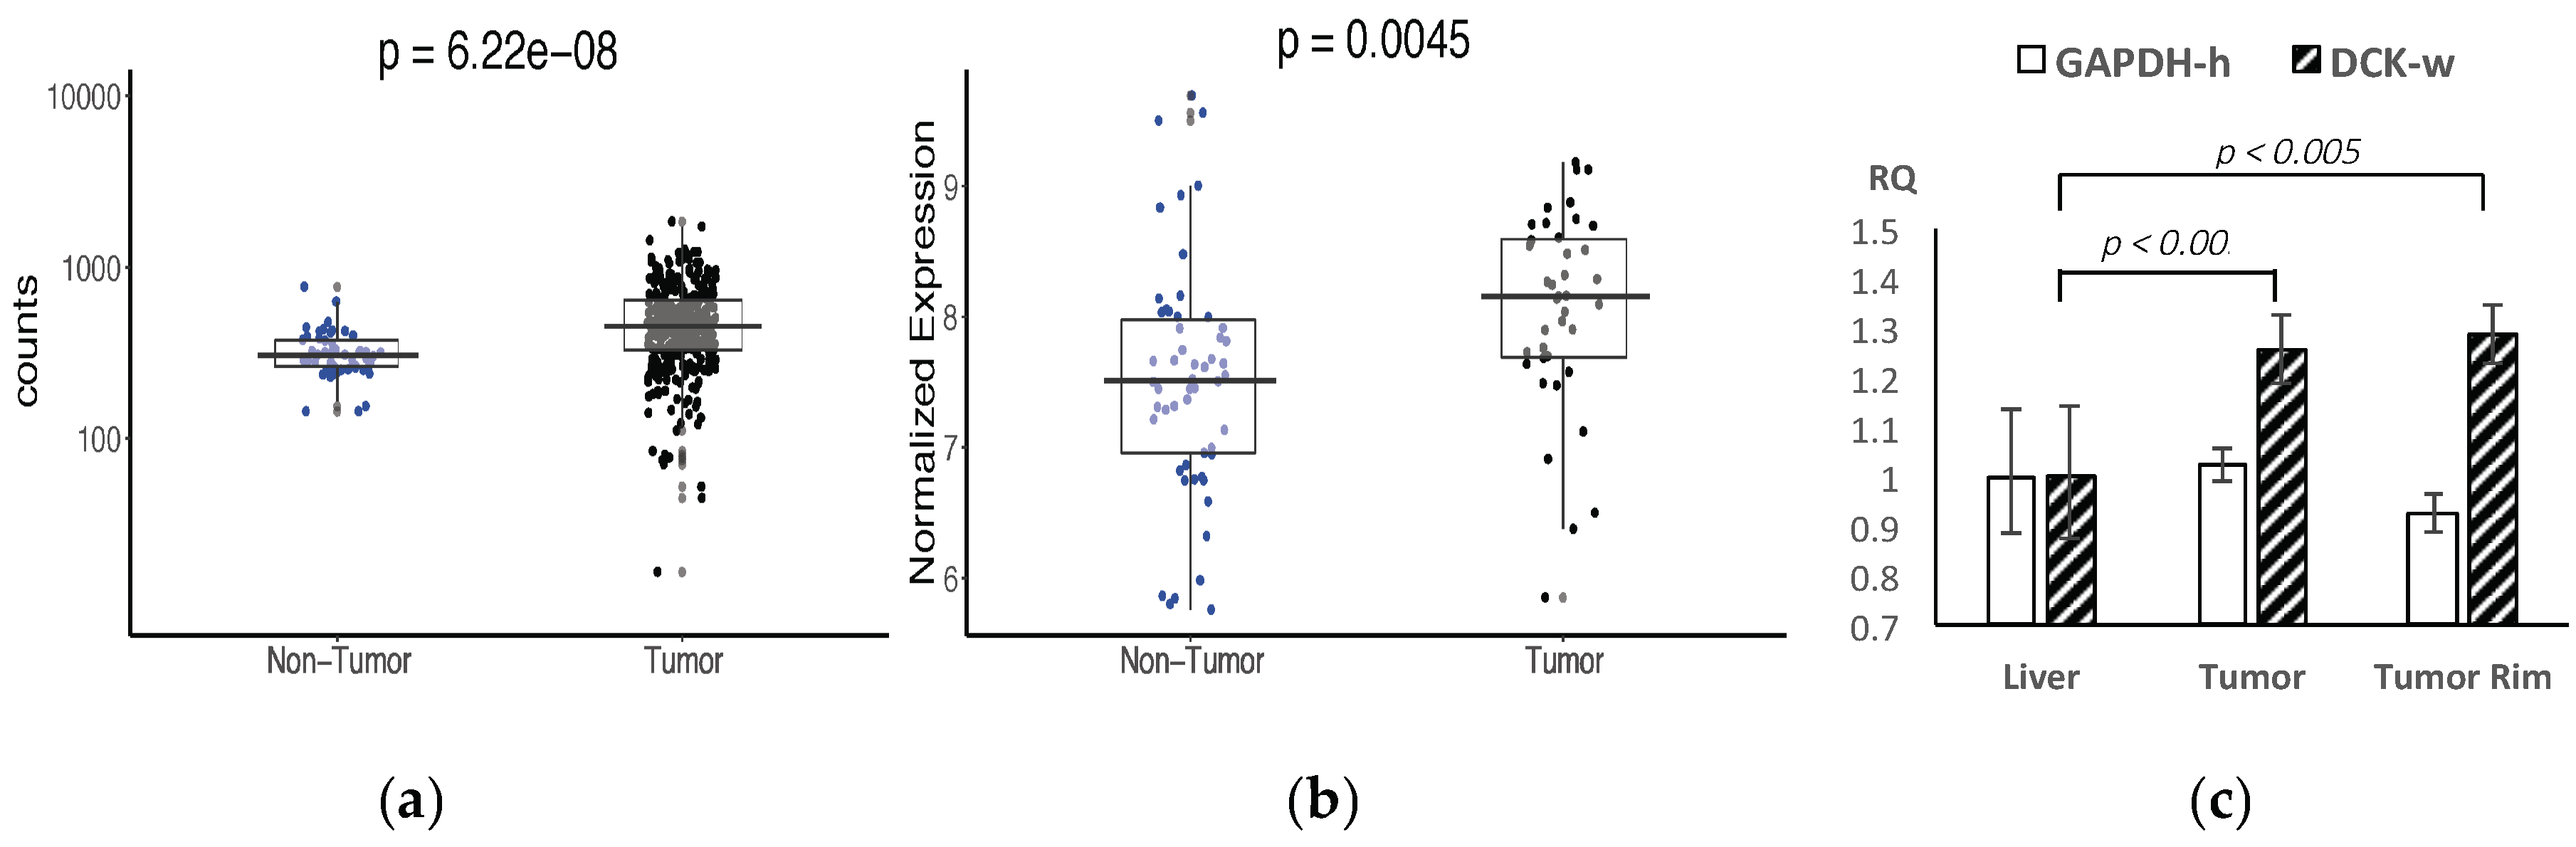
2.1. Bioinformatics
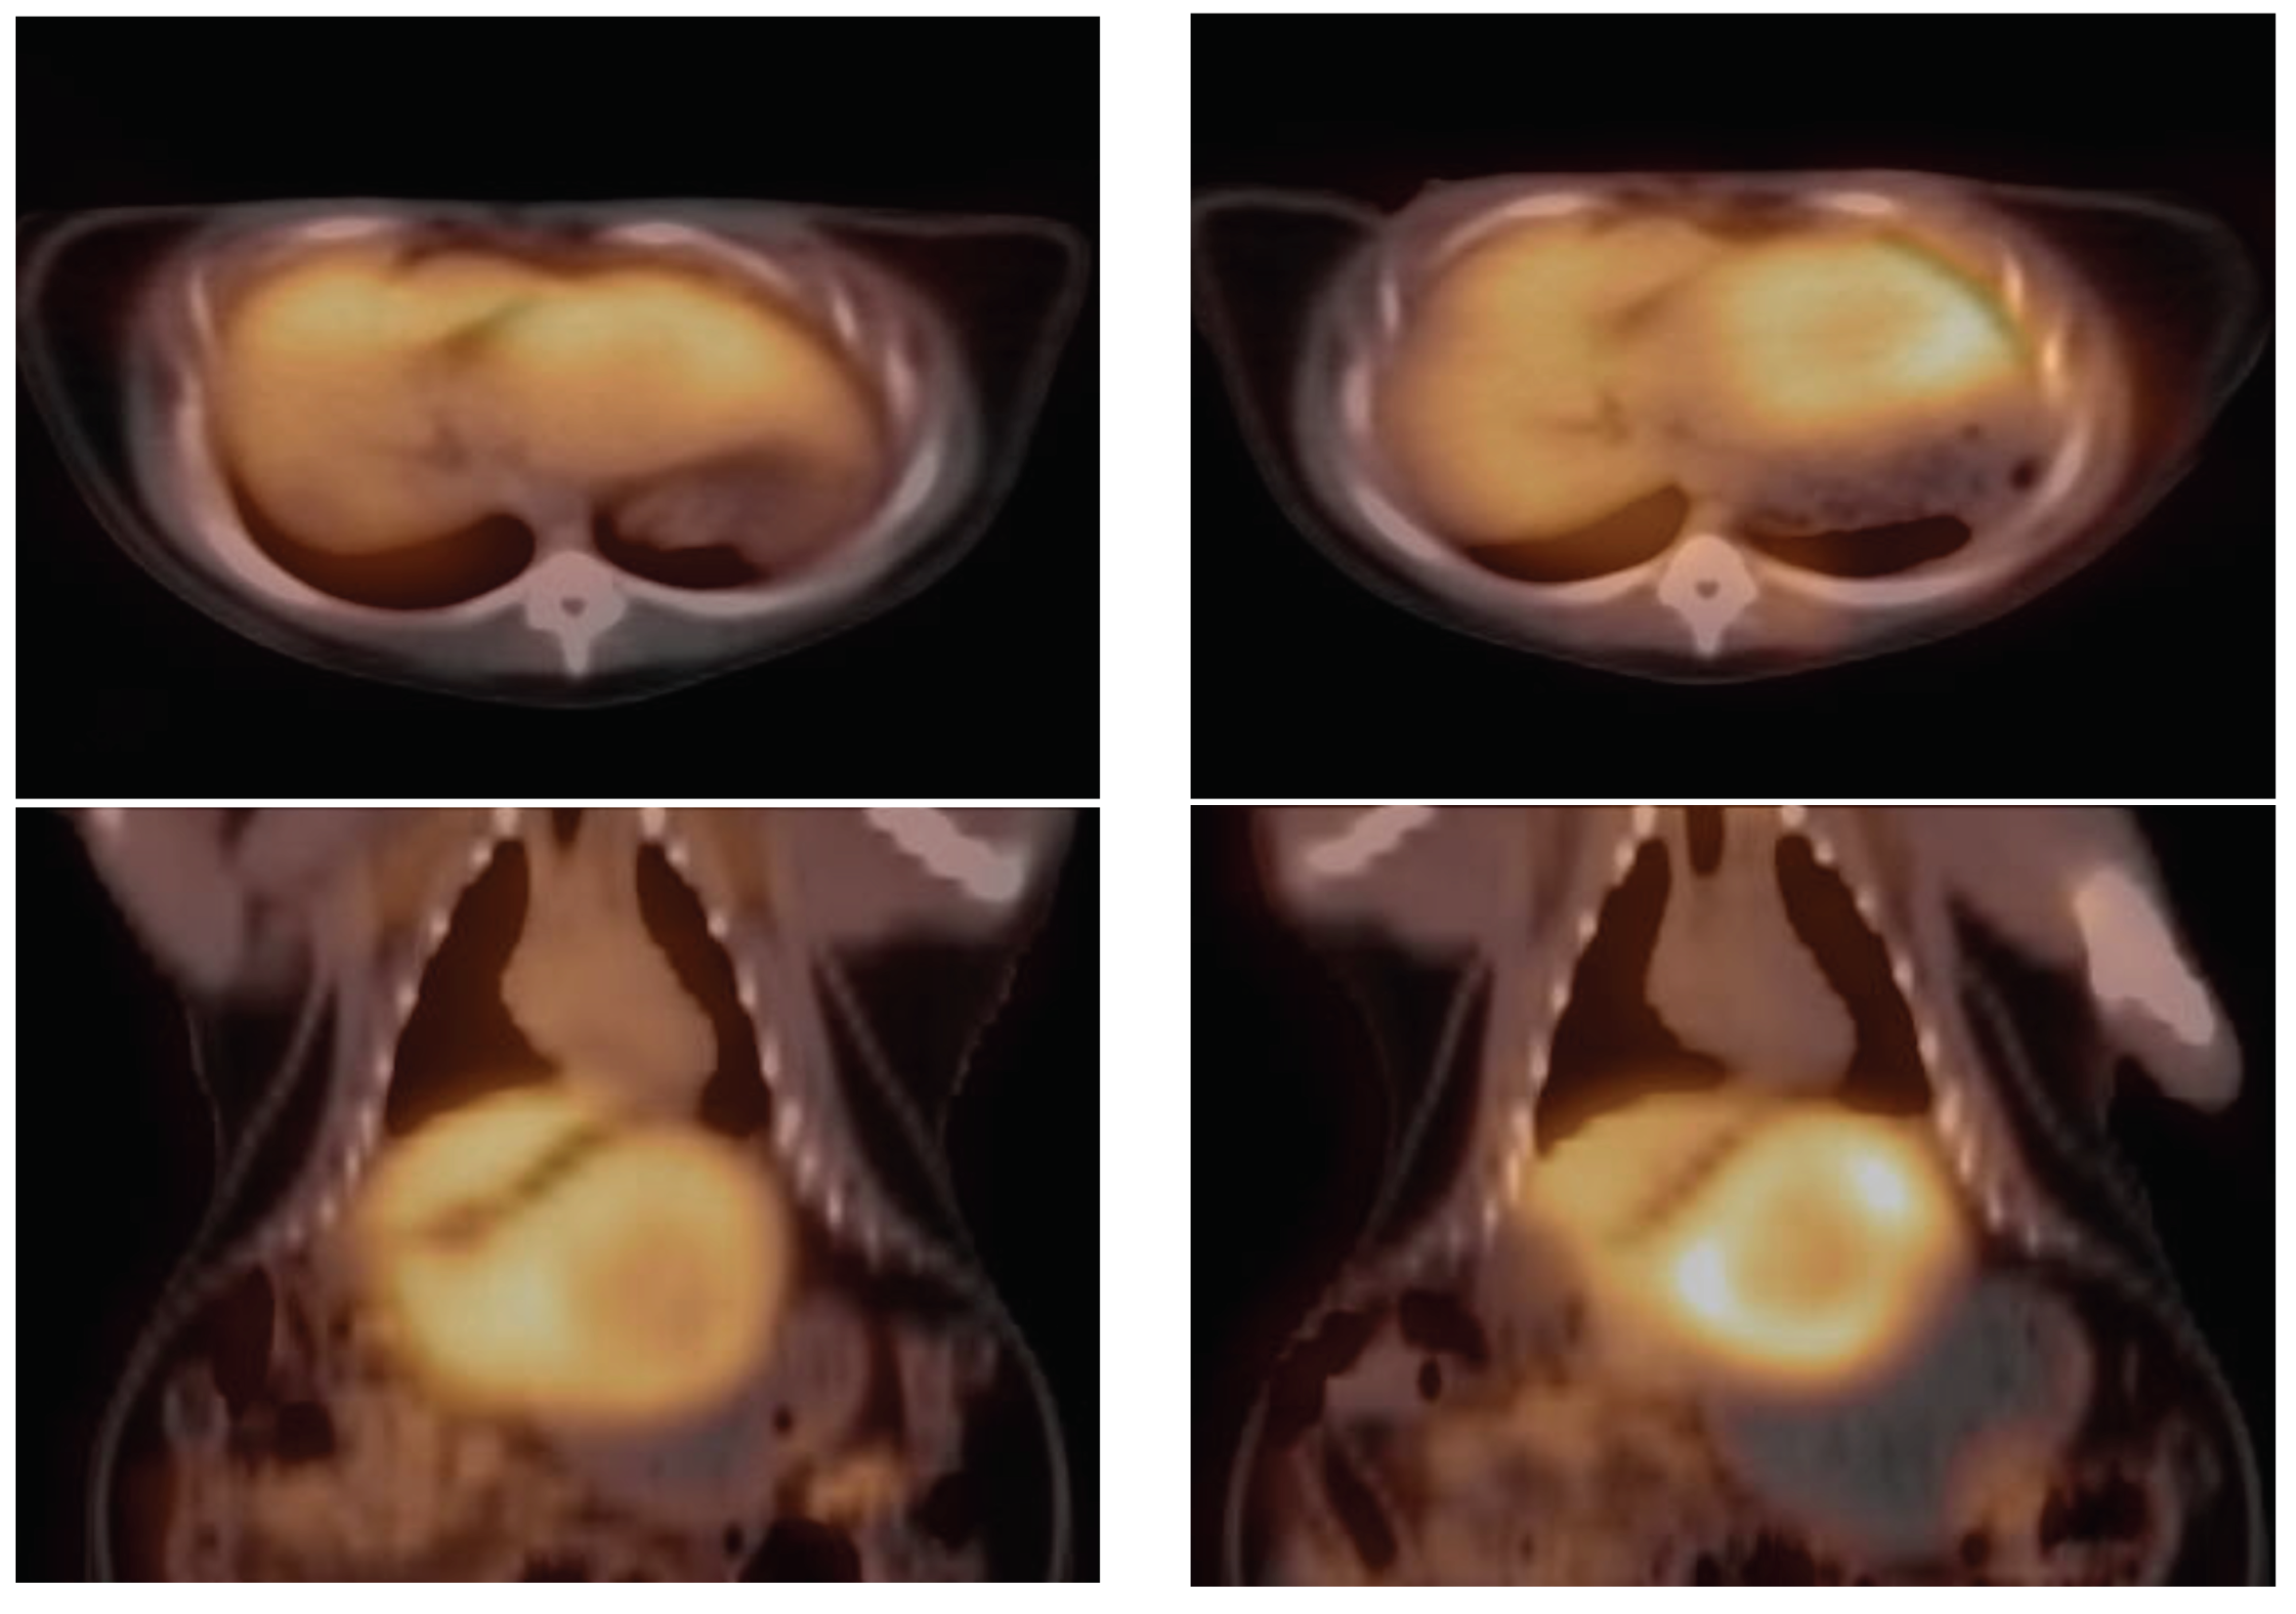
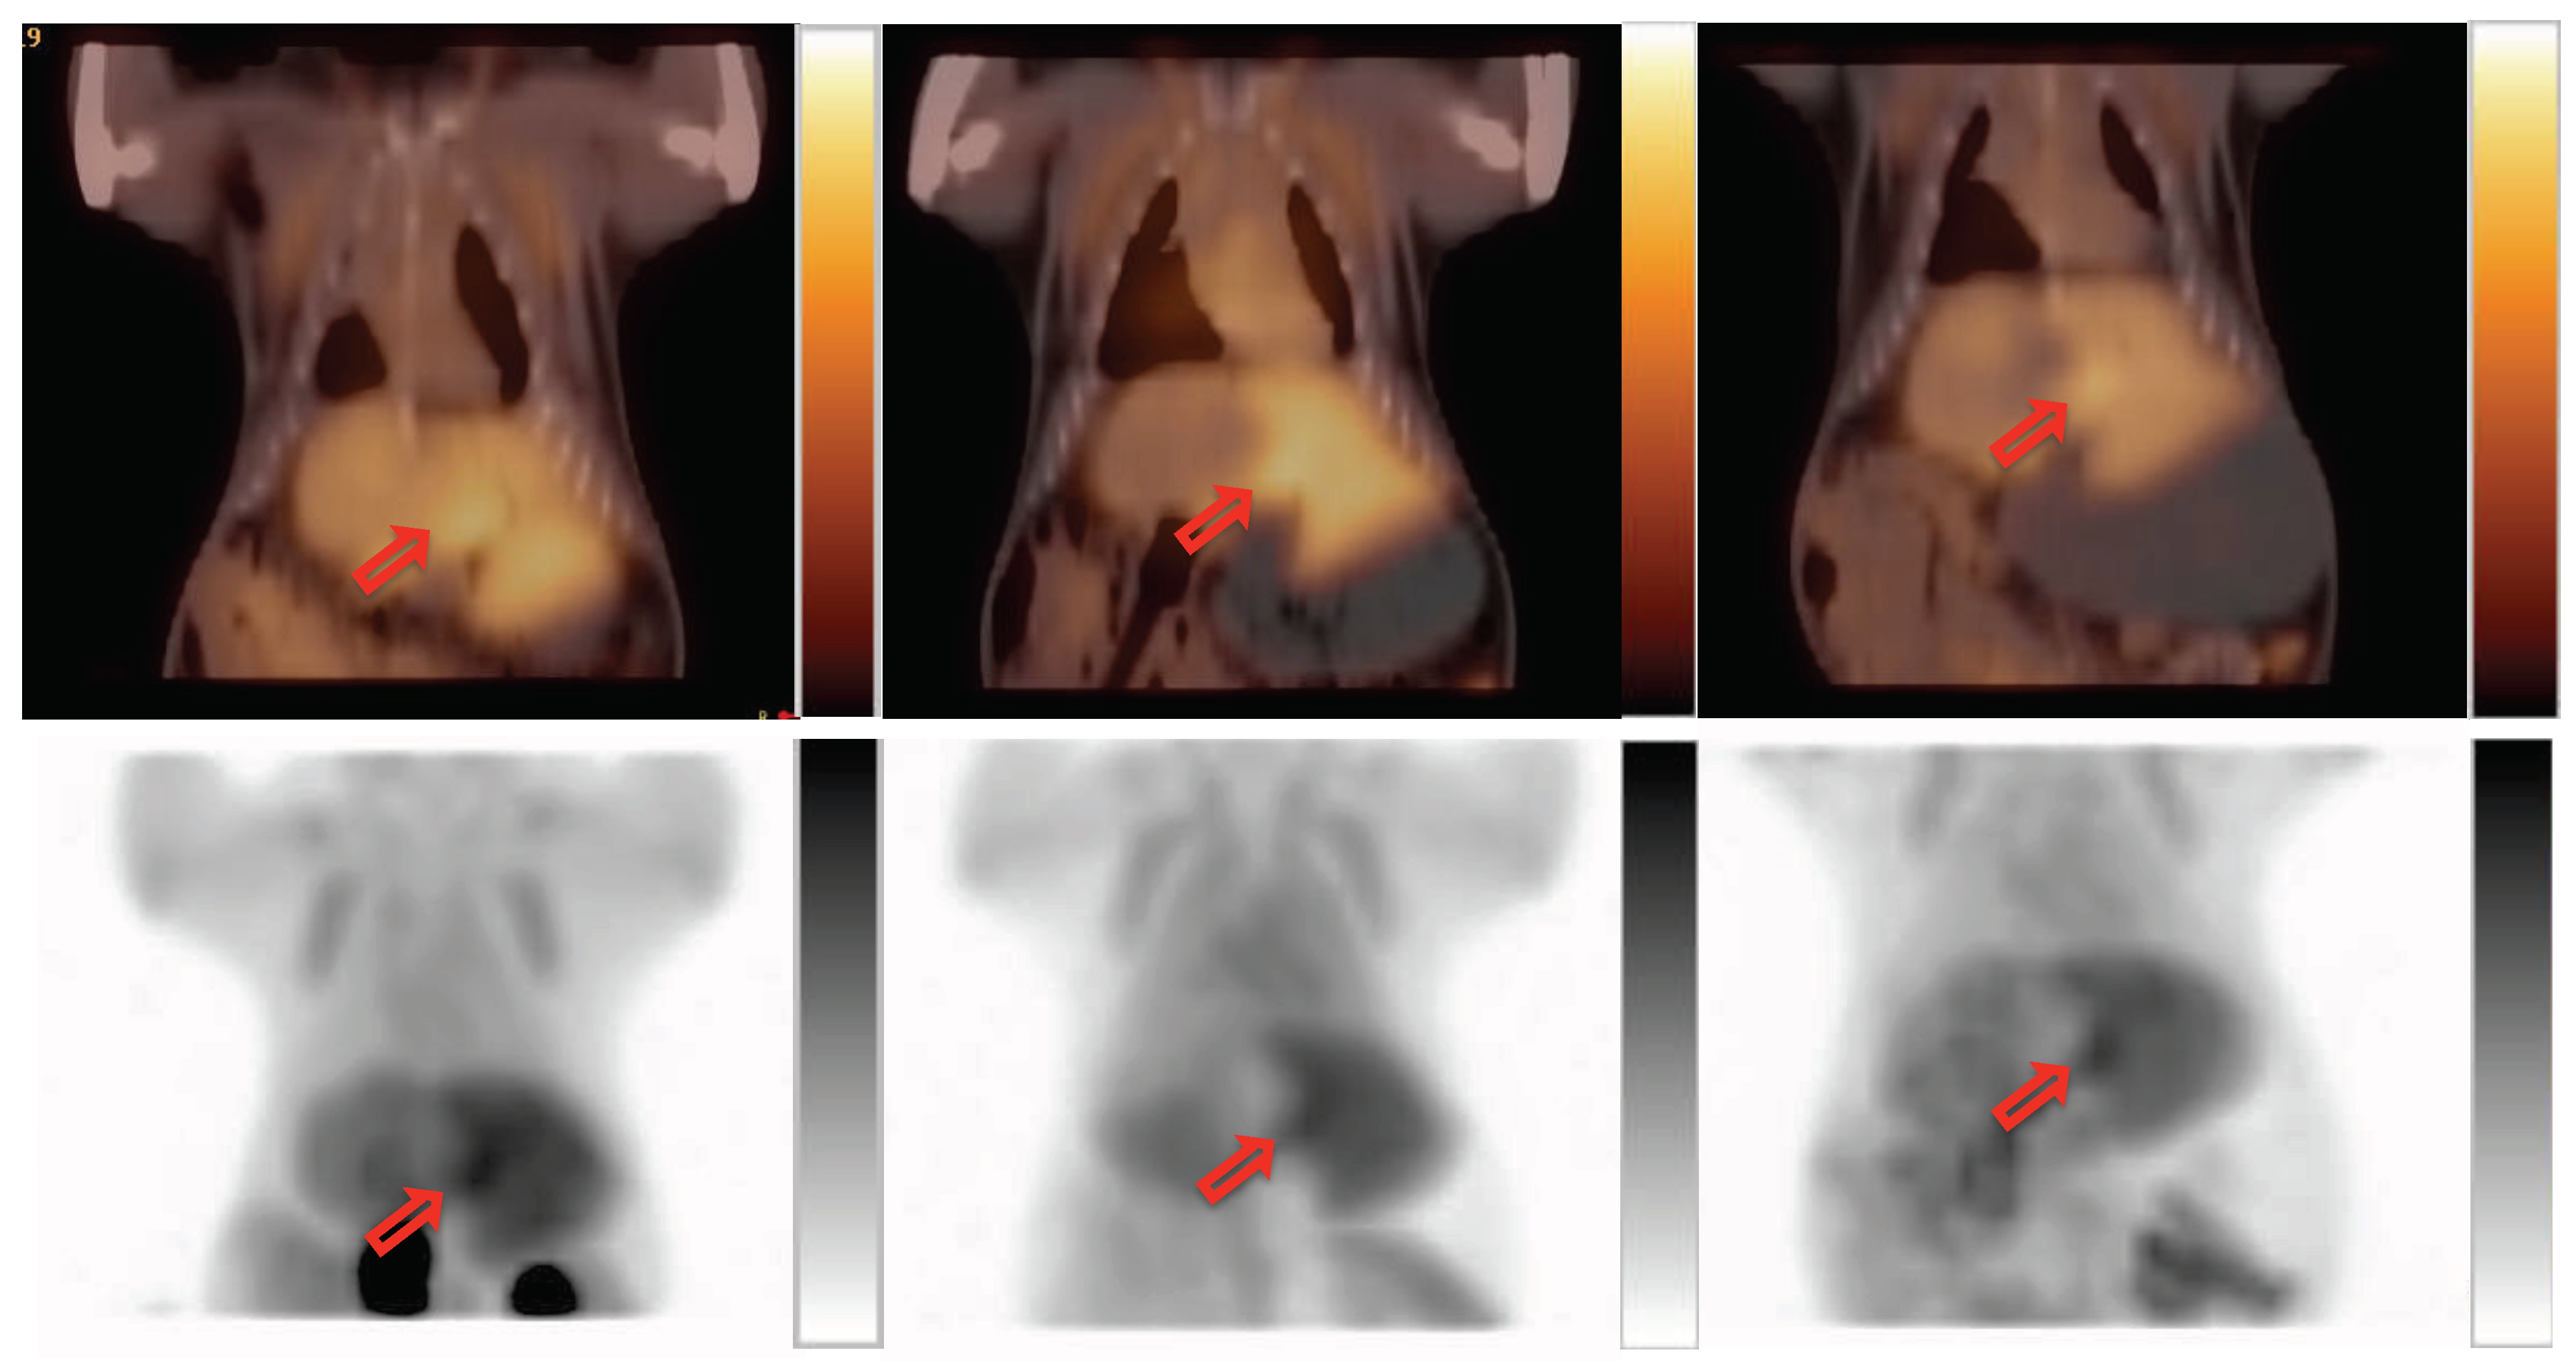
2.2. PET Imaging
2.3. Validation
2.3.1. Enzymatic Assay for dCK
2.3.2. Histology
3. Discussion
4. Materials and Methods
4.1. Animal Models
4.2. Bioinformatics
4.2.1. Human Data
4.2.2. Woodchuck Data
4.3. PET Imaging
4.3.1. Radiotracer
4.3.2. Imaging Experiment
4.3.3. Data Analysis
4.4. Validation
4.4.1. qRT-PCR
4.4.2. Enzymatic Assay for dCK
4.4.3. Histology
5. Conclusions
Supplementary Materials
Author Contributions
Funding
Acknowledgments
Conflicts of Interest
References
- El-Serag, H.B.; Kanwal, F. Epidemiology of hepatocellular carcinoma in the United States: Where are we? Where do we go? Hepatology 2014, 60, 1767–1775. [Google Scholar] [CrossRef]
- Fyrberg, A.; Albertioni, F.; Lotfi, K. Cell cycle effect on the activity of deoxynucleoside analogue metabolising enzymes. Biochem. Biophys. Res. Commun. 2007, 357, 847–853. [Google Scholar] [CrossRef]
- Kim, W.; Le, T.M.; Wei, L.; Poddar, S.; Bazzy, J.; Wang, X.; Uong, N.T.; Abt, E.R.; Capri, J.R.; Austin, W.R.; et al. [18F]CFA as a clinically translatable probe for PET imaging of deoxycytidine kinase activity. Proc. Natl. Acad. Sci. USA 2016, 113, 4027–4032. [Google Scholar] [CrossRef]
- Barrio, M.J.; Spick, C.; Radu, C.G.; Lassmann, M.; Eberlein, U.; Allen-Auerbach, M.; Schiepers, C.; Slavik, R.; Czernin, J.; Herrmann, K. Human Biodistribution and Radiation Dosimetry of (18)F-Clofarabine, a PET Probe Targeting the Deoxyribonucleoside Salvage Pathway. J. Nucl. Med. 2017, 58, 374–378. [Google Scholar] [CrossRef]
- King, K.M.; Damaraju, V.L.; Vickers, M.F.; Yao, S.Y.; Lang, T.; Tackaberry, T.E.; Mowles, D.A.; Ng, A.M.; Young, J.D.; Cass, C.E. A comparison of the transportability, and its role in cytotoxicity, of clofarabine, cladribine, and fludarabine by recombinant human nucleoside transporters produced in three model expression systems. Mol. Pharmacol. 2006, 69, 346–353. [Google Scholar] [CrossRef]
- Rao, P.N.; Walsh, T.R.; Makowka, L.; Rubin, R.S.; Weber, T.; Snyder, J.T.; Starzl, T.E. Purine nucleoside phosphorylase: A new marker for free oxygen radical injury to the endothelial cell. Hepatology 1990, 11, 193–198. [Google Scholar] [CrossRef] [Green Version]
- Tennant, B.C.; Toshkov, I.A.; Peek, S.F.; Jacob, J.R.; Menne, S.; Hornbuckle, W.E.; Schinazi, R.D.; Korba, B.E.; Cote, P.J.; Gerin, J.L. Hepatocellular carcinoma in the woodchuck model of hepatitis B virus infection. Gastroenterology 2004, 127 (Suppl 1), S283–S293. [Google Scholar] [CrossRef] [Green Version]
- Jacob, J.R.; Sterczer, A.; Toshkov, I.A.; Yeager, A.E.; Korba, B.E.; Cote, P.J.; Buendia, M.A.; Gerin, J.L.; Tennant, B.C. Integration of woodchuck hepatitis and N-myc rearrangement determine size and histologic grade of hepatic tumors. Hepatology 2004, 39, 1008–1016. [Google Scholar] [CrossRef]
- Korba, B.E.; Wells, F.V.; Baldwin, B.; Cote, P.J.; Tennant, B.C.; Popper, H.; Gerin, J.L. Hepatocellular carcinoma in woodchuck hepatitis virus-infected woodchucks: Presence of viral DNA in tumor tissue from chronic carriers and animals serologically recovered from acute infections. Hepatology 1989, 9, 461–470. [Google Scholar] [CrossRef]
- Bijnsdorp, I.V.; Peters, G.J.; Temmink, O.H.; Fukushima, M.; Kruyt, F.A. Differential activation of cell death and autophagy results in an increased cytotoxic potential for trifluorothymidine compared to 5-fluorouracil in colon cancer cells. Int. J. Cancer 2010, 126, 2457–2468. [Google Scholar] [CrossRef]
- Al-Kali, A.; Gandhi, V.; Ayoubi, M.; Keating, M.; Ravandi, F. Forodesine: Review of preclinical and clinical data. Future Oncol. 2010, 6, 1211–1217. [Google Scholar] [CrossRef]
- Makita, S.; Maeshima, A.M.; Maruyama, D.; Izutsu, K.; Tobinai, K. Forodesine in the treatment of relapsed/refractory peripheral T-cell lymphoma: An evidence-based review. Onco. Targets Ther. 2018, 11, 2287–2293. [Google Scholar] [CrossRef]
- Stewart, C.F.; Fleming, R.A.; Germain, B.F.; Seleznick, M.J.; Evans, W.E. Aspirin alters methotrexate disposition in rheumatoid arthritis patients. Arthritis Rheum. 1991, 34, 1514–1520. [Google Scholar] [CrossRef]
- Qian, M.X.; Finco, T.S.; Mehta, M.; Viswanathan, C.T.; Gallo, J.M. Pharmacokinetic evaluation of drug interactions with zidovudine. I: Probenecid and zidovudine in monkeys’. J. Pharm. Sci. 1991, 80, 1007–1011. [Google Scholar]
- Wu, B.; Kulkarni, K.; Basu, S.; Zhang, S.; Hu, M. First-pass metabolism via UDP-glucuronosyltransferase: A barrier to oral bioavailability of phenolics. J. Pharm. Sci. 2011, 100, 3655–3681. [Google Scholar] [CrossRef]
- Kelley, L.A.; Mezulis, S.; Yates, C.M.; Wass, M.N.; Sternberg, M.J. The Phyre2 web portal for protein modeling, prediction and analysis. Nat. Protoc. 2015, 10, 845–858. [Google Scholar] [CrossRef] [Green Version]
- Jeng, L.B.; Changlai, S.P.; Shen, Y.Y.; Lin, C.C.; Tsai, C.H.; Kao, C.H. Limited value of 18F-2-deoxyglucose positron emission tomography to detect hepatocellular carcinoma in hepatitis B virus carriers. Hepato-gastroenterology 2003, 50, 2154–2156. [Google Scholar]
- Schwarzenberg, J.; Radu, C.G.; Benz, M.; Fueger, B.; Tran, A.Q.; Phelps, M.E.; Witte, O.N.; Satyamurthy, N.; Czernin, J.; Schiepers, C. Human biodistribution and radiation dosimetry of novel PET probes targeting the deoxyribonucleoside salvage pathway. Eur. J. Nucl. Med. Mol. Imaging 2011, 38, 711–721. [Google Scholar] [CrossRef]
- Radu, C.G.; Shu, C.J.; Nair-Gill, E.; Shelly, S.M.; Barrio, J.R.; Satyamurthy, N.; Phelps, M.E.; Witte, O.N. Molecular imaging of lymphoid organs and immune activation by positron emission tomography with a new [18F]-labeled 2’-deoxycytidine analog. Nat. Med. 2008, 14, 783–788. [Google Scholar] [CrossRef]
- Leung, G.P.; Tse, C.M. The role of mitochondrial and plasma membrane nucleoside transporters in drug toxicity. Expert Opin. Drug Metab. Toxicol. 2007, 3, 705–718. [Google Scholar] [CrossRef]
- McGregor, B.A.; Brown, A.W.; Osswald, M.B.; Savona, M.R. The use of higher dose clofarabine in adults with relapsed acute lymphoblastic leukemia. Am. J. Hematol. 2009, 84, 228–230. [Google Scholar] [CrossRef]
- Gandhi, V.; Kantarjian, H.; Faderl, S.; Bonate, P.; Du, M.; Ayres, M.; Rios, M.B.; Keating, M.J.; Plunkett, W. Pharmacokinetics and pharmacodynamics of plasma clofarabine and cellular clofarabine triphosphate in patients with acute leukemias. Clin. Cancer Res. 2003, 9, 6335–6342. [Google Scholar]
- Balakrishnan, K.; Ravandi, F.; Bantia, S.; Franklin, A.; Gandhi, V. Preclinical and clinical evaluation of forodesine in pediatric and adult B-cell acute lymphoblastic leukemia. Clin. Lymphoma Myeloma Leuk. 2013, 13, 458–466. [Google Scholar] [CrossRef]
- Uchaipichat, V.; Mackenzie, P.I.; Guo, X.H.; Gardner-Stephen, D.; Galetin, A.; Houston, J.B.; Miners, J.O. Human udp-glucuronosyltransferases: Isoform selectivity and kinetics of 4-methylumbelliferone and 1-naphthol glucuronidation, effects of organic solvents, and inhibition by diclofenac and probenecid. Drug Metab. Dispos. Biol. Fate Chem. 2004, 32, 413–423. [Google Scholar] [CrossRef]
- Love, M.I.; Huber, W.; Anders, S. Moderated estimation of fold change and dispersion for RNA-seq data with DESeq2. Genome Biol. 2014, 15, 550. [Google Scholar] [CrossRef] [Green Version]
- Fletcher, S.P.; Chin, D.J.; Ji, Y.; Iniguez, A.L.; Taillon, B.; Swinney, D.C.; Ravindran, P.; Cheng, D.T.; Bitter, H.; Lopatin, U.; et al. Transcriptomic analysis of the woodchuck model of chronic hepatitis B. Hepatology 2012, 56, 820–830. [Google Scholar] [CrossRef] [Green Version]
- Julyan, P.J.; Taylor, J.H.; Hastings, D.L.; Williams, H.A.; Zweit, J. SUVpeak: A new parameter for quantification of uptake in FDG PET. Nucl. Med. Commun. 2004, 25, 407. [Google Scholar] [CrossRef]
- Wahl, R.L.; Jacene, H.; Kasamon, Y.; Lodge, M.A. From RECIST to PERCIST: Evolving Considerations for PET response criteria in solid tumors. J. Nucl. Med. 2009, 50 (Suppl 1), 122S–150S. [Google Scholar] [CrossRef]
- Bierau, J.; Leen, R.; Gennip, A.H.; Caron, H.N.; Kuilenburg, A.B. Determination of the deoxycytidine kinase activity in cell homogenates with a non-radiochemical assay using reversed-phase high performance liquid chromatography; Identification of a novel metabolite of 2-chlorodeoxyadenosine. J. Chromatography 2004, 805, 339–346. [Google Scholar]
- Hall, P.A.; Levison, D.A.; Woods, A.L.; Yu, C.C.; Kellock, D.B.; Watkins, J.A.; Barnes, D.M.; Gillett, C.E.; Camplejohn, R.; Dover, R.; et al. Proliferating cell nuclear antigen (PCNA) immunolocalization in paraffin sections: An index of cell proliferation with evidence of deregulated expression in some neoplasms. J. Pathology 1990, 162, 285–294. [Google Scholar] [CrossRef]


| Transporters | RNA-Seq (Human) | Microarray (Woodchuck) | ||
|---|---|---|---|---|
| log2FC | adj. p-Value | log2FC | adj. p-Value | |
| ENT1 (SLC29A1) 1 | 0.73183556 | 8.55E–07 | N/A | N/A |
| ENT2 (SLC29A2) | 0.97080408 | 2.76E–10 | 0.3009289 | 4.31E–02 |
| CNT2 (SLC28A2) 2 | 0.04387712 | 9.06E–01 | 1.0875916 | 5.49E–08 |
| CNT3 (SLC28A3) | −1.0067800 | 2.21E–02 | −1.086378 | 2.14E–07 |
| UGTs | RNA-Seq (Human) | Microarray (Woodchuck) | ||||
|---|---|---|---|---|---|---|
| liver | HCC | adj. p-Value | liver | HCC | adj. p-Value | |
| UGT1A1 1 | 8801.711867 | 3533.469471 | 1.45163E–05 | 13.62426111 | 13.13745641 | 4.23181E–06 |
| UGT1A9 2 | 2466.358055 | 1734.905503 | 0.142498018 | 13.55701481 | 13.50425897 | 0.673895776 |
| UGT2B4 3 | 45576.22225 | 41455.97744 | 0.589224659 | 13.79634444 | 13.15938462 | 1.90991E–06 |
| UGT2B15 4 | 19323.67142 | 12831.68579 | 0.035838247 | 11.81149 | 10.58412 | 3.53358E–15 |
© 2019 by the authors. Licensee MDPI, Basel, Switzerland. This article is an open access article distributed under the terms and conditions of the Creative Commons Attribution (CC BY) license (http://creativecommons.org/licenses/by/4.0/).
Share and Cite
Sergeeva, O.; Kepe, V.; Zhang, Y.; Miller-Atkins, G.A.; Keynon, J.D.; Iyer, R.; Sexton, S.; Awadallah, A.; Xin, W.; Saunthararajah, Y.; et al. [18F] Clofarabine for PET Imaging of Hepatocellular Carcinoma. Cancers 2019, 11, 1748. https://doi.org/10.3390/cancers11111748
Sergeeva O, Kepe V, Zhang Y, Miller-Atkins GA, Keynon JD, Iyer R, Sexton S, Awadallah A, Xin W, Saunthararajah Y, et al. [18F] Clofarabine for PET Imaging of Hepatocellular Carcinoma. Cancers. 2019; 11(11):1748. https://doi.org/10.3390/cancers11111748
Chicago/Turabian StyleSergeeva, Olga, Vladimir Kepe, Yifan Zhang, Galen A. Miller-Atkins, Jonathan D. Keynon, Renuka Iyer, Sandra Sexton, Amad Awadallah, Wei Xin, Yogen Saunthararajah, and et al. 2019. "[18F] Clofarabine for PET Imaging of Hepatocellular Carcinoma" Cancers 11, no. 11: 1748. https://doi.org/10.3390/cancers11111748