MicroRNAs Which Can Prognosticate Aggressiveness of Bladder Cancer

 , ,
, , 
Abstract
1. Introduction
2. Materials and Methods
3. Data Analysis
4. Results
5. Discussion
6. Conclusions
Supplementary Materials
Author Contributions
Funding
Acknowledgments
Conflicts of Interest
References
- Cumberbatch, M.G.K.; Jubber, I.; Black, P.C.; Esperto, F.; Figueroa, J.D.; Kamat, A.M.; Kiemeney, L.; Lotan, Y.; Pang, K.; Silverman, D.T.; et al. Epidemiology of Bladder Cancer: A Systematic Review and Contemporary Update of Risk Factors in 2018. Eur. Urol. 2018, 74, 784–795. [Google Scholar] [CrossRef]
- Hurst, C.D.; Knowles, M.A. Bladder cancer: Multi-omic profiling refines the molecular view. Nat. Rev. Clin. Oncol. 2018, 15, 203–204. [Google Scholar] [CrossRef]
- Klaassen, Z.; Kamat, A.M.; Kassouf, W.; Gontero, P.; Villavicencio, H.; Bellmunt, J.; Van Rhijn, B.W.; Hartmann, A.; Catto, J.W.; Kulkarni, G.S. Treatment Strategy for Newly Diagnosed T1 High-grade Bladder Urothelial Carcinoma: New Insights and Updated Recommendations. Eur. Urol. 2018, 74, 597–608. [Google Scholar] [CrossRef]
- Lin-Brande, M.; Pearce, S.M.; Ashrafi, A.N.; Nazemi, A.; Burg, M.L.; Ghodoussipour, S.; Miranda, G.; Djaladat, H.; Schuckman, A.; Daneshmand, S. Assessing the Impact of Time to Cystectomy for Variant Histology of Urothelial Bladder Cancer. Urology 2019. [Google Scholar] [CrossRef]
- Psutka, S.P.; Barocas, D.A.; Catto, J.W.F.; Gore, J.L.; Lee, C.T.; Morgan, T.M.; Master, V.A.; Necchi, A.; Rouprêt, M.; Boorjian, S.A. Staging the Host: Personalizing Risk Assessment for Radical Cystectomy Patients. Eur. Urol. Oncol. 2018, 1, 292–304. [Google Scholar] [CrossRef]
- Palou, J.; Brausi, M.; Catto, J.W.F. Management of Patients with Normal Cystoscopy but Positive Cytology or Urine Markers. Eur. Urol. Oncol. 2019. [Google Scholar] [CrossRef]
- Sloan, F.A.; Yashkin, A.P.; Akushevich, I.; Inman, B.A. The Cost to Medicare of Bladder Cancer Care. Eur. Urol. Oncol. 2019. [Google Scholar] [CrossRef]
- Guancial, E.A.; Bellmut, J.; Yeh, S.; Rosenberg, J.E.; Berman, D.M. The evolving understanding of microRNA in bladder cancer. Urol. Oncol. 2014, 32, e31–e41. [Google Scholar] [CrossRef]
- Li, Q.; Wang, H.; Peng, H.; Huang, Q.; Huyan, T.; Huang, Q.; Yang, H.; Shi, J. MicroRNAs: Key Players in Bladder Cancer. Mol. Diagn. Ther. 2019. [Google Scholar] [CrossRef]
- Fang, Z.; Dai, W.; Wang, X.; Chen, W.; Shen, C.; Ye, G.; Li, L. Circulating miR-205: A promissing biomarker for detection and prognosis evaluation of bladder cancer. Tumor. Biol. 2016, 37, 8075–8082. [Google Scholar] [CrossRef]
- Miah, S.; Dudziec, E.; Dryton, R.M.; Zlotta, A.R.; Morgan, S.L.; Rosario, D.J.; Hamdy, F.C.; Catto, J.W.F. An evaluation of urinary micro RNA reveals a high sensitivity for bladder cancer. Br. J. Cancer 2012, 107, 123–128. [Google Scholar] [CrossRef]
- Zhou, B.; Guo, R. Integrative analysis of genomic and clinical data reveals intrinsic characteristics of bladder urothelial carcinoma progression. Genes 2019, 10, 464. [Google Scholar] [CrossRef]
- Jensen, S.G.; Lamy, P.; Rasmussen, M.H.; Ostenfeld, M.S.; Dyrskjøt, L.; Ørntoft, T.F.; Andersen, C.L. Evaluation of two commercial global miRNA expression profiling platforms for detection of less abundant miRNAs. BMC Genom. 2011, 12, 435. [Google Scholar] [CrossRef]
- Enokida, H.; Yoshino, H.; Matsushita, R.; Nakagawa, M. The role of microRNAs in bladder cancer. Investig. Clin. Urol. 2016, 57 (Suppl. 1), S60–S76. [Google Scholar] [CrossRef]
- Lee, J.Y.; Ryu, D.S.; Kim, W.J.; Kim, S.J. Aberrantly expressed microRNAs in the context of bladder tumorigenesis. Investig. Clin. Urol. 2016, 57 (Suppl. 1), S52–S59. [Google Scholar] [CrossRef]
- Sobin, L.H.; Gospodarowicz, M.K.; Wittekind, C.; IUAC (Eds.) TNM Classification of Malignant Tumors, 6th ed.; Springer: Berlin/Heidelberg, Germany, 2002. [Google Scholar]
- Compérat, E.M.; Burger, M.; Gontero, P.; Mostafid, A.H.; Palou, J.; Rouprêt, M.; van Rhijn, B.W.G.; Shariat, S.F.; Sylvester, R.J.; Zigeuner, R.; et al. Grading of Urothelial Carcinoma and The New “World Health Organisation Classification of Tumours of the Urinary System and Male Genital Organs 2016”. Eur. Urol. Focus 2018. [CrossRef]
- Bustin, S.A.; Benes, V.; Garson, J.A.; Huggett, J.; Kubista, M.; Mueller, R.; Nolan, T.; Pfaffl, M.W.; Shipley, G.L.; Vandesompele, J.; et al. The MIQE guidelines: Minimum information for publication of quantitative real-time PCR experiments. Clin. Chem. 2009, 55, 611–622. [Google Scholar] [CrossRef]
- Xiayu, R.; Huang, X.; Zhou, Z.; Lin, X. An improvement of the 2˅(-delta delta CT) method for quantitative real-time polymerase chain reaction data analysis. Biostat. Bioinform. Biomath. 2013, 3, 71–85. [Google Scholar]
- Schwarzenbach, H.; da Silva, A.M.; Calin, G.; Pantel, K. Data normalization strategies for microRNA quantification. Clin. Chem. 2015, 61, 1333–1342. [Google Scholar] [CrossRef]
- van Kessel, K.E.M.; van der Keur, K.A.; Dyrskjøt, L.; Algaba, F.; Welvaart, N.Y.; Beukers, W.; Segersten, U.; Keck, B.; Maurer, T.; Simic, T.; et al. Molecular Markers Increase Precision of the European Association of Urology Non-Muscle-Invasive Bladder Cancer Progression Risk Groups. Clin. Cancer Res. 2018, 24, 1586–1593. [Google Scholar] [CrossRef]
- Bruchbacher, A.; Soria, F.; Hassler, M.; Shariat, S.F.; D’Andrea, D. Tissue biomarkers in nonmuscle-invasivebladder cancer: Any role in clinical practice? Curr. Opin. Urol. 2018, 28, 584–590. [Google Scholar] [CrossRef]
- Soria, F.; Krabbe, L.M.; Todenhöfer, T.; Dobruch, J.; Mitra, A.P.; Inman, B.A.; Gust, K.M.; Lotan, Y.; Shariat, S.F. Molecular markers in bladder cancer. World J. Urol. 2019, 37, 31–40. [Google Scholar] [CrossRef]
- Miyake, M.; Owari, T.; Hori, S.; Fujimoto, K. Significant lack of urine-based biomarkers to replace cystoscopy for the surveillance of non-muscle invasive bladder cancer. Transl. Androl. Urol. 2019, 8 (Suppl. 3), S332–S334. [Google Scholar] [CrossRef]
- Lee, J.Y.; Yun, S.J.; Jeong, P.; Piao, X.-M.; Kim, Y.-H.; Kim, J.; Subramaniyam, S.; Byun, Y.J.; Kang, H.W.; Seo, S.P.; et al. Identification of differentially expressed miRNAs and miRNA-targeted genes in bladder cancer. Oncotarget 2018, 9, 27656–27766. [Google Scholar] [CrossRef]
- Ratert, N.; Meyer, H.A.; Jung, M.; Lioudmer, P.; Mollenkopf, H.; Wagner, I.; Miller, K.; Kilic, E.; Erbersdobler, A.; Weikert, S.; et al. miRNA profiling identifies candidate miRNAs for bladder cancerdiagnosis and clinical outcome. J. Mol. Diagn. 2013, 15. [Google Scholar] [CrossRef]
- Ratert, N.; Meyer, H.A.; Jung, M.; Mollenkopf, H.-J.; Wagner, I.; Miller, K.; Kilic, E.; Erbersdobler, A.; Weikert, S.; Jung, K. Reference miRNAs for miRNAome analysis of urothelial carcinomas. PLoS ONE 2012, 7, e39309. [Google Scholar] [CrossRef]
- Peltier, H.J.; Latham, G.J. Normalization of microRNA expression levels in quantitative RT-PCR assays: Identification of suitable reference RNA targets in normal and cancerous human solid tissues. RNA 2008, 14, 844–852. [Google Scholar] [CrossRef]
- Hofbauer, S.L.; de Martino, M.; Lucca, I.; Haitel, A.; Susani, M.; Shariat, S.F.; Klatte, T. A urinary microRNA (miR) signature for diagnosis of bladder cancer. Urol. Oncol. 2018, 36, 531.e1–531.e8. [Google Scholar] [CrossRef]
- Boisen, M.K.; Dehlendorff, C.; Linnemann, D.; Schultz, N.A.; Jensen, B.V.; Hogdal, E.V.S.; Johansen, J.S. MicroRNA expression in formalin-fixed paraffin-embedded cancer tissue: Identifying reference microRNAs and variability. BMC Cancer 2015, 15, 1024. [Google Scholar] [CrossRef]
- Parvaee, P.; Sarmadian, H.; Khansarinejad, B.; Amini, M.; Mondanizadeh, M. Plasma level of microRNAs, miR-107, miR-194 and miR-210 as potential biomarkers for diagnosis intestinal-type gastric cancer in human. Asian Pac. J. Cancer Prev. 2019, 20, 1421–1426. [Google Scholar] [CrossRef]
- Lenherr, S.; Tsai, S.; Neto, B.S.; Sullivan, T.B.; Cimmino, C.B.; Logvinenko, T.; Gee, J.; Huang, W.; Libertino, J.A.; Summerhayes, I.C.; et al. MicroRNA expression profile identifies high grade, non-muscle-invasive bladder tumors at elevated risk to progress to an invasive phenotype. Genes 2017, 8, 77. [Google Scholar] [CrossRef]
- Dip, N.; Reis, S.T.; Timoszczuk, L.S.; Viana, N.I.; Piantino, C.B.; Morais, D.R.; Moura, C.M.; Abe, D.K.; Silva, I.A.; Srougi, M.; et al. Stage, grade and behavior of bladder urothelial carcinoma defined by the microRNA expression profile. J. Urol. 2012, 188, 1951–1956. [Google Scholar] [CrossRef]
- Ecke, T.H.; Stier, K.; Weickmann, S.; Zhao, Z.; Buckendahl, L.; Stephan, C.; Kilic, E.; Jung, K. miR-199a-3p and miR-214-3p improve the overall survival prediction of muscle-invasive bladder cancer patients after radical cystectomy. Cancer Med. 2017, 6, 2252–2262. [Google Scholar] [CrossRef]
- Zhang, H.; Jiang, M.; Liu, Q.; Han, Z.; Zhao, Y.; Ji, S. mir-145-5p inhibits the proliferation and migration of bladder cancer cells by targeting TAGLN2. Oncol. Lett. 2018, 16, 6355–6360. [Google Scholar] [CrossRef]
- Li, D.; Hao, X.; Song, Y. An integrated analysis of key microRNAs, regulatory pathways and clinical relevance in bladder cancer. Onco Targets Ther. 2018, 11, 3075–3085. [Google Scholar] [CrossRef]
- Inamoto, T.; Uehara, H.; Akao, Y.; Ibuki, N.; Komura, K.; Takahara, K.; Takai, T.; Uchimoto, T.; Saito, K.; Tanda, N.; et al. A Panel of MicroRNA Signature as a Tool for Predicting Survival of Patients with Urothelial Carcinoma of the Bladder. Dis. Markers 2018, 2018, 5468672. [Google Scholar] [CrossRef]
- Pignot, G.; Cizeron-Clairac, G.; Vacher, S.; Susini, A.; Tozlu, S.; Vieillefond, A.; Zerbib, M.; Lidereau, R.; Debre, B.; Amsellem-Ouazana, D. microRNA expression profile in a large series of bladder cancer tumors: Identyfication of 3-miRNA signature associated with aggressiveness of muscle-invasive bladder cancer. Int. J. Cancer 2013, 132, 2479–2491. [Google Scholar] [CrossRef]
- Urquidi, V.; Netherton, M.; Gomes-Giacoia, E.; Serie, D.J.; Eckel-Passow, J.; Rosser, C.J.; Goodison, S. A microRNA biomarker panel for the non-invasive detection of bladder cancer. Oncotarget 2016, 7, 66290–86299. [Google Scholar] [CrossRef]
- Armstromg, D.A.; Green, B.B.; Seigne, J.D.; Schned, J.D.; Marsit, C.J. MicroRNA molecular profiling from matched tumor and bio-fluids in bladder cancer. Mol. Cancer 2015, 14, 194. [Google Scholar] [CrossRef]
- Baumgart, S.; Holters, S.; Ohlmann, C.H.; Bohle, R.; Stockle, M.; Ostenfeld, M.S.; Dyrskjøt, L.; Junker, K.; Heinzelmann, J. Exosome of invasive urothelial carcinoma cells are characterized by a specific miRNA expression signature. Oncotarget 2017, 8, 58278–58291. [Google Scholar] [CrossRef]
- Egawa, H.; Jingushi, K.; Hirono, T.; Ueda, Y.; Kitae, K.; Nakata, W.; Fujita, K.; Uemura, M.; Nonomura, N.; Tsujikawa, K. The. miR-130 family promotes cell migration and invasion inbladder cancerthrough FAK and Akt phosphorylation by regulating PTEN. Sci. Rep. 2016, 6, 20574. [Google Scholar] [CrossRef]
- Lv, M.; Zhong, Z.; Chi, H.; Huang, M.; Jiang, R.; Chen, J. Genome-Wide Screen of miRNAs and Targeting mRNAs Reveals the Negatively Regulatory Effect of miR-130b-3p on PTEN by PI3K and Integrin β1 Signaling Pathways in Bladder Carcinoma. Int. J. Mol. Sci. 2016, 18, 78. [Google Scholar] [CrossRef]
- Liu, X.; Kong, C.; Zhang, Z. miR-130bpromotesbladder cancer cell proliferation, migration and invasion by targeting VGLL4. Oncol. Rep. 2018, 39, 2324–2332. [Google Scholar] [CrossRef]


| FCmiR-145 | p-Value | FCmiR-21 | p-Value | FCmiR-182 | p-Value | Abnormal Expression 1 | p-Value | Abnormal Expression 2 | p-Value | |||||||
|---|---|---|---|---|---|---|---|---|---|---|---|---|---|---|---|---|
| Clinicopathological Parameters | HE n (%) | LE n (%) | HE n (%) | LE n (%) | HE n (%) | LE n (%) | Yes n (%) | No n (%) | Yes n (%) | No n (%) | ||||||
| Total | 55 | |||||||||||||||
| Sex | ||||||||||||||||
| Female | 4 (7.27%) | 6 (10.91%) | 3 (5.45%) | 7 (12.73%) | 5 (9.09%) | 5 (9.09%) | 7 (12.73%) | 3 (5.45%) | 3 (5.45%) | 7 (12.73%) | ||||||
| Male | 26 (47.27%) | 19 (34.55%) | 0.503 (Y) | 9 (16.36%) | 36 (65.45%) | 0.787 (Y) | 26 (47.27%) | 19 (34.55%) | 0.923 (Y) | 34 (61.82%) | 11 (20%) | 0.971 (Y) | 20 (36.36%) | 25 (45.45%) | 0.629 (Y) | |
| Age at Diagnosis | ||||||||||||||||
| <60 | 2 (3.64%) | 4 (7.27%) | 1 (1.82%) | 5 (9.09%) | 6 (10.91%) | 0 (0%) | 6 (10.91%) | 0 (0%) | 2 (3.64%) | 4 (7.27%) | ||||||
| >60 | 28 (50.91%) | 21 (38.18%) | 0.502 (Y) | 11 (20%) | 38 (69.09%) | 0.841 (Y) | 25 (45.45%) | 24 (43.64%) | 0.064 (Y) | 35 (63.64%) | 14 (25.45%) | 0.308 (Y) | 21 (38.18%) | 28 (50.91%) | 0.994 (Y) | |
| Smoking Status | ||||||||||||||||
| Yes | 23 (41.82%) | 23 (41.82%) | 9 (16.36%) | 37 (67.27%) | 26 (47.27%) | 20 (36.36%) | 34 (61.82%) | 12 (21.82%) | 17 (30.91%) | 29 (52.73%) | ||||||
| No | 7 (12.73%) | 2 (3.64) | 0.244 (Y) | 3 (5.45%) | 6 (10.91%) | 0.636 (Y) | 5 (9.09%) | 4 (7.27%) | 0.753 (Y) | 7 (12.73%) | 2 (3.64%) | 0.861 (Y) | 6 (10.91%) | 3 (5.45%) | 0.199 (Y) | |
| Occupatinal Exposure | ||||||||||||||||
| Yes | 21 (38.18%) | 19 (34.55%) | 6 (10,91%) | 34 (61.82%) | 21 (38.18%) | 19 (34.55%) | 28 (50.91%) | 12 (21.82%) | 15 (27.27%) | 25 (45.45%) | ||||||
| No | 9 (16.36%) | 6 (10.91%) | 0.622 (V) | 6 (10.91%) | 9 (16.36%) | 0.102 (Y) | 10 (18.18%) | 5 (9.09%) | 0.349 | 13 (23.64%) | 2 (3.64%) | 0.359 (Y) | 8 (14.55%) | 7 (12.73%) | 0.293 (V) | |
| Tumour Stage | ||||||||||||||||
| Ta | 9 (16.36%) | 10 (18.18%) | 1 (1.82%) | 18 (32.73%) | 11 (20%) | 8 (14.55%) | 14 (25.45%) | 5 (9.09%) | 6 (10.91%) | 13 (23.64%) | ||||||
| T1 | 10 (18.18%) | 8 (14.55%) | 6 (10.91%) | 12 (21.82%) | 9 (16.36%) | 9 (16.36%) | 13 (23.64%) | 5 (9.09%) | 8 (14.55%) | 10 (18.18%) | ||||||
| T2 | 11 (20%) | 7 (12.73%) | 0.699 | 5 (9.09%) | 13 (23.64%) | 0.089 | 11 (20%) | 7 (12.73%) | 0.786 | 14 (25.45%) | 4 (7.27%) | 0.924 | 9 (16.36%) | 9 (16.36%) | 0.505 | |
| Grade | ||||||||||||||||
| high grade | 13 (23.64%) | 9 (16.36%) | 5 (9.09%) | 17 (30.91%) | 12 (21.82%) | 10 (18.18%) | 16 (29.09%) | 6 (10.91%) | 11 (20%) | 11 (20%) | ||||||
| low grade | 17 (30.91%) | 16 (29.09) | 0.580 | 7 (12.73%) | 26 (47.27%) | 0.841 (Y) | 19 (34.55%) | 14 (25.45%) | 0.826 (V) | 25 (45.45%) | 8 (14.55%) | 0.802 (V) | 12 (21.82%) | 21 (38,18%) | 0.319 (V) | |
| Recurrence | ||||||||||||||||
| Yes | 13 (23.64%) | 13 (23.64%) | 3 (5.45%) | 23 (41.82%) | 16 (29.09%) | 10 (18.18%) | 21 (38.18%) | 5 (9.09%) | 9 (16.36%) | 17 (30.91%) | ||||||
| No | 17 (30.91%) | 12 (21.82%) | 0.521 | 9 (16.36%) | 20 (36.36%) | 0.083 (V) | 15 (27.27%) | 14 (25.45%) | 0.463 | 20 (36.36%) | 9 (16.36%) | 0.320 (V) | 14 (25.45%) | 15 (27.27%) | 0.305 | |
| Progression | ||||||||||||||||
| Yes | 17 (30.91%) | 13 (23.64%) | 7 (12.73%) | 23 (41.82%) | 16 (29.09%) | 14 (25.45%) | 21 (38.18%) | 9 (16.36%) | 14 (25.45%) | 16 (29.09%) | ||||||
| No | 13 (23.64%) | 12 (21.82%) | 0.729 | 5 (9.09%) | 20 (36.36%) | 0.767 (V) | 15 (27.27%) | 10 (18.18%) | 0.619 | 20 (36.36%) | 5 (9.09%) | 0.401 (V) | 9 (16.36%) | 16 (29.09%) | 0.424 | |
| Death | ||||||||||||||||
| Yes | 10 (18.18%) | 7 (12.73%) | 3 (5.45%) | 14 (25.45%) | 9 (16.36%) | 8 (14.55%) | 11 (20%) | 6 (10.91%) | 9 (16.36%) | 8 (14.55%) | ||||||
| No | 20 (36.36%) | 18 (32.73%) | 0.673 (V) | 9 (16.36%) | 29 (52.73%) | 0.882 (Y) | 22 (40%) | 16 (29.09%) | 0.734 | 30 (54.55%) | 8 (14.55%) | 0.432 (Y) | 14 (25.45%) | 24 (43.64%) | 0.267 (V) | |
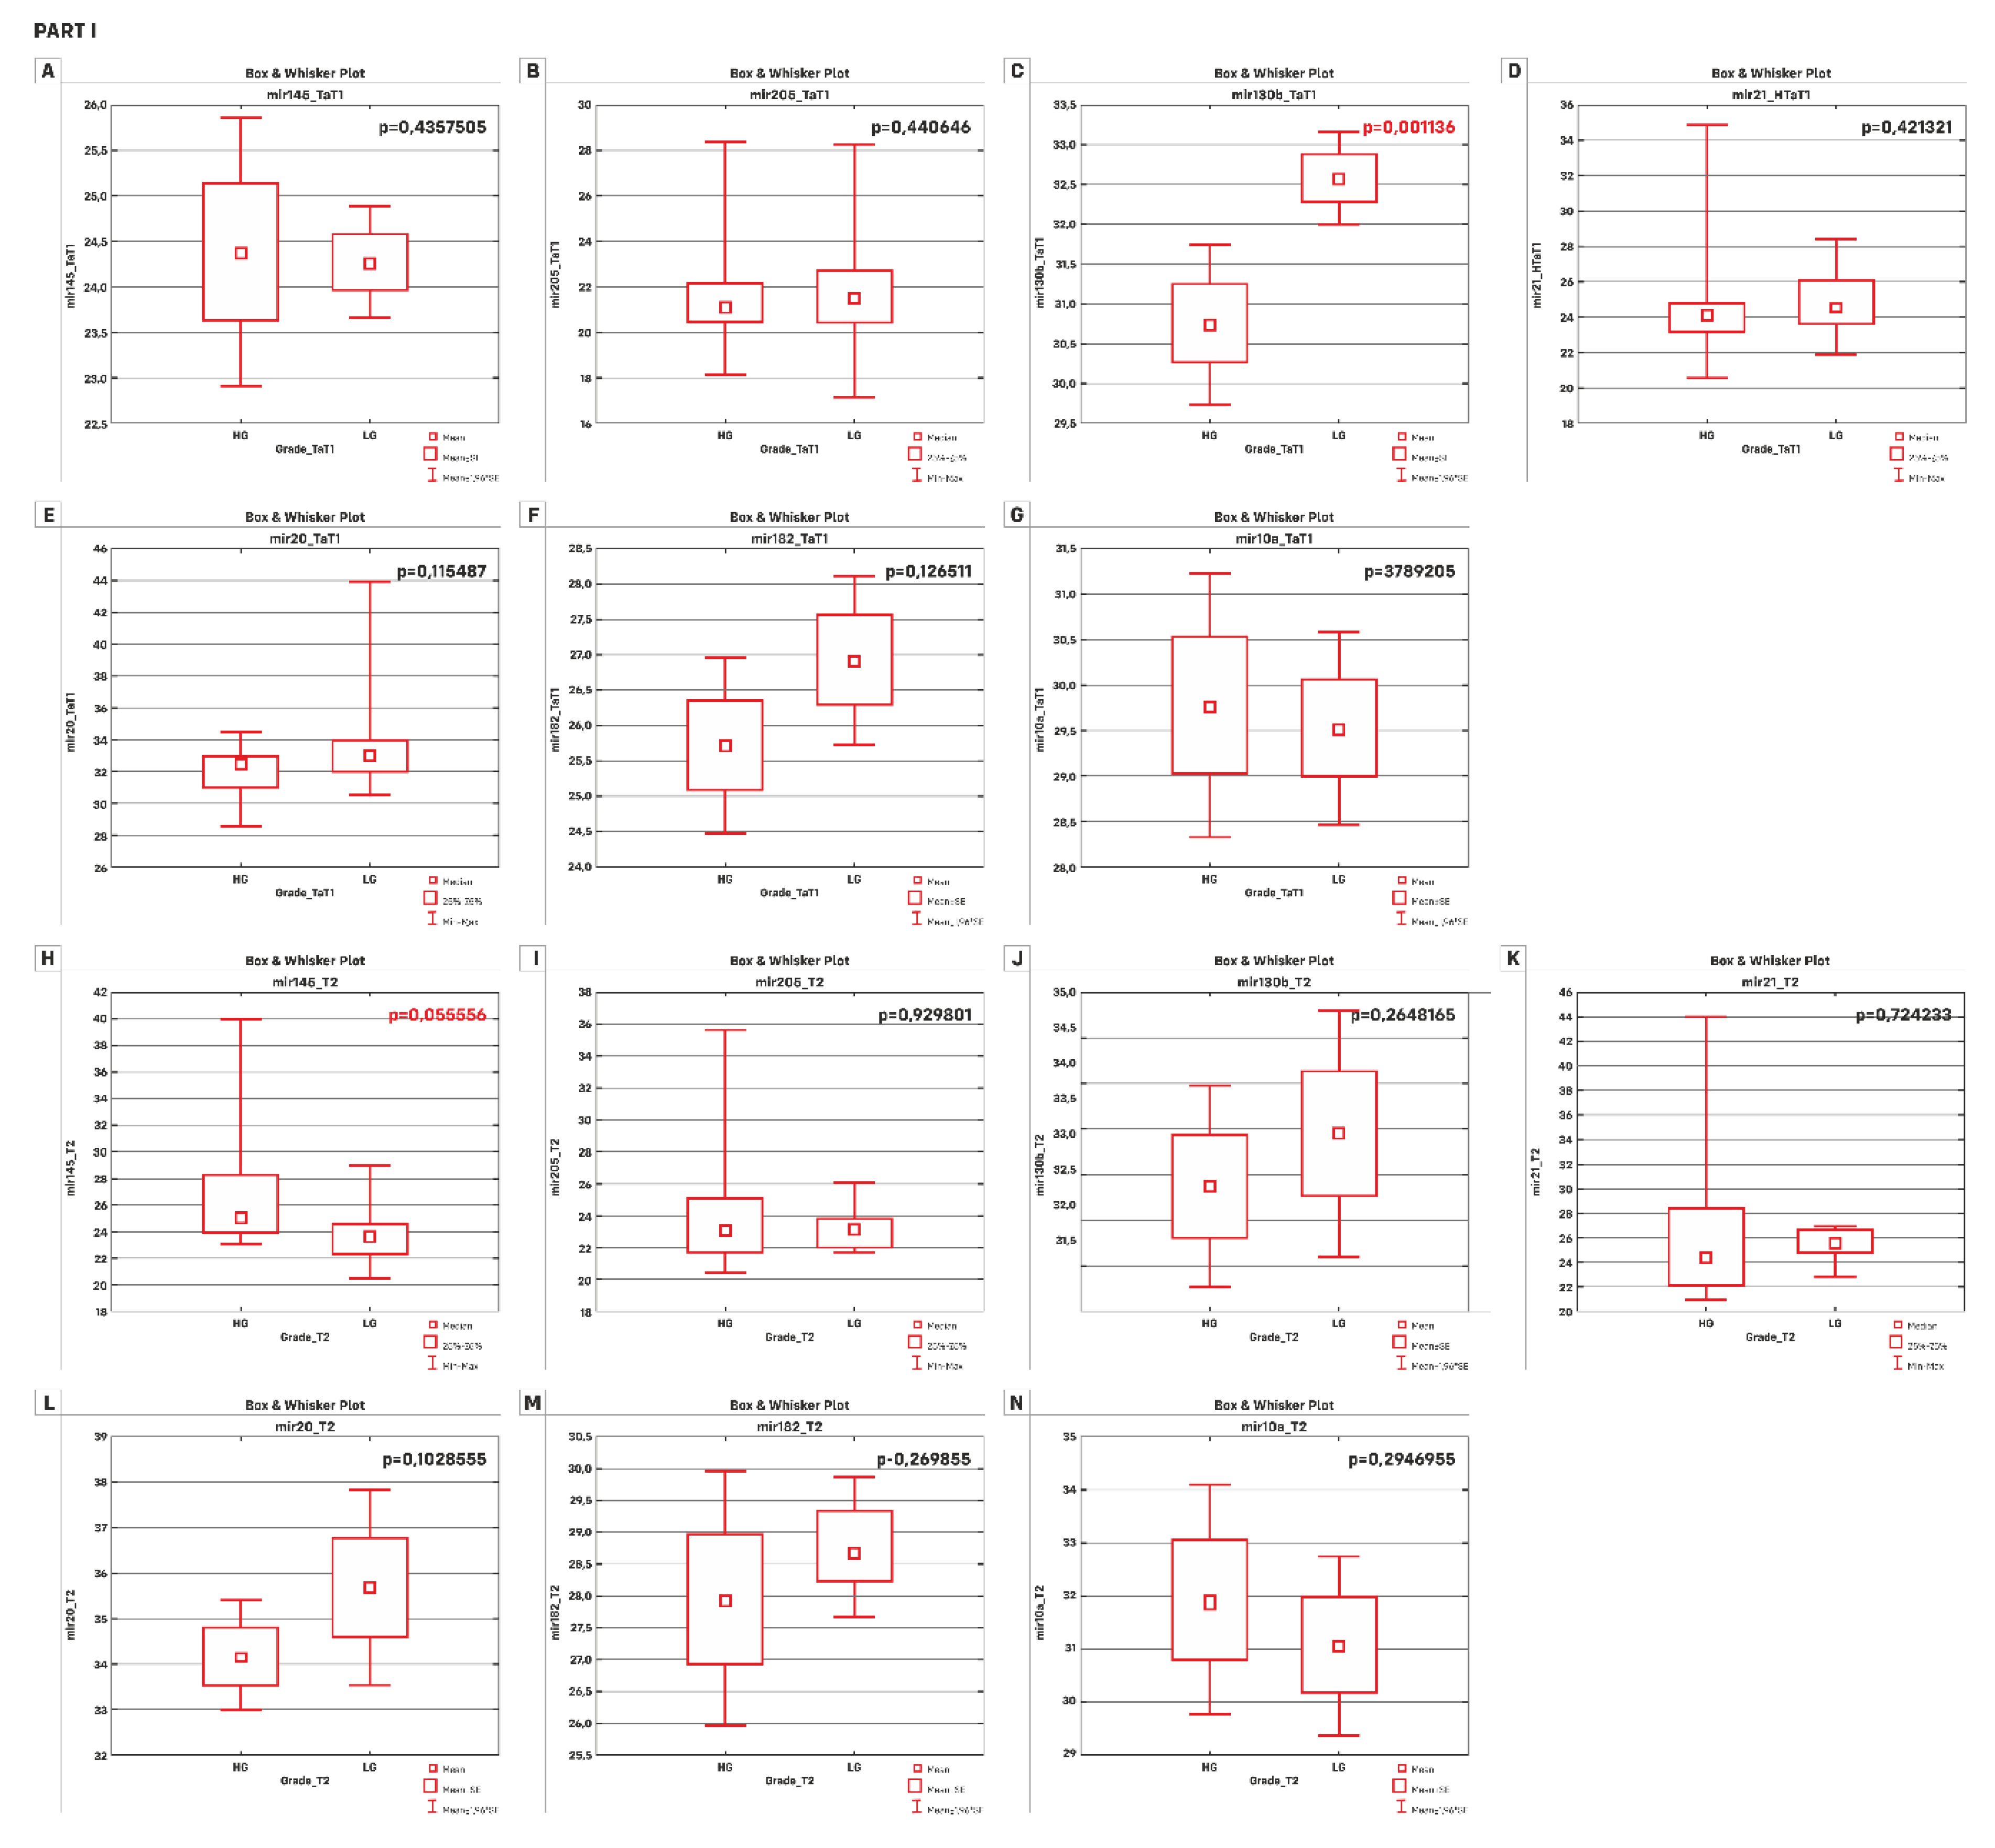
| A) | TaT1 p-value | T2 p-value |
| miR-145-5p | 0.4357505 * | 0.055556 |
| miR-205-5p | 0.440646 | 0.929801 |
| miR-130b-3p | 0.001136 * | 0.2648165 * |
| miR-21-5p | 0.421321 | 0.724233 |
| miR-20a-5p | 0.115487 | 0.1028555 * |
| miR-182-5p | 0.126511 * | 0.269855 * |
| miR-10a-5p | 0.3987205 * | 0.2946955 * |
| B) | HG p-value | LG p-value |
| miR-145-5p | 0.132994 | 0.336568 * |
| miR-205-5p | 0.065169 | 0.030956 * |
| miR-130b-3p | 0.00531 * | 0.138824 * |
| miR-21-5p | 0.606318 | 0.141797 * |
| miR-20a-5p | 0.019231 | 0.038561 |
| miR-182-5p | 0.037793 * | 0.015572 * |
| miR-10a-5p | 0.06102 * | 0.081524 * |
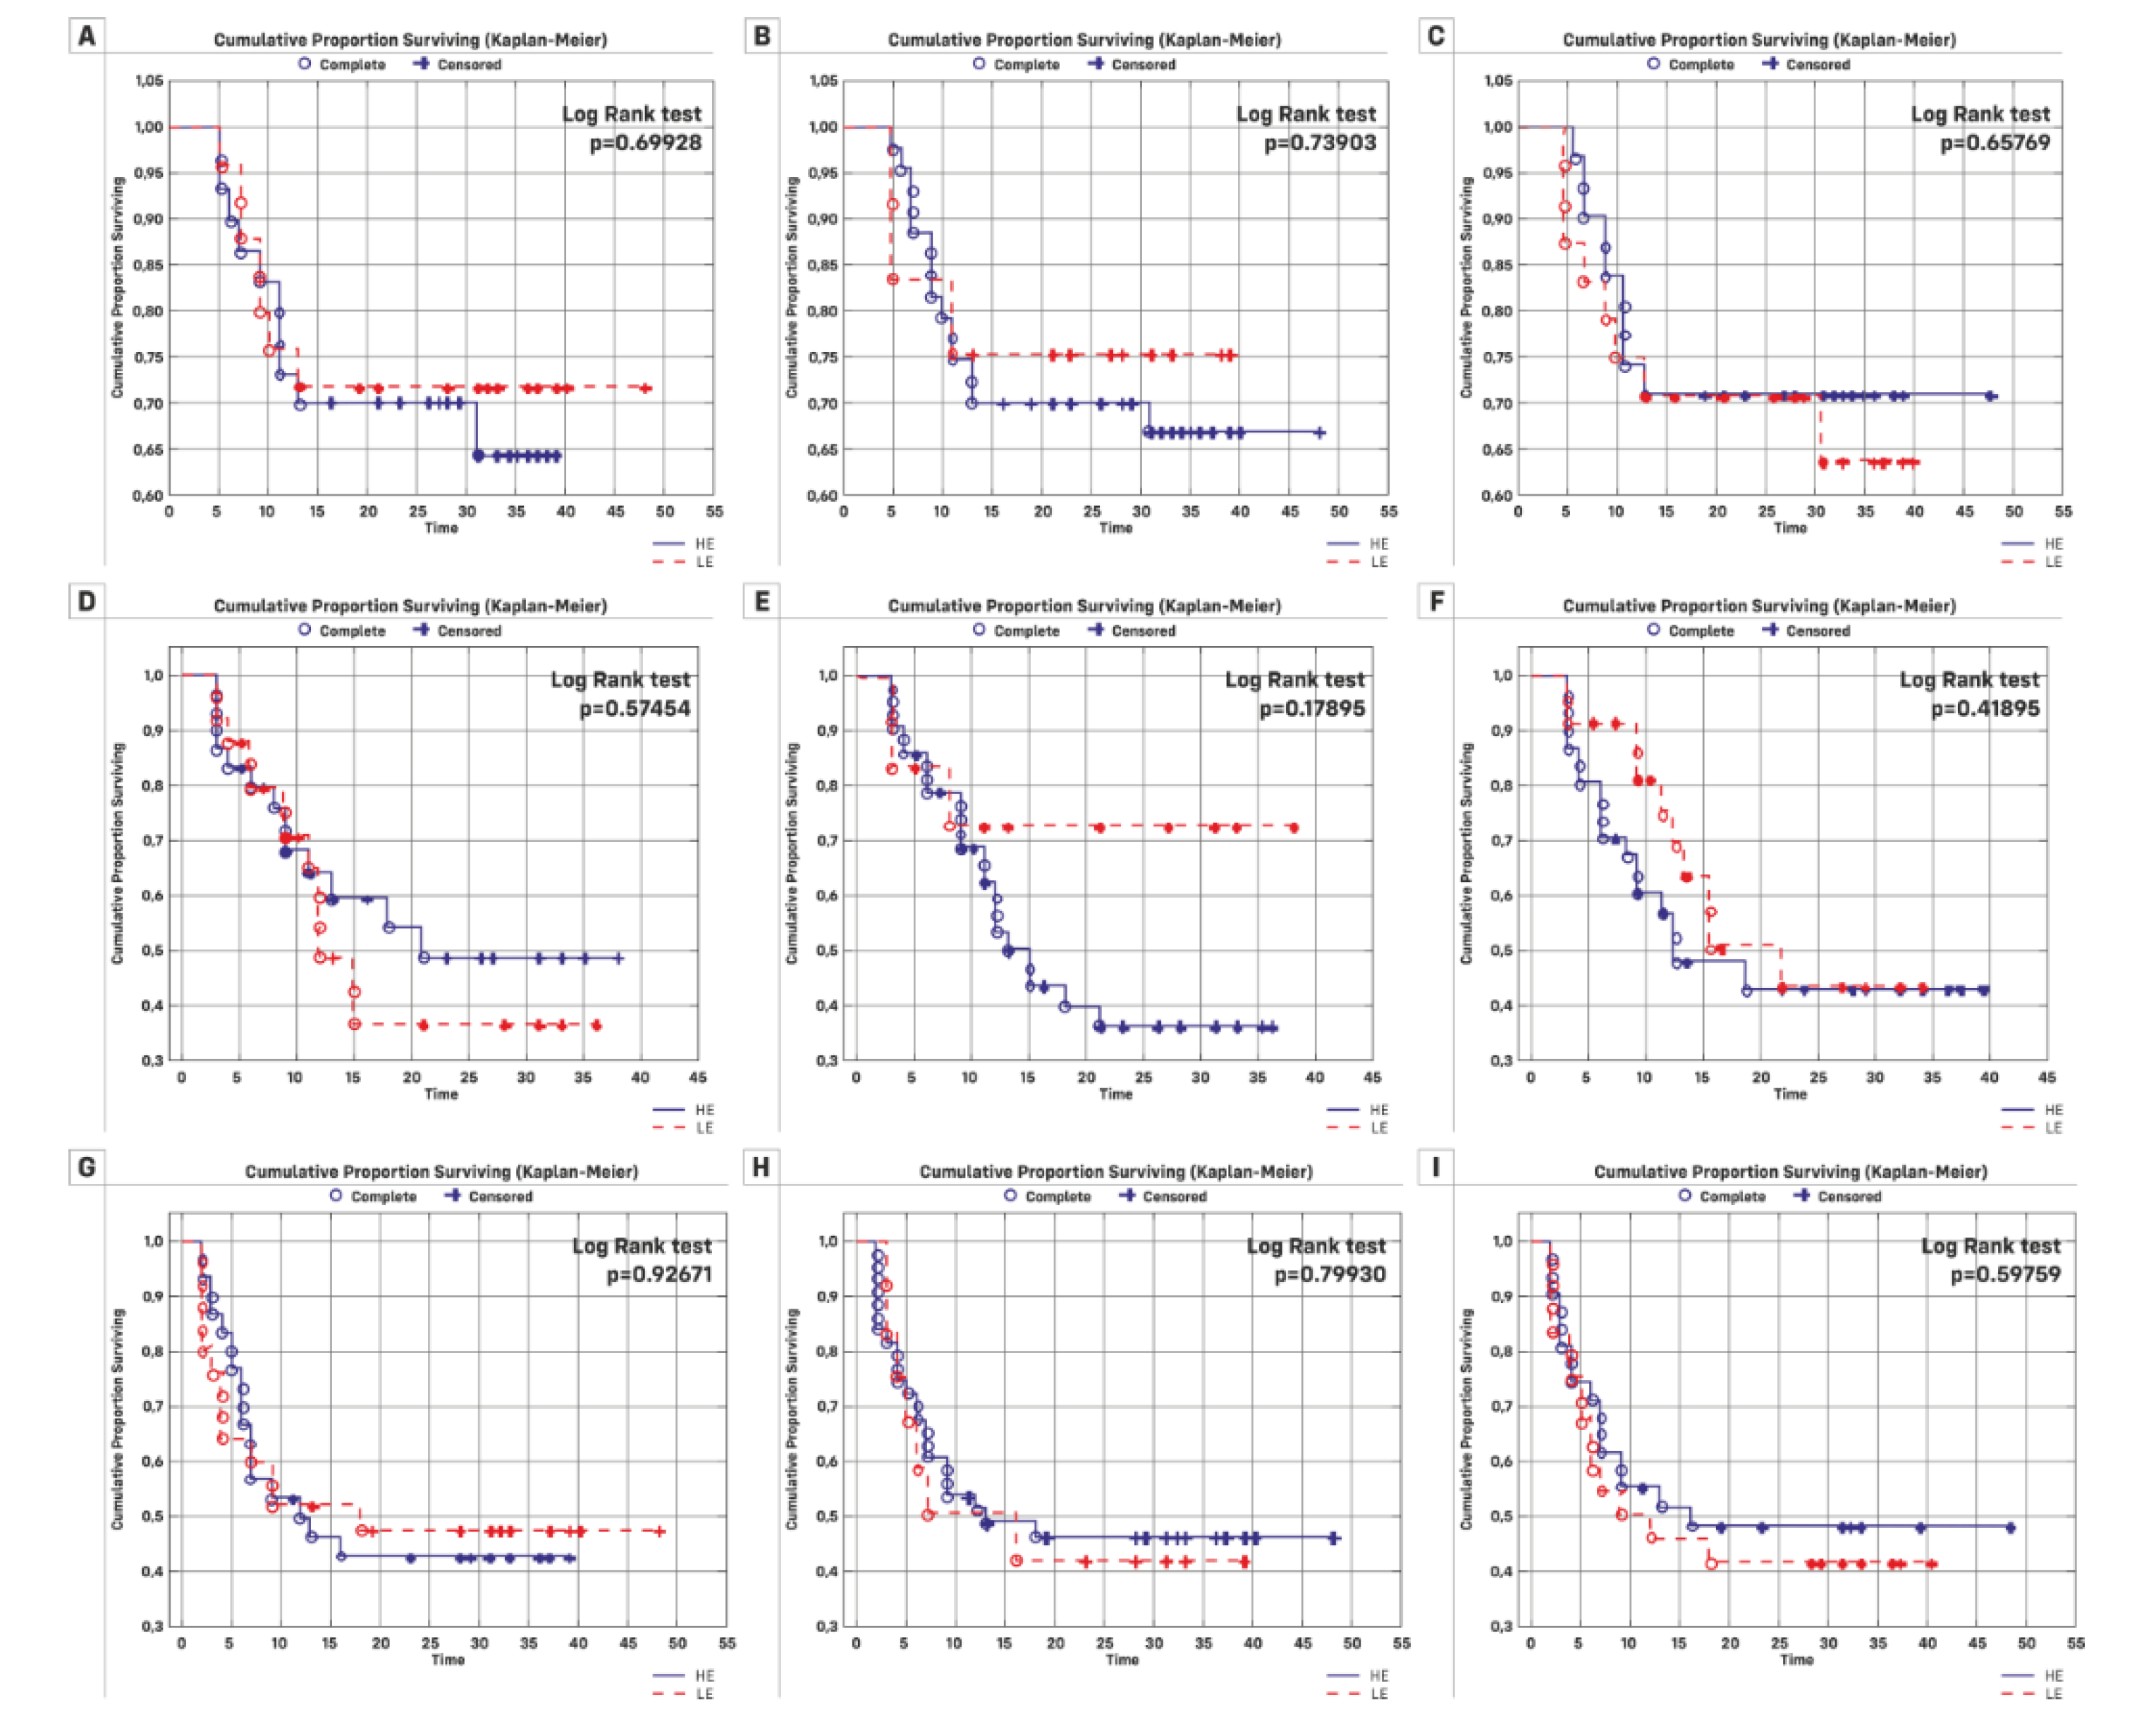
| Kaplan-Meier Analysis | |||||||
|---|---|---|---|---|---|---|---|
| Overall Survival | Recurrence | Progression | |||||
| Overall n (%) | Rate | Log-Rank Value | Rate | Log-Rank Value | Rate | Log-Rank Value | |
| Total | 55 | ||||||
| FCmiR-145 | |||||||
| HE | 30 | 10 | 13 | 17 | |||
| LE | 25 | 7 | 0.6992 | 13 | 0.5745 | 13 | 0.9267 |
| FCmiR-21 | |||||||
| HE | 12 | 3 | 3 | 7 | |||
| LE | 43 | 14 | 0.7390 | 23 | 0.1789 | 7 | 0.7993 |
| FCmiR-182 | |||||||
| HE | 31 | 9 | 16 | 16 | |||
| LE | 24 | 8 | 0.6576 | 10 | 0.4189 | 14 | 0.5976 |
| Total | 55 | ||||||
| Abnormal expression 1 | |||||||
| Yes | 41 | 11 | 21 | 21 | |||
| No | 14 | 6 | 0.2875 | 5 | 0.3499 | 9 | 0.2847 |
| Abnormal expression 2 | |||||||
| Yes | 23 | 9 | 9 | 14 | |||
| No | 32 | 8 | 0.2551 | 17 | 0.6881 | 16 | 0.5205 |
| Overall Survival | Time to Recurrence | Time to Progression | ||||||||||
|---|---|---|---|---|---|---|---|---|---|---|---|---|
| Beta | HR (95% CI) | p-value | p-value for Chi2 | Beta | HR (95% CI) | p-value | p-value for Chi2 | Beta | HR (95% CI) | p-value | p-value for Chi2 | |
| Gender | −0.57 | 0.56 (0.13–2.47) | 0.448 | 0.415 | −0.816 | 0.44 (0.13–1.47) | 0.184 | 0.142 | 0.029 | 1.03 (0.42–2.42) | 0.948 | 0.948 |
| Age at diagnosis | 0.266 | 1.30 (1.17-1.45) | 0.000 | 0.000 | -0.002 | 0.997 (0.99-1.005) | 0.526 | 0.524 | 0.068 | 1.07 (1.02-1.12) | 0.0034 | 0.003 |
| Stage | ||||||||||||
| Ta–T1&T2 | −0.013 | 0.98 (0.36–2.67) | 0.97 | 0.98 | 0.738 | 2.09 (0.97–4.53) | 0.0607 | 0.061 | −1.388 | 0.25 (0.09–0.65) | 0.005 | 0.0013 |
| Ta&T1–T2 | 1.821 | 6.17 (2.25–16.89) | 0.0004 | 0.00028 | −0.766 | 0.46 (0.16–1.35) | 0.159 | 0.126 | 1.109 | 3.03 (1.46–6.26) | 0.0027 | 0.0034 |
| Occupatinal Exposure | 1.12 | 3.08 (0.7–13.47) | 0.135 | 0.087 | −0.669 | 0.51 (0.23–1.13) | 0.097 | 0.108 | 0.874 | 2.39 (0.91–6.28) | 0.075 | 0.052 |
| Grade | 2.85 | 17.36 (3.89–77.41) | 0.00018 | 0.000 | −1.615 | 0.19 (0.06–0.66) | 0.008 | 0.001 | 1.775 | 5.89 (2.59–13.38) | 0.00002 | 0.00001 |
| Smoking Status | 0.37 | 1.45 (0.33–6.37) | 0.619 | 0.603 | 0.101 | 1.11 (0.38–3.21) | 0.852 | 0.85 | −0.07 | 0.93 (0.36–2.43) | 0.885 | 0.886 |
| Recurrence | −1.28 | 0.28 (0.09–0.86) | 0.026 | 0.015 | −2.229 | 0.107 (0.04–0.28) | 0.000008 | 0.00000 | ||||
| Progression | 2.16 | 8.67 (1.97–8.13) | 0.004 | 0.00031 | −1.717 | 0.18 (0.07–0.48) | 0.0006 | 0.00008 | ||||
| FCmiR-145 | 0.0003 | 1.0003 (1.00009–1.0006) | 0.0069 | 0.038 | −0.019 | 0.98 (0.93–1.03) | 0.393 | 0.099 | 0.0001 | 1.0001 (0.99–1.0003) | 0.243 | 0.321 |
| FCmiR-205 | 0.12 | 1.13 (1.03–1.24) | 0.0089 | 0.045 | −0.167 | 0.85 (0.36–1.96) | 0.697 | 0.521 | 0.046 | 1.05 (0.97–1.13) | 0.233 | 0.311 |
| FCmiR-130b | 0.0003 | 0.99 (0.99–1.00) | 0.466 | 0.398 | 0.0003 | 1.0003 (0.99–1.0007) | 0.131 | 0.176 | −0.0002 | 0.99 (0.99–1.00) | 0.484 | 0.437 |
| FCmiR-21 | 0.00009 | 1.00009 (1.000025–1.00015) | 0.0069 | 0.038 | 0.0004 | 1.0000006 (0.98–1.006) | 0.145 | 0.156 | 0.00003 | 1.00003 (0.99–1.00008) | 0.259 | 0.336 |
| FCmiR-20a | −0.00013 | 0.999 (0.999–1.0) | 0.412 | 0.177 | 0.000002 | 1.000002 (1.0–1.000003) | 0.031 | 0.097 | −0.00013 | 0.999 (0.999–1.0) | 0.412 | 0.177 |
| FCmiR-182 | −0.034 | 0.966 (0.87–1.07) | 0.529 | 0.172 | 0.0006 | 1.0006 (0.00004–1.001) | 0.035 | 0.104 | −0.0009 | 0.999 (0.995–1.002) | 0.599 | 0.243 |
| FCmiR-10a | −0.0004 | 0.999 (0.997–1.001) | 0.672 | 0.47 | −0.0004 | 0.999 (0.998–1.0007) | 0.505 | 0.301 | 0.0003 | 1.0003 (0.999–1.0006) | 0.129 | 0.218 |
| Abnormal Expression 1 | −0.5328 | 0.587 (0.217–1.588) | 0.294 | 0.309 | 0.4376 | 1.549 (0.583–4.11) | 0.379 | 0.358 | −0.4315 | 0.649 (0.297–1.42) | 0.279 | 0.295 |
| Abnormal Expression 2 | 0.5419 | 1.719 (0.663–4.459) | 0.265 | 0.265 | −0.1626 | 0.85 (0.378–1.91) | 0.694 | 0.691 | 0.2274 | 1.255 (0.612–2.575) | 0.535 | 0.536 |
| Mann Whitney U Test | BC Group | Subgroups | |||
|---|---|---|---|---|---|
| p-value | HG p-value | LG p-value | Ta p-value | TaT1 p-value | |
| miR-145-5p | 0.000005 | 0.003612 | 0.000002 | 0.000026 | 0.000001 |
| miR-205-5p | 0.000000 | 0.00000 | 0.00000 | 0.000000 | 0.000000 |
| miR-130b-3p | 0.073733 | 0.770102 | 0.011493 | 0.257699 | 0.479923 |
| miR-21-5p | 0.000000 | 0.000004 | 0.000024 | 0.000000 | 0.000000 |
| miR-20-5p | 0.000000 | 0.000001 | 0.000001 | 0.000003 | 0.000001 |
| miR-182-5p | 0.000000 | 0.000009 | 0.00000 | 0.000001 | 0.000000 |
| miR-10a-5p | 0.000048 | 0.014889 | 0.000016 | 0.000009 | 0.000004 |
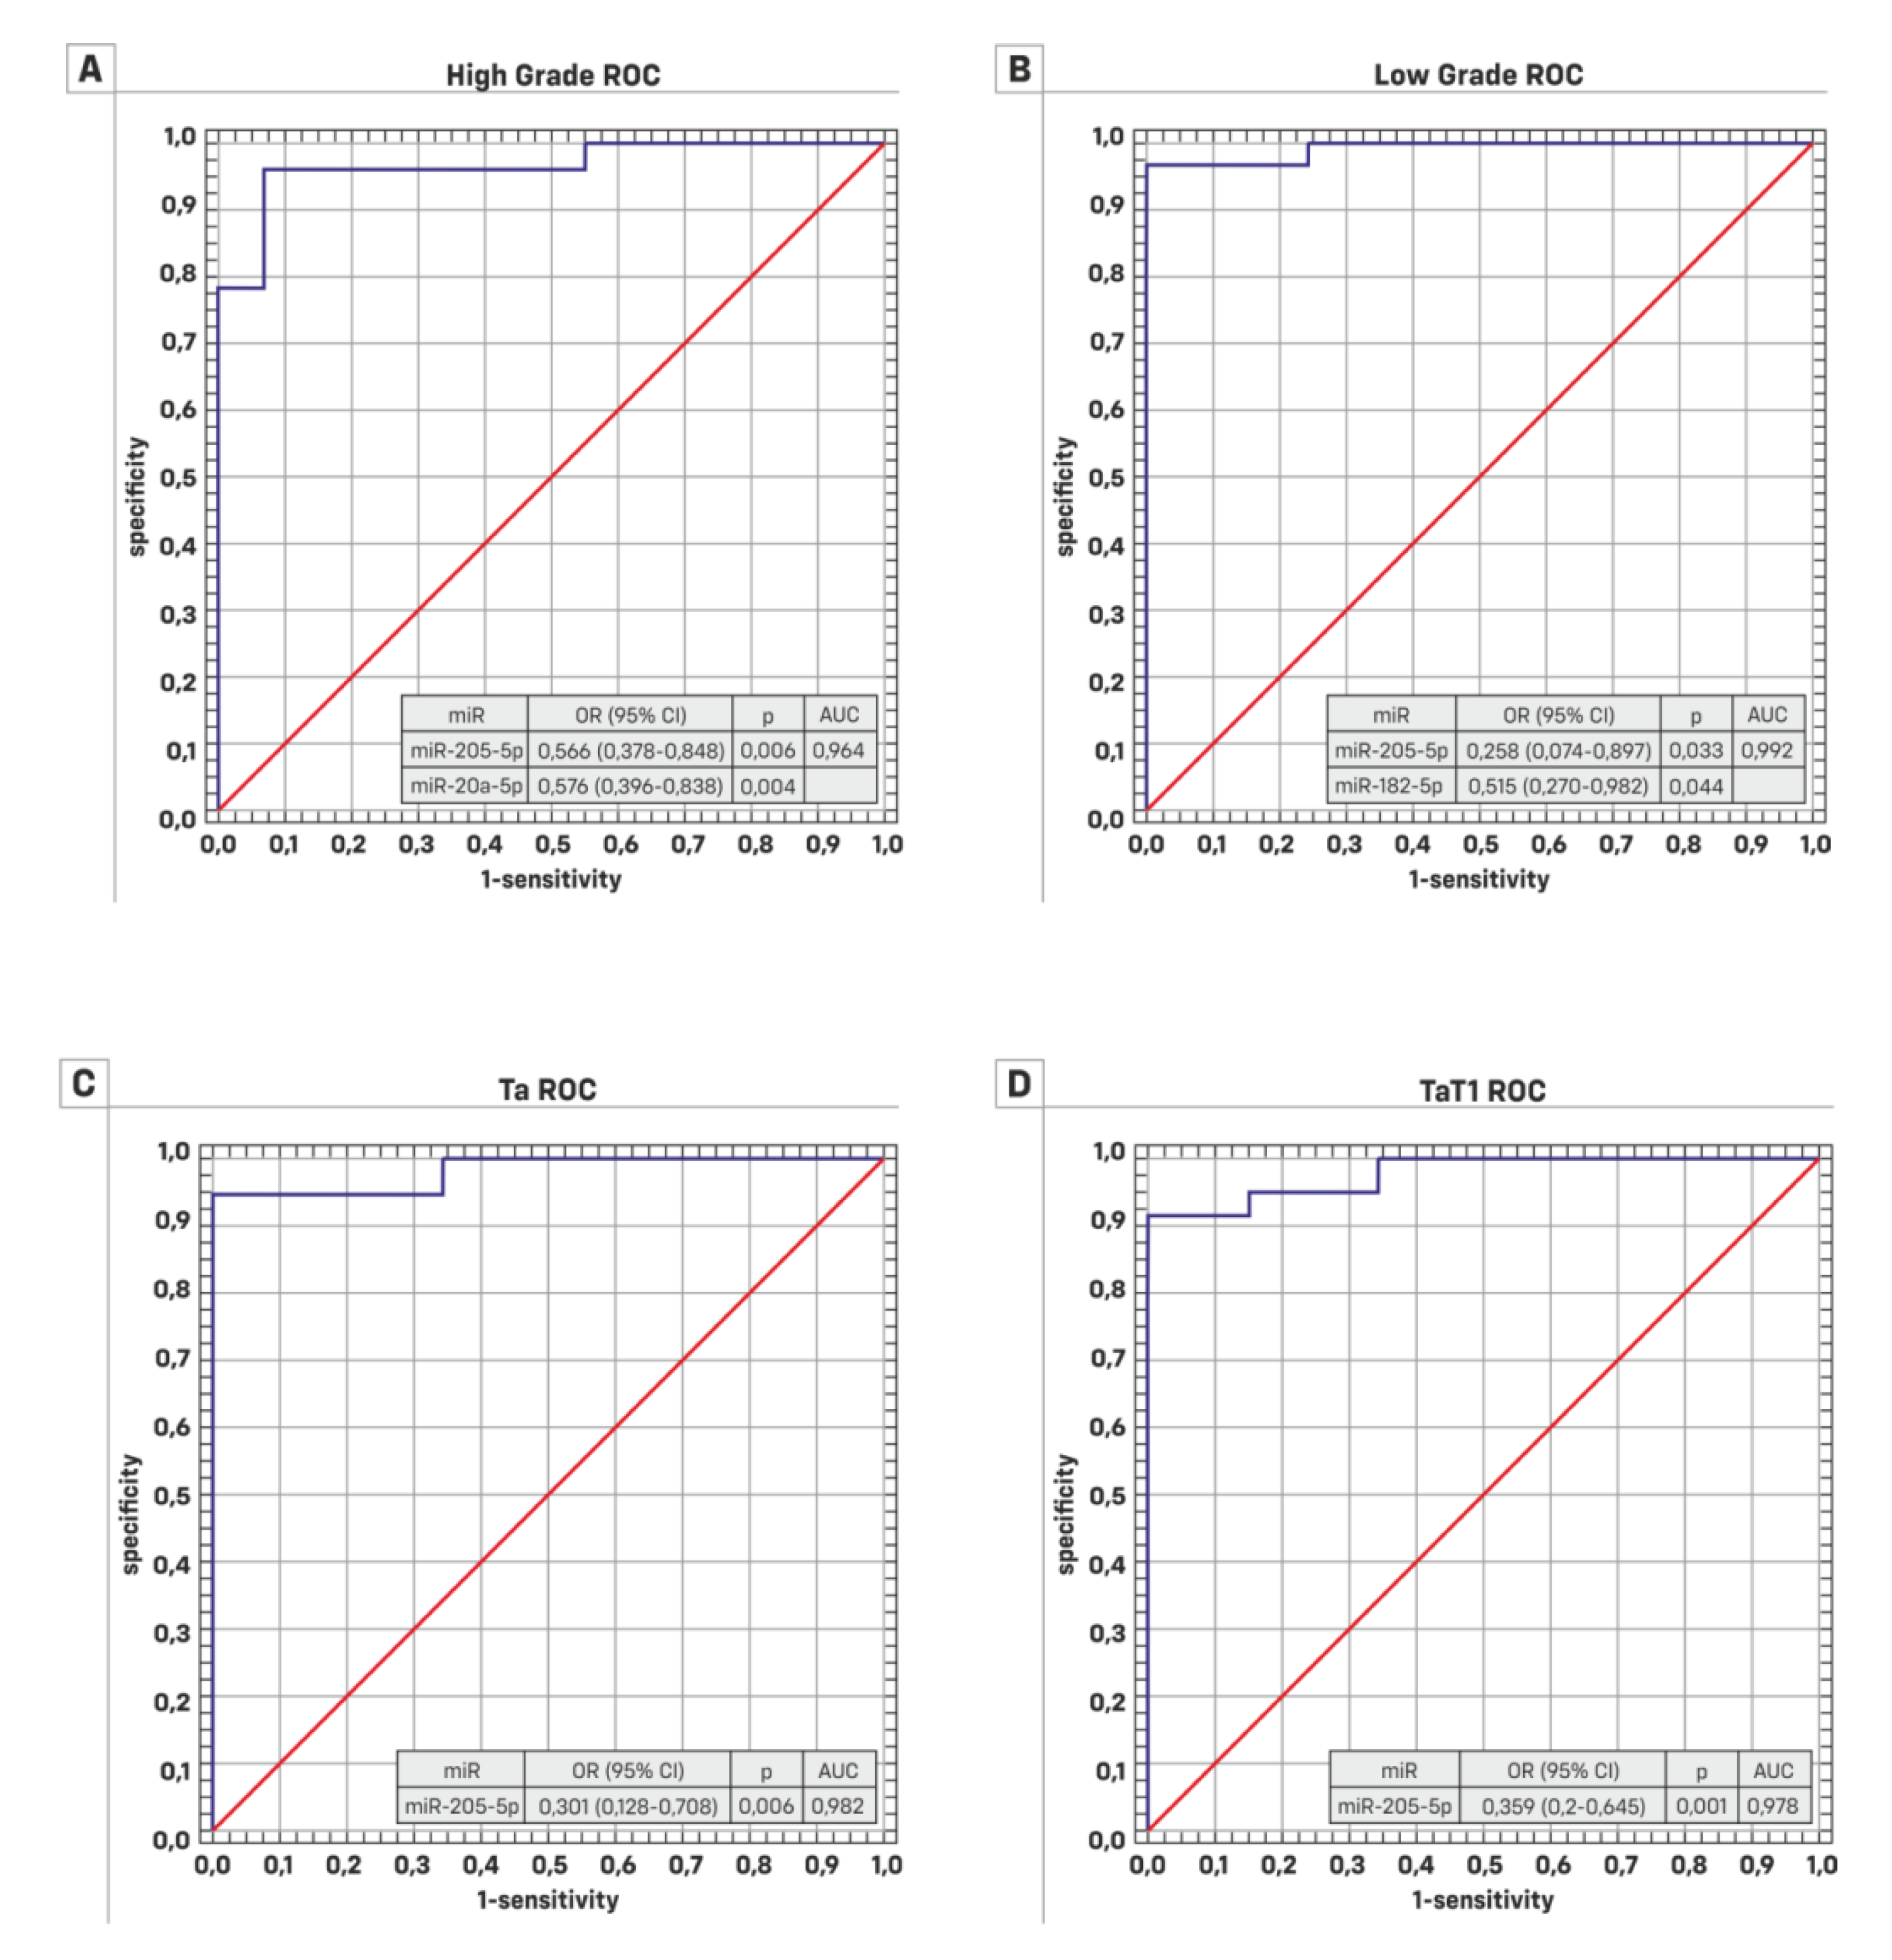
| HG (Case/Control = 22/30) | LG (Case/Control = 33/30) | |||||
|---|---|---|---|---|---|---|
| ROC Characteristics | AUC | 95% Cl | Significance p | AUC | 95% Cl | Significance p |
| miR-145-5p | 0.732 | 0.591–0.873 | 0.0013 | 0.833 | 0.731–0.936 | 0.0001 |
| miR-205-5p | 0.941 | 0.860–1.000 | 0.0001 | 0.981 | 0.955–1.000 | 0.0001 |
| miR-130b-3p | 0.475 | 0.287–0.663 | 0.7964 | 0.313 | 0.167–0.458 | 0.0115 |
| miR-21-5p | 0.851 | 0.717–0.984 | 0.0001 | 0.936 | 0.866–1.000 | 0.0001 |
| miR-20a-5p | 0.87 | 0.761–0.978 | 0.0001 | 0.801 | 0.675–0.927 | 0.0001 |
| miR-182-5p | 0.841 | 0.703–0.976 | 0.0001 | 0.895 | 0.809–0.980 | 0.0001 |
| miR-10a-5p | 0.696 | 0.545–0.846 | 0.0109 | 0.807 | 0.698–0.916 | 0.0001 |
| Ta (case/control = 19/30) | TaT1 (case/control = 37/30) | |||||
| ROC Characteristics | AUC | 95% Cl | Significance p | AUC | 95% Cl | Significance p |
| miR-145-5p | 0.842 | 0.734–0.950 | 0.0001 | 0.83 | 0.728–0.932 | 0.0001 |
| miR-205-5p | 0.982 | 0.947–1.000 | 0.0001 | 0.978 | 0.950–1.000 | 0.0001 |
| miR-130b-3p | 0.401 | 0.205–0.597 | 0.3236 | 0.448 | 0.300–0.596 | 0.493 |
| miR-21-5p | 0.939 | 0.837–1.000 | 0.0001 | 0.925 | 0.849–1.000 | 0.0001 |
| miR-20a-5p | 0.872 | 0.764–0.980 | 0.0001 | 0.83 | 0.713–0.946 | 0.0001 |
| miR-182-5p | 0.888 | 0.777–0.998 | 0.0001 | 0.902 | 0.821–0.983 | 0.0001 |
| miR-10a-5p | 0.858 | 0.738–0.978 | 0.0001 | 0.817 | 0.714–0.920 | 0.0001 |
© 2019 by the authors. Licensee MDPI, Basel, Switzerland. This article is an open access article distributed under the terms and conditions of the Creative Commons Attribution (CC BY) license (http://creativecommons.org/licenses/by/4.0/).
Share and Cite
Borkowska, E.M.; Konecki, T.; Pietrusiński, M.; Borowiec, M.; Jabłonowski, Z. MicroRNAs Which Can Prognosticate Aggressiveness of Bladder Cancer. Cancers 2019, 11, 1551. https://doi.org/10.3390/cancers11101551
Borkowska EM, Konecki T, Pietrusiński M, Borowiec M, Jabłonowski Z. MicroRNAs Which Can Prognosticate Aggressiveness of Bladder Cancer. Cancers. 2019; 11(10):1551. https://doi.org/10.3390/cancers11101551
Chicago/Turabian StyleBorkowska, Edyta Marta, Tomasz Konecki, Michał Pietrusiński, Maciej Borowiec, and Zbigniew Jabłonowski. 2019. "MicroRNAs Which Can Prognosticate Aggressiveness of Bladder Cancer" Cancers 11, no. 10: 1551. https://doi.org/10.3390/cancers11101551
APA StyleBorkowska, E. M., Konecki, T., Pietrusiński, M., Borowiec, M., & Jabłonowski, Z. (2019). MicroRNAs Which Can Prognosticate Aggressiveness of Bladder Cancer. Cancers, 11(10), 1551. https://doi.org/10.3390/cancers11101551