Article

Oncogenic Activation of Nrf2, Though as a Master Antioxidant Transcription Factor, Liberated by Specific Knockout of the Full-Length Nrf1α that Acts as a Dominant Tumor Repressor

1
The Laboratory of Cell Biochemistry and Topogenetic Regulation, College of Bioengineering and Faculty of Sciences, Chongqing University, No. 174 Shazheng Street, Shapingba District, Chongqing 400044, China
2
Institute of Neuroscience and Psychology, School of Life Sciences, University of Glasgow, 42 Western Common Road, Glasgow G22 5PQ, Scotland, United Kingdom
3
State Key Laboratory of Natural and Biomimetic Drugs, Department of Molecular and Cellular Pharmacology, Peking University School of Pharmaceutical Sciences, No. 38 Xueyuan Rd., Haidian District, Beijing 100191, China
*
Author to whom correspondence should be addressed.
Cancers 2018, 10(12), 520; https://doi.org/10.3390/cancers10120520
Submission received: 8 November 2018 / Revised: 5 December 2018 / Accepted: 10 December 2018 / Published: 17 December 2018

Abstract

:
Liver-specific knockout of Nrf1 in the mouse leads to spontaneous development of non- alcoholic steatohepatitis with dyslipidemia, and then its deterioration results in hepatoma, but the underlying mechanism remains elusive to date. A similar pathological model is reconstructed here by using human Nrf1α-specific knockout cell lines. Our evidence has demonstrated that a marked increase of the inflammation marker COX2 definitely occurs in Nrf1α−/ cells. Loss of Nrf1α leads to hyperactivation of Nrf2, which results from substantial decreases in Keap1, PTEN and most of 26S proteasomal subunits in Nrf1α−/ cells. Further investigation of xenograft model mice showed that malignant growth of Nrf1α−/-derived tumors is almost abolished by silencing of Nrf2, while Nrf1α+/+-tumor is markedly repressed by an inactive mutant (i.e., Nrf2−/ΔTA), but largely unaffected by a priori constitutive activator (i.e., caNrf2ΔN). Mechanistic studies, combined with transcriptomic sequencing, unraveled a panoramic view of opposing and unifying inter-regulatory cross-talks between Nrf1α and Nrf2 at different layers of the endogenous regulatory networks from multiple signaling towards differential expression profiling of target genes. Collectively, Nrf1α manifests a dominant tumor-suppressive effect by confining Nrf2 oncogenicity. Though as a tumor promoter, Nrf2 can also, in turn, directly activate the transcriptional expression of Nrf1 to form a negative feedback loop. In view of such mutual inter-regulation by between Nrf1α and Nrf2, it should thus be taken severe cautions to interpret the experimental results from loss of Nrf1α, Nrf2 or both.

1. Introduction

The steady-state lipid levels are crucial for maintaining cellular and organismal homeostasis, not only in term of energy metabolism, but also to prevent potential cytotoxicity. Conversely, excessive nutrients (and metabolic stress) can culminate in a series of severe diseases, such as diabetes, obesity and fatty liver. Notably, non-alcoholic fatty liver disease (NAFLD) affects 25% of the global population, up to 80% of obese people having this disease [1,2]. NAFLD comprises a continuum of pathological conditions varying in severity of liver injury and exacerbation. Among them, non-alcoholic steatohepatitis (NASH) is defined as a serious pathological process along with inflammation and hepatocyte damage, and also hence regarded as a major cause of liver fibrosis, cirrhosis, and even cancer, i.e., hepatocellular carcinoma (HCC), particularly among those caused by unknown etiologies [3,4,5,6]. However, the axiomatic mechanisms underlying development of NASH and malignant transformation into hepatoma remain elusive.
The cumulative evidence obtained from distinct animal models resembling human NASH [6] demonstrates that homeostatic and nutrient-stimulated lipid metabolisms are tightly regulated by multiple layers of diverse signaling to transcription factor networks to monitor precision expression of different target genes [7,8]. Among them, sterol-regulatory element binding protein 1c (SREBP1c) is well established as a key marker and therapeutic target for hepatosteatosis, because transgenic over-expression of this bHLH-ZIP factor leads to hepatosteatosis, but not hepatoma [9]. Also, similar hyperactivation of SREBP1c by knockout of GP78, an endoplasmic reticulum (ER) membrane-bound E3 ligase, occurs with age-related obesity, NASH and HCC [10]. Conversely, hepatosteatosis is partially mitigated by deficiency of SREBP1c [11], but sufficiently ameliorated by blockage of SREBP processing by deletion of SCAP (SREBP cleavage-activating protein) [12]. These findings indicate an additive involvement of other factors beyond SREBPs in NASH-associated malignant pathology.
Interestingly, spontaneous NASH, concomitantly with massive hepatomegaly and hepatoma, also results from the hepatocyte-specific knockout of PTEN (phosphatase and tensin homolog, as a well-known tumor repressor) in mice [13]. Loss of PTEN leads to constitutive activation of the phosphatidylinositol 3-kinases (PI3K)-AKT-mTOR signaling pathway so as to augment expression of metabolic genes regulated by SREBP1c and PPARγ in cancer proliferative cells [14,15,16]. This process is accompanied by nuclear accumulation of Nrf2 (nuclear factor erythroid 2-like 2, thus also abbreviated NFE2L2) in PTEN-deficient cells [17,18]. Notably, both Nrf2 and Nrf1 are two principal members of the cap’n’collar (CNC) basic-region leucine zipper (bZIP) family to regulate expression of those antioxidant response element (ARE)-driven genes involved in detoxification, cytoprotection, metabolism and proliferation. Significantly, aberrant accumulation of Nrf2 and activation of target genes are significantly incremented by simultaneous deletion of PTEN (leading to a GSK3β-directed phosphodegron of Nrf2 targeting this CNC-bZIP protein to the β-TrCP-based E3 ubiquitin ligase Cullin 1-mediated proteasomal degradation) and Keap1 (acting as an adaptor targeting Nrf2 to the Cullin 3-mediated proteasomal degradation), resulting in a deterioration of PTEN−/-leading cancer pathology [19,20,21]. Conversely, malignant transformation of double PTEN:Keap1 knockout mice is alleviated by additive deletion of Nrf2 [20], implying that Nrf2 promotes carcinogenesis. This is also supported by further observations that increased activity of Nrf2 is required for oncogenic KRAS- driven tumorigenesis [22] and this CNC-bZIP activation by antidiabetic agents accelerates tumor metastasis in xenograft models [23]. Furtherly, non-neoplastic lesions are also caused by constitutive active Nrf2 (caNrf2) mutants lacking the Keap1-binding sites in transgenic mice [24,25], albeit their cytoprotection against carcinogenesis is enhanced. Conversely, investigation of a dominant-negative dnNrf2 mutant (that also suppresses other CNC-bZIP factors, such as Nrf1) has demonstrated that the basal ARE-driven gene expression, but not their inducible expression, is crucial for anti-tumor chemoprevention against the chemical-induced carcinogenesis [26]. Yet, the underlying mechanism by which Nrf2 is determined to exert dual opposing roles in either tumor suppression or promotion remains unknown to date.
More interestingly, another significant phenotype of spontaneous NASH and hepatoma is also manifested in conditional Nrf1−/ (but not in Nrf2−/ or Keap1−/) mice, which display a bulk of lipid drops in the ER with dramatic morphological changes [27,28]. After global knockout of Nrf1−/ mice die of severe oxidative stress-induced damages and fetal liver hypoplasia during development [29,30]. By sharp contrast, global Nrf2−/ knockout mice are viable and fertile, without any obvious pathological phenotypes occurring during normal growth and development [31]. Such facts indicate that Nrf1 is not compensated by Nrf2, although both are widely co-expressed in various tissues and also have similar overlapping roles in coordinately regulating ARE-driven cognate genes. Further insights also reveal that Nrf1 exerts unique essential functions, which are distinctive from Nrf2, in maintaining cellular redox, lipid and protein homeostasis, as well as organ integrity, possibly through regulation of distinct subsets of target genes [32,33]. This notion is also reinforced by further investigation of other organ-specific Nrf1 deficiency or its over-activation in mice, which exhibit distinct pathological phenotypes, such as type 2 diabetes, neurodegenerative and cardiovascular disease [34,35,36,37]. In addition to the functionality of Nrf1 as an indispensable CNC-bZIP transcription factor, it is also identified to act as a directly ER membrane-bound sensor to govern cholesterol homeostasis through the consensus recognition motifs (i.e., CRAC) [38,39] and lipid distribution in distinct tissues [40,41]. However, it is very regrettable that which isoforms of Nrf1 are required to execute its unique physio-pathological functions is unclearly defined, because almost all isoforms of the factor are disrupted to varying extents in the past experimental models described above.
Upon translation of Nrf1, its N-terminal ER-targeting signal anchor enables the nascent full- length protein (called Nrf1α) to be topologically integrated within and around the membranes, while other domains of the CNC-bZIP protein are partitioned on the luminal or cytoplasmic sides [38,42]. Subsequently, some luminal-resident domains of Nrf1α are dynamically repositioned across membranes through a p97-driven retrotranslocation pathway into extra-ER compartments [43,44,45]. In these topovectorial processes of Nrf1α, it is subjected to specific post-translational modifications (e.g., glycosylation, deglycosylation, ubiquitination), and also selective juxtamembrane proteolytic processing of the CNC-bZIP factor so as to yield multiple isoforms with different and even opposing activities, during its maturation into an activator [46,47,48]. In addition, distinct variants of Nrf1, including its long TCF11, short Nrf1β/LCR-F1 and small dominant-negative Nrf1γ/δ, are also generated by alternative translation from various lengths of alternatively-spliced mRNA transcripts [49]. However, each Nrf1 isoform-specific physiological function virtually remains obscure.
Notably, specific gene-editing knockout of Nrf1α leads to a significant increase in the malignant proliferation of Nrf1α−/-derived hepatoma and the tumor metastasis to the liver in xenograft model mice [50]. This work had revealed that Nrf1α may act as a tumor suppressor, but the underlying mechanism remains unclear. Herein, our present work further reveals that Nrf1 and Nrf2 have mutual opposing and unified inter-regulatory cross-talks towards downstream genes. For instance, aberrant hyperactivation of Nrf2 leads to a constitutive increase of its target cycloxygenase-2 (COX2) in Nrf1α−/ cells. Such hyperactivation of Nrf2 by knockout of Nrf1α is accompanied by substantial decreases in Keap1, PTEN and most of 26S proteasomal subunits. The malignant growth of Nrf1α−/- derived tumor is significantly prevented by knockdown of Nrf2, while Nrf1α+/+-bearing tumor is also markedly suppressed by knockout of Nrf2, but appears to be unaffected by a priori constitutive activator of Nrf2 (i.e., caNrf2ΔN). Such distinct phenotypes of these animal xenograft tumors are also determined by differential transcriptomic expression of different subsets of genes regulated by Nrf1α or Nrf2 alone or both. These collective findings have convincingly demonstrated that Nrf1α manifests as a dominant tumor-suppressor to confine Nrf2 oncogenicity. Conversely, although Nrf2 is defined as a tumor promoter, it also directly mediates the transcriptional expression of Nrf1 so as to form a negative feedback loop.

2. Results

2.1. The Human Nrf1α−/- and Nrf2−/−ΔTA -Driven Cell Models are Established

Since the phenotypes of liver-specific Nrf1−/ mice resemble the human pathogenesis of hepatic steatosis, NASH and HCC [27,28,51], this is thus inferred available for exploring the underlying mechanisms whereby NASH is transformed for malignant progression towards hepatoma (Figure 1A). However, it is unknown whether human Nrf1α exerts similar effects to those obtained from the aforementioned mouse models. For this end, a similar pathological model was here recapitulated by genome-editing knockout of Nrf1α from human HepG2 cells, aiming to elucidate the mechanism by which a non-resolving NASH-based inflammation is exacerbated. To achieve the genomic locus- specific knockout of human Nrf1α, we herein created a pair of TALEN-directed constructs to yield a specific deletion of Nrf1α-derived isoforms from the single Nfe2l1 gene, but with shorter variants Nrf1β to Nrf1δ being unaffected (Figure 1B and see Figure S1A). In the parallel experiments, another pair of CRISPR/Cas9-mediated constructs were also engineered to delete the Nrf2-specific codons (covering its internal 42–175 amino acids within the essential Keap1-binding region and most of its transactivation domains) from the Nef2l2 gene so as to yield an inactive mutant Nrf2−/−ΔTA (Figure 1D,E and Figure S1B). Consequently, two monoclonal hepatoma cell lines of Nrf1α−/ and Nrf2−/−ΔTA were, respectively, established and also confirmed to be true by sequencing their genomic DNAs, and Western blotting with specific antibodies (Figure 1B–E).
Further real-time qPCRs, with specific primers that recognized distinct nucleotide fragments, showed that knockout of Nrf1α substantially abolished expression of total Nrf1 mRNAs in Nrf1α−/ cells (Figure 1B, right panel). Similar results were also obtained from other clones of Nrf1α−/ cell lines [50]. Notably, the Nrf2−/−ΔTA cells gave rise to an inactive mutant lacking nt124-526 of Nrf2, but no alterations in basal expression of its DNA-binding domains (DBD)-containing mRNA transcripts were measured (Figure 1D, right panel). Thereby, the resulting inactive mutant Nrf2ΔTA polypeptides may still, theoretically, be recruited to bind Nrf2-target genes. Such binding activity might allow the Nrf2ΔTA to circumvent the potential competitive occupancy with other complementary factors, upon comparison with loss of the prototypic Nrf2. This distinction is based on the fact that its nuclear localization signal (NLS) within its DBD was deleted to yield Nrf2−/−ΔDBD as previously reported [20].
A plausible explanation of NASH pathogenesis is preferred to the classic two-hit hypothesis, in which the first hit is hepatosteatosis (caused by the accumulation of cholesterol and lipids), and the second hit is a non-resolving inflammation (induced by oxidative stress) [6,15]. Such being the case, we examined whether Nrf1α−/ cells act accordingly. As anticipated, it is illustrated by measuring the intracellular hydrogen peroxide (H2O2) as a representative of reactive oxygen species (ROS), that endogenous oxidative stress was strikingly induced in Nrf1α−/ cells, but, to our surprising, slightly relieved by inactive Nrf2−/−ΔTA, when compared with wild-type Nrf1/2+/+ progenitor cells (Figure 1F). Subsequently, a significant accumulation of lipids was seen after staining of Nrf1α−/ cells, by comparison with Nrf2−/−ΔTA and Nrf1/2+/+ cells (Figure 1G).
By increasing the time of oleic acid (OA) treatment to 7 days, the lipid accumulation was significantly incremented in Nrf1α−/ cells to a maximum ~182-fold estimated. While compared with ~60-fold accumulation of lipids in Nrf1/2+/+ cells, such lipid overload appeared to be substantially alleviated by the inactive Nrf2−/−ΔTA mutant to ~34-fold (Figure 1G,H). In addition to lipid metabolic disorders resulting from loss of Nrf1’s function to regulate LPIN1, PGC-1β and other metabolic genes [51,52], NASH has a not-yet-identified characteristic of refractory inflammation. Accordingly, we herein determined transcriptional expression of key genes encoding cytokines and their relevant receptors involved in putative inflammatory responses. As expected, the expression of all nine examined genes, encoding IL-1A, IL-1B, IL-1R1, IL-1R2, IL-6, IL-8, IL-10, TGF1α, and TGF1β, was significantly elevated in Nrf1α−/ cells (Figure 1I). By contrast with Nrf1/2+/+ cells, mRNA expression of IL-1A, IL-1R2, IL-6 and IL-8 was markedly down-regulated by the inactive Nrf2−/−ΔTA, while only IL-1B and IL-10 expression was still marginally up-regulated, but no changes in other genes were examined (Figure 1I). Collectively, our findings convincingly demonstrate that the NASH-prone phenotypes are recapitulated by employing human Nrf1α−/-driven cells, in which Nrf2 may also be critical for this pathogenesis.

2.2. The Inflammation Marker COX2 Is Up-Regulated, while COX1 Is Down-Regulated, in Nrf1α−/ Cells

Development of inflammation (e.g., NASH) and malignant transformation into carcinogenesis has clear relevance to lipid peroxidation, and particularly degradation metabolites of arachidonic acid (AA), such as prostaglandins (PGs), thromboxanes (TXs) and leukotrienes (LTs) [53,54,55]. Within the AA metabolism network, cyclooxygenase 1 (COX1) and COX2 are the two rate-limiting enzymes that convert AA into PGs, of which COX2 is considered as a key inflammation marker [56] and was also identified as a direct target of Nrf2 [57,58]. Since Nrf2 (and Nrf1) is recruited to directly bind the ARE-containing promoters of COX2 and COX1 before transactivating both genes, it is thereby hypothesized that hyper-expression of inflammation-related genes in Nrf1α−/ cells is attributable to overstimulation of PG and TX products from the catalyzation by COX2 and COX1 (Figure 1J). To address this, we herein examined whether (and how) the key rate-limiting enzymes in AA metabolism are influenced by loss of Nrf1α or Nrf2 functions.
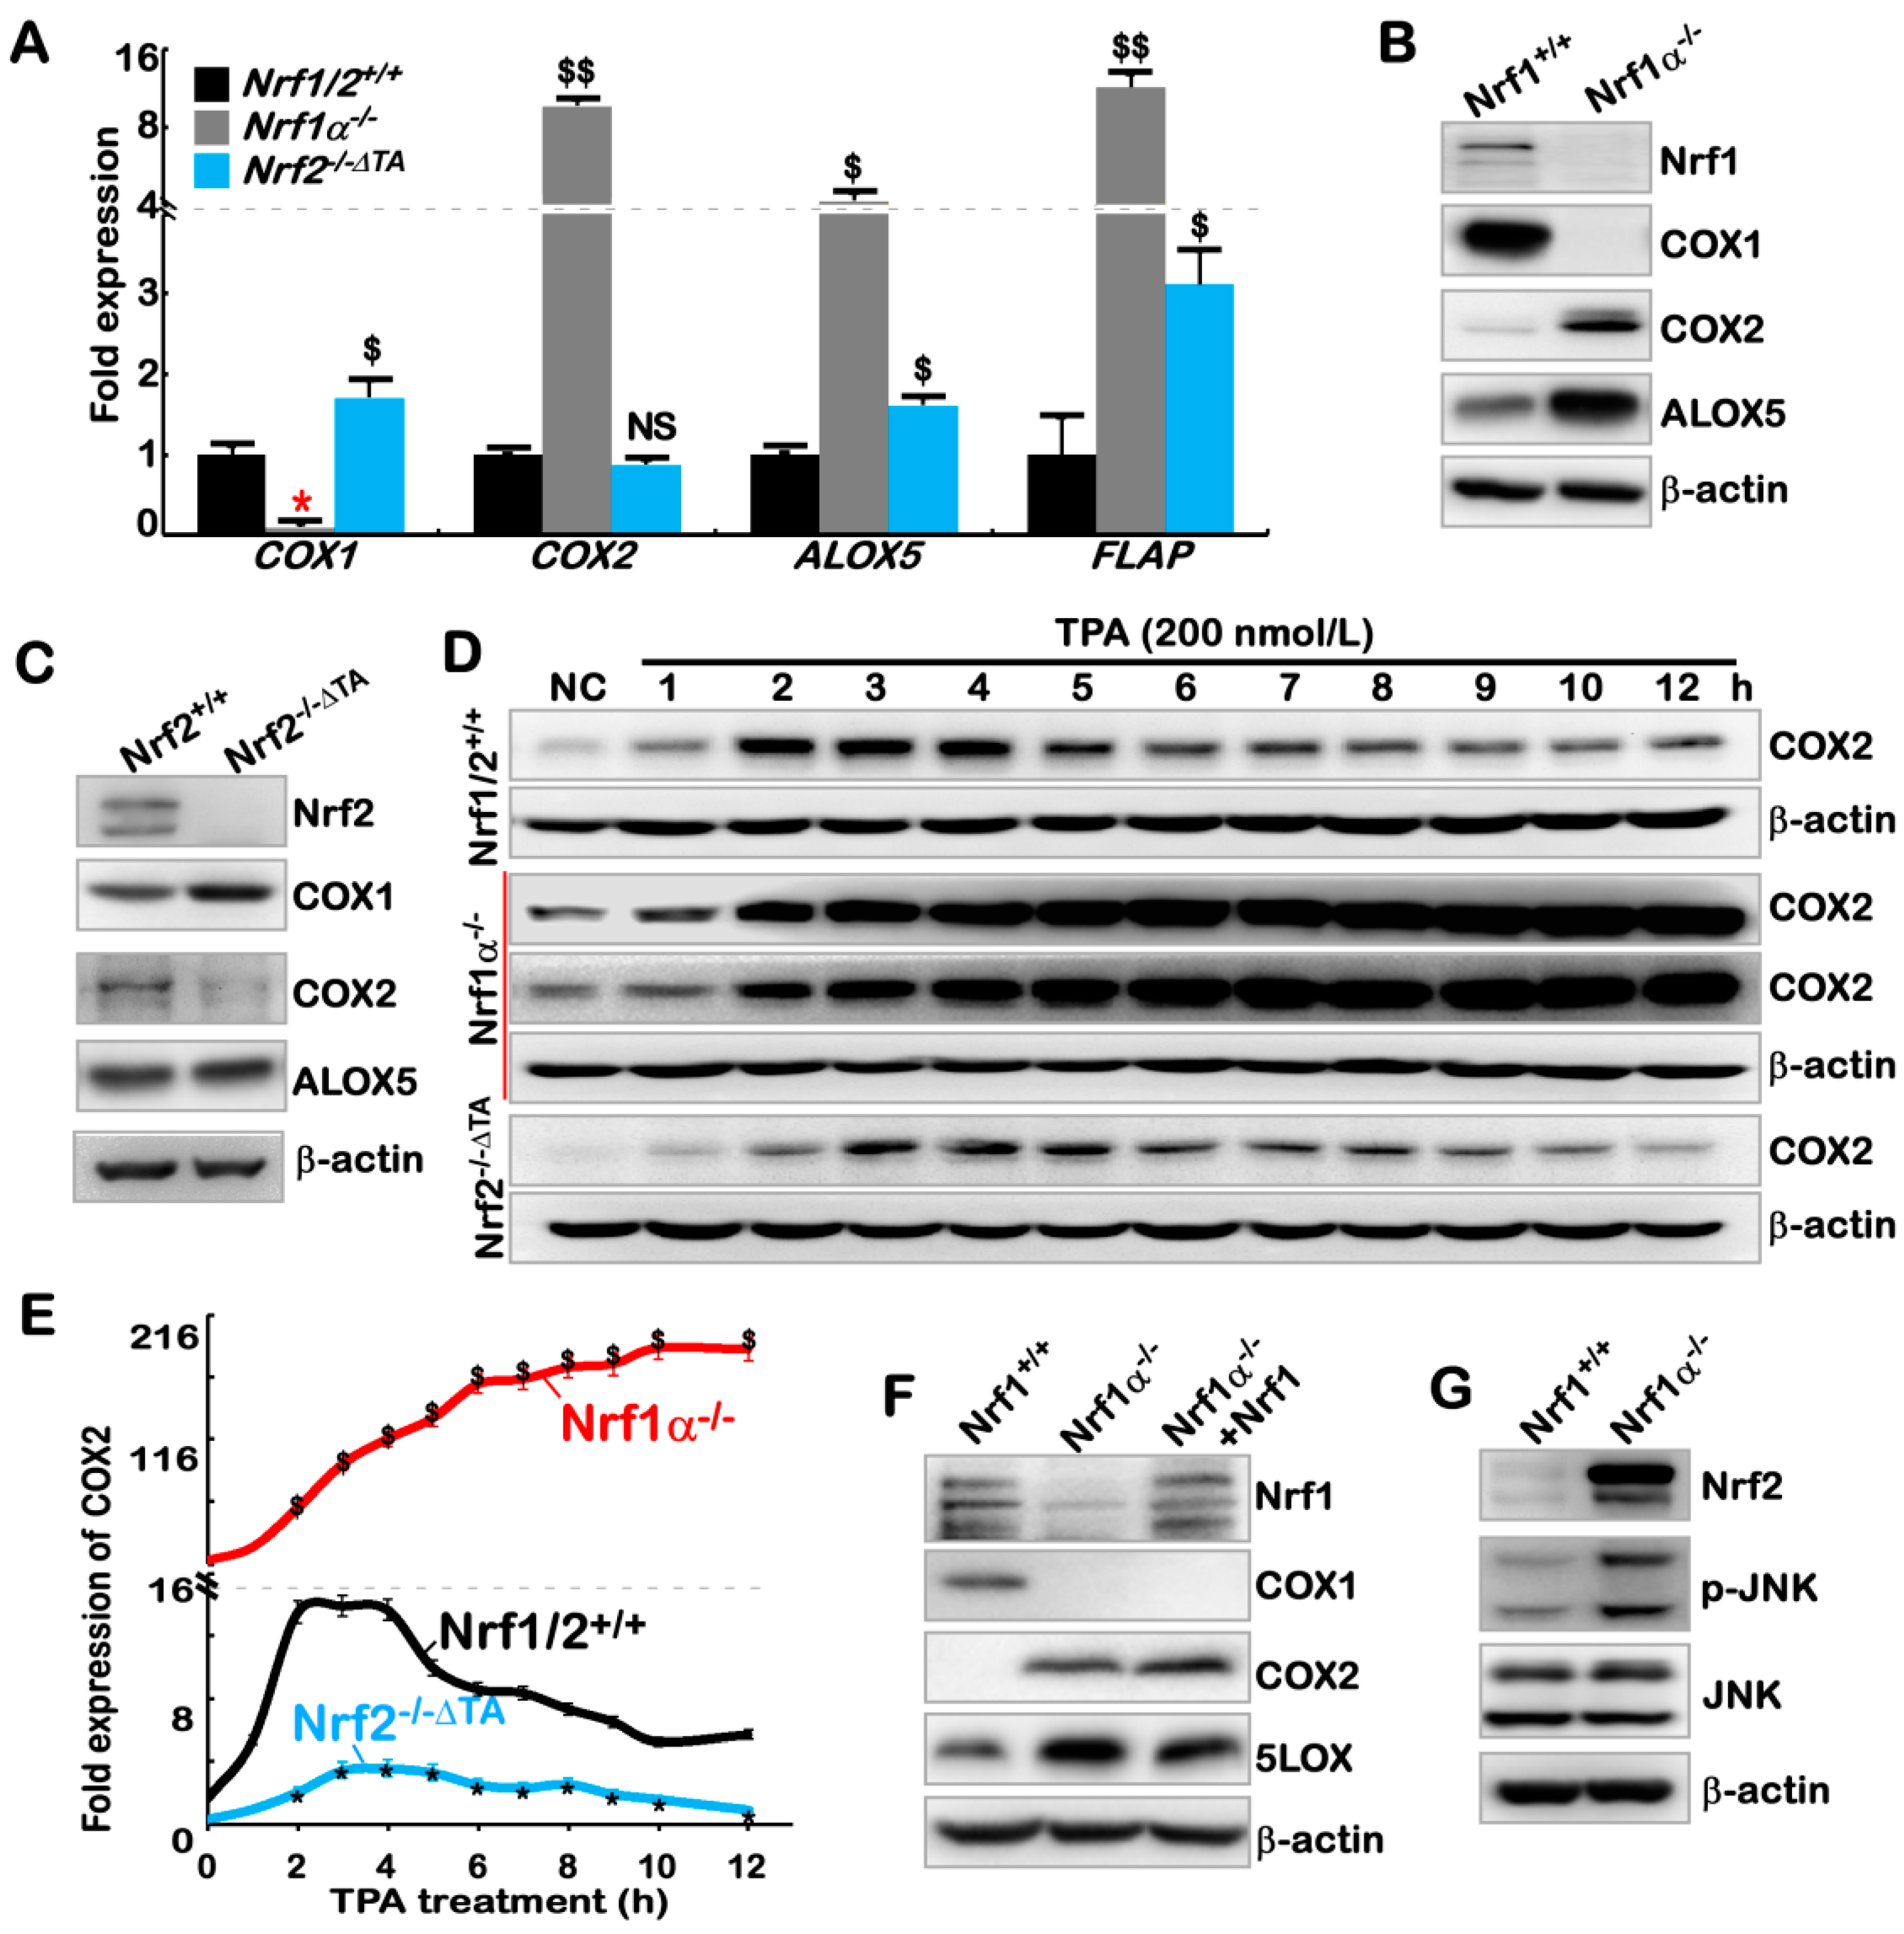
As anticipated, a real-time qPCR analysis revealed that mRNA levels of COX1 were almost completely abolished in Nrf1α−/ cells, but obviously increased in Nrf2−/−ΔTA cells by comparison to those obtained from wild-type Nrf1/2+/+ cells (Figure 2A). Contrarily, the expression of COX2 was substantially augmented in Nrf1α−/ cells, but almost unaffected by the inactive Nrf2−/−ΔTA mutant when compared to the value measured from Nrf1/2+/+ cells. Furthermore, expression of ALOX5 and FLAP in Nrf1α−/ cells was up-regulated at much higher levels than those measured in Nrf2−/−ΔTA cells at considerable levels (Figure 2A).
Next, whether such differences in expression of these AA metabolism genes are attributable to differential and even opposing regulation by Nrf1 and Nrf2 was further examined. Consistently, almost no protein expression of COX1 was detected in Nrf1α−/ cells, while abundances of COX2 and ALOX5 proteins were significantly increased, when compared with Nrf1/2+/+ cells (Figure 2B). However, COX1 was highly expressed in Nrf2−/−ΔTA cells at a greater level than that obtained from wild-type cells (Figure 2C). Conversely, COX2 protein expression was substantially diminished or abolished by the inactive Nrf2−/−ΔTA mutant, whereas ALOX5 was almost unaffected (Figure 2C).
Since it is known that COX1 is constitutively essential for normal physiological homeostasis, while COX2 is an inducibly expressed enzyme to be stimulated by inflammatory stress [59,60], the changing trends of COX2 induction by 12-O-tetradecanoylphorbol-13-acetate (TPA) stimulation are evaluated. As a result, stimulation of Nrf1/2+/+ cells by TPA caused an obvious induction of COX2 protein expression to a ~14-fold maximum at 2 h after treatment; this value was being maintained to 4 h, before being gradually decreased to a ~5-fold level by 10-h treatment with TPA (Figure 2D,E). Notably, in Nrf1α−/ cells, the constitute up-expression of COX2 was set to 18-fold as its starting point, the subsequent incremental abundances of this enzymatic protein were further induced to a maximum of ~190-fold by 10-h TPA treatment and maintained until the experiment was terminated (Figure 2E, red curve). Relatively, a weak response of COX2 to TPA stimulation of Nrf2−/−ΔTA cells was also observed from 2 h to 8 h, only with a smooth inducible peak at 4 h after treatment (Figure 2E, blue curve). Further assays of the luciferase reporter PCOX2-Luc (in which the 2078-bp promoter of human COX2 gene was constructed) revealed that transcriptional expression of the reporter gene was significantly induced at 4 h after TPA treatment of Nrf1α−/ cells, and such TPA-stimulated increases were continuously maintained until 24 h TPA treatment (red columns and curve, Figure S2A,B). However, no obvious changes in the PCOX2-Luc activity were detected in TPA-treated Nrf2−/−ΔTA cells (blue columns and curve) when compared with those obtained from Nrf1/2+/+ cells (Figure S2A,B). These collective findings imply a striking disparity in the Nrf1α- and Nrf2-mediated induction of COX2 by TPA.

2.3. Hyper-Expression of COX2 Results from Increased Nrf2 and JNK-Mediated AP-1 in Nrf1α−/ Cells

Intriguingly, the abundance of COX2, as a well-known direct target of Nrf2, was not decreased, but rather marginally increased by ectopic expression of Nrf1 that had been restored into Nrf1α−/ cells (Figure 2F), in which the repressed expression of COX1 was also not rescued, albeit both genes encompass the ARE sites recognized by Nrf1 and Nrf2 [57,58]. These seemingly paradoxical results, along with the above-described data from Nrf1α−/ cells, suggest that Nrf1α may have an ambivalent relationship with Nrf2 in regulating both COX1 and COX2 genes. Rather, this confusing but exciting finding arouses our de facto curiosity to explore which possible pathways enable Nrf1 to indirectly regulate COX2 (Figure S3A), although this enzyme has been shown to be monitored by CREB, NF-κB, STAT1, FOXM1, ETS1, ELF3 and JNK-regulated AP1 [61,62,63,64,65,66]. Consequently, the real-time qPCR analysis revealed that mRNA levels of only RELB, but not other members of the NF-κB family (that regulates cellular responses to inflammation), were significantly up-regulated in Nrf1α−/ cells (Figure S3B). This may be coincident with the notion that ablation of an IκB (inhibitor of NF-κB) kinase IKKγ in liver parenchymal cells causes spontaneous pathology of NASH and HCC [67]. However, Figure S3C showed that abundances of over-expressed COX2 in Nrf1α−/ cells were unaltered by the caffeic acid phenethyl ester (CAPE, as a potent specific inhibitor of NF-κB [68]), and also nor significantly diminished by JSH-23 (as a broad spectrum inhibitor of NF-κB [69]). Thus, it is inferable there implicates an NF-κB-independent pathway to up-regulate expression of COX2 in Nrf1α−/ cells. In addition, it may be not necessary for the modest inducible expression of ETS1 (one of the E26 transformation-specific transcription factors), because this was accompanied by substantial down-regulation of another family member ELF3 (Figure S3B).
Further treatments of Nrf1α−/ cells with either of the two CREB inhibitors H-89 and BAPTA- AM [63,70] demonstrated that the elevated expression of COX2 was also unaffected (Figure S3D). However, it is, to our surprise (Figure S3E), found that the forced abundance of COX2 in Nrf1α−/ cells was sufficiently abolished by a JNK-specific inhibitor SP600125 [71]. Further investigations revealed no changes in both total mRNA and protein levels of JNK (Figure 2G and Figure S3B), but the phosphorylated JNK abundance was significantly increased in Nrf1α−/ cells, when compared with those obtained from Nrf1/2+/+ cells (Figure 2G). Therefore, it is initially postulated that Nrf1α−/ cells gave rise to the forced expression of COX2 possibly mediated by activation of JNK signaling. Next, in-depth insights into JNK signaling towards downstream target genes unraveled that expression of only c-Jun, but not other examined genes, was significantly elevated in Nrf1α−/ cells (Figure S4A,B). Further assays of two luciferase reporter genes PCOX2-Luc and PTRE-Luc (in which TRE indicates TPA-responsive element inserted within the reporter gene promoter region) verified that AP-1 (a functional heterodimer of Jun and Fos) is also favorably required for the transactivation of COX2 in Nrf1α−/ cells (Figure S4C). By defining distinct AP-1 components (e.g., Jun, Fos, Fra1) at mRNA and protein levels, it is validated that AP-1 was activated in Nrf1α−/ cells, but not in Nrf2−/−ΔTA cells (Figure S4D–F). However, Figure S4G illustrated that hyper-expression of COX2 in Nrf1α−/ cells was not suppressed by the AP-1 inhibitor SR11302 [72]. By stoichiometric analysis of knockdown of Jun or Fra1, only modest decreases of COX2 were no proportional to the silencing of Jun or Fra1 at considerably lower levels (Figure S4H). The latter notion is supported by no dose-dependent effects of silencing Jun on down-regulation of COX2 (Figure S4J, lower three panels). Taken altogether, AP-1 activation by JNK signaling is involved in, but not essential for, making a significant contribution to the reinforced expression of COX2 in Nrf1α−/ cells.
Fortunately, the evidence that expression of Nrf2 and its nuclear translocation are attenuated by the JNK inhibitor SP600125 [73,74] implicates there exists a direct linkage between JNK and Nrf2. Consistently, abundance of Nrf2 protein was surprisingly augmented in Nrf1α−/ cells, which was accompanied by an increase in the phosphorylated JNK (Figure 2G). Similarly, great increases in expression of both COX2 and Nrf2 were caused by knockout of Nrf1α in HL7702Nrf1α−/ (established on the base of the non-cancerous HL7702 hepatocyte line) (Figure S5A,B). Further examinations of Nrf1α−/ cells unraveled that high-expression of COX2 was substantially suppressed by treatment of the JNK inhibitor SP600125 (Figure 2H) or transfection with Nrf2-targeting siRNA (Figure 2I). The dose-dependent response of silencing Nrf2 to down-regulation of COX2 was determined (Figure S4J, upper three panels). Collectively, these findings indicate that the hyper-expression of COX2 in Nrf1α−/ cells is principally caused by increased Nrf2 protein, and the latter CNC-bZIP factor is also monitored by its upstream JNK signaling. This conclusion is supported by PCOX2-Luc reporter assays of Nrf1α−/ cells showing that Nrf2 mediated transactivation of the COX2 gene driven by its ARE enhancer, but such transactivation was significantly diminished by its ARE mutant (i.e., PCOX2m-Luc) (Figure 2K). Similarly, transactivation of the PCOX2-Luc reporter mediated by ectopic Nrf1, like Nrf2, in wild-type Nrf1/2+/+ cells (Figure 2J). This finding, together with above-described data, indicates that Nrf1α also possesses one hand to exert a minor positive effect on COX2 expression by directly binding its ARE enhancer, but also this effect appears to be sufficiently counteracted by the another hand of Nrf1α to elicit a dominant-negative role by indirect inhibitory pathways.
Of note, some of AP-1 abundances (e.g., Jun and Fra-1) (Figure 2I), besides known Nrf2-target genes encoding HO-1 and GCLM (Figure S4I), were obviously suppressed by silencing of Nrf2 in Nrf1α−/ cells (Figure 2I); they were also strikingly prevented by inactive Nrf2−/−ΔTA, by comparison with equivalent controls (Figure S4F). Together with the above-described results, these imply that AP-1 is dominantly repressed by Nrf1α, but positively regulated by Nrf2. However, no available evidence has been presented here to support the notion that AP-1 activates transcription of Nrf2 as reported previously [75]. It is of importance to notice that expression of COX2 in mouse embryonic fibroblasts (MEFs) is co-regulated by both Nrf1 and Nrf2, because its abundance was significantly abolished by global knockout of Nrf1 or Nrf2 (Figure S5C). Here, it should also be noted that global knockout of all the mouse Nrf1 or Nrf2 DNA-binding domain-containing fragments was achieved by their respective gene-targeting manipulations (to yield Nrf1−/−ΔDBD or Nrf2−/−ΔDBD) [28,51]. These resulting mutants are totally distinctive from site-specific knockout by their gene-editing to delete the designed portions of human Nrf1α or Nrf2 (Figure 1 and Figure S1). Moreover, knockout of Keap1 in MEFs (Figure S5D) and human HepG2 (Figure S5E) caused a remarkable increase in the expression of Nrf1, Nrf2, COX2, and HO-1 to different extents as detected. Overall, the precision regulation of COX2 by Nrf1 and/or Nrf2, along with Keap1, in distinct manners, is much preferable to depend on distinctive cell types in different species.

2.4. Nrf1α and Nrf2 Transactivate the ARE-Driven miR-22 Signaling to PTEN, but Not to COX1

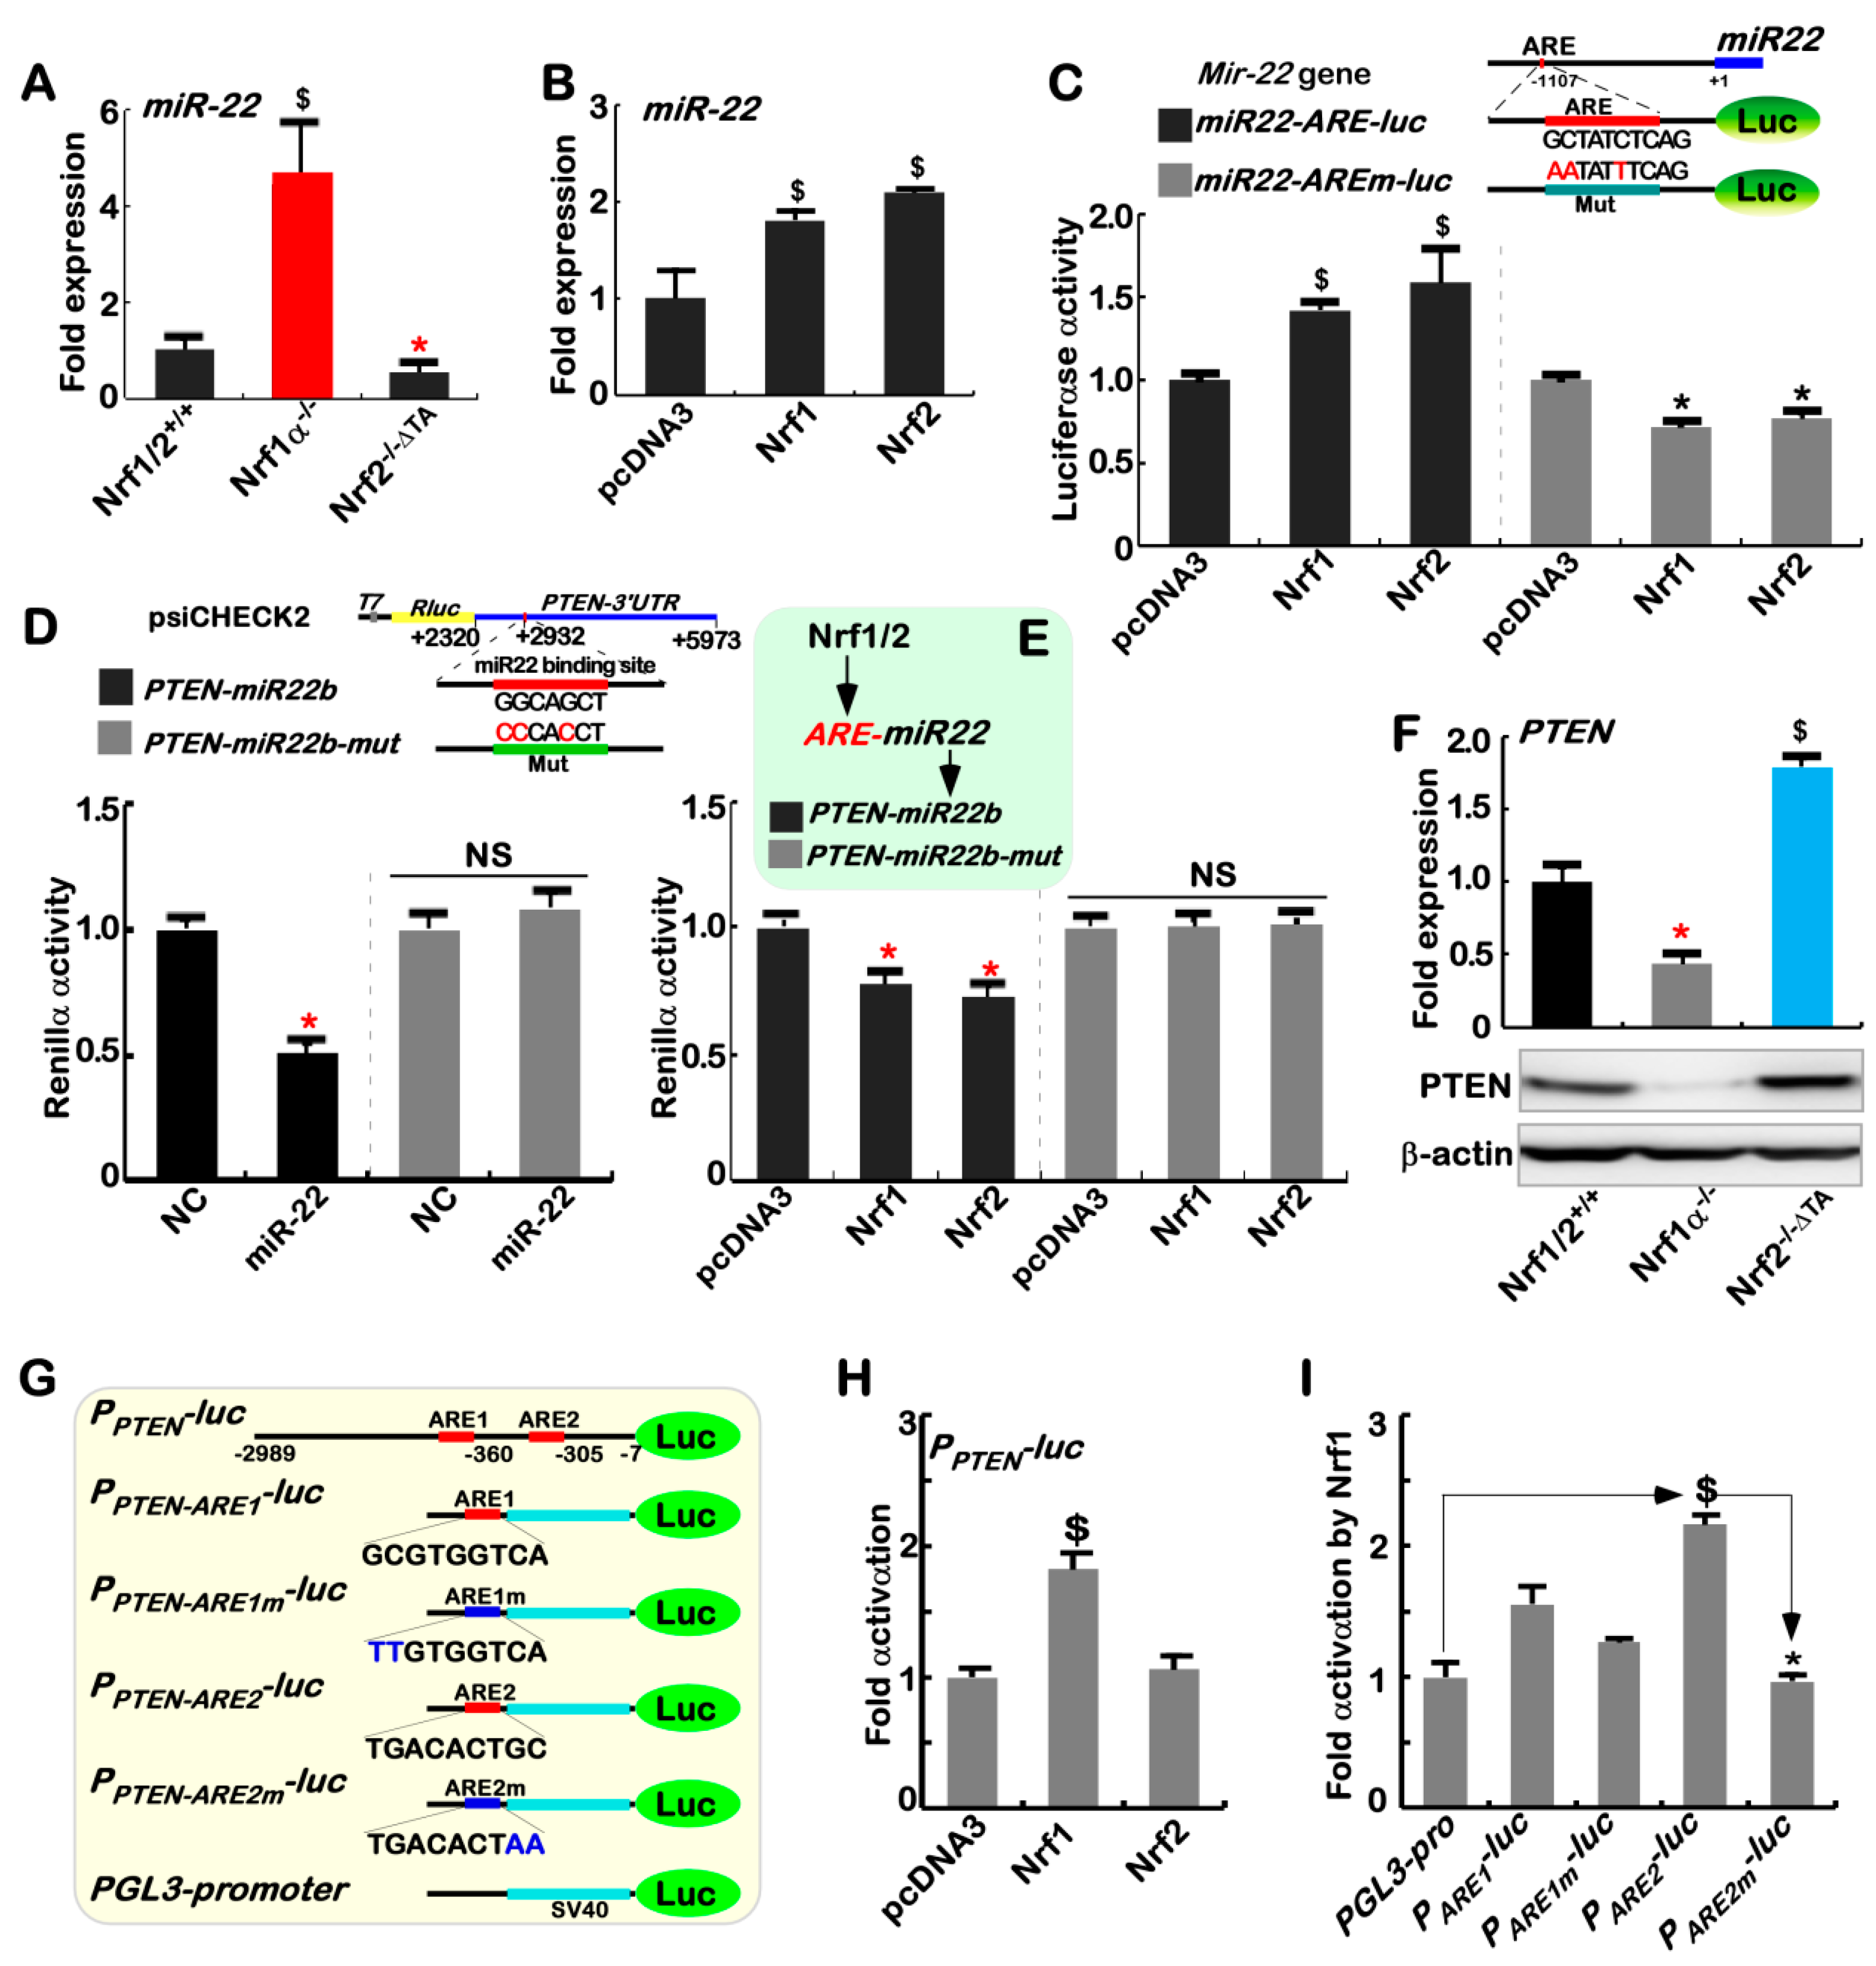
On the contrary to COX2, the isoenzyme COX1 was highly expressed in Nrf2−/−ΔTA cells (Figure 2C), but its expression was almost completely abolished in Nrf1α−/ cells (Figure 2B) and also not rescued by restoration of ectopic Nrf1 into Nrf1α−/ cells (Figure 2F), albeit Nrf2 was up-regulated (Figure 2G). Thus, it is inferable that no matter how Nrf1α and Nrf2 have opposing or overlapping roles in regulating COX1 expression, Nrf2 exerts a dominant inhibitory effect on COX1, but this effect is fully contrary to regulating COX2. In view of this, we speculate that the putative inhibition of COX1 by Nrf2 (and possibly Nrf1α) may be achieved through an indirect miRNA-regulatory pathway, except for directly ARE-binding to this target gene. Fortunately, a candidate miR-22 was selected by predicting its potential miRNA-binding sites within the COX1 3′-UTR region (also see http://www.targetscan.org/vert_72/). As expected, relevant real-time qPCR analysis unraveled that miR-22 expression was significantly increased in Nrf1α−/ cells, but this increase was completely attenuated in Nrf2−/−ΔTA cells (Figure 3A). Forced expression of ectopic Nrf1 or Nrf2 also caused an obvious increase in miR-22 expression in wild-type Nrf1/2+/+ cells (Figure 3B). Further analysis of the miR-22-coding gene revealed there exists a consensus ARE site within its promoter (Figure 3C, upper panel). The promoter-driven luciferase reporter (i.e., miR22-ARE-Luc) was created herein, so as to assay for its transcriptional activity. The results showed that the miR22-ARE-Luc reporter gene was significantly transactivated by Nrf1 and Nrf2 (Figure 3C), and the transactivation was, rather, diminished by the ARE mutant of miR22-AREm-luc. Taken together, these imply direct and indirect transactivation of miR-22 possibly by Nrf1α and Nrf2.
Since the negative regulation of PTEN by miR-22 had been reported [76,77], a Renilla reporter gene containing the 3’UTR region of PTEN (i.e. PTEN-miR22b) was here constructed, together with a mutant of miR-22-binding site (i.e., PTEN-miR22b-mut, Figure 3D, upper panel). If miR-22 would bind the 3’-UTR region of PTEN transcripts, the PTEN-miR22b-driven Renilla reporter activity was significantly reduced by miR22 (Figure 3D, lower panel), and also partially decreased by ectopic expression of either Nrf1 or Nrf2 (Figure 3E). These negative effects were sufficiently abrogated by PTEN-miR22b-mut. Consistently, both mRNA and protein levels of PTEN (Figure 3F) were indeed significantly reduced in Nrf1α−/ cells (with hyper-expression of Nrf2, see Figure S6), but strikingly increased by inactive Nrf2−/−ΔTA. Such opposing changes in endogenous PTEN levels are inversely correlated with those relevant values of miR22 measured in the same cell lines (Figure 3A). Thus, transactivation of miR-22 by Nrf1α and Nrf2 leads to putative inhibition of PTEN.
To further determine whether such miR-22 pathway is involved in the regulation of COX1 by Nrf1 and Nrf2, the luciferase reporter gene was constructed by cloning the 3’-UTR sequence of COX1 (i.e., COX1-miR22b), along with a mutant of the putative miR-22 binding site so as to yield a COX1-miR22b-mut reporter (Figure S7A, upper panel). As unexpected, the COX1-miR22b-driven Renilla activity was roughly unaffected by miR-22, Nrf1 and Nrf2, when compared with that of COX1-miR22b-mut (Figure S7A1,A2). The another luciferase reporter gene (i.e., PCOX1-Luc) was engineered by inserting the 1413-bp COX1 gene promoter, but the PCOX1-Luc activity was also almost unaltered by forced expression of Nrf1 and Nrf2 (Figure S7B1). However, the responsiveness of this ARE-driven PCOX1-Luc reporter to TPA was induced (Figure S7B2), albeit it was relatively weak, when compared to the PCOX2-Luc reporter (Figure S2A). Intriguingly, the PCOX1-Luc activity was also modestly mediated by Jun, but almost unaffected by a canonical AP-1 dimer (Figure S7B3). This is consistent with the notion from a previous report [78], but this is required for further insights into the detailed mechanisms underlying the regulation of COX1 by Nrf1α and Nrf2.

2.5. Nrf1α and Nrf2 Have Mutual Inter-Regulatory Effects on Downstream Genes

Since an unusual increase in Nrf2 protein is accompanied by relative higher levels of ROS in Nrf1α−/ cells (Figure 1F, Figure 2G and Figure S6), it is inferable that Nrf1α-deficient hepatoma cells are growing under severe redox stress conditions redefined at a new higher steady-state level that leads Nrf2 to become hyperactive. As anticipated, mRNA expression levels of HO-1, GCLC, GCLM, NQO1 and xCT (though these co-target genes mediated by both Nrf1 and Nrf2 [28,51,79]) were significantly increased in Nrf1α−/ cells (Figure 4A). Meanwhile, a marked decrease in LPIN1, but no significant reduction in PGC-1β (both were identified as Nrf1-specific target genes by [52]), was determined by comparison of Nrf1α−/ cells with their equivalents of wild-type Nrf1/2+/+ cells. Despite no obvious alterations in the mRNA levels of Nrf2 (Figure 4A), Western blotting revealed significant increases in the abundance of Nrf2 protein and typical downstream gene products HO-1, GCLM, NQO1 and HIF1α in Nrf1α−/ cells, by contrast with Nrf1/2+/+ cells (Figure 4B). Further determination of Nrf2 subcellular locations showed that its abundance was increased and existed as three polypeptides in the nucleus of Nrf1α-/- cells, of which major middle-sized polypeptide was strikingly accumulated in the cytoplasm (Figure S6A,B). All four protein levels of HO-1, GCLM, NQO1 and HIF1α were, however, markedly reduced, in accordance with Nrf2 knockdown by siRNA-targeting interference within Nrf1α−/ cells (Figure 4C). Silencing of Nrf2 also led to decreased mRNA expression levels of HO-1, GCLM and xCT (Figure S5F). Conversely, restoration of ectopic Nrf1 expression into Nrf1α−/ cells caused obvious decreases in abundances of Nrf2, HO-1, GCLM and NQO1 to different extents as detected (Figure 4D). Collectively, it is demonstrated that in Nrf1α−/ cells, hyper-active Nrf2 has a potent ability to mediate a subset of their co-target genes. Furthermore, the phosphorylated JNK, but not its total, protein levels were markedly decreased, as Nrf2 protein was reduced by ectopic expression of Nrf1 after transfecting into Nrf1α−/ cells (Figure 4D). This finding, together with the evidence that Nrf2 is repressed by JNK inhibitor treatment of Nrf1α−/ cells (Figure 2H), implicates that Nrf2 might also govern transcription of a not-yet-identified upstream kinase to phosphorylate JNK through a positive feedback loop.
By contrast, inactivation of Nrf2 led to strikingly decreases in both mRNA and protein levels of Nrf1 in Nrf2−/−ΔTA cells (Figure 4E,F). This was also accompanied by significant diminishments in the expression of their co-regulated downstream genes HO-1, GCLM, NQO1 and HIF1α in Nrf2−/−ΔTA cells (Figure 4E,F), in addition to a modest reduction in both mRNA levels of LPIN1 and PGC-1β. Thereby, such marked decreases in the expression of Nrf1, HO-1, GCLM, NQO1 and HIF1α resulting from loss of Nrf2 function demonstrate that Nrf2−/−ΔTA cell line could provide a favorite model to determine the changing downstream genes regulated by Nrf1, Nrf2 alone or both. Next, to address this, Nrf2−/−ΔTA cells were allowed for ectopic expression of Nrf1 or Nrf2 in order to estimate specific downstream genes. As expected, it is validated that Nrf1-specific target gene PSMB6 was increased by forced expression of Nrf1, but not of Nrf2, allowed for restoration in Nrf2−/−ΔTA cells (Figure 4G). Conversely, expression of NQO1 was modestly induced by ectopic Nrf2, rather than Nrf1, after being transfected into Nrf2−/−ΔTA cells. This implies that NQO1 is Nrf2-dependent, but insensitive to Nrf1, in Nrf2−/−ΔTA cells. In fact, Nrf1 and Nrf2 have overlapping roles in mediating transactivation of HO-1 and GCLM (Figure 4G,H). Intriguingly, both CNC-ZIP factors also enhanced expression of COX2, but reduced COX1 expression (Figure 4G,H). This seems fully consistent with additional examinations, revealing that silencing of Nrf2 in Nrf1α−/ cells consequently gave rise to a relative higher expression of COX1, as accompanied by a decrease in COX2 (Figure S5F). Nevertheless, such co-inhibition of COX1 by two transcriptional activators Nrf1 and Nrf2 is much puzzling, albeit it is known that transcriptional expression of downstream genes is mediated by each of their functional heterodimers with a partner of small MAF or other bZIP proteins through directly binding the cis- regulatory ARE sites within their target gene promoters [32,80]. Taken together with the above data (Figure 2 and Figure 3), these collective findings indicate that Nrf1 and Nrf2 might also act as two indirect players in the transcriptional regulation of COX1 by an unidentified pathway.
To determine which specific target genes are constitutively activated by Nrf2, thus a dominant constitutive active mutant caNrf2ΔN-expressing cell line was here established by the gene-editing to delete the N-terminal Keap1-binding portion of Nrf2 (Figure S5A). The resulting caNrf2ΔN cells, indeed, gave rise to a higher expression of Nrf2, as well as Nrf1, when compared to wild-type cells (Figure 4I and Figures S5G and S6C). Interestingly, expression of COX1 almost disappeared as accompanied by significant increases of COX2 in caNrf2ΔN cells (Figure 4I and Figure S5G). This finding further supports the above-described evidence obtained from inactivation of Nrf1α and Nrf2. Constitutive presence of caNrf2ΔN also led to increases in abundances of both HO-1 and GCLM (Figure 4I), in addition to an enhanced expression of xCT and Lpin1 (Figure S5G). Furthermore, phosphorylated JNK was also significantly induced by caNrf2ΔN, with no changes in total JNK protein (Figure 4I), implying there may exist a putative upstream kinase transcriptionally monitored by Nrf2.
To further assess a mutual regulatory relationship between Nrf1 and Nrf2, we here examined whether one of the endogenous proteins was influenced by the another of both proteins that were allowed for ectopic over-expression in wild-type Nrf1/2+/+ cells. As shown in Figure 4J, endogenous Nrf2 protein was obviously decreased by ectopic Nrf1. Consequently, abundances of HO-1 and GCLM were markedly increased, whereas COX2 was weakly enhanced, but COX1 was significantly decreased following over-expression of Nrf1 (Figure 4J). By contrast, over-expression of ectopic Nrf2 caused an enhancement in endogenous Nrf1 (Figure 4K). This was accompanied by striking increases of COX2, HO-1 and GCLM, along with a remarkable decrease of COX1 (Figure 4K). Taken altogether, we assume there exists a mutual inter-regulatory relationship between Nrf1α and Nrf2, as summarized in Figure 4L. This may be an important strategy for a precision regulation of distinct downstream genes, in order to meet the needs for different cell processes.

2.6. Nrf1α and Nrf2 Transactivate the Nrf1/Nfe2l1 Gene Promoter-Driven Reporter at Different Sites

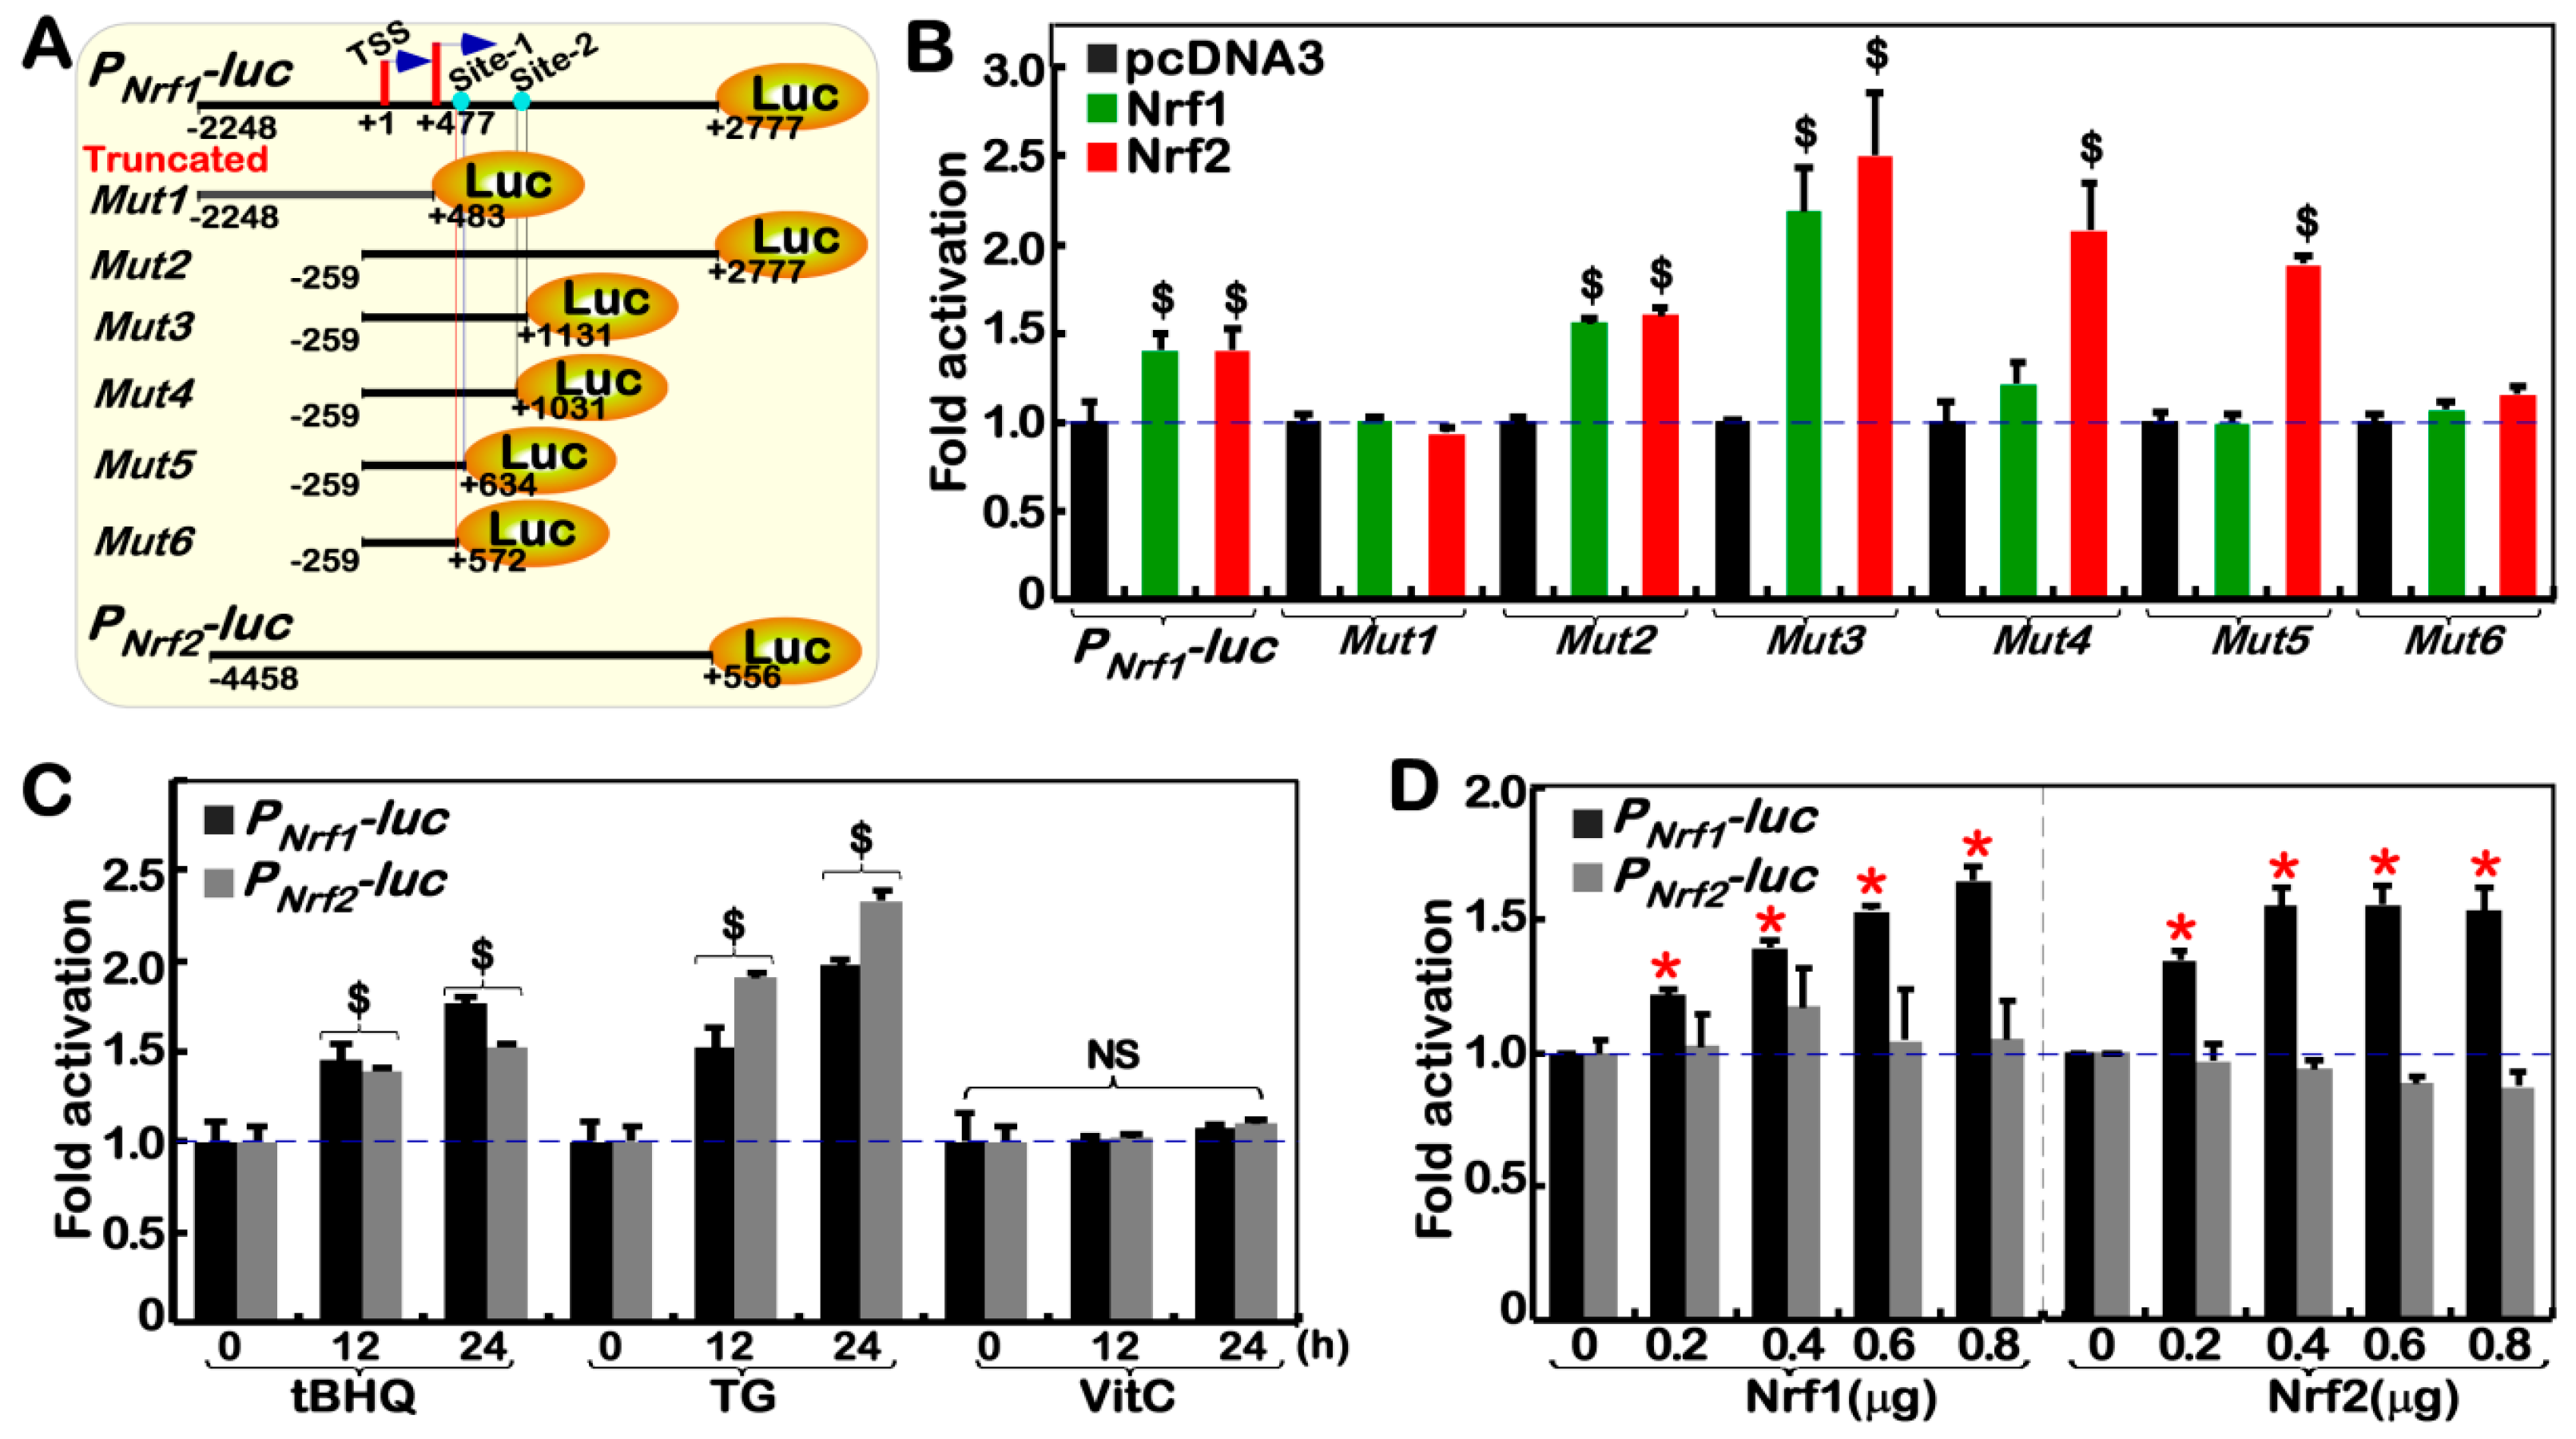
To gain insights into the direct relationship between Nrf1 and Nrf2, we here constructed their specific luciferase reporters by cloning the promoter regions of Nrf1 and Nrf2 genes and evaluated their activity by transfection into HepG2 cells (Figure 5A,B). As anticipated, the results showed that both PNrf1-luc and PNrf2-luc reporter genes were significantly induced by thapsigargin (TG, a classic ER stressor), or tert-Butylhydroquinone (tBHQ, a typical oxidative inducer), but not vitamin C (VC, a dual redox inducer) (Figure 5C). Thereby, either PNrf1-luc or PNrf2-luc reporters is available to assess transcriptional expression of Nrf1 and Nrf2, respectively. Subsequent co-transfection of expression constructs for Nrf1 or Nrf2, together with PNrf1-luc or PNrf2-luc reporters, revealed that transcription of PNrf1-luc, but not PNrf2-luc, reporter genes was markedly induced by Nrf1 and Nrf2 (Figure 5D).
Although none of canonical ARE sequences (5′-TGACxxxGC-3′) exist within the 5025-bp Nrf1 gene promoter, an attempt to identify which sites are located in the promoter enabling for specific transactivation mediated by Nrf1 and Nrf2 was made here, in order to yield a series of truncated mutants from the PNrf1-luc (Figure 5A). Fortunately, the resulting luciferase assays uncovered that several reporters containing the first exon region of Nrf1 were activated by Nrf1 and Nrf2 possibly through different regulatory sites (Figure 5B). From various lengths of the PNrf1-luc and mutants, it is inferable that the Nrf1/Nfel1-regulatory locus site-1 (i.e., Site-1) specific for Nrf2 is located in a 62-bp range between +572 bp and +634 bp, and the Nrf1/Nfel1-regulatory locus site-2 (i.e., Site-2) specific for Nrf1 per se is situated in another 100-bp range from +1031 bp to +1131 bp (Figure S8A).

2.7. Nrf1α−/-Leading Accumulation of Nrf2 Results from Decreased Keap1

The putative inter-regulation between Nrf1α and Nrf2 was further investigated to interpret the rationale underlying an abnormal accumulation of Nrf2 protein with no changes in its mRNA expression in Nrf1α−/ cells (Figure 2G and Figure 4A). Based on this finding, combined with the notion that Nrf1, but not Nrf2, acts as a primary transcriptional regulator of 26S proteasomal subunits [81,82], thereby it is hypothesized that aberrant accumulation of Nrf2 results from loss of Nrf1α’s function leading to an imbalance between Nrf2 protein synthesis and degradation processing. As shown in Figure S8B,C, total protein ubiquitination was significantly accumulated in Nrf1α−/ cells, but not in Nrf2−/−ΔTA cells, when compared with wild-type cells. Further analysis of mRNA expression levels revealed that 21 of 36 genes encoding all 26S proteasomal subunits and relevant regulatory proteins were significantly reduced by knockout of Nrf1α (Figure S8D1–D4), with only an exception of PSMB10 enhanced (Figure S8D3). By contrast, no marked changes in transcriptional expression of 24 of the aforementioned 36 genes were determined in Nrf2−/−ΔTA cells (Figure S8D1–D4). Of note, only 8 genes including PSMB3, PSMB5, PSMB6, PSMB7, PSMB10, PSMC5, PSMD3 and PSMD11 were marginally down-regulated by Nrf2−/−ΔTA (with decreased Nrf1 expression), but the remaining 4 genes PSMC2, PSMC6, PSMD1 and PSME1 were significantly up-regulated (Figure S8D2–D4). Overall, such proteasomal dysfunction by loss of Nrf1α may result in an accumulation of Nrf2 by impaired 26S proteasomal degradation pathway, while it is important that some of the proteasomal regulatory subunits might be, rather, suppressed by Nrf2 to form a positive feedback loop.
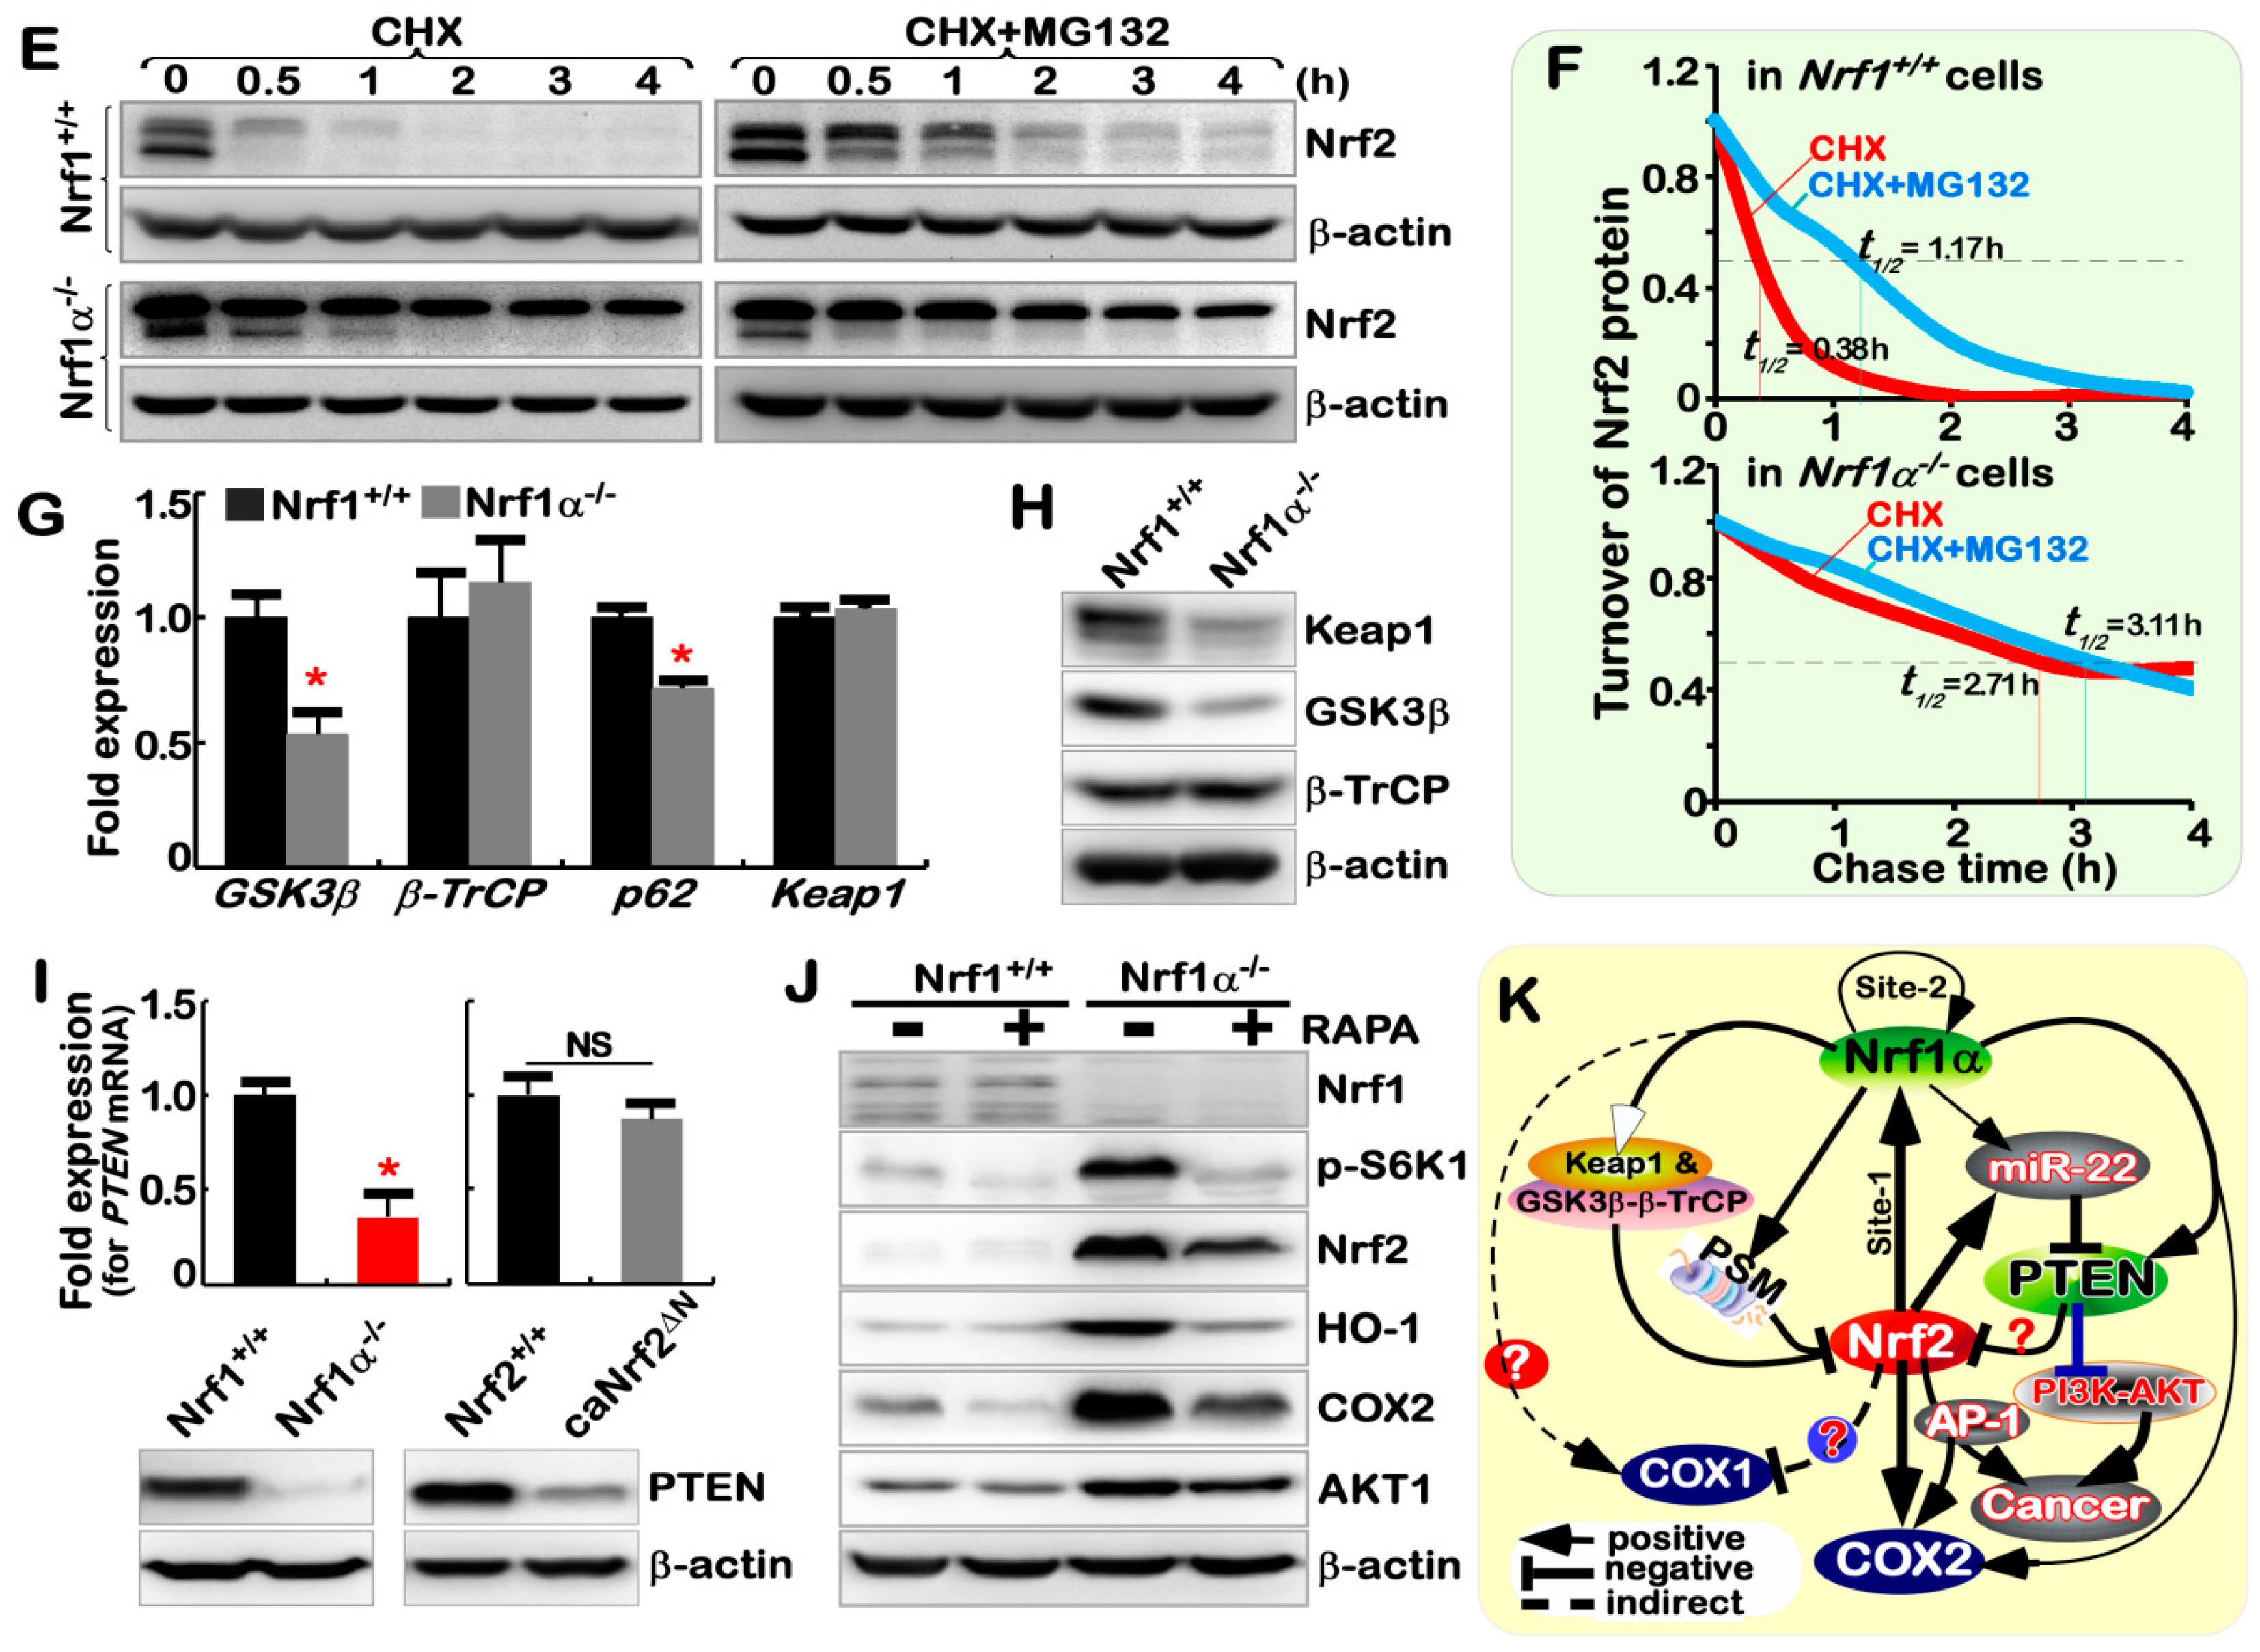
To address this, turnover of Nrf2 protein was further determined by pulse-chase analysis of its half-life in Nrf1α−/ cells (Figure 5E). Surprisingly, it was herein found that Nrf1α−/ cells gave rise to relatively stable protein of Nrf2 with a prolonged half-life to 2.71 h (= 163 min) after treatment with cycloheximide (CHX, an inhibitor of newly-synthesized polypeptides), but such a longevity of Nrf2 was largely unaffected by the proteasome inhibitor MG132 (Figure 5F, lower panel). As controls, Nrf1+/+ cells displayed a rapid turnover of Nrf2 with a short half-life of 0.38 h (= 23 min) after CHX treatment, and this lifetime was also significantly extended to 1.17 h (= 70 min) by MG132 (Figure 5F, upper panel). These collective findings convincingly demonstrate that aberrant accumulation of Nrf2 in Nrf1α−/ cells results from impaired 26S proteasome-mediated degradation of this protein.
Next, several upstream regulators of Nrf2 were examined, so as to determine which pathways are impaired towards its protein turnover in Nrf1α−/ cells. Intriguingly, abundance of Keap1 protein was significantly decreased (Figure 5H), even though its mRNA expression levels were unaltered, along with its turnover regulator p62 was strikingly reduced in Nrf1α−/ cells (Figure 5G). Thereby, the turnover of Keap1 in Nrf1α−/ cells may also occur through a p62-independent pathway. As such, impairment of Keap1-mediated proteasomal degradation of Nrf2, in particular oxidative stress [83], is likely to contribute to an accumulation of Nrf2 by loss of Nrf1α. However, aberrant accumulation of Nrf2 is also attributable to impairment of GSK3β-phosphorylated β-TrCP-mediated proteasomal degradation of the CNC-bZIP protein. This is due to a marked decrease of GSK3β at its mRNA and protein levels in Nrf1α−/ cells (Figure 5G,H). The resulting consequence is that Nrf2 is markedly accumulated in both the cytoplasm and nucleus of Nrf1α−/ cells (Figure S6A,B).

2.8. Nrf1α and Nrf2 Exert Opposing and Unifying Roles in the Regulation of PTEN Signaling

More importantly, we found that both protein and mRNA levels of PTEN, which acts as a key master versatile regulator of Nrf2, Keap1, PI3K, AKT and GSK3β [17,19,20,84], were significantly diminished or even abolished in Nrf1α−/ cells (retaining high expression of Nrf2) (Figure 5I, left panel). In contrast, inactivation of Nrf2 caused a striking increase in PTEN mRNA, but not its protein, levels in Nrf2−/−ΔTA cells (albeit with a low expression level of Nrf1) (Figure 3F and Figure 4F). On the contrary, caNrf2ΔN cells (yielding high expression of Nrf2 and Nrf1, Figure 4I) caused a significant decrease in expression of PTEN protein, but not its mRNA levels (Figure 5I). Collectively, together with the data (as shown in Figure 3), both Nrf1α and Nrf2 are much likely to exert opposing and unifying roles in the precision regulation of PTEN by both miR-22-dependent and -independent pathways, in which Nrf2 is preferably dominant-negative, whereas Nrf1α has a limited positive role.
Further analysis of the PTEN gene unraveled that there exist two typical ARE sites within its promoter region (Figure 3G). The resulting luciferase assay demonstrated that transcription activity of PTEN promoter-driven luciferase reporter PPTEN-luc was significantly induced by Nrf1, but not by Nrf2 (Figure 3H). Mutagenesis analysis uncovered that the second ARE2 site made a primary contribution to transactivation activity of the PPTEN-luc reporter mediated by Nrf1, whilst the first ARE1 site also gained a minor contribution to Nrf1-mediated transactivation of PPTEN-luc (Figure 3I).
Based on the fact that loss of PTEN function leads to constitutive activation of the PI3K-AKT signaling pathway to augment the nuclear accumulation of Nrf2 and its resulting activation [17,18], we determined whether the PI3K-AKT signaling is activated by abolishment of PTEN in Nrf1α−/ cells (where Nrf2 is aberrantly accumulated). The results demonstrated Nrf1α−/-leading increased abundances of Nrf2, AKT1, COX2 and HO-1, but their increases were also significantly suppressed by rapamycin (RAPA, a classic mTOR inhibitor) (Figure 5J). This implies that mTOR signaling may be constitutively activated in Nrf1α−/ cells. Accordingly, the increased abundances of both AKT and phospho-S6K1 in Nrf1α−/ cells were markedly blocked by the mTOR inhibitor RAPA. This appears inversely correlative with the consequence that over-expression of Nrf1 suppresses AKT induction [36]. Taken together, this further indicates mutual opposing and unifying cross-talks between Nrf1α and Nrf2 to regulate the PTEN-mTOR-AKT signaling towards the Nrf2-COX2 pathway.
From these findings, we here summarized an endogenous inter-regulatory network of between Nrf1α and Nrf2 (Figure 5K). Consistently, the conclusion is further validated by a series of similar experimental evidence obtained from additional seven distinct monoclonal cell lines of Nrf1α−/; they had been established by gene-editing knockout of this gene from two progenitor cell lines of HepG2 and HL7702 (Figure S9).

2.9. Blockage of Nrf1α+/+-Bearing or Nrf1α−/-Derived Tumor Growth by Nrf2 Deficiency

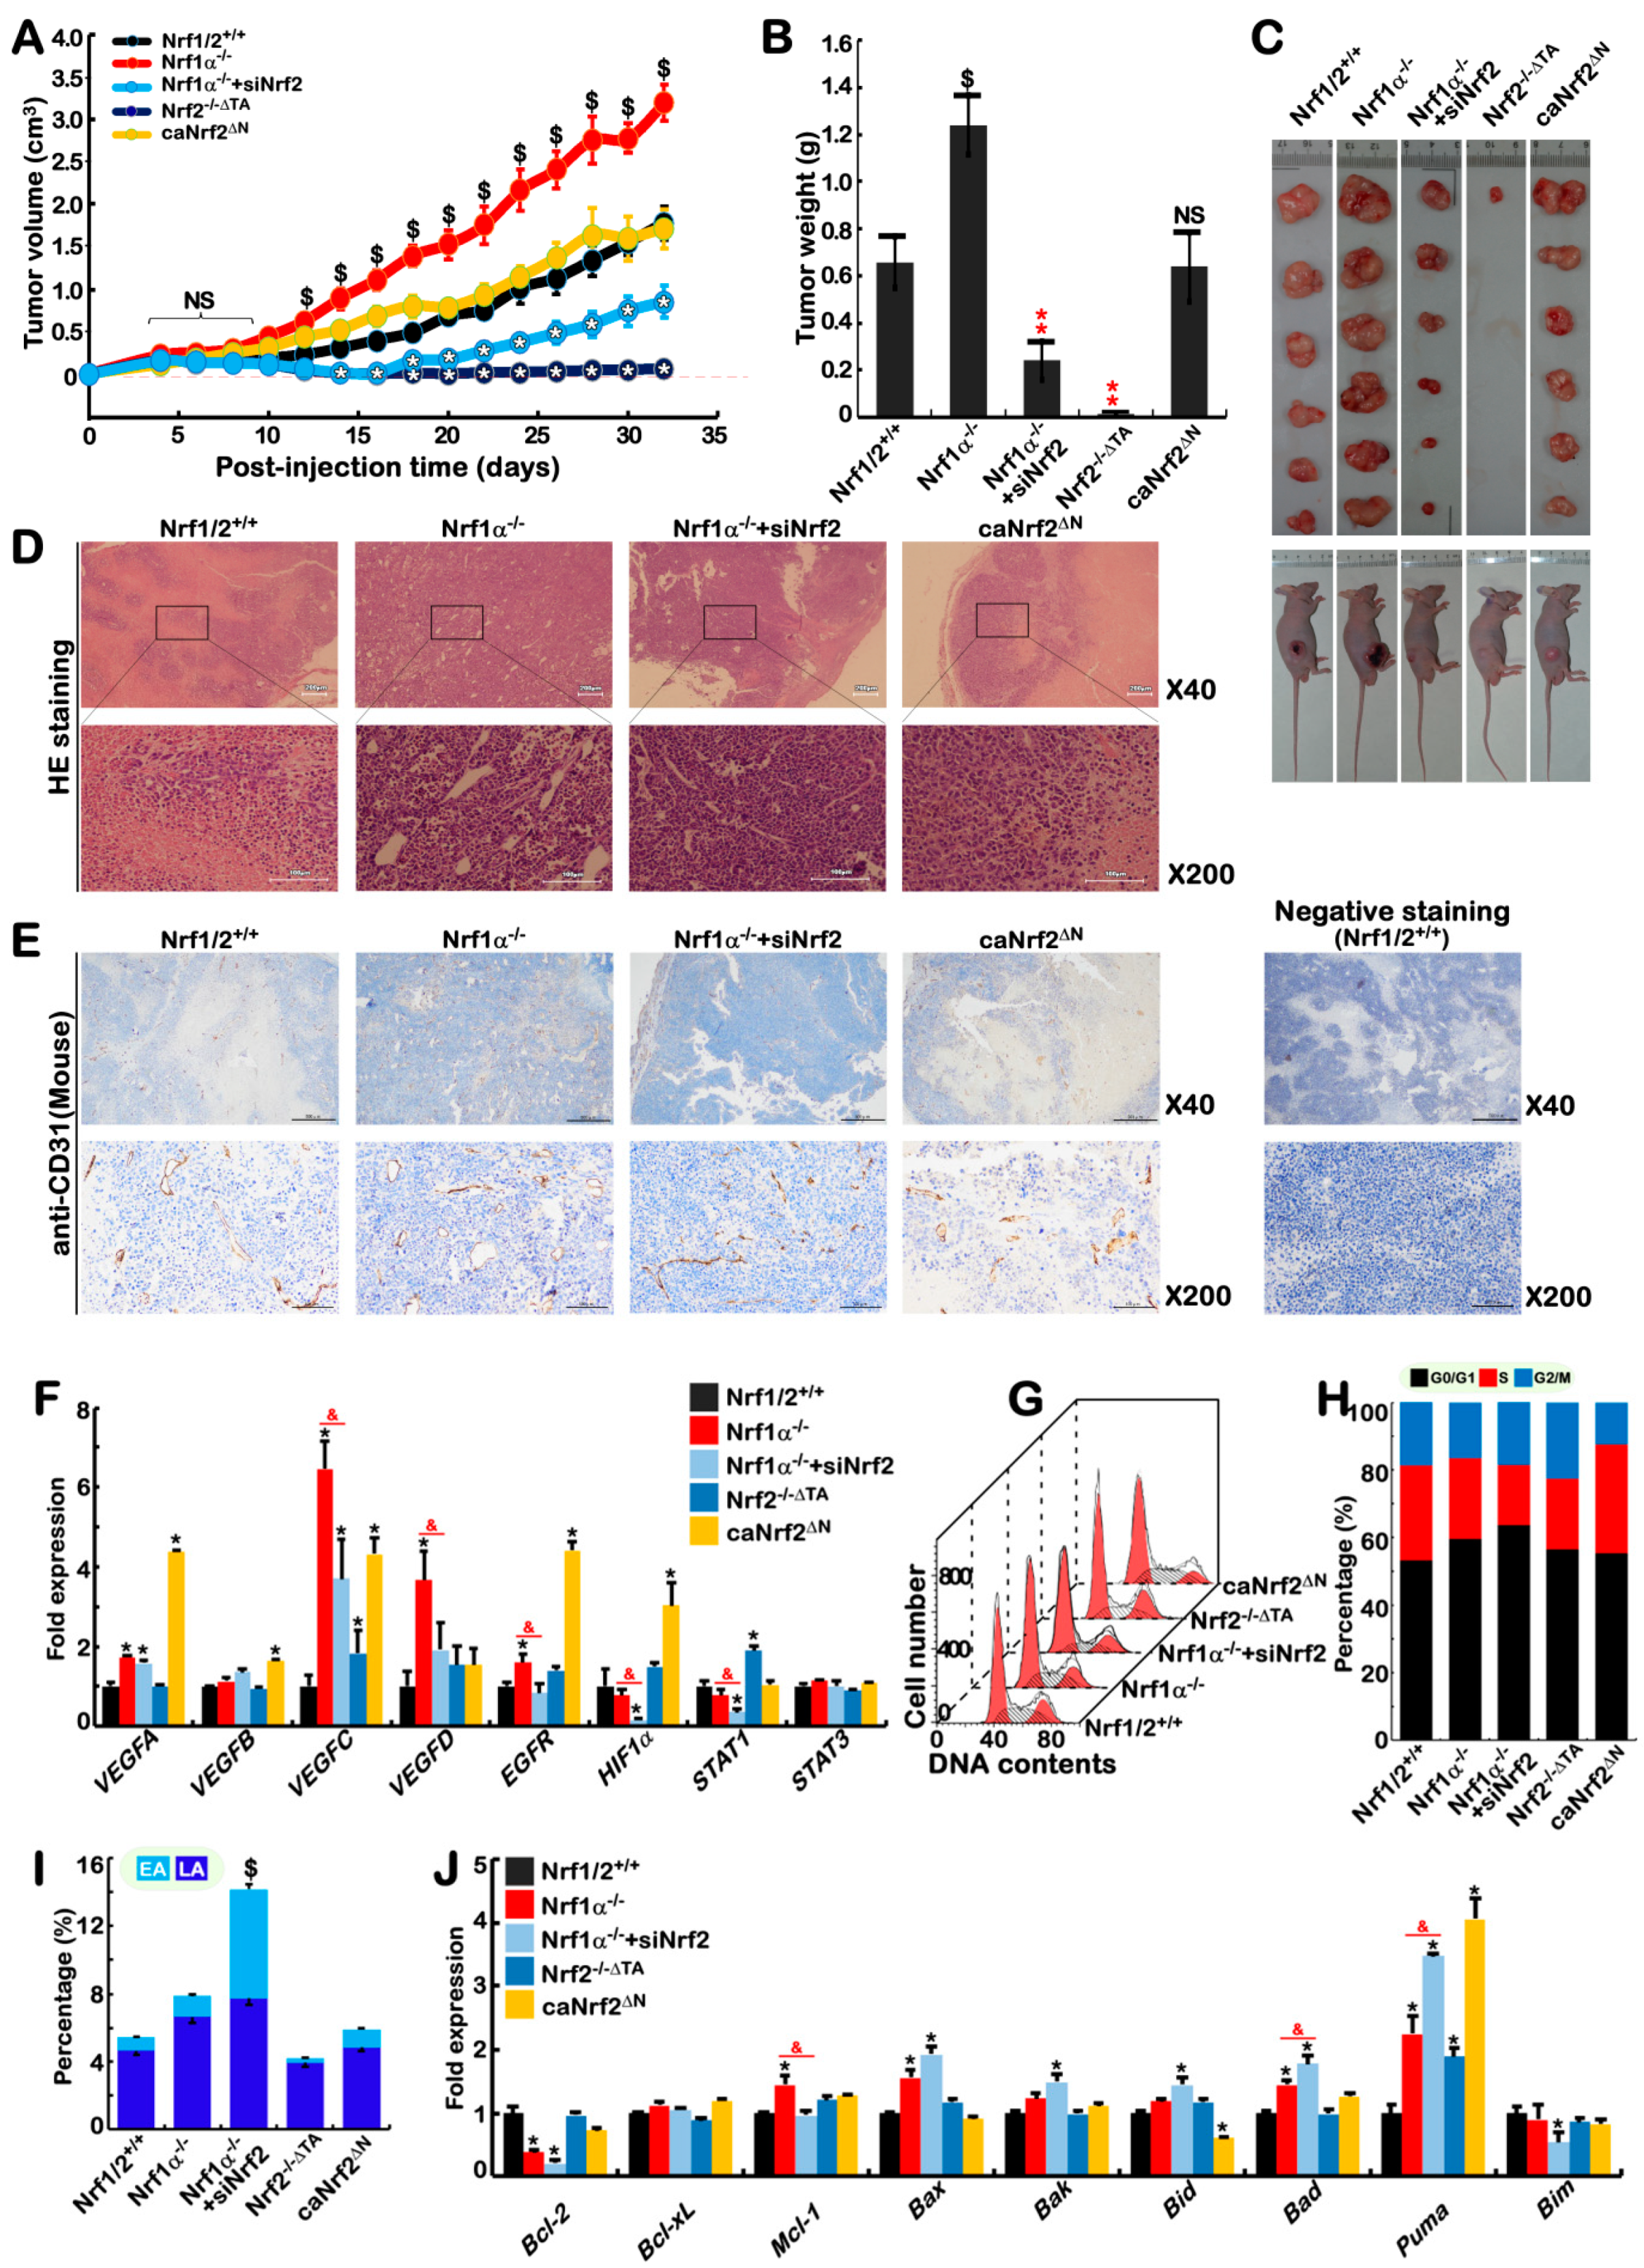
Our previous work revealed that the in vivo malignant growth of Nrf1α−/-derived hepatoma is accompanied by metastasis to the liver in xenograft mice [50]. Herein, to elucidate what effects have been elicited by Nrf1α and Nrf2 on tumor repression or promotion, we further investigate distinct genotypic tumors derived from Nrf1/2+/+, Nrf1α−/, Nrf1α−/+siNrf2, Nrf2−/−ΔTA and caNrf2ΔN cells in xenograft mice. Their tumorigenicity was evaluated by measuring tumor volumes and weights. As illustrated in Figure 6A–C, Nrf2−/−ΔTA cells were inoculated in nude mice, but did not form more than one solid tumor. This strongly implies that the tumorigenicity of Nrf1/2+/+ cells, as controls, is almost completely abolished by inactivation of Nrf2. Conversely, constitutive activation of Nrf2 did not obviously influence the resulting caNrf2ΔN-driven tumorigenicity, by comparison to that of Nrf1/2+/+. This indicates that Nrf2-prone cancer promotion is dominantly confined by the presence of Nrf1α. Just such loss of Nrf1α function in Nrf1α−/ cells (albeit hyper-active Nrf2 is accumulated), enabled the resultant tumorigenicity to become significantly higher than that of Nrf1/2+/+-tumor, but rather was much strikingly suppressed by silencing of Nrf2 (in the Nrf1α−/+siNrf2-derived tumors) to the much less extent than that of Nrf1/2+/+ control cells (Figure 6A–C). Collectively, these findings demonstrate that Nrf2 acts as a tumor promoter, but it is efficiently confined by Nrf1α serving as a dominant tumor repressor, implying both are a pair of mutual antagonizing twin factors. Overall, malignant transformation of Nrf1α−/-derived cells is attributable to hyper-activation of Nrf2.
Histological examination showed that a considerable number of blood vessels were markedly formed in Nrf1α−/ tumors, but were reduced by Nrf2 knockdown in Nrf1α−/+siNrf2-derived tumors (Figure 6D,E). However, no marked differences in the vascularity of between caNrf2ΔN- and Nrf1/2+/+-bearing tumors were observed. Further insights into angiogenesis-related genes revealed that mRNA expression levels of VEGFA, VEGFC, VEGFD, EGFR, but not of HIF1α or STAT1 were strikingly elevated by knockout of Nrf1α, but the increased expression of VEGFC, VEGFD and EGFR was significantly reduced by silencing of Nrf2 (Figure 6F). Notably, knockdown of Nrf2 almost completely abolished expression of HIF1α and STAT1 in Nrf1α−/+siNrf2 cells, but no changes in these two factors were observed in Nrf1α−/ cells, as compared to those obtained from Nrf1/2+/+ cells. Rather, all other angiogenesis genes except VEGFD were up-regulated in caNrf2ΔN cells (giving high expression of Nrf1 and Nrf2), while only STAT1 but not other genes were up-regulated by inactive Nrf2−/−ΔTA mutant (Figure 6F). Altogether, both Nrf1α and Nrf2 are diversely involved in regulating the expression of angiogenesis genes except for STAT3 as examined above.
Intriguingly, the vascularity of Nrf1α−/+siNrf2-derived tumors seemed to be higher than that of Nrf1/2+/+-bearing tumors (Figure 6D), but such angiogenetic changes cannot serve to explain the observation that the Nrf1α−/+siNrf2-tumor volumes and weights were significantly less than those obtained from the Nrf1/2+/+-tumors. This implicates other rationales beyond angiogenesis. Thus, we employed flow cytometry to determine changes in the cell cycle and apoptosis in five distinct cell lines. As shown in Figure 6G,H, the S-phase of Nrf1α−/+siNrf2 cells was significantly shortened. Such a severe S-phase arrest of cell cycle is also further supported by quantitative analysis of gene expression, revealing that significant up-regulation of p16, p19, p21 p53 and CDK4 was accompanied simultaneously by down-regulation of RB1, CDK1, CyclinA2, CyclinB2, E2F3, E2F5, and E2F6 in Nrf1α−/+siNrf2 cells, when compared with its progenitor Nrf1/2+/+ or Nrf1α−/ cells (Figure S10A).
In addition to the S-phase arrest, the G0/G1-phase was relatively extended in Nrf1α−/+siNrf2 cell cycle (Figure 6H). Consistently, apoptosis of Nrf1α−/+siNrf2 cells was significantly enhanced, when compared with other cell lines (Figure 6I and Figure S10B–F). This is also supported by further analysis of apoptosis-related genes, unraveling that Bax, Bak, Bid, Bad, and Puma were significantly up-regulated, while anti-apoptotic BCL-2 gene was down-regulated, with no changes in BCL-xL and Mcl-1 in Nrf1α−/+siNrf2 cells (Figure 6J).
Although no significant differences in both growth and vascularity of between caNrf2ΔN- and Nrf1/2+/+-bearing tumors, the G2/M-phase of the caNrf2ΔN cell cycle was shortened, along with the S-phase extended (Figure 6H). This implies that G2/M-phase arrest is likely caused by constitutive activation of Nrf2, in agreement with the supportive evidence that inactivation of Nrf2 markedly prolonged the G2/M-phase of Nrf2−/−ΔTA cells (Figure 6H). Relevant gene expression analysis also revealed that p15, p21 and Puma were significantly up-regulated, but p18, CDK1, E2F2 and Bid were down-regulated by caNrf2ΔN (Figure 6J and Figure S10A). Conversely, the inactive Nrf2−/−ΔTA mutant still up-regulated expression of RB1, CDK1, E2F3, and Cyclin D1 (Figure S10A), but strikingly down- regulated FTH1 and FTL (both encode ferritin heavy and light chains, that are involved in both iron-dependent lipid peroxidation and ferroptosis, in Figure S10G). Overall, these demonstrate that Nrf1α and Nrf2 coordinately regulate certain key genes involved in cell cycle and apoptosis.

2.10. Different Subsets of Genes Are Finely Regulated by Nrf1α, Nrf2 Alone or Both

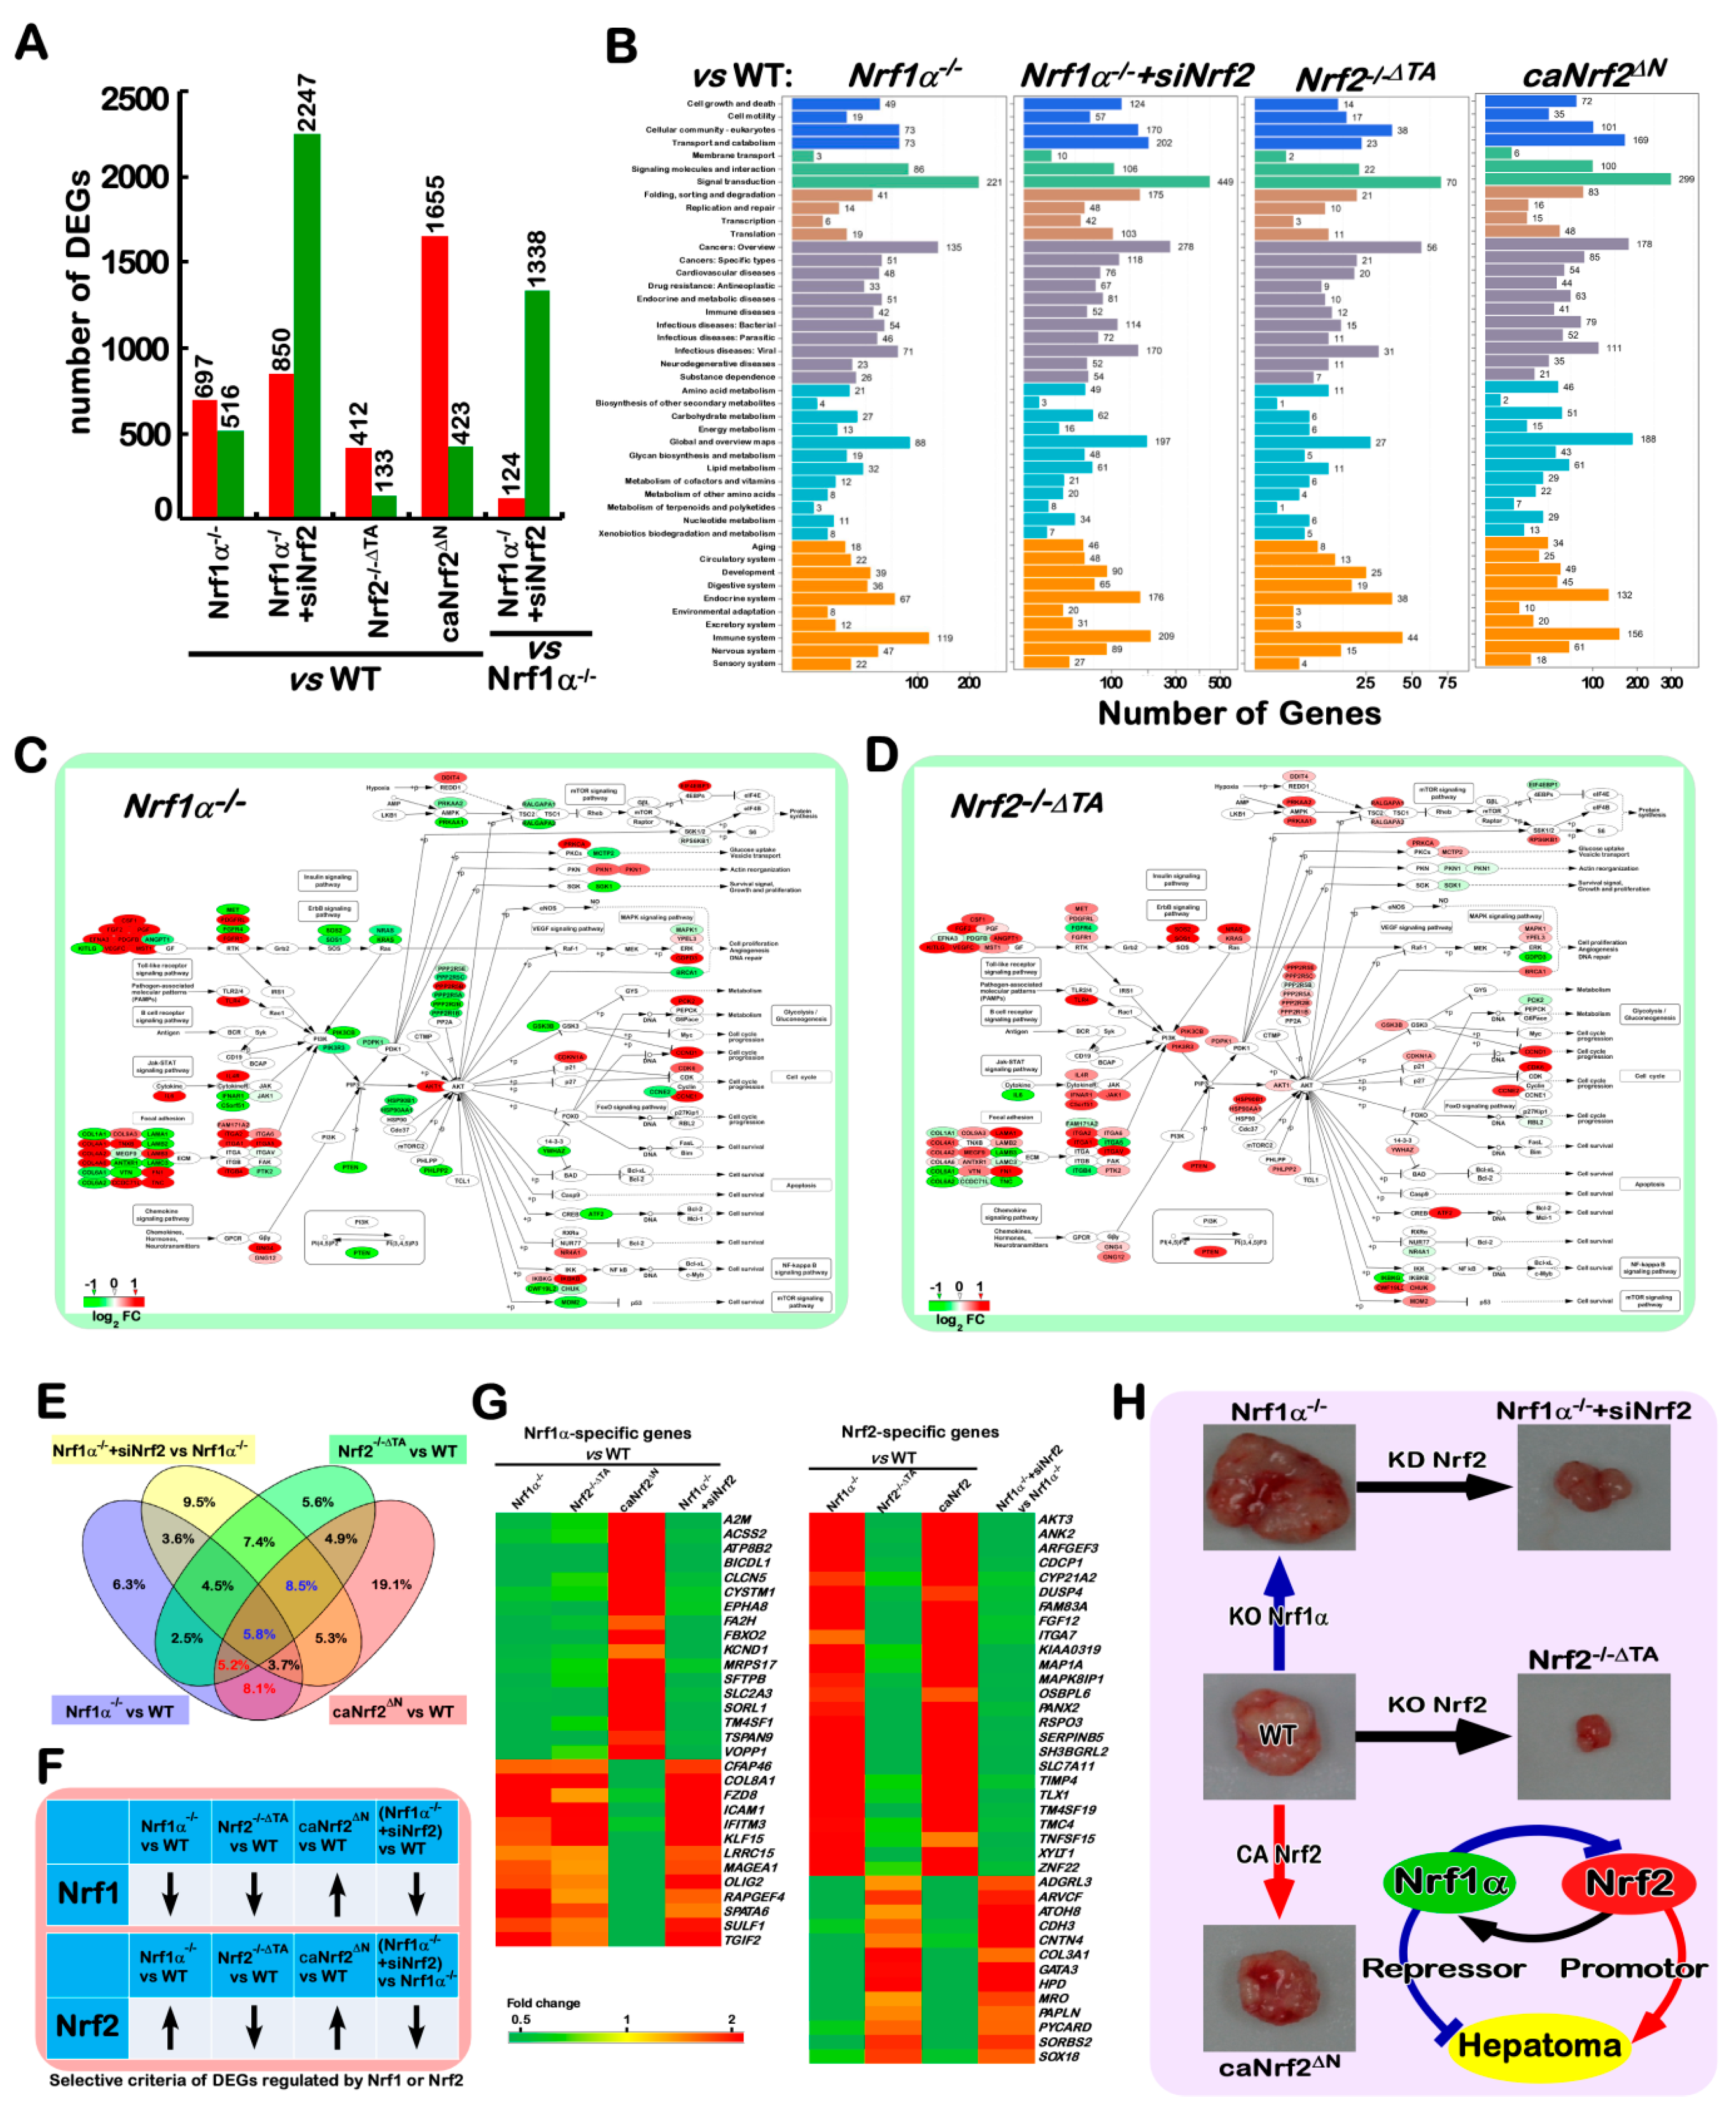
Nrf1 and Nrf2 are two important CNC-bZIP transcription factors that are widely expressed in various tissues and also regulate seemingly similar expression patterns of ARE-driven downstream genes that have been identified [33,85]. Notably, the ever-accumulating evidence demonstrates that Nrf1 and Nrf2 also exert many different and even opposing functions and, in particular, the unique indispensable functions of Nrf1 are not substituted by Nrf2 [32]. Accordingly, the above-described data unraveled that both CNC-bZIP factors have elicited mutual synergistic and antagonistic roles in regulating the precision expression of cognate genes in distinct cell processes, aiming to maintain the normal cellular homeostasis. Herein, to further evaluate the functional similarities and differences between Nrf1α and Nrf2, the genome-wide expression of genes in Nrf1/2+/+, Nrf1α−/, Nrf1α−/+ siNrf2, Nrf2−/−ΔTA and caNrf2ΔN cells was determined by transcriptome sequencing. Those detectable genes with a fold change ≥ 2 and another diverge probability ≥ 0.8 were defined as differentially expressed genes (DEGs), by comparison with equivalents measured from Nrf1/2+/+ cells (Figure 7A).
Consequently, Nrf1α−/ cells gave rise to 1213 of DEGs (i.e., 697 up-regulated plus 850 down- regulated), but the number of DEGs in Nrf1α−/+siNrf2 cells was significantly increased to 3097 genes, 2247 of which were rather down-regulated by siNrf2 (Figure 7A). Intriguingly, only 545 of DEGs were detected in Nrf2−/−ΔTA cells, implying that many genes are silenced or prevented by the inactive Nrf2−/−ΔTA mutant (distinctive from simple knockout of this factor). These data suggest that, in this regulatory system by the cooperation of Nrf1 and Nrf2, a single change of both has only limited effects on overall gene expression, and thus both changes will have a greater impact. For instance, when compared to those of Nrf1α−/ cells, silencing of Nrf2 caused 124 genes to be up-regulated, and still led 1338 genes to be down-regulated in Nrf1α−/+siNrf2 cells (Figure 7A, last column), such that malignant growth of Nrf1α−/-derived tumor was repressed by knockdown of Nrf2. Conversely, reinforced expression of Nrf2 (and Nrf1) in caNrf2ΔN cells led to up-regulation of 1655 genes, albeit 423 genes were still down-regulated. Thus, these findings indicate that Nrf2 is a dominant activator to regulate many genes, while Nrf1α appears to exert dominant negative effects on some genes.
Enrichment analysis revealed that DEGs of Nrf1α−/ cells were subject to 16 pathways (p < 0.001), of which 9 are responsible for human disease and 4 are involved in the environmental information processing (Table S1). By contrast, most of cellular processes were significantly changed in Nrf2−/−ΔTA and Nrf1α−/+siNrf2 cells (Tables S2 and S3). Thus, loss of Nrf1α relevant to the disease suggests that its function is essential for maintaining cellular homeostasis, while Nrf2 exerts its greater roles in regulating most of cellular physiological processes. For example, the above-described alterations in the cells cycle of Nrf1α−/+siNrf2 were also validated by transcriptome (Table S2). Further calculation of the DEGs distribution unraveled that signal transduction, cancer-relevant, immune system and metabolism were the most abundant secondary KEGG pathways in Nrf1- or Nrf2-deficient cells (Figure 7B). An insight into the cellular signaling transduction uncovered that the most DEGs are involved in the PI3K-AKT pathway (Table S1). In this pathway, a key tumor suppressor PTEN was significantly and oppositely altered in both Nrf1α−/ and Nrf2−/−ΔTA cell lines (Figure 3F and Figure 7C,D). Based on these specific findings, much-focused DEGs in Nrf1α−/ and Nrf2−/−ΔTA cells were mapped according to the KEGG pathway. The results illustrated that both cell lines displayed significant opposing changes in the PI3K-AKT pathways (Figure 7C,D and Figure S11A). As interested, knockout of Nrf1α (with accumulated Nrf2) caused a general reduction in transcription of most AKT-signaling molecules, but they were thus generally increased by inactivation of Nrf2. Such striking disparity is dictated by the distinction of Nrf2 proteins in between these two cell lines (Figure 2 and Figure S6).
Notably, although seemingly similar downstream genes are regulated by Nrf1 and Nrf2, de facto activation of Nrf2 by knockout of Nrf1α can inevitably cause their opposite effects on some genes against theoretic expectations. This is further evidenced by the results from Nrf1α−/+siNrf2 cells, revealing that many of those accumulated Nrf2’s effects on downstream genes by Nrf1α−/ were strikingly reduced by knockdown of Nrf2. Therefore, by comparison of the DEGs between Nrf1α−/ and Nrf1α−/+siNrf2 cell lines, an opposite expression profiling of 87 genes was uncovered by Nrf2 knockdown (Figure S11B–D). About 24% of these genes are responsible for the metabolism-related enzymes. This implies that the function of Nrf2 is closely related to cellular metabolism, particularly in the absence of Nrf1α. This is further approved by another opposite expression profiling of other 83 DEGs in between Nrf2−/−ΔTA and caNrf2ΔN cell lines (Figure S12). Still 16% of differential expression genes are related to cellular metabolism, but the other 24% of these genes are involved in signaling transduction. This observation indicates that in the presence of Nrf1α, Nrf2 acts as a major player in cellular signaling cascades, but its role in metabolism appears to be restricted possibly by Nrf1α.
The Venn diagrams illustrated that distinct subsets of DEGs were regulated by Nrf1, Nrf2 alone or both (Figure 7E). The common genes regulated by Nrf1α and Nrf2 were seen by comparison of DEGs in either Nrf1α−/ or caNrf2ΔN with wild-type. In the intersection of Nrf1α−/ and caNrf2ΔN, the remaining portions after excluding Nrf1α−/+siNrf2 with Nrf1α−/ were composed of the (red numbered) genes closely correlated to regulation by Nrf1α. The genes regulated by Nrf2 were also found by comparison of DEGs in Nrf1α−/+siNrf2 with Nrf1α−/, as well as Nrf2−/−ΔTA or caNrf2ΔN with wild-type, such the intersection of these three sets comprised the (blue numbered) genes preferably regulated by Nrf2. Furtherly, based on the changes in Nrf1 and Nrf2 proteins detected in distinct cell lines (Figure 7F), we also screened which portions of highly-relevant downstream genes were consistent with or opposite to the changing trends of Nrf1 or Nrf2, respectively. Consequently, 30 of Nrf1α-specific downstream genes were shown (in Figure 7G, left panel), amongst which 17 genes were up-regulated and 13 genes were down-regulated. Meanwhile, 38 of Nrf2-specific downstream genes were also found herein, of which 25 were up-regulated and 13 were down-regulated (right panel). Collectively, our findings provide an axiomatic rationale for differential expression of different subsets of genes to dictate distinct phenotypes of animal xenograft tumors (Figure 7H). Significantly, the malfunction of Nrf2 is defined as a potent tumor promoter, but it can be efficiently confined or suppressed by Nrf1α that acts as a dominant tumor repressor.

3. Discussion

The ever-accumulating evidence has demonstrated that Nrf1 is a key player in the pathogenesis of NASH and HCC, as well as other relevant neurodegenerative diseases and type 2 diabetes [32,33]. However, it should be noted that these experimental mouse genomes were manipulated to delete all Nrf1 isoforms from the single Nrf1/Nef2l1 gene. In this study, human Nrf1α-specific knockout was achieved by its gene-editing so as to create the frameshift mutation. The phenotypes of NASH and malignancies were reconstructed by using the monoclonal Nrf1α−/ cell lines. Thereby, this provides an available model for the follow-up study to elucidate the relevance of Nrf1α with NASH and its malignant transformation into HCC. In the Nrf1α−/-leading model, the inflammation marker COX2 is constitutively increased, which thus entails a non-resolving feature. By contrast, the development- related COX1 expression was almost completely abolished by Nrf1α−/. The resultant metabolites of arachidonic acid by the rate-limiting enzyme COX2, that also serves as a direct target of Nrf2 [57,58], are much likely to play a crucial role in development and progression of inflammation, particularly NASH and hepatoma caused by knockout of Nrf1α−/.
Further examinations revealed that the Nrf1α−/-caused increase of COX2 expression occurred by accumulated Nrf2 protein, but both were effectively diminished by two inhibitors of JNK (i.e., SP600125) and mTOR (i.e., rapamycin). Hence, the Nrf2-COX2 pathway is inferable to be regulated by both JNK and mTOR signaling pathways, albeit the detailed mechanisms remain unclear. Herein, we also found that inhibition of the Nrf2-COX2 pathway is accompanied by decreases in AKT, S6K1 and GSK3β. This is consistent with the notion that Nrf2 is regulated by the mTOR-AKT-GSK3β pathway [86]. Our findings also unravel that Nrf2 may be monitored by JNK signaling towards AP-1 pathway, but in turn, some AP-1 components (i.e., Jun, Fra-1) are mediated by Nrf2 insofar as to form a feedback regulatory loop. Contrary to Nrf1α−/, MEFs of Nrf1−/(ΔDBD), in which almost all DBD (DNA-binding domain)-containing Nrf1 isoforms are disrupted [27,28,51,52], exhibited marked decreases in total COX2 and most of Nrf2 to considerably lower levels, that are roughly similar to those determined in Nrf2−/(ΔDBD) MEFs (Figure S5C). This difference between human Nrf1α−/ and mouse Nrf1−/(ΔDBD) demonstrates Nrf1 isoform-dependent regulation of the Nrf2-COX2 pathway in distinct species as experimented.
Notably, accumulation of free radicals in Nrf1−/(ΔDBD) MEFs results from decreased expression of ARE-driven genes involved in glutathione synthesis, antioxidant and detoxification [87]. Similar, but different, stress caused by liver-specific knockout of Nrf1−/(ΔDBD) activates a subset of Nrf2-dependent ARE-battery genes in mice, but Nrf2 cannot still compensate for the loss of Nrf1’s function leading to NASH and HCC [27,28]. The inducible liver-specific knockout of Nrf1−/(ΔDBD) in mice also increased glutathione levels; this was considered to result from up-regulation of xCT (as a component of the cystine/glutamate antiporter system XC), but with no changes in glutathione biosynthesis enzymes [51]. In the present work, human Nrf1α−/ leads to substantial increases in both ROS and lipid levels, also accompanied by high expression of xCT and other ARE-driven genes (e.g., HO-1, GCLC, GCLM, NQO1). These genes are Nrf2-dependent because their expression is reduced by inactive Nrf2−/−ΔTA mutant and also repressed by silencing of Nrf2 (in Nrf1α−/+siNrf2 cells). In addition to COX1 and COX2, both Alox5 and FLAP (both also involved in arachidonic acid metabolism) are significantly up-regulated in Nrf1α−/ cells, and also modestly increased in Nrf2−/−ΔTA cells. However, liver-specific Nrf1−/(ΔDBD) mice display no changes in the expression of COX1, COX2 and Alox5 [51]. Overall, these discrepancies are likely attributed to the variations of which Nrf1 isoforms have two-sided effects on Nrf2 and diverse downstream genes, depending on different cell types in distinct species. Hence, it is crucially important to determine the bona fide effects of Nrf1 and Nrf2 alone or in combination on distinct cognate genes within inter-regulatory networks (Figure 5K).
Albeit Nrf1 and Nrf2 are recruited for directly binding the ARE sites in the promoter regions of COX1 and COX2 genes [57,58], our evidence unravels that both CNC-bZIP factors have different or opposing roles in bi-directional regulation of COX1 and COX2 by distinct interrelated positive and negative pathways. In particular, Nrf1α may have a two-handed potency to execute as an activator or repressor, depending on distinct cognate genes such as COX1 and COX2, through different regulatory pathways. For example, the regulation of COX2 is contributed positively by Nrf2 and also negatively by Nrf1α, albeit its promoter-driven PCOX2-Luc reporter is transactivated by Nrf1 and Nrf2. Such direct transactivation by Nrf1 (as well as Nrf2) may be neutralized or counteracted by its dominant-negative effects triggered by other indirect mechanisms (as shown in Figure 5K).
Just contrary to COX2, expression of COX1 is regulated positively by Nrf1α but negatively by Nrf2, albeit no direct activation of its promoter-driven PCOX1-Luc reporter by ectopic Nrf1 and Nrf2 was detected here. In an attempt to explore the mechanisms by which COX1 is indirectly regulated by Nrf1/2, we found that both CNC-bZIP factors can directly activate the expression of miR-22 driven by its ARE site. The miR-22, along with Nrf1 and Nrf2, all inhibit the PTEN-miR22b-Renilla reporter activity, implying that these two factors possess an intrinsic ability to suppress the tumor suppressor PTEN through activating miR-22, as consistent with previous reports [76,88]. However, de facto endogenous PTEN expression at mRNA and protein levels is almost completely abolished in Nrf1α−/ cells (retaining hyper-active Nrf2), but also dramatically increased in Nrf2−/−ΔTA cells (with decreased Nrf1). Collectively, these findings demonstrate that Nrf2 is a dominant negative to inhibit PTEN; this is further evidenced by a significant reduction of PTEN by a priori constitutive activator of Nrf2 in caNrf2ΔN cells (also with enhanced Nrf1). By contrast, Nrf1α has the ’Ying-Yang’ two-sided effects on PTEN. On one side, Nrf1α acts as a major positive regulator of PTEN, while on the other side of Nrf1α, it is enabled to exert a minor negative role in PTEN, but this negation could also be concealed by dominant negative Nrf2 or counteracted by the major positive action of Nrf1α per se.
Since PTEN is well known to act as the most critical inhibitor of the PI3K-AKT pathway [76,88], thereby, inactivation of PTEN by ROS provokes activation of its downstream PI3K-AKT signaling cascades so as to promote cell survival [89,90]. Notably, the ever-increasing evidence demonstrates that PTEN can direct an inhibitory effect on the expression of ARE-driven genes by inhibiting Nrf2 [17,19]. Taken together with our results from this study, it is demonstrated that the intracellular ROS levels are monitored by Nrf1α- and/or Nrf2-mediating ARE-battery genes, but in turn, expression of Nrf1/2-target genes is also negatively regulated by ROS-activated miR22-PTEN signaling to form a feedback regulatory circuit. Of note, activation of Nrf1/2 by ROS can promote the miR-22 expression, which may serve as an important approach to regulate the PTEN-PI3K-AKT pathway. Thereby, the quantitative regulations of cellular ROS levels are achieved by close cooperation of Nrf1α and Nrf2 coordinately through direct and indirect mechanisms, so as to maintain normal redox homeostasis. Conversely, dysfunction of Nrf1α and Nrf2 (particularly its malfunction) leads to severe redox stress and resultant cancer development possibly by the aberrant PTEN-PI3K-AKT signaling pathway.
It is inferable that almost abolishment of PTEN in malignantly growing Nrf1α−/-derived tumor cells results principally from an aberrant accumulation of Nrf2 protein, because rescue of PTEN expression occurs after Nrf2 is silenced, so that the existing Nrf1α−/+siNrf2-derived tumor growth is dramatically repressed by Nrf2 knockdown. In turn, aberrant accumulation of Nrf2 in Nrf1α−/ cells is caused by impaired PTEN expression. This is consistent with the pathology of PTEN−/-leading cancer, in which the abnormal nuclear accumulation of Nrf2 is caused by an impairment of GSK3β- directed β-TrCP-based proteasome-mediated degradation, as described by [19,20,21]. In addition to an impairment of the GSK3β-directed β-TrCP pathway, aberrant accumulation of Nrf2 is augmented by inhibition of the Keap1-based proteasome-mediated degradation in Nrf1α−/-derived tumor cells. Noticeably, the Keap1 protein, rather than mRNA, levels are significantly reduced in Nrf1α−/ cells, albeit its binding partner p62, acting as a major regulator of Keap1 to the autophagic degradation [91], is strikingly down-regulated in Nrf1α−/ cells. From this, we postulate that a p62-independent mechanism may account for the Keap1 protein degradation and also is reinforced in Nrf1α−/ cells. However, it cannot be ruled out that the biosynthesis of Keap1 polypeptides may also be retarded during these conditions.
Several lines of evidence presented herein demonstrate that Nrf2 is predominantly negatively regulated by Nrf1α because Nrf1α−/ enables Nrf2 to be liberated from the confinements by both the PTEN-GSK3β-directed β-TrCP-based and Keap1-based proteasomal degradation pathways (Figure 5K). Consequently, accumulation of Nrf2 leads to aberrant activation of ARE-driven cytoprotective genes (e.g., HO-1, GCLM, NQO1) in so much as to shelter or promote Nrf1α−/-driven tumor cells. In fact, These ARE-battery genes can be directly activated by Nrf1α, but some of these downstream genes could also be inhibited through braking control of the Nrf2 activity. Overall, distinct levels of Nrf1 alone or in cooperation with Nrf2 finely tune and also quantitatively regulate the expression of diverse downstream genes in order to meet different cellular needs (Figure 4L and Figure 5K). Thereby, these resulting collective effects determine distinctions in phenotypes of animal xenograft tumor models as deciphered in this study (Figure 7H). Consistently, malignant growth of Nrf1α−/-derived tumor is substantially suppressed by knockdown of Nrf2, by comparison with Nrf1α−/+siNrf2-derived tumor. Conversely, almost no solid tumor is formed in those nude mice that have been inoculated by injecting the inactive Nrf2−/−ΔTA-derived cells, albeit Nrf1 is modestly decreased along with loss of Nrf2’s function. These demonstrate that Nrf1α acts as a dominant tumor suppressor principally by confining the oncogenicity of Nrf2. In turn, albeit Nrf2 exerts a dominant tumor-promoting role in tumorigenesis and malignant growth, it can also directly mediate the Nrf1 gene transcription to form a feedback regulatory loop. This is validated by further evidence revealing that, upon the presence of Nrf1 in caNrf2ΔN-derived tumor cells, its growth is almost unaffected by constitutive activation of Nrf2, as well as antioxidant and detoxifying genes, when compared with equivalents of wild-type Nrf1/2+/+-bearing tumor.
In an attempt to clarify those seemingly contradictory results obtained from loss of Nrf1α and its functional gain (i.e., ectopic over-expression), we have also surprisingly found that there exists a mutual inter-regulatory relationship between Nrf1α and Nrf2, thereby enabling both factors to elicit opposing and unifying roles in regulating distinct subsets of downstream genes (particularly ARE- driven cognate genes). Importantly, we have discovered that that forced expression of Nrf1 enables the Nrf2 protein to be reduced, whereas loss of Nrf1α leads to a significant increase in Nrf2 protein, but not its mRNA levels (Figure 4L). By sharp contrast, both mRNA and protein levels of Nrf1 are increased by over-expression of Nrf2 or its constitutive activation of caNrf2ΔN, but also repressed by inactivation of Nrf2. Further experimental evidence has unraveled no activation of the human Nrf2 promoter-driven PNrf2-Luc reporter mediated by Nrf1 or Nrf2, albeit mouse Nrf2 gene was activated by its ARE sites as described [92]. Notably, the human Nrf1 promoter-driven PNrf1-luc reporter is trans-activated by Nrf1 (at the locus Site-2) and Nrf2 (at the locus Site-1), respectively (Figure 5 and Figure S8A). These findings demonstrate there are, at least, two distinct levels (i.e., transcript and protein abundances) at which Nrf1α and Nrf2 have cross-talks with each other to influence the expression of ARE-driven genes. Thereby, synergistic or antagonistic effects of Nrf1α and Nrf2 depend on mutual competition or somehow coordination with spatiotemporally binding to the same or different ARE enhancers within their downstream genes. Overall, such inter-regulatory cross-talks between Nrf1α and Nrf2 may be a vitally important strategy for the precision regulation of distinct downstream genes. This rationale can provide a better explanation of those complicated physio- pathological functions with distinct disease phenotypes exhibited in different models, as described [32,93].
Importantly, a hot controversy surrounds dual opposing roles of Nrf2 in the pro- or anti-cancer contexts, termed ‘the Nrf2 paradox’ [93,94]. This study has defined that function of Nrf2 is dictated by activation or inactivation of Nrf1α. This is because deterioration of Nrf1α−/-tumor results from hyper-active Nrf2, along with decreased PTEN and activation of downstream PI3K-AKT signaling, but the Nrf1/2+/+-tumor growth is unaffected by constitutive activation of Nrf2 when compared with caNrf2ΔN-tumor. Consistently, it has been recently showed that Nrf2 also acts as a tumor-promoting player, depending upon aberrant activation of the PI3K-AKT signaling pathway, albeit it serves as a tumor-preventing player by activating ARE-driven cytoprotective genes under normal activation conditions [21]. As such, a similar subset of ARE-driven genes is also highly expressed in Nrf1α−/ and caNrf2ΔN cell lines. However, our findings demonstrate that the tumor-promoting role of Nrf2 is determined by loss of Nrf1α function, independent of those cytoprotective gene expressions. Even as a dominant braking control of Nrf2 activity, Nrf1α may play an essential role for ’decision-maker’ or ‘executor’ in the cell senescence and cancer progression, since a secretory phenotype of senescent cells occurs by a Nrf2-independent mechanism [95], albeit the relevance to Nrf1 needs to be verified.
In summary, this study provides a panoramic view of the mutual inter-regulatory cross-talks between Nrf1α and Nrf2 in order to determine quantitative expression of distinct downstream genes that are involved in different patho-physiological processes. Significantly, the axiomatic rationale underlying distinct animal xenograft tumor phenotypes has also been unraveled by transcriptomic analysis of the genome-wide gene expression in Nrf1α−/, Nrf1α−/+siNrf2, Nrf2−/−ΔTA and caNrf2ΔN cell lines, when compared with wild-type Nrf1/2+/+. Notably, an overwhelming majority of the PTEN- directed PI3K-AKT signaling cascades are strikingly activated in Nrf1α−/, but rather repressed in Nrf2−/−ΔTA cells. Silencing of Nrf2 leads to opposing expression of 87 genes in between Nrf1α−/ and Nrf1α−/+siNrf2 cell lines. Although most of cognate genes are, to different extents, co-regulated by Nrf1α and Nrf2, this study has highlighted about 30 of Nrf1α-specific downstream genes, and 38 of Nrf2-specific downstream genes (Figure 7G). Among Nrf1α-regulated genes, those encoding A2M, EPHA8, FBXO2, KCND1, SLC2A3, SORL1, OLIG2, and RAPGEF4 should be responsible for the nervous system, although it is unclear whether they are relevant to those phenotypes of Nrf1α−/ -leading neurodegenerative diseases as reported by [34,35]. Only expression of ACSS2, FA2H, and KLF15 genes are associated with lipid metabolism, but it is required to determine their roles in relevant phenotypes, as described by [27,36,40,41]. By contrast, a portion of Nrf2-specific genes are critical for the development of various tissues and organs, neurons and cardiomyocytes, but none of the specific physio-pathological phenotypes in the Nrf2−/−ΔDBD mice are observed, implying that their functions can be compensated by Nrf1 or other factors. As such, the other Nrf2-specific genes may be involved in development, movement and adhesion of epithelial cells, but it is unknown whether these gene functions enable Nrf2 to be endowed with its potent tumor-promoting roles in cancer progression and metastasis.

4. Materials and Methods

4.1. Cell lines, Culture and Transfection

All four cell lines Nrf1α−/, Nrf1α−/+siNrf2, Nrf2−/ΔTA and caNrf2ΔN were created in this study. Their progenitor cells are the human hepatocellular carcinoma (HepG2) or another non-cancerous human liver (HL7702) cell lines. The latter two lines HepG2 and HL7702 are wild-type (Nrf1/2+/+, Keap1+/+) cells, because not any mutants in the Nrf1, Nrf2 and Keap1 genes are therein confirmed by sequencing. However, it is important to note that Nrf1 and its long TCF11 isoform are co-expressed at a ratio of 1:1 in HL7702 cells. By contrast, significantly decreased expression of Nrf1 is observed in HepG2 cells (Ren et al., 2016), while almost no expression of its longer TCF11 transcripts were detected. For relevant identification of these cell lines, see Figure 1 and Figures S1 and S9.
Experimental cells were allowed for growth in DMEM supplemented with 5 mM glutamine, 10% (v/v) foetal bovine serum (FBS), 100 units/mL of either of penicillin and streptomycin, in the 37 °C incubator with 5% CO2. The cells were transfected with indicated plasmids alone or in combination for 8 h, using Lipofectamine® 3000 Transfection Kit (Invitrogen, Carlsbad, CA, USA), and then allowed for 24-h recovery from transfection in the fresh medium before being subjected to indicated experiments.

4.2. Expression Constructs and other Oligos Used for siRNA and miRNA

Expression constructs for human Nrf1, Nrf2, JUN and FOS were made by cloning each of their full-length cDNA sequences into a pcDNA3 vector, respectively. The other plasmids specifically for the genome-editing of Nrf1 or Nrf2 by Talens or CRISPR/Cas9 were created and identified (as shown in Figure 1 and Figures S1 and S9). Further, we also made four specific luciferase reporters, which were driven by distinct gene promoter regions from the human Nrf1, Nrf2, COX1 and COX2. Different lengths of these gene promoter regions were amplified by PCR from their genomic loci and inserted into the PGL3-basic vector. In addition to these intact reporter genes PNrf1-Luc, PNrf2-Luc, PCOX1-Luc, PCOX2-Luc and miR22-ARE-Luc, all these relevant ARE-specific mutant reporters were engineered. Moreover, double fluorescent reporters (i.e., PTEN-miR22b and COX1-miR22b) were also created by cloning the 3’ UTR region sequences of COX1 and PTEN, that were amplified from reverse transcription PCR products and then ligated into the psiCHECK2 vector. All primers and other oligos used for siRNAs and miR-RNAs (Table 1) were synthesized by Sangon Biotech (Shanghai, China). The fidelity of all constructs used in this study was confirmed to be true by sequencing.

4.3. Subcutaneous Tumor Xenografts in Nude Mice

Mouse xenograft models were here made by subcutaneous heterotransplantation of the human hepatoma HepG2 (i.e., Nrf1/2+/+ or each derivate of Nrf1α−/, Nrf1α−/+siNrf2, Nrf2−/−ΔTA and caNrf2ΔN cell lines into nude mice, as described [96]. Experimental cells (1 × 10⁷) were allowed for growth in the exponential phase) and then suspended in 0.2 mL of serum-free DMEM, before being inoculated subcutaneously into the right upper back region of male nude mice (BALB/Cnu/nu, 6 weeks, 18 g, from HFK Bioscience, Beijing, China) at a single site. The procedure of injection into all experimental mice was completed within 30 min, and subsequent formation of the subcutaneous tumour exnografts was observed. Once the tumor exnografts emerged, their sizes were successively measured once every two days, until the 32nd day when these mice were sacrificed and their transplanted tumors were excised. The sizes of growing tumors were calculated by a standard formula (i.e., V = ab2/2) and then are shown graphically (n = 6 per group). Thereafter, the tumor tissues were also subjected to the histopathological examination by the routine hematoxylin-eosin staining.
Notably, all the relevant animal experiments in this study were indeed conducted according to the valid ethical regulations that have been approved. All mice were maintained under standard animal housing conditions with a 12-h dark cycle and allowed access ad libitum to sterilized water and diet. All relevant studies were carried out on 8-week-old male mice (with the license No. PIL60/13167) in accordance with the United Kingdom Animal (Scientific Procedures) Act (1986) and the guidelines of the Animal Care and Use Committees of Chongqing University and the Third Military Medical University, both of which were subjected to the local ethical review (in China). All relevant experimental protocols were approved by the University Laboratory Animal Welfare and Ethics Committee (with two institutional licenses SCXK-PLA-20120011 and SYXK-PLA-20120031).

4.4. Histology and Immunohistochemistry

The xenograft tumor tissues were immersed in 4% paraformaldehyde overnight before being transferred to 70% ethanol. Individual tumor tissues were placed in the processing cassettes, dehydrated through a serial of alcohol gradient, and embedded in paraffin wax blocks. These, paraffin-embedded samples were then sectioned into a series of 5-μm-thick slides. Before staining, the tissue sections were de-waxed in xylene, rehydrated through decreasing concentrations of ethanol, and washed in PBS. Lastly, they were stained with routine hematoxylin and eosin (H&E), and visualized by microscopy. For immunohistochemical staining, the slides of tumor tissues were de-paraffinized in a solution of xylene and then dehydrated in the concentration-graded ethanol before inactivation of endogenous peroxidase activity. Subsequently, the samples were allowed for boiling in microwave for 15 min in a citrate buffer (pH 6.0) so to retrieve antigen, and then blocked within 1% BSA for 60 min. Thereafter, the sample sections were incubated with the primary antibodies against CD31 (dilution 1:100) at 4 °C overnight, and then re-incubated for 60 min with the biotin-conjugated secondary antibody at room temperature, before being visualized by DAB staining. The resultant images presented were acquired under a light microscope (Leica DMIRB, Leica, Frankfurt, Germany) equipped with a DC350F digital camera.

4.5. Immunocytochemistry and Confocal Microscopy

Experimental cells (2 × 10⁵) that had been allowed for 24-h growth on a cover glass placed in each of 6-well plates, the cells were fixed for 15 min with 4% paraformaldehyde. The cells were permeabilized for 10 min with 0.1% Triton X-100 in PBS, before immunocytochemistry with the primary antibodies against Nrf1 (dilution 1:50) and Nrf2 (dilution 1:500) incubated at 4 °C overnight. The immunostained cells were then visualized by further incubation with the Alexa Fluor 488- conjugated goat anti-rabbit IgG (dilution 1:200) for 1 h at room temperature in the dark, followed by DAPI staining of the nuclear DNAs for 5 min. The resulting fluorescence images were observed and photographed under a confocal microscope (Leica).

4.6. Subcellular Fractionation

Equal numbers (1 × 10⁶) of different cell lines were seeded into each of 6-cm dishes and allowed for growth for 24 h before being harvested by incubation with ice cold Nuclei EZ lysis buffer (1 mL added to each dish). The lysates were subjected to subcellular fractionation by centrifuging at 500× g for 5 min at 4 °C. The supernatants were collected as the non-nuclear cytoplasmic fractions, while the sediment were subsequently washed with the above lysis buffer for two times, each time when 0.5 mL of the nuclei EZ lysis buffer was added into the sediment. The final nuclear pellets were collected by centrifuging at 500× g for 5 min at 4 °C. These fractions were then evaluated by Western blotting.

4.7. Lipid Staining

Experimental cells were seeded in 6-well plates and cultured in a medium containing 200 μM sodium oleate (Solarbio, Beijing, China). The cells were fixed for 30 min with 4% paraformaldehyde (AR1068, Boster Biological Technology, Wuhan, China) and then stained for 30 min with a solution of 3 g/L oil red O (A600395, Sangon Biotech, Shanghai, China). The stained cells were rinsed 3 times with 60% of isopropyl alcohol (Kelong, Chengdu, China) before the red lipid droplets were visualized by microscopy.

4.8. Intracellular ROS staining

Experimental cells were allowed for growth to an appropriate confluence in 6-well plates and then incubated in a serum-free medium containing 10 μmol/L of 2′,7′-Dichlorodihydrofluorescein diacetate (DCFH-DA) (S0033, Beyotime, Shanghai, China) at 37 °C for 20 min. Thereafter, these cells were washed three times with a fresh serum-free medium, before the green fluorescent images were achieved by microscopy.

4.9. Luciferase Reporter Assay

Equal numbers (1.0 × 10⁵) of experimental cells were seeded into each well of the 12-well plates. After reaching 80% confluence, the cells were transfected by using a Lipofectamine 3000 mixture with luciferase plasmids alone or plus other expression plasmids. In the pGL3 plasmid system, the Renilla expression by pRL-TK plasmid serves as an internal control for transfection efficiency. And in the psi-CHECK2 plasmid system, the Pyralis-luciferase activity is also an internal control, while the Renilla-luciferase activity is the experimental test object. The luciferase activity was measured by the dual-luciferase reporter assay system (E1910, Promega, Madison, WI, USA). The resultant data were normalized and calculated as a fold change (mean ± S.D) relative to the activity of the control group (at a given value of 1.0). All the data presented in this study represent at least three independent experiments undertaken on separate occasions that were each performed in triplicate. Significant differences in the transcriptional activity were subjected to statistical analysis.

4.10. Real-Time Quantitative PCR

Experimental cells were subjected to isolation of total RNAs by using the RNAsimple Kit (Tiangen Biotech Co., Beijing, China). Then, 500 ng of total RNAs were added in a reverse-transcriptase reaction to generate the first strand of cDNA (with the Revert Aid First Strand Synthesis Kit from Thermo, Waltham, MA, USA). The synthesized cDNA was served as the template for qPCR, in the GoTaq® qPCR Master Mix (from Promega,), before being deactivated at 95 °C for 10 min, and then amplified by 40 reaction cycles of the annealing at 95 °C for 15 s and then extending at 60 °C for 30 s. The final melting curve was validated to examine the amplification quality, whereas the mRNA expression level of β-actin served as an optimal internal standard control.

4.11. Western Blotting

Experimental cells were harvested in a lysis buffer (0.5% SDS, 0.04 mol/L DTT, pH 7.5), which was supplemented with the protease inhibitor cOmplete Tablets EASYpack or phosphatase inhibitor PhosSTOP EASYpack (either one tablet per 10 mL of lysis buffer, Roche, Mannheim, Germany). The lysates were denatured immediately at 100 °C for 10 min, sonicated sufficiently, and diluted in 3× loading buffer (187.5 mmol/L Tris-HCl, pH 6.8, 6% SDS, 30% Glycerol, 150 mmol/L DTT, 0.3% Bromphenol Blue) at 100 °C for 5 min. Subsequently, equal amounts of protein extracts were subjected to separation by SDS-PAGE containing 4–15% polyacrylamide, and subsequent visualization by Western blotting with distinct antibodies as indicated. On some occasions, the blotted membranes were stripped for 30 min and then re-probed with additional primary antibodies. β-actin served as an internal control to verify equal loading of proteins in each of electrophoretic wells.

4.12. Flow Cytometry Analysis of Cell Cycle and Apoptosis

Experimental cells (5 × 10⁵) were allowed for growth in 60-mm cell culture plate for 48 h and synchronization by 12-h starvation in a serum-free medium, before being treated with 10 μmol/L BrdU for 12 h. The cells were fixed for 15 min with 100 μL of BD Cytofix/Cytoperm buffer (containing a mixture of the fixative paraformaldehyde and the detergent saponin) at room temperature and permeabilized for 10 min with 100 μL of BD Cytoperm permeabilization buffer plus (containing fetal bovine serum as a staining enhancer) on ice. Thereafter, the cells were re-fixed and treated with 100 μL of DNase (at a dose of 300 μg/mL in PBS) for 1 h at 37 °C, in order to expose the incorporated BrdU, followed by staining with FITC (fluorescein isothiocyanate) conjugated anti-BrdU antibody for 60 min at room temperature. Subsequently, the cells were suspended in 20 μL of 7-amino-actinomycin D solution for 20 min of the DNA staining and re-suspended in 0.5 mL of a staining buffer (i.e., 1 × DPBS containing 0.09% sodium azide and 3% heat-inactivated FBS), prior to the cell cycle analysis by flow cytometry. Furthermore, additional fractions of cells (5 × 10⁵) were allowed for 48-h growth in 60-mm cell culture plate before being used for apoptosis analysis. The cells were pelleted by centrifuging at 1000× g for 5 min and washed by PBS for three times, before being incubated for 15 min with 5 μL of Annexin V-FITC and 10 μL of propidium iodide (PI) in 195 μL of the binding buffer, prior to flow cytometry analysis of cell apoptosis. The results were further analyzed by the FlowJo 7.6.1 software (FlowJo, Ashland, OR, USA) before being presented.

4.13. Key Resources Used for ’Wet Experiments’

Key resources used for ’Wet Experiments’ are shown in Table 1.

4.14. The Genome-Wide Transcriptomic Analysis

Total RNAs were subjected to the transcriptomic sequencing by the Beijing Genomics Institute (BGI, www.genomics.org.cn) on the platform of BGISEQ-500 (contract No. is F17FTSCCWLJ1161). After removing the ‘dirty’ raw reads with data filtering, the clean reads were generated and mapped to the reference by using both HISAT [100] and Bowtie2 [101] tools. Of note, gene expression levels were calculated by using the FPKM (Fragments Per Kilobase of exon model per Million mapped fragments) method combined with RSEM [102]. Then, differentially expressed genes (DEGs) were identified with the criteria Fold-change ≥2 and another diverge probability ≥0.8 by using the NOISeq tool [103]. For the functional annotation, all DEGs were mapped to the gene ontology (GO) terms in the database (http://www.geneontology.org/) and the pathway enrichment analysis of DEGs was also performed by using KEGG software (Kanehisa Laboratories, Kyoto, Japan) [104].

4.15. Statistical Analysis

Significant differences were statistically determined using the Student’s t-test and Multiple Analysis of Variations (MANOVA), except for somewhere indicated. The data are here shown as a fold change (mean ± S.D.), each of which represents at least three independent experiments that were each performed in triplicate.

5. Conclusions

Altogether, our present study demonstrates that the malfunction of Nrf2 is defined as a tumor promoter, but it is predominantly suppressed by Nrf1α, that acts as a dominant tumor repressor, specifically through transcriptional regulation of the 26S proteasome-mediated Nrf2 degradation pathways. This complicated process is governed by endogenous inter-regulatory networks between Nrf1α and Nrf2 from multiple signaling pathways towards distinct gene expression. On the inside, there exist mutual opposing and unifying cross-talks between Nrf1α and Nrf2 at distinct levels (i.e., transcript and protein). Notably, Nrf2 can also directly mediate the transcription of the Nrf1 gene to form a coupled positive and negative feedback circuit, in order to quantitatively monitor both Nrf1 and Nrf2 functioning towards precision expression of distinct downstream genes. This is evidenced by such observations that the malignant growth of Nrf1α−/ -derived tumor is almost prevented by silencing of Nrf2, and Nrf1α+/+-tumor growth is also repressed by the inactive Nrf2−/−ΔTA, but almost unaltered by constitutive activation of caNrf2ΔN in the presence of Nrf1α. Further evidence has been provided revealing that the hyperactivation of Nrf2 by Nrf1α−/ results from substantial decreases in the expression of Keap1, PTEN and most of 26S proteasomal subunits. Therefore, in view of mutual inter-regulation by between Nrf1α and Nrf2, it should hence be taken severe cautions to interpret the experimental results from loss of Nrf1α, Nrf2 or both, as well as the other data obtained from gains of their functions. Meanwhile, this also poses a great challenge to re-interpret or re-evaluate those relevant data that had been previously published in the past two decades.

Supplementary Materials

The following are available online at https://www.mdpi.com/2072-6694/10/12/520/s1, Figure S1: The human Nrf1- and Nrf2-specific gene-editing constructs, Figure S2: Distinct cellular responses of the PCOX2-luc reporter gene to TPA, Figure S3: The JNK inhibitor blocks the Nrf1α−/ -leading increase of COX2, Figure S4: Activation of some AP-1 components in Nrf1α−/ cells, Figure S5: Cross-talks between Nrf1 and Nrf2 to regulate COX2, Figure S6: Distinctions in subcellular distributions of Nrf1 and Nrf2 in different cell lines, Figure S7: Genetic analysis of COX1 regulation, Figure S8: Differences in transcriptional expression of proteasomal subunits regulated by Nrf1 and Nrf2, Figure S9: Validation of cross-talks between Nrf1 and Nrf2 signaling consistently in distinct cell lines, Figure S10: Subtle nuances in distinct cell cycles and apoptosis processes, Figure S11: Opposite changes in DEGs measured from transcriptome in distinct cell lines, Figure S12: Opposite alterations in DEGs measured from transcriptome in Nrf2−/−ΔTA and caNrf2ΔN cells, Table S1: KEGG pathway enrichment analysis of DEGs in Nrf1α−/− vs. WT cells, Table S2: KEGG pathway enrichment analysis of DEGs in Nrf1α−/+siNrf2 vs. WT cells, Table S3: KEGG pathway enrichment analysis of DEGs in Nrf2−/−ΔTA vs. WT cells.

Author Contributions

L.Q. designed and performed most of the experiments except indicated elsewhere, made all figures and wrote the manuscript draft. M.W. performed the statistical analysis of transcriptome data. Y.R. participated in the preparation of gene knockout cell lines. X.R. Z.Z. and S.H. participated in animal experiments. S.Y. provided critical suggestion and also invaluable materials for this work. Y.Z. designed and supervised this study, generated the project resources, analyzing all the data, organized all figures, wrote and revised this manuscript. Z.Z edited the English langue of this manuscript. All these authors reviewed and commented on the manuscript. Meanwhile, these authors declare no competing financial and other interests.

Funding

The work was supported by the National Natural Science Foundation of China (NSFC, 81872336, 91129703, 91429305, and 31270879) awarded to Yiguo Zhang (University of Chongqing, China), and funded partially by Chongqing University postgraduates′ innovation project (No. CYB15024) funded to Lu Qiu.

Acknowledgments

We are deeply indebted to both Masayuki Yamamoto (at Tohoku University, Japan) and Jingbo Pi (at China Medical University) for giving critical comments on this study. We are also greatly grateful to Akira Kobayashi (at Doshisha University, Japan) for providing both Nrf1−/−(ΔDBD) and Nrf1+/+ MEF lines as a gift.

Conflicts of Interest

The funders had no role in the design of the study; in the collection, analyses, or interpretation of data; in the writing of the manuscript, and in the decision to publish the results. There are no other conflicts of interest, except that the preprinted version of this paper had been posted at the bioRxiv 403220 (doi: https://doi.org/ 10.1101/403220) on the 29th of Agust in 2018.

References

  1. Corte, C.D.; Ferrari, F.; Villani, A.; Nobili, V. Epidemiology and natural history of NAFLD. J. Med. Biochem. 2015, 34, 13–17. [Google Scholar] [CrossRef] [PubMed]
  2. Younossi, Z.; Anstee, Q.M.; Marietti, M.; Hardy, T.; Henry, L.; Eslam, M.; George, J.; Bugianesi, E. Global burden of NAFLD and NASH: Trends, predictions, risk factors and prevention. Nat. Rev. Gastroenterol. Hepatol. 2018, 15, 11–20. [Google Scholar] [CrossRef] [PubMed]
  3. Michelotti, G.A.; Machado, M.V.; Diehl, A.M. NAFLD, NASH and liver cancer. Nat. Rev. Gastroenterol. Hepatol. 2013, 10, 656–665. [Google Scholar] [CrossRef] [PubMed]
  4. Rowell, R.J.; Anstee, Q.M. An overview of the genetics, mechanisms and management of NAFLD and ALD. Clin. Med. 2015, 15 (Suppl. 6), s77–s82. [Google Scholar] [CrossRef]
  5. Wong, V.W.; Adams, L.A.; de Ledinghen, V.; Wong, G.L.; Sookoian, S. Noninvasive biomarkers in NAFLD and NASH - current progress and future promise. Nat. Rev. Gastroenterol. Hepatol. 2018, 15, 461–478. [Google Scholar] [CrossRef] [PubMed]
  6. Friedman, S.L.; Neuschwander-Tetri, B.A.; Rinella, M.; Sanyal, A.J. Mechanisms of NAFLD development and therapeutic strategies. Nat. Med. 2018, 24, 908–922. [Google Scholar] [CrossRef] [PubMed]
  7. Jump, D.B.; Tripathy, S.; Depner, C.M. Fatty acid-regulated transcription factors in the liver. Annu. Rev. Nutr. 2013, 33, 249–269. [Google Scholar] [CrossRef]
  8. Karagianni, P.; Talianidis, I. Transcription factor networks regulating hepatic fatty acid metabolism. Biochim. Biophys. Acta 2015, 1851, 2–8. [Google Scholar] [CrossRef]
  9. Nakayama, H.; Otabe, S.; Ueno, T.; Hirota, N.; Yuan, X.; Fukutani, T.; Hashinaga, T.; Wada, N.; Yamada, K. Transgenic mice expressing nuclear sterol regulatory element-binding protein 1c in adipose tissue exhibit liver histology similar to nonalcoholic steatohepatitis. Metabolism 2007, 56, 470–475. [Google Scholar] [CrossRef]
  10. Zhang, T.; Kho, D.H.; Wang, Y.; Harazono, Y.; Nakajima, K.; Xie, Y.; Raz, A. Gp78, an e3 ubiquitin ligase acts as a gatekeeper suppressing nonalcoholic steatohepatitis (NASH) and liver cancer. PLoS ONE 2015, 10, e0118448. [Google Scholar] [CrossRef]
  11. Yahagi, N.; Shimano, H.; Hasty, A.H.; Matsuzaka, T.; Ide, T.; Yoshikawa, T.; Amemiya-Kudo, M.; Tomita, S.; Okazaki, H.; Tamura, Y.; et al. Absence of sterol regulatory element-binding protein-1 (SREBP-1) ameliorates fatty livers but not obesity or insulin resistance in lep(ob)/lep(ob) mice. J. Biol. Chem. 2002, 277, 19353–19357. [Google Scholar] [CrossRef] [PubMed]
  12. Moon, Y.A.; Liang, G.; Xie, X.; Frank-Kamenetsky, M.; Fitzgerald, K.; Koteliansky, V.; Brown, M.S.; Goldstein, J.L.; Horton, J.D. The SCAP/SREBP pathway is essential for developing diabetic fatty liver and carbohydrate-induced hypertriglyceridemia in animals. Cell Metab. 2012, 15, 240–246. [Google Scholar] [CrossRef] [PubMed]
  13. Horie, Y.; Suzuki, A.; Kataoka, E.; Sasaki, T.; Hamada, K.; Sasaki, J.; Mizuno, K.; Hasegawa, G.; Kishimoto, H.; Iizuka, M.; et al. Hepatocyte-specific PTEN deficiency results in steatohepatitis and hepatocellular carcinomas. J. Clin. Investig. 2004, 113, 1774–1783. [Google Scholar] [CrossRef] [PubMed]
  14. Hollander, M.C.; Blumenthal, G.M.; Dennis, P.A. PTEN loss in the continuum of common cancers, rare syndromes and mouse models. Nat. Rev. Cancer 2011, 11, 289–301. [Google Scholar] [CrossRef] [PubMed]
  15. Shimano, H.; Sato, R. SREBP-regulated lipid metabolism: Convergent physiology—Divergent pathophysiology. Nat. Rev. Endocrinol. 2017, 13, 710–730. [Google Scholar] [CrossRef] [PubMed]
  16. Lee, Y.R.; Chen, M.; Pandolfi, P.P. The functions and regulation of the PTEN tumour suppressor: New modes and prospects. Nat. Rev. Mol. Cell Biol. 2018, 19, 547–562. [Google Scholar] [CrossRef] [PubMed]
  17. Sakamoto, K.; Iwasaki, K.; Sugiyama, H.; Tsuji, Y. Role of the tumor suppressor PTEN in antioxidant responsive element-mediated transcription and associated histone modifications. Mol. Biol. Cell 2009, 20, 1606–1617. [Google Scholar] [CrossRef]
  18. Mitsuishi, Y.; Taguchi, K.; Kawatani, Y.; Shibata, T.; Nukiwa, T.; Aburatani, H.; Yamamoto, M.; Motohashi, H. Nrf2 redirects glucose and glutamine into anabolic pathways in metabolic reprogramming. Cancer Cell 2012, 22, 66–79. [Google Scholar] [CrossRef]
  19. Rojo, A.I.; Rada, P.; Mendiola, M.; Ortega-Molina, A.; Wojdyla, K.; Rogowska-Wrzesinska, A.; Hardisson, D.; Serrano, M.; Cuadrado, A. The PTEN/Nrf2 axis promotes human carcinogenesis. Antioxid. Redox Signal. 2014, 21, 2498–2514. [Google Scholar] [CrossRef]
  20. Taguchi, K.; Hirano, I.; Itoh, T.; Tanaka, M.; Miyajima, A.; Suzuki, A.; Motohashi, H.; Yamamoto, M. Nrf2 enhances cholangiocyte expansion in PTEN-deficient livers. Mol. Cell. Biol. 2014, 34, 900–913. [Google Scholar] [CrossRef]
  21. Best, S.A.; De Souza, D.P.; Kersbergen, A.; Policheni, A.N.; Dayalan, S.; Tull, D.; Rathi, V.; Gray, D.H.; Ritchie, M.E.; McConville, M.J.; et al. Synergy between the Keap1/Nrf2 and PI3K pathways drives non-small-cell lung cancer with an altered immune microenvironment. Cell Metab. 2018, 27, 935–943. [Google Scholar] [CrossRef]
  22. DeNicola, G.M.; Karreth, F.A.; Humpton, T.J.; Gopinathan, A.; Wei, C.; Frese, K.; Mangal, D.; Yu, K.H.; Yeo, C.J.; Calhoun, E.S.; et al. Oncogene-induced Nrf2 transcription promotes ROS detoxification and tumorigenesis. Nature 2011, 475, 106–109. [Google Scholar] [CrossRef] [Green Version]
  23. Wang, H.; Liu, X.; Long, M.; Huang, Y.; Zhang, L.; Zhang, R.; Zheng, Y.; Liao, X.; Wang, Y.; Liao, Q.; et al. Nrf2 activation by antioxidant antidiabetic agents accelerates tumor metastasis. Sci. Transl. Med. 2016, 8, 334ra351. [Google Scholar] [CrossRef] [PubMed]
  24. Schafer, M.; Dutsch, S.; Auf dem Keller, U.; Navid, F.; Schwarz, A.; Johnson, D.A.; Johnson, J.A.; Werner, S. Nrf2 establishes a glutathione-mediated gradient of UVB cytoprotection in the epidermis. Genes Dev. 2010, 24, 1045–1058. [Google Scholar] [CrossRef] [Green Version]
  25. Shanmugam, G.; Narasimhan, M.; Tamowski, S.; Darley-Usmar, V.; Rajasekaran, N.S. Constitutive activation of nrf2 induces a stable reductive state in the mouse myocardium. Redox Biol. 2017, 12, 937–945. [Google Scholar] [CrossRef]
  26. Auf dem Keller, U.; Huber, M.; Beyer, T.A.; Kumin, A.; Siemes, C.; Braun, S.; Bugnon, P.; Mitropoulos, V.; Johnson, D.A.; Johnson, J.A.; et al. Nrf transcription factors in keratinocytes are essential for skin tumor prevention but not for wound healing. Mol. Cell. Biol. 2006, 26, 3773–3784. [Google Scholar] [CrossRef] [PubMed]
  27. Xu, Z.; Chen, L.; Leung, L.; Yen, T.S.; Lee, C.; Chan, J.Y. Liver-specific inactivation of the Nrf1 gene in adult mouse leads to nonalcoholic steatohepatitis and hepatic neoplasia. Proc. Natl. Acad. Sci. USA 2005, 102, 4120–4125. [Google Scholar] [CrossRef] [PubMed] [Green Version]
  28. Ohtsuji, M.; Katsuoka, F.; Kobayashi, A.; Aburatani, H.; Hayes, J.D.; Yamamoto, M. Nrf1 and Nrf2 play distinct roles in activation of antioxidant response element-dependent genes. J. Biol. Chem. 2008, 283, 33554–33562. [Google Scholar] [CrossRef] [PubMed]
  29. Chan, J.Y.; Kwong, M.; Lu, R.H.; Chang, J.; Wang, B.; Yen, T.S.B.; Kan, Y.W. Targeted disruption of the ubiquitous cnc-bzip transcription factor, nrf-1, results in anemia and embryonic lethality in mice. Embo J. 1998, 17, 1779–1787. [Google Scholar] [CrossRef]
  30. Chen, L.Y.; Kwong, M.; Lu, R.H.; Ginzinger, D.; Lee, C.; Leung, L.; Chan, J.Y. Nrf1 is critical for redox balance and survival of liver cells during development. Mol. Cell. Biol. 2003, 23, 4673–4686. [Google Scholar] [CrossRef]
  31. Itoh, K.; Chiba, T.; Takahashi, S.; Ishii, T.; Igarashi, K.; Katoh, Y.; Oyake, T.; Hayashi, N.; Satoh, K.; Hatayama, I.; et al. An Nrf2 small maf heterodimer mediates the induction of Phase II detoxifying enzyme genes through antioxidant response elements. Biochem. Biophys. Res. Commun. 1997, 236, 313–322. [Google Scholar] [CrossRef]
  32. Zhang, Y.; Xiang, Y. Molecular and cellular basis for the unique functioning of Nrf1, an indispensable transcription factor for maintaining cell homoeostasis and organ integrity. Biochem. J. 2016, 473, 961–1000. [Google Scholar] [CrossRef] [PubMed]
  33. Bugno, M.; Daniel, M.; Chepelev, N.L.; Willmore, W.G. Changing gears in Nrf1 research, from mechanisms of regulation to its role in disease and prevention. Biochim. Biophys. Acta 2015, 1849, 1260–1276. [Google Scholar] [CrossRef] [PubMed]
  34. Lee, C.S.; Lee, C.; Hu, T.; Nguyen, J.M.; Zhang, J.; Martin, M.V.; Vawter, M.P.; Huang, E.J.; Chan, J.Y. Loss of nuclear factor e2-related factor 1 in the brain leads to dysregulation of proteasome gene expression and neurodegeneration. Proc. Natl. Acad. Sci. USA 2011, 108, 8408–8413. [Google Scholar] [CrossRef] [PubMed]
  35. Kobayashi, A.; Tsukide, T.; Miyasaka, T.; Morita, T.; Mizoroki, T.; Saito, Y.; Ihara, Y.; Takashima, A.; Noguchi, N.; Fukamizu, A.; et al. Central nervous system-specific deletion of transcription factor Nrf1 causes progressive motor neuronal dysfunction. Genes Cells 2011, 16, 692–703. [Google Scholar] [CrossRef] [PubMed] [Green Version]
  36. Hirotsu, Y.; Higashi, C.; Fukutomi, T.; Katsuoka, F.; Tsujita, T.; Yagishita, Y.; Matsuyama, Y.; Motohashi, H.; Uruno, A.; Yamamoto, M. Transcription factor NF-E2-related factor 1 impairs glucose metabolism in mice. Genes Cells 2014, 19, 650–665. [Google Scholar] [CrossRef] [PubMed] [Green Version]
  37. Zheng, H.; Fu, J.; Xue, P.; Zhao, R.; Dong, J.; Liu, D.; Yamamoto, M.; Tong, Q.; Teng, W.; Qu, W.; et al. CNC-BZIP protein Nrf1-dependent regulation of glucose-stimulated insulin secretion. Antioxid. Redox Signal. 2015, 22, 819–831. [Google Scholar] [CrossRef] [PubMed]
  38. Zhang, Y.G.; Ren, Y.G.; Li, S.J.; Hayes, J.D. Transcription factor Nrf1 is topologically repartitioned across membranes to enable target gene transactivation through its acidic glucose-responsive domains. PLoS ONE 2014, 9. [Google Scholar] [CrossRef]
  39. Widenmaier, S.B.; Snyder, N.A.; Nguyen, T.B.; Arduini, A.; Lee, G.Y.; Arruda, A.P.; Saksi, J.; Bartelt, A.; Hotamisligil, G.S. Nrf1 is an er membrane sensor that is central to cholesterol homeostasis. Cell 2017, 171, 1094–1109. [Google Scholar] [CrossRef]
  40. Bartelt, A.; Widenmaier, S.B.; Schlein, C.; Johann, K.; Goncalves, R.L.S.; Eguchi, K.; Fischer, A.W.; Parlakgul, G.; Snyder, N.A.; Nguyen, T.B.; et al. Brown adipose tissue thermogenic adaptation requires Nrf1-mediated proteasomal activity. Nat. Med. 2018, 24, 292–303. [Google Scholar] [CrossRef]
  41. Hou, Y.; Liu, Z.; Zuo, Z.; Gao, T.; Fu, J.; Wang, H.; Xu, Y.; Liu, D.; Yamamoto, M.; Zhu, B.; et al. Adipocyte-specific deficiency of Nfe2l1 disrupts plasticity of white adipose tissues and metabolic homeostasis in mice. Biochem. Biophys. Res. Commun. 2018. [Google Scholar] [CrossRef] [PubMed]
  42. Zhang, Y.; Lucocq, J.M.; Yamamoto, M.; Hayes, J.D. The NHB1 (N-terminal homology box 1) sequence in transcription factor Nrf1 is required to anchor it to the endoplasmic reticulum and also to enable its asparagine-glycosylation. Biochem. J. 2007, 408, 161–172. [Google Scholar] [CrossRef] [PubMed]
  43. Zhang, Y.; Li, S.; Xiang, Y.; Qiu, L.; Zhao, H.; Hayes, J.D. The selective post-translational processing of transcription factor Nrf1 yields distinct isoforms that dictate its ability to differentially regulate gene expression. Sci. Rep. 2015, 5, 12983. [Google Scholar] [CrossRef] [PubMed] [Green Version]
  44. Radhakrishnan, S.K.; den Besten, W.; Deshaies, R.J. p97-dependent retrotranslocation and proteolytic processing govern formation of active Nrf1 upon proteasome inhibition. Elife 2014, 3, e01856. [Google Scholar] [CrossRef] [PubMed]
  45. Sha, Z.; Goldberg, A.L. Proteasome-mediated processing of Nrf1 is essential for coordinate induction of all proteasome subunits and p97. Curr. Biol. 2014, 24, 1573–1583. [Google Scholar] [CrossRef] [PubMed]
  46. Xiang, Y.; Halin, J.; Fan, Z.; Hu, S.; Wang, M.; Qiu, L.; Zhang, Z.; Mattjus, P.; Zhang, Y. Topovectorial mechanisms control the juxtamembrane proteolytic processing of Nrf1 to remove its N-terminal polypeptides during maturation of the cnc-bzip factor. Toxicol. Appl. Pharmacol. 2018, 360, 160–184. [Google Scholar] [CrossRef] [PubMed]
  47. Xiang, Y.; Wang, M.; Hu, S.; Qiu, L.; Yang, F.; Zhang, Z.; Yu, S.; Pi, J.; Zhang, Y. Mechanisms controlling the multistage post-translational processing of endogenous Nrf1α/TCF11 proteins to yield distinct isoforms within the coupled positive and negative feedback circuits. Toxicol. Appl. Pharmacol. 2018, 360, 212–235. [Google Scholar] [CrossRef]
  48. Koizumi, S.; Irie, T.; Hirayama, S.; Sakurai, Y.; Yashiroda, H.; Naguro, I.; Ichijo, H.; Hamazaki, J.; Murata, S. The aspartyl protease DDI2 activates Nrf1 to compensate for proteasome dysfunction. Elife 2016, 5. [Google Scholar] [CrossRef]
  49. Zhang, Y.; Qiu, L.; Li, S.; Xiang, Y.; Chen, J.; Ren, Y. The C-terminal domain of Nrf1 negatively regulates the full-length CNC-BZIP factor and its shorter isoform LCR-F1/Nrf1β; both are also inhibited by the small dominant-negative Nrf1γ/δ isoforms that down-regulate are-battery gene expression. PLoS ONE 2014, 9, e0109159. [Google Scholar] [CrossRef]
  50. Ren, Y.G.; Qiu, L.; Lu, F.L.; Ru, X.F.; Li, S.J.; Xiang, Y.C.; Yu, S.W.; Zhang, Y.G. Talens-directed knockout of the full-length transcription factor Nrf1α that represses malignant behaviour of human hepatocellular carcinoma (HepG2) cells. Sci. Rep. 2016, 6. [Google Scholar] [CrossRef]
  51. Tsujita, T.; Peirce, V.; Baird, L.; Matsuyama, Y.; Takaku, M.; Walsh, S.V.; Griffin, J.L.; Uruno, A.; Yamamoto, M.; Hayes, J.D. Transcription factor Nrf1 negatively regulates the cystine/glutamate transporter and lipid-metabolizing enzymes. Mol. Cell. Biol. 2014, 34, 3800–3816. [Google Scholar] [CrossRef] [PubMed]
  52. Hirotsu, Y.; Hataya, N.; Katsuoka, F.; Yamamoto, M. NF-E2-related factor 1 (Nrf1) serves as a novel regulator of hepatic lipid metabolism through regulation of the lipin1 and PGC-1β genes. Mol. Cell. Biol. 2012, 32, 2760–2770. [Google Scholar] [CrossRef] [PubMed]
  53. Gupta, R.A.; Dubois, R.N. Colorectal cancer prevention and treatment by inhibition of cyclooxygenase-2. Nat. Rev. Cancer 2001, 1, 11–21. [Google Scholar] [CrossRef] [PubMed]
  54. Castellone, M.D.; Teramoto, H.; Williams, B.O.; Druey, K.M.; Gutkind, J.S. Prostaglandin E2 promotes colon cancer cell growth through a GS-axin-β-catenin signaling axis. Science 2005, 310, 1504–1510. [Google Scholar] [CrossRef] [PubMed]
  55. Chowdhry, S.; Nazmy, M.H.; Meakin, P.J.; Dinkova-Kostova, A.T.; Walsh, S.V.; Tsujita, T.; Dillon, J.F.; Ashford, M.L.; Hayes, J.D. Loss of Nrf2 markedly exacerbates nonalcoholic steatohepatitis. Free Radic. Biol. Med. 2010, 48, 357–371. [Google Scholar] [CrossRef] [PubMed]
  56. Wang, D.; Dubois, R.N. The role of COX-2 in intestinal inflammation and colorectal cancer. Oncogene 2010, 29, 781–788. [Google Scholar] [CrossRef]
  57. Sherratt, P.J.; McLellan, L.I.; Hayes, J.D. Positive and negative regulation of prostaglandin E2 biosynthesis in human colorectal carcinoma cells by cancer chemopreventive agents. Biochem. Pharmacol. 2003, 66, 51–61. [Google Scholar] [CrossRef]
  58. Itoh, K.; Mochizuki, M.; Ishii, Y.; Ishii, T.; Shibata, T.; Kawamoto, Y.; Kelly, V.; Sekizawa, K.; Uchida, K.; Yamamoto, M. Transcription factor Nrf2 regulates inflammation by mediating the effect of 15-deoxy-δ(12,14)-prostaglandin J(2). Mol. Cell. Biol. 2004, 24, 36–45. [Google Scholar] [CrossRef]
  59. O’Banion, M.K. Cyclooxygenase-2: Molecular biology, pharmacology, and neurobiology. Crit. Rev. Neurobiol. 1999, 13, 45–82. [Google Scholar] [CrossRef]
  60. Tanabe, T.; Tohnai, N. Cyclooxygenase isozymes and their gene structures and expression. Prostaglandins Other Lipid Mediat. 2002, 68–69, 95–114. [Google Scholar] [CrossRef]
  61. Xu, K.; Shu, H.K. Transcription factor interactions mediate EGF-dependent COX-2 expression. Mol. Cancer Res. 2013, 11, 875–886. [Google Scholar] [CrossRef] [PubMed]
  62. Zhang, X.; Zhang, J.; Yang, X.; Han, X. Several transcription factors regulate COX-2 gene expression in pancreatic β-cells. Mol. Biol. Rep. 2007, 34, 199–206. [Google Scholar] [CrossRef] [PubMed]
  63. Sharma-Walia, N.; George Paul, A.; Patel, K.; Chandran, K.; Ahmad, W.; Chandran, B. NFAT and CREB regulate kaposi’s sarcoma-associated herpesvirus-induced cyclooxygenase 2 (COX-2). J. Virol. 2010, 84, 12733–12753. [Google Scholar] [CrossRef] [PubMed]
  64. Kang, Y.J.; Wingerd, B.A.; Arakawa, T.; Smith, W.L. Cyclooxygenase-2 gene transcription in a macrophage model of inflammation. J. Immunol. 2006, 177, 8111–8122. [Google Scholar] [CrossRef] [PubMed]
  65. Ghosh, R.; Garcia, G.E.; Crosby, K.; Inoue, H.; Thompson, I.M.; Troyer, D.A.; Kumar, A.P. Regulation of COX-2 by cyclic amp response element binding protein in prostate cancer: Potential role for nexrutine. Neoplasia 2007, 9, 893–899. [Google Scholar] [CrossRef] [PubMed]
  66. Grall, F.T.; Prall, W.C.; Wei, W.; Gu, X.; Cho, J.Y.; Choy, B.K.; Zerbini, L.F.; Inan, M.S.; Goldring, S.R.; Gravallese, E.M.; et al. The ets transcription factor ese-1 mediates induction of the COX-2 gene by lps in monocytes. FEBS J. 2005, 272, 1676–1687. [Google Scholar] [CrossRef] [PubMed]
  67. Luedde, T.; Beraza, N.; Kotsikoris, V.; van Loo, G.; Nenci, A.; De Vos, R.; Roskams, T.; Trautwein, C.; Pasparakis, M. Deletion of NEMO/IKKγ in liver parenchymal cells causes steatohepatitis and hepatocellular carcinoma. Cancer Cell 2007, 11, 119–132. [Google Scholar] [CrossRef]
  68. Natarajan, K.; Singh, S.; Burke, T.R., Jr.; Grunberger, D.; Aggarwal, B.B. Caffeic acid phenethyl ester is a potent and specific inhibitor of activation of nuclear transcription factor NF-κB. Proc. Natl. Acad. Sci. USA 1996, 93, 9090–9095. [Google Scholar] [CrossRef]
  69. Shin, H.M.; Kim, M.H.; Kim, B.H.; Jung, S.H.; Kim, Y.S.; Park, H.J.; Hong, J.T.; Min, K.R.; Kim, Y. Inhibitory action of novel aromatic diamine compound on lipopolysaccharide-induced nuclear translocation of NF-κB without affecting ikappab degradation. FEBS Lett. 2004, 571, 50–54. [Google Scholar] [CrossRef]
  70. Tymianski, M.; Spigelman, I.; Zhang, L.; Carlen, P.L.; Tator, C.H.; Charlton, M.P.; Wallace, M.C. Mechanism of action and persistence of neuroprotection by cell-permeant Ca2+ chelators. J. Cereb. Blood Flow Metab. 1994, 14, 911–923. [Google Scholar] [CrossRef]
  71. Bennett, B.L.; Sasaki, D.T.; Murray, B.W.; O’Leary, E.C.; Sakata, S.T.; Xu, W.; Leisten, J.C.; Motiwala, A.; Pierce, S.; Satoh, Y.; et al. Sp600125, an anthrapyrazolone inhibitor of jun N-terminal kinase. Proc. Natl. Acad. Sci. USA 2001, 98, 13681–13686. [Google Scholar] [CrossRef] [PubMed]
  72. Fanjul, A.; Dawson, M.I.; Hobbs, P.D.; Jong, L.; Cameron, J.F.; Harlev, E.; Graupner, G.; Lu, X.P.; Pfahl, M. A new class of retinoids with selective inhibition of AP-1 inhibits proliferation. Nature 1994, 372, 107–111. [Google Scholar] [CrossRef] [PubMed]
  73. Ahn, C.B.; Je, J.Y.; Kim, Y.S.; Park, S.J.; Kim, B.I. Induction of Nrf2-mediated phase ii detoxifying/antioxidant enzymes in vitro by chitosan-caffeic acid against hydrogen peroxide-induced hepatotoxicity through JNK/ERK pathway. Mol. Cell Biochem. 2017, 424, 79–86. [Google Scholar] [CrossRef] [PubMed]
  74. Bak, M.J.; Truong, V.L.; Ko, S.Y.; Nguyen, X.N.; Jun, M.; Hong, S.G.; Lee, J.W.; Jeong, W.S. Induction of nrf2/are-mediated cytoprotective genes by red ginseng oil through ASK1-MKK4/7-JNK and p38 MAPK signaling pathways in HepG2 cells. J. Ginseng Res. 2016, 40, 423–430. [Google Scholar] [CrossRef] [PubMed]
  75. Tao, S.; Wang, S.; Moghaddam, S.J.; Ooi, A.; Chapman, E.; Wong, P.K.; Zhang, D.D. Oncogenic KRAS confers chemoresistance by upregulating Nrf2. Cancer Res. 2014, 74, 7430–7441. [Google Scholar] [CrossRef] [PubMed]
  76. Tan, G.; Shi, Y.; Wu, Z.H. MicroRNA-22 promotes cell survival upon uv radiation by repressing PTEN. Biochem. Biophys. Res. Commun. 2012, 417, 546–551. [Google Scholar] [CrossRef] [PubMed]
  77. Fan, W.; Huang, J.; Xiao, H.; Liang, Z. MicroRNA-22 is downregulated in clear cell renal cell carcinoma, and inhibits cell growth, migration and invasion by targeting pten. Mol. Med. Rep. 2016, 13, 4800–4806. [Google Scholar] [CrossRef] [PubMed]
  78. Smith, C.J.; Morrow, J.D.; Roberts, L.J., 2nd; Marnett, L.J. Induction of prostaglandin endoperoxide synthase-1 (COX-1) in a human promonocytic cell line by treatment with the differentiating agent TPA. Adv. Exp. Med. Biol. 1997, 400A, 99–106. [Google Scholar]
  79. Leung, L.; Kwong, M.; Hou, S.; Lee, C.; Chan, J.Y. Deficiency of the Nrf1 and Nrf2 transcription factors results in early embryonic lethality and severe oxidative stress. J. Biol. Chem. 2003, 278, 48021–48029. [Google Scholar] [CrossRef]
  80. Yamamoto, M.; Kensler, T.W.; Motohashi, H. The keap1-nrf2 system: A thiol-based sensor-effector apparatus for maintaining redox homeostasis. Physiol. Rev. 2018, 98, 1169–1203. [Google Scholar] [CrossRef]
  81. Radhakrishnan, S.K.; Lee, C.S.; Young, P.; Beskow, A.; Chan, J.Y.; Deshaies, R.J. Transcription factor Nrf1 mediates the proteasome recovery pathway after proteasome inhibition in mammalian cells. Mol. Cell 2010, 38, 17–28. [Google Scholar] [CrossRef] [PubMed]
  82. Steffen, J.; Seeger, M.; Koch, A.; Kruger, E. Proteasomal degradation is transcriptionally controlled by TCF11 via an ERAD-dependent feedback loop. Mol. Cell 2010, 40, 147–158. [Google Scholar] [CrossRef] [PubMed]
  83. Kobayashi, A.; Kang, M.I.; Watai, Y.; Tong, K.I.; Shibata, T.; Uchida, K.; Yamamoto, M. Oxidative and electrophilic stresses activate Nrf2 through inhibition of ubiquitination activity of Keap1. Mol. Cell. Biol. 2006, 26, 221–229. [Google Scholar] [CrossRef] [PubMed]
  84. Pitha-Rowe, I.; Liby, K.; Royce, D.; Sporn, M. Synthetic triterpenoids attenuate cytotoxic retinal injury: Cross-talk between Nrf2 and PI3K/AKT signaling through inhibition of the lipid phosphatase PTEN. Investig. Ophthalmol. Vis. Sci. 2009, 50, 5339–5347. [Google Scholar] [CrossRef] [PubMed]
  85. Tebay, L.E.; Robertson, H.; Durant, S.T.; Vitale, S.R.; Penning, T.M.; Dinkova-Kostova, A.T.; Hayes, J.D. Mechanisms of activation of the transcription factor Nrf2 by redox stressors, nutrient cues and energy status, and pathways through which it attenuates degenerative disease. Free Radic. Biol. Med. 2015, 88, 108–146. [Google Scholar] [CrossRef] [PubMed]
  86. Yang, H.W.; Hong, H.L.; Luo, W.W.; Dai, C.M.; Chen, X.Y.; Wang, L.P.; Li, Q.; Li, Z.Q.; Liu, P.Q.; Li, Z.M. mTORC2 facilitates endothelial cell senescence by suppressing Nrf2 expression via the AKT/GSK-3β/C/EBPα signaling pathway. Acta Pharmacol. Sin. 2018, 39, 1837–1846. [Google Scholar] [CrossRef]
  87. Kwong, M.; Kan, Y.W.; Chan, J.Y. The CNC basic leucine zipper factor, Nrf1, is essential for cell survival in response to oxidative stress-inducing agents - role for Nrf1 in γ-GCS(l) and G(SS) expression in mouse fibroblasts. J. Biol. Chem. 1999, 274, 37491–37498. [Google Scholar] [CrossRef]
  88. Xu, X.D.; Song, X.W.; Li, Q.; Wang, G.K.; Jing, Q.; Qin, Y.W. Attenuation of microRNA-22 derepressed pten to effectively protect rat cardiomyocytes from hypertrophy. J. Cell Physiol. 2012, 227, 1391–1398. [Google Scholar] [CrossRef]
  89. Chetram, M.A.; Don-Salu-Hewage, A.S.; Hinton, C.V. Ros enhances CXCR4-mediated functions through inactivation of pten in prostate cancer cells. Biochem. Biophys. Res. Commun. 2011, 410, 195–200. [Google Scholar] [CrossRef]
  90. Kitagishi, Y.; Matsuda, S. Redox regulation of tumor suppressor pten in cancer and aging (review). Int. J. Mol. Med. 2013, 31, 511–515. [Google Scholar] [CrossRef]
  91. Kageyama, S.; Saito, T.; Obata, M.; Koide, R.H.; Ichimura, Y.; Komatsu, M. Negative regulation of the keap1-nrf2 pathway by a p62/SQSTM1 splicing variant. Mol. Cell. Biol. 2018. [Google Scholar] [CrossRef] [PubMed]
  92. Kwak, M.K.; Itoh, K.; Yamamoto, M.; Kensler, T.W. Enhanced expression of the transcription factor Nrf2 by cancer chemopreventive agents: Role of antioxidant response element-like sequences in the Nrf2 promoter. Mol. Cell. Biol. 2002, 22, 2883–2892. [Google Scholar] [CrossRef]
  93. Menegon, S.; Columbano, A.; Giordano, S. The dual roles of Nrf2 in cancer. Trends Mol. Med. 2016, 22, 578–593. [Google Scholar] [CrossRef] [PubMed]
  94. Rojo de la Vega, M.; Chapman, E.; Zhang, D.D. Nrf2 and the hallmarks of cancer. Cancer Cell 2018, 34, 21–43. [Google Scholar] [CrossRef]
  95. Wang, R.; Yu, Z.; Sunchu, B.; Shoaf, J.; Dang, I.; Zhao, S.; Caples, K.; Bradley, L.; Beaver, L.M.; Ho, E.; et al. Rapamycin inhibits the secretory phenotype of senescent cells by a Nrf2-independent mechanism. Aging Cell 2017, 16, 564–574. [Google Scholar] [CrossRef] [Green Version]
  96. Morton, C.L.; Houghton, P.J. Establishment of human tumor xenografts in immunodeficient mice. Nat. Protoc. 2007, 2, 247–250. [Google Scholar] [CrossRef] [PubMed] [Green Version]
  97. Zhang, Y.G.; Hayes, J.D. Identification of topological determinants in the N-terminal domain of transcription factor Nrf1 that control its orientation in the endoplasmic reticulum membrane. Biochem. J. 2010, 430, 497–510. [Google Scholar] [CrossRef] [PubMed] [Green Version]
  98. Shannon, P.; Markiel, A.; Ozier, O.; Baliga, N.S.; Wang, J.T.; Ramage, D.; Amin, N.; Schwikowski, B.; Ideker, T. Cytoscape: A software environment for integrated models of biomolecular interaction networks. Genome Res. 2003, 13, 2498–2504. [Google Scholar] [CrossRef]
  99. Agarwal, V.; Bell, G.W.; Nam, J.W.; Bartel, D.P. Predicting effective microrna target sites in mammalian mRNAs. Elife 2015, 4. [Google Scholar] [CrossRef] [PubMed]
  100. Kim, D.; Landmead, B.; Salzberg, S.L. Hisat: A fast spliced aligner with low memory requirements. Nat. Methods 2015, 12, 357. [Google Scholar] [CrossRef] [PubMed]
  101. Langmead, B.; Trapnell, C.; Pop, M.; Salzberg, S.L. Ultrafast and memory-efficient alignment of short DNA sequences to the human genome. Genome Biol. 2009, 10, R25. [Google Scholar] [CrossRef] [PubMed]
  102. Li, B.; Dewey, C.N. Rsem: Accurate transcript quantification from RNA-seq data with or without a reference genome. Bmc Bioinformatics 2011, 12, 323. [Google Scholar] [CrossRef] [PubMed]
  103. Tarazona, S.; Garcia-Alcalde, F.; Dopazo, J.; Ferrer, A.; Conesa, A. Differential expression in RNA-seq: A matter of depth. Genome Res. 2011, 21, 2213–2223. [Google Scholar] [CrossRef] [PubMed] [Green Version]
  104. Kanehisa, M.; Araki, M.; Goto, S.; Hattori, M.; Hirakawa, M.; Itoh, M.; Katayama, T.; Kawashima, S.; Okuda, S.; Tokimatsu, T.; et al. Kegg for linking genomes to life and the environment. Nucleic Acids Res. 2008, 36, D480–D484. [Google Scholar] [CrossRef] [PubMed]
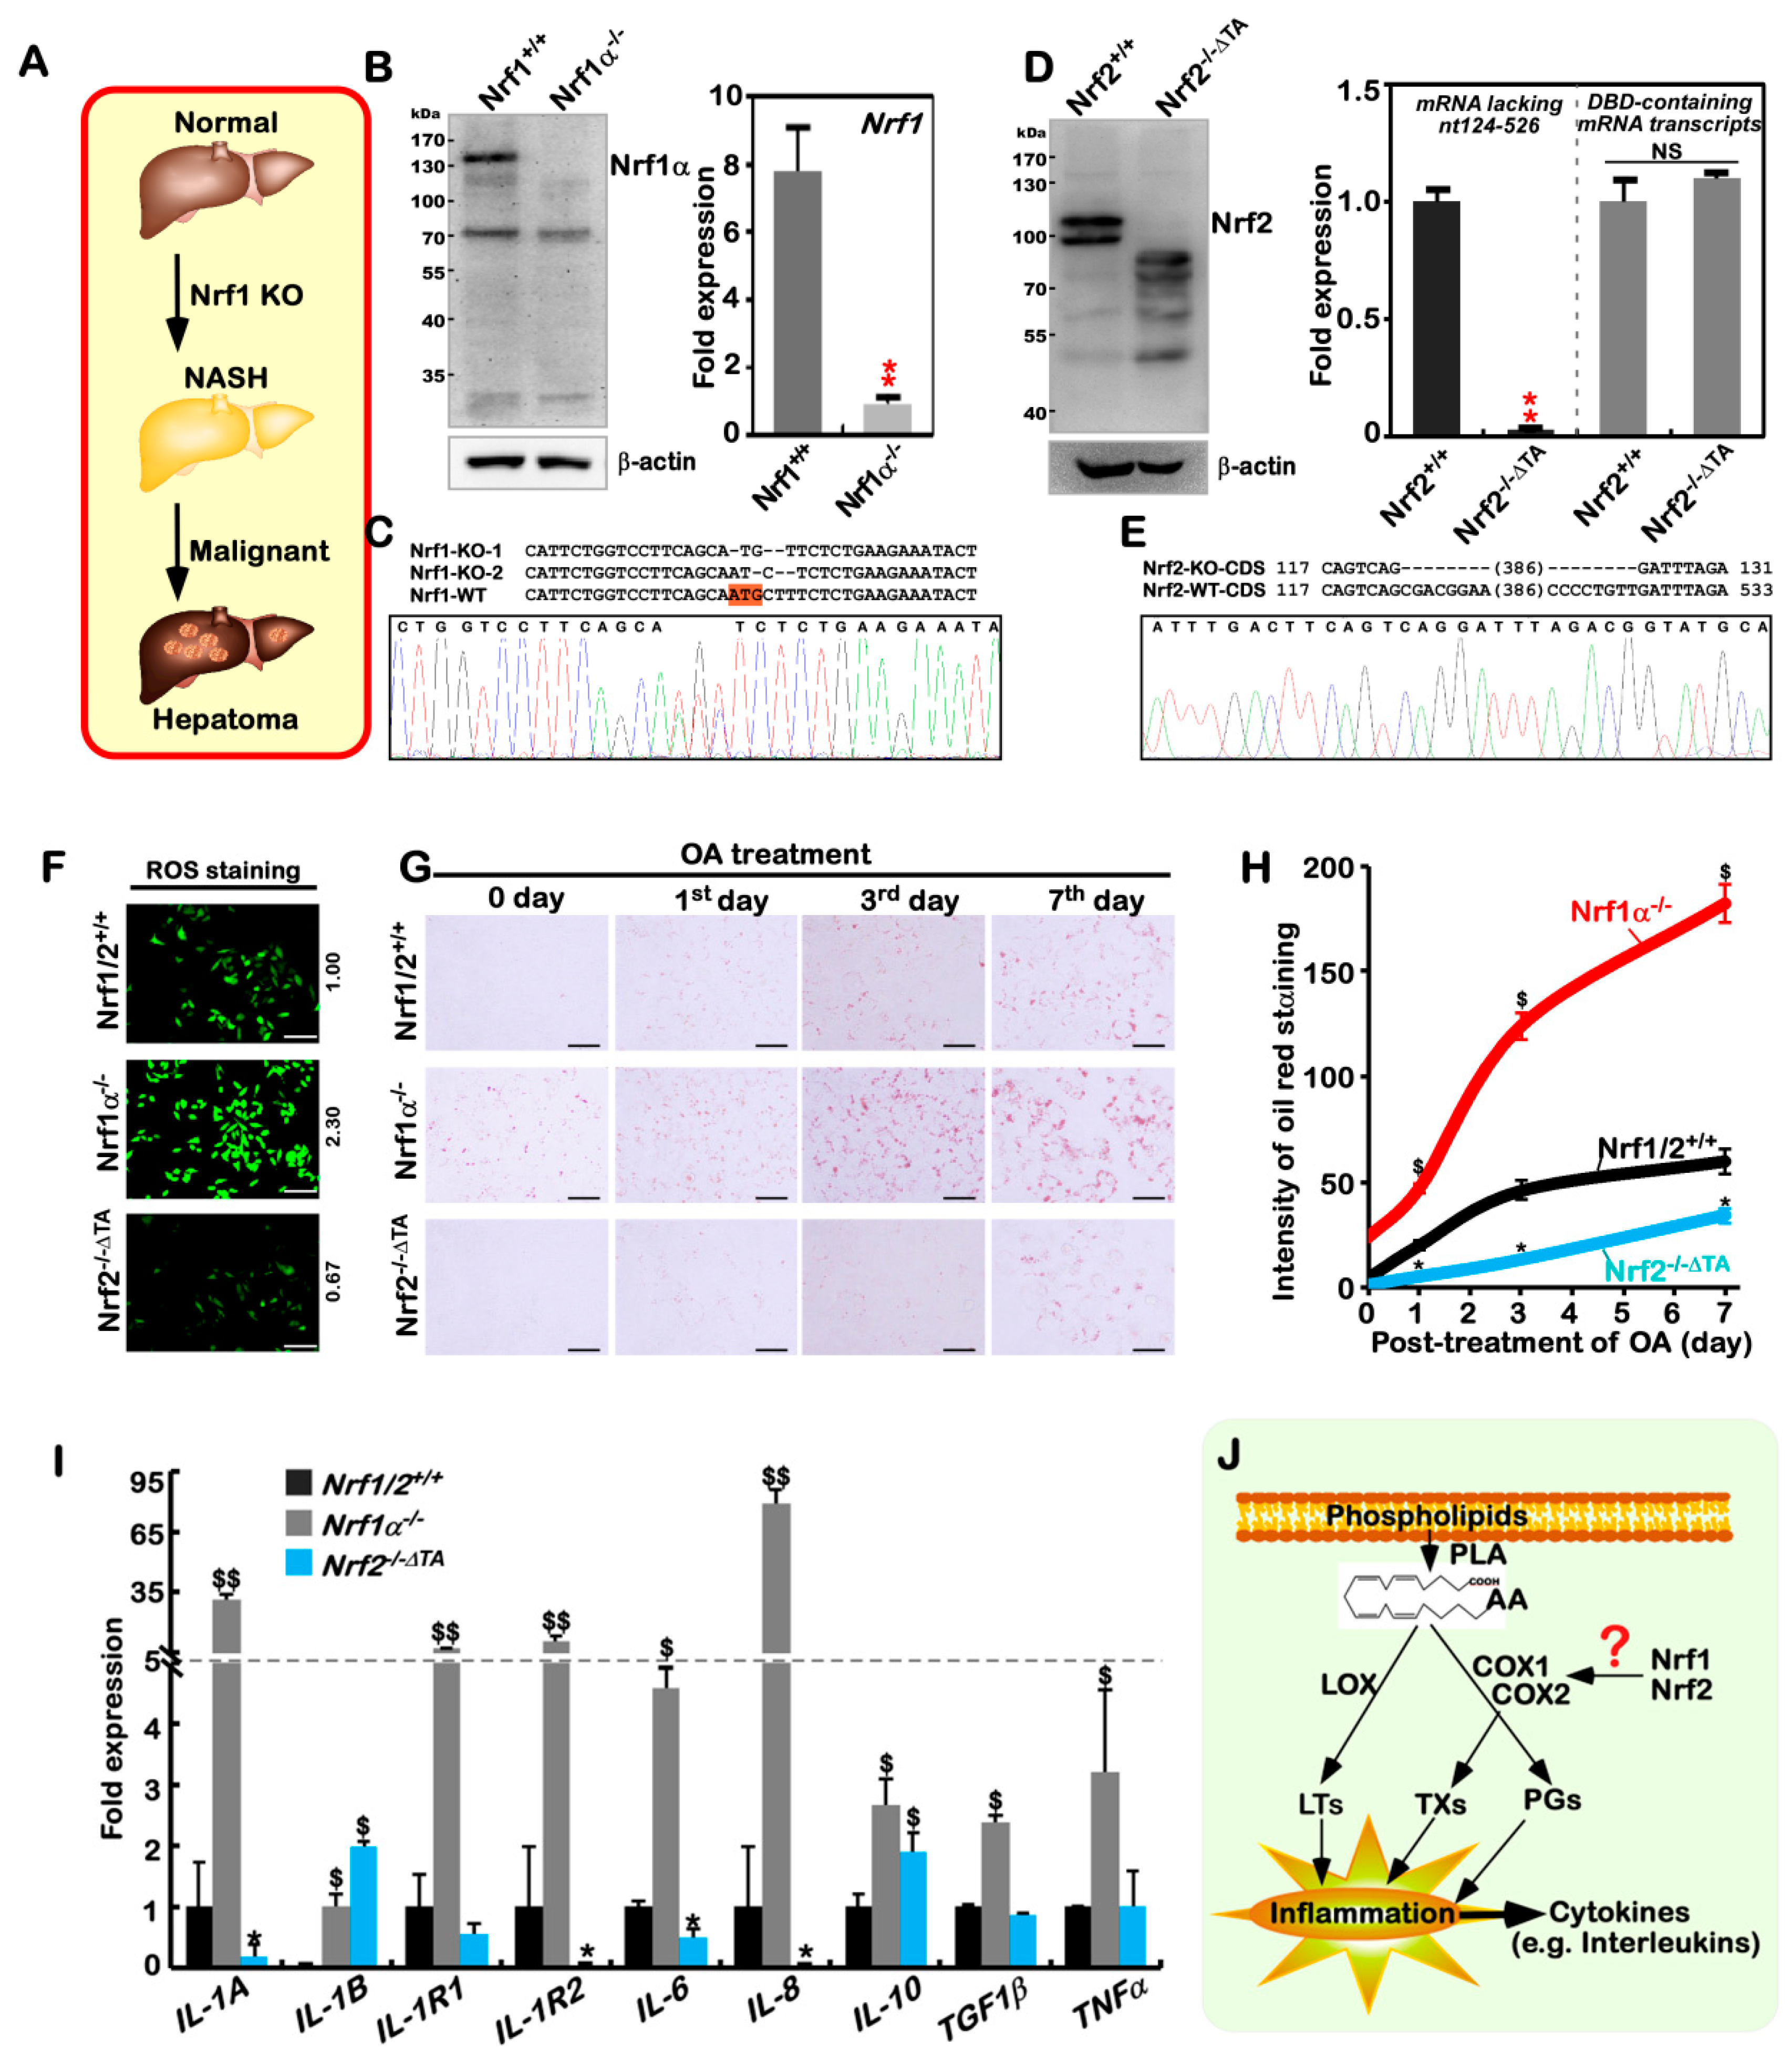
Figure 1. Establishment of Nrf1α-specific knockout cell models with the NASH phenotype. (A) Schematic diagrams for the liver-specific Nrf1/ knockout mice that develop spontaneous NASH and deteriorate into hepatoma eventually. (B) Both Western blotting (WB, left) and real-time quantitative PCR (qPCR, right) were employed to identify the protein and mRNA levels of Nrf1 in a monoclonal Nrf1α/ knockout cell line. The data are shown as mean ± SEM (n = 3 × 3, * p < 0.01). (C) Sequencing peaks of the genomic DNA fragments across Nrf1α-specific knockout site, as indicated by alignment with wild type (WT) standard sequence. (D) Expression of inactive Nrf2 mutant protein and mRNA levels in a monoclonal Nrf2/−ΔTA cell line was identified by WB (left) and qPCR with distinct primer pairs (right). The data are shown as mean ± SEM (n = 3 × 3, * p < 0.01; NS = no statistical difference). (E) Sequencing peaks of the genomic DNA fragments across the Nrf2-specific knockout site, as indicated by alignment with normal (WT) sequence. (F) ROS staining of Nrf1/2+/+, Nrf1α/ and Nrf2/−ΔTA cells. They had been treated with 5 μM of 2′,7′-dichlorodihydrofluorescein diacetate (DCFH-DA) for 30 min, before being photographed under a fluorescence microscope. Scale bar = 100 μm. (G) Lipid staining of Nrf1/2+/+, Nrf1α/ and Nrf2/−ΔTA cells, that were or were not treated with 200 μM oleic acid (OA), before being stained with the oil red O agent, and then photographed under a microscope. Scale bar = 25 μm. (H) Statistical analysis of the above lipid-stained (G) intensity, that was quantified and shown graphically. The data are represented as mean ± SEM (n = 3), with significant increases ($) or decreases (*), p < 0.01, compared with wild-type values. (I) The expression of inflammation-related genes in Nrf1/2+/+, Nrf1α/ and Nrf2/−ΔTA cells. The data obtained from transcriptome, and FPKM are shown as mean ± SEM (n = 3; $, p < 0.01; $$, p < 0.001 and * p < 0.01, by comparison with wild-type). (J) Diagrammatic representation of a proposed model for Nrf1 and Nrf2 to regulate COX1 and COX2, essential for arachidonic acid metabolism and relevant inflammatory response.
Cancers 10 00520 g001
Figure 2. Differential or opposing roles of Nrf1α and Nrf2 in regulating COX2 and COX1 genes. (A) The mRNA levels of COX1, COX2, ALOX5, and FLAP were determined by real-time qPCR in Nrf1/2+/+, Nrf1α/ and Nrf2/ΔTA cells. The data are shown as mean ± SEM (n = 3 × 3, * p < 0.01; $, p < 0.01; $$, p < 0.001). (B) The protein levels of COX1, COX2, ALOX5, Nrf1, and β-actin (as a loading control) in Nrf1α/ and Nrf1/2+/+ cells were visualized by Western blotting. (C) Western blotting of Nrf1α/ and Nrf2/ΔTA cells to determine protein levels of COX1, COX2, ALOX5, Nrf1, and β-actin. (D) Time-course analysis of COX2 in Nrf1/2+/+, Nrf1α/ and Nrf2/ΔTA cells, that had been treated for 1 h to 12 h with 100 nM TPA (12-O-tetradecanoyl phorbol-13-acetate), before being examined by Western blotting. (E) The intensity of the above anti-COX2 immunoblots (D) was quantified by normalizing the untreated value, which is shown graphically. The data are shown as mean ± SEM (n = 3, * p < 0.01; $, p < 0.01). (F) After the restoration of Nrf1 into Nrf1α/ cells by packaging with the Lentivirus, changed abundances of Nrf1, COX1, COX2, and ALOX5 among Nrf1/2+/+, Nrf1α/ and Nrf1α/+Nrf1-restored cell lines were examined by Western blotting. (G) Differences in Nrf2, p-JNK and JNK expression between Nrf1/2+/+ and Nrf1α/ cells were unraveled by Western blotting. (H) The changes in p-JNK, Nrf2 and COX2 were examined, following 24 h treatment of Nrf1α/ cells with 20 μM of SP600125. (I) Alterations in Nrf2, COX2, Fra1, and Jun by siRNA interference with Nrf2 in Nrf1α/ cells were determined by Western blotting. (J) The human COX2 promoter-driven reporter PCOX2-luc and its mutant (upper) were constructed before the luciferase assay. Nrf1/2+/+ cells were co-transfected with either PCOX2-luc or mutant, together with an internal control reporter pRL-TK, plus an expression construct for Nrf1 or Nrf2, or empty pcDNA3 plasmid, and allowed for 24-h recovery before the PCOX2-luc activity was calculated (lower). The data are shown as mean ± SEM (n = 3 × 3, * p < 0.01; $, p < 0.01 compared to the pcDNA3 values). (K) Each of PCOX2-luc, its mutant PCOX2m-luc and the empty vector pGL3 was co-transfected with the control reporter pRL-TK, along with siNrf2 or siNC (as a negative control), into Nrf1α/ cells as described above. The cells were allowed for 24 h recovery from transfection before the luciferase activity was measured. The fold changes in the Nrf2 -mediated activity were calculated as mean ± SEM (n = 3 × 3, * p < 0.01, compared to controls).
Cancers 10 00520 g002aCancers 10 00520 g002b
Figure 3. Different regulation of PTEN by Nrf1α and Nrf2 occurs through miR-22. (A) The content of miR-22 in Nrf1/2+/+, Nrf1α/ and Nrf2/ΔTA cells was determined by qPCR with miR-22 specific primers. The data are shown as mean ± SEM (n = 3×3; * p < 0.01; $, p < 0.01 compared to wild-type values). (B) The miR-22 expression was altered by transfection of an expression construct for Nrf1 or Nrf2, or an empty pcDNA3 control, into Nrf1/2+/+ cells. The qPCR data are shown as mean ± SEM (n = 3 × 3; $, p < 0.01). (C) The miR22-ARE-luc reporter driven by an ARE enhancer site in the mir-22 gene promoter, and its mutant reporter miR22-AREm-luc were constructed. Either of reporter genes as indicated, together with pRL-TK, plus each of pcDNA3, Nrf1, or Nrf2 expression constructs, were co-transfected into Nrf1/2+/+ cells and then allowed for 24-h recovery before the luciferase activity measured. The data are shown as mean ± SEM (n = 3 × 3; * p < 0.01; $, p < 0.01). (D) There exists a miR-22 binding site in the PTEN’s 3’UTR region (which was constructed in the dual fluorescent psiCHECK2 vector to yield the PTEN-miR22b reporter). Either of PTEN-miR22b and PTEN-miR22b- mut was co-transfected with miR-22 expression plasmid or a negative control (NC) into Nrf1/2+/+ cells, and then allowed for 24-h recovery, before the fluorescent activity was determined. The data are shown as mean ± SEM (n = 3 × 3; * p < 0.01; NS = no statistical difference). (E) Either PTEN-miR22b or PTEN-miR22b-mut was co-transfected with each of pcDNA3, Nrf1, or Nrf2 expression constructs Nrf1/2+/+ cells and allowed for 24-h recovery, before the fluorescent activity was measured. The data are shown as mean ± SEM (n = 3 × 3; * p < 0.01). (F) Both the mRNA (upper) and protein (lower) levels of PTEN in Nrf1/2+/+, Nrf1α/ and Nrf2/ΔTA cells were determined by qPCR and Western blotting, respectively. The data are shown as mean ± SEM (n = 3 × 3; * p < 0.01; $, p < 0.01). (G) Schematic representation of the PTEN promoter-containing PPTEN-luc plasmid, its distinct ARE-driven reporters (PARE1-luc and PARE2-luc) and indicated mutants, which were constructed into the PGL3-Promoter (i.e., PGL3-Pro) vector. (H) The PPTEN-luc and pRL-TK, along with an expression construct for Nrf1 or Nrf2, or pcDNA3 were co-transfected into Nrf1/2+/+ cells and then allowed for 24-h recovery before being measured. The luciferase activity data are shown as mean ± SEM (n = 3 × 3; $, p < 0.01). (I) Nrf1/2+/+ cells were subject to co-transfection with an indicated luciferase reporter, together with pRL-TK and Nrf1 expression construct or pcDNA3 for 24 h before being determined. The data are shown as mean ± SEM (n = 3 × 3; $, p < 0.01; * p < 0.01).
Cancers 10 00520 g003
Figure 4. Opposing and unified cross-talks between Nrf1α and Nrf2. (A) Real-time qPCR determined the mRNA levels of Nrf2, HO-1, GCLC, GCLM, NQO1, LPIN1, and PGC1β expressed in Nrf1/2+/+ and Nrf1α/ cells. The data are shown as mean ± SEM (n = 3 × 3, * p < 0.01; $, p < 0.01; $$, p < 0.001. NS = no statistical difference). (B) The protein levels of Nrf1, HO-1, GCLM, NQO1 and HIF1α in Nrf1/2+/+ and Nrf1α/ cells were visualized by Western blotting. (C) Nrf1α/ cells were interfered by siNrf2 (at 60 nM) to knock down Nrf2, and then allowed for 24-h recovery for 24 h, before abundances of HO-1, GCLM, NQO1 and HIF1a were examined by Western blotting. (D) After Nrf1 was allowed for restoration into Nrf1α/ cells, changed protein levels of Nrf2, HO-1, GCLM, NQO1, p-JNK and JNK were determined in Nrf1/2+/+ , Nrf1α/ cells and Nrf1α/ +Nrf1-restored cells. (E) Expression of Nrf1, HO-1, GCLC, GCLM, NQO1, LPIN1 and PGC1β genes in Nrf1/2+/+ and Nrf2/ΔTA cells were analyzed by real-time qPCR. The data are shown as mean ± SEM (n = 3 × 3, * p < 0.01). (F) The protein levels of Nrf1, HO-1, GCLM, NQO1 and HIF1α in Nrf1/2+/+ and Nrf2/ΔTA cells were seen by Western blotting. (G) Nrf2/ΔTA cells, that had been transfected with an expression construct for Nrf1 or Nrf2 or pcDNA3, were subject to real-time qPCR analysis of COX1, COX2, GCLM, HO-1, NQO1 and PSMB6 expression. The data are shown as mean ± SEM (n = 3 × 3, * p < 0.01, ** p < 0.001; $, p < 0.01; $$, p < 0.001. NS= no statistical difference). (H) Western blotting unraveled the changed abundances of Nrf1, Nrf2, COX1, COX2, GCLM, HO-1 and NQO1 proteins in Nrf2/ cells as transfected with an expression construct for Nrf1 or Nrf2. NC = a negative control transfected with empty pcDNA3. (I) Alterations in protein levels of Nrf2, Nrf1, COX1, COX2, HO-1, GCLM, p-JNK and JNK in Nrf1/2+/+ and caNrf2ΔN (containing the constitutive active Nrf2) cells were determined by Western blotting. (J,K) Nrf1/2+/+ cells were transfected with an expression construct for Nrf1 or Nrf2 or pcDNA3 (i.e., NC) and then allowed for a 24-h recovery, before being examined by Western blotting to determine the changes in abundances of Nrf1, Nrf2, COX1, COX2, HO-1 and GCLM. (L) A model is proposed to explain there exists an opposing and unifying inter-regulatory cross-talk between Nrf1 and Nrf2.
Cancers 10 00520 g004
Figure 5. Both Nrf1α and Nrf2 have inter-regulatory cross-talks at distinct levels. (A) Schematic representation of PNrf1-luc and PNrf2-luc reporters (driven by the human Nrf1 and Nrf2 gene promoters), along with various lengths of truncated PNrf1-luc mutants as indicated, which were constructed in the PGL3-Basic vector. There exist two transcriptional starting sites (i.e., TSS1, TSS2) within the Nrf1 gene promoter, which contains two Nrf1/Nef2l1-regulatory locus sites (i.e. Site-1, Site-2, and also see Figure S8A). (B) Each of the PNrf1-luc and indicated mutants, together with pRL-TK, plus an expression construct for Nrf1 or Nrf2, or empty pcDNA3, were co-transfected into Nrf1/2+/+ cells and allowed for 24-h recovery, before the luciferase activity was measured. The data are shown as mean ± SEM (n = 3 × 3; $, p < 0.01 compared with the co-transfection with PNrf1-luc and pcDNA3). (C) Nrf1/2+/+ cells were co-transfected with either PNrf1-luc or PNrf2-luc, together with pRL-TK, and allowed for 24-h recovery, before being treated with 50 μM tBHQ (tert-butylhydroquinone), 1 μM TG (thapsigargin) or 200 μM VC (vitamin C) for additional 24 h, respectively. The data are shown as mean ± SEM (n = 3 × 3; $, p < 0.01. NS = no statistical difference). (D) Either PNrf1-luc or PNrf2-luc, plus pRL-TK, and an expression construct for Nrf1 or Nrf2 at the concentrations as indicated, were co-transfected into Nrf1/2+/+ cells and then allowed for 24-h recovery before being determined. The data are shown as mean ± SEM (n = 3 × 3; * p < 0.01). (E) The pulse-chase analysis of Nrf2 in Nrf1/2+/+ and Nrf1α/ cells were carried out after treatment of the cells with 50 μg/mL of cycloheximide (CHX) alone or plus 5 μM of proteasomal inhibitor MG132 for various lengths of time as indicated. (F) The stability of Nrf2 was determined with its half-life in Nrf1/2+/+ and Nrf1α/ cells as treated above (E). (G) Expression of GSK3β, β-TrCP, p62 and Keap1 at their mRNA levels in Nrf1/2+/+ and Nrf1α/ cells were examined. The qPCR data are shown as mean ± SEM (n = 3 × 3, * p < 0.01). (H) The protein abundances of Keap1, GSK3β and β-TrCP in Nrf1/2+/+ and Nrf1α/ cell lines were determined by Western blotting. (I) The mRNA (upper column) and protein (lower panel) levels of PTEN in Nrf1/2+/+, Nrf1α/ and caNrf2ΔN cells were determined. The data are shown as mean ± SEM (n = 3 × 3, * p < 0.01, NS = no statistical difference). (J) Nrf1/2+/+ and Nrf1α/ cells had been treated with 100 nM rapamycin (RAPA) for 24 h, before being visualized by Western blotting to detect the changes of p-S6K1, AKT1, Nrf1, Nrf2, HO-1, and COX2 proteins. (K) An inter-regulatory model is proposed to explain mutual opposing and unifying cross-talks between Nrf1 and Nrf2 at distinct levels.
Cancers 10 00520 g005aCancers 10 00520 g005b
Figure 6. Distinctive animal tumor phenotypes of Nrf1α−/, Nrf1α−/+siNrf2, Nrf2−/ΔTA and caNrf2ΔN derived from Nrf1/2+/+ cells. (A) Differences in mouse subcutaneous xenograft tumors derived from Nrf1/2+/+, Nrf1α−/ Nrf1α−/+siNrf2, Nrf2−/ΔTA and caNrf2ΔN cells were measured in size every two days, before being sacrificed on the 32nd day. The data are shown as mean ± SEM (n = 6 per group, * p < 0.01; $, p < 0.01, NS = no statistical difference at the early incubation phase). (B) The final tumor weights of all groups were calculated and the data are shown as mean ± SEM (n = 6, ** p < 0.001; $, p < 0.01, NS = no statistical difference, when compared to the wild-type). (C) Distinctive animal xenograft tumors derived from Nrf1/2+/+, Nrf1α−/ Nrf1α−/+siNrf2, Nrf2−/ΔTA and caNrf2ΔN cells. (D) The histological photographs of indicated tumors were achieved by HE (hematoxylin & eosin) staining. The scale bar = 200 μm in ×40 pictures, or = 100 μm in ×200 pictures. (E) Evaluation of tumor angiogenesis by immunohistochemical staining with a specific marker CD31 antibody. The negative staining was set up by the non-immune serum to replace the primary antibody. Scale bar = 500 μm (×40) or = 100 μm (×200). (F) The qPCR analysis of some angiogenesis-related genes in distinct cells as indicated was validated by transcriptome. The data are shown as mean ± SEM (n = 3 × 3, * p < 0.01, ** p < 0.001; $, p < 0.01; $$, p < 0.001). (G,H) The flow cytometry analysis of distinct cell cycle was indicated. The data (n = 3) are shown in two different fashions. (I) The early apoptosis (EA) and late apoptosis (LA) of five distinct cell lines were examined by flow cytometry. The data are shown as mean ± SEM (n = 9; $, p < 0.01). (J) Expression of some apoptosis-related genes in indicated cells was transcriptomically analyzed. The data are shown as mean ± SEM (n = 3, * p < 0.01, ** p< 0.001; $, p < 0.01; $$, p < 0.001).
Cancers 10 00520 g006
Figure 7. An axiomatic rationale underlying distinct animal xenograft tumor phenotypes. (A) Differentially expressed genes (DEGs) in all distinctive cell lines were analyzed by transcriptome sequencing. The differences in the number of DEGs are shown after being compared with wild-type or indicated cell lines. Those increased or decreased DEGs were represented by red or green columns, respectively. The DEGs were selected according to the following criteria: fold change ≥ 2 or ≤ 0.5 and diverge probability ≥ 0.8 (as compared to the control group). (B) KEGG classification of DEGs for each pairwise. The X-axis shows the number of DEGs, while the Y-axis represents distinct second- grading KEGG pathways. The top pathways are shown in different colors, such as cellular processes (blue), metabolism (light blue), environmental information processing (green), genetic information processing (brown), human disease (purple), and organism system (orange). (C,D) Significant differences in the DEGs enriched responsible for the PI3K-AKT signaling pathway in Nrf1α/ and Nrf2/ΔTA cell lines. (E) The Venn diagram shows the DEGs in four single variable group. To expand the screening range, the DEG is redefined as a fold change greater than 1.5 or less than 0.66. Nrf1α- or Nrf2-specific downstream genes were indicated by red and green numbers, respectively. (F) Distinct changes in abundances of Nrf1α and Nrf2 were illustrated after both protein levels present in each of indicated cell lines was compared with the equivalent values from wild-type cells. (G) The Heat maps of particularly Nrf1α- and Nrf2-specific downstream genes, which were screened from the transcriptome data in this experimental setting herein. (H) An explicit model is proposed to decipher the axiomatic rationale underlying such distinct animal xenograft tumor phenotypes, demonstrating significant differences in the cancer pathobiology of between Nrf1α and Nrf2.
Cancers 10 00520 g007
Table 1. The key resources used in this work.
Reagent or ResourceSourceIdentifier
Antibodies
AKT1Abcamab32505
ALOX5Sangon BiotechD220061
CD31ServicebioGB11063-3
COX1Sangon BiotechD260197
COX2Abcamab62331
FosAbcamab134122
Fra1Abcamab124722
GCLMAbcamab126704
GSK3βSangon BiotechD160468
HIF1αAbcamab51608
Histone 3Biossbs-0349R
HO-1Abcamab52947
JNK (Anti-JNK1+JNK2+JNK3)Abcamab208035
JunProteintech10024-2-AP
KEAP1Sangon BiotechD154142
NQO1Abcamab80588
Nrf1Zhang’s [97]N/A
Nrf2Abcamab62352
p-JNK (Anti-JNK1+JNK2+JNK3 (phospho T183+T183+T221))Abcamab124956
p-S6K1( Anti-RPS6KB1(Phospho-Thr389/412))Sangon BiotechD151473
PTENAbcamab32199
UbiquitinCell Signaling Technology3933S
Alexa Fluor 488 - Conjugated Goat anti-rabbit IgGZSGB-BIOZF-0511
α-TubulinBeyotimeAF0001
β-actinZSGB-BIOTA-09
β-TrCPSangon BiotechD154110
Biological Samples: Cell Lines
HepG2Cell bank of the Chinese Academy of SciencesTCHu72
Nrf1α-/-this paperNA
Nrf2-/-ΔTAthis paperNA
caNrf2ΔNthis paperNA
HepG2Keap1-/-this paperNA
HL7702Cell bank of the Chinese Academy of SciencesGNHu 6
HL7702Nrf1α-/-this paperNA
MEFcourtesy of Akira KobayashiNA
MEFNrf1-/-(ΔDBD)courtesy of Akira KobayashiNA
MEFNrf2-/-(ΔDBD)courtesy of John D. HayesNA
MEFKeap1-/-courtesy of John D. HayesNA
Chemicals, Peptides, and Recombinant Proteins
12-O-Tetradecanoylphorbol-13-acetate (TPA)BeyotimeS1819
BAPTA-Acetoxymethyl ester (BAPTA-AM)Cayman Chemical15551
Caffeic Acid Phenethyl Ester (CAPE)SelleckS7414
cOmplete Tablets EASYpackRoche4693116001
cycloheximide (CHX)SolarbioC8030
H-89BeyotimeS1643
JSH-23SelleckS7351
MG132Sigma AldrichM7449
oil red OSangon BiotechA600395
paraformaldehydeBoster Biological TechnologyAR1068
PhosSTOP EASYpackRoche4906845001
Rapamycin (RAPA)Sigma Aldrich37094
sodium oleateSolarbioN/A
SP600125SelleckS1460
SR11302Cayman Chemical11302
tert-Butylhydroquinone (tBHQ)Sigma Aldrich112941
Thapsigargin (TG)Sangon BiotechA616759
Vitamin C (VC)Sigma Aldrich33034
Deposited Data
Oligonucleotides for siRNA or miRNA
siNrf2 FWSangon BiotechGUAAGAAGCCAGAUGUUAAdTdT
siNrf2 REVSangon BiotechUUAACAUCUGGCUUCUUACdTdT
siJUN FWSangon BiotechGCAUGGACCUAACAUUCGAdTdT
siJUN REVSangon BiotechUCGAAUGUUAGGUCCAUGCdTdT
siFra1 FWSangon BiotechCAAACUGGAAGAUGAGAAAdTdT
siFra1 REVSangon BiotechUUUCUCAUCUUCCAGUUUGdTdT
has-miR-22-3p FWSangon BiotechAAGCUGCCAGUUGAAGAACUGU
has-miR-22-3p REVSangon BiotechAGUUCUUCAACUGGCAGCUUUU
Normal control FWSangon BiotechUUCUCCGAACGUGUCACGUdTdT
Normal control REVSangon BiotechACGUGACACGUUCGGAGAAdTdT
Oligonucleotides for qPCR
ALOX5 FWTsingkeGCTGCCCCAGCCAGATGGACTC
ALOX5 REVTsingkeCTGCTTGGTGTGGAAATGCTGA
COX1 FWTsingkeCGCCAGTGAATCCCTGTTGTT
COX1 REVTsingkeAAGGTGGCATTGACAAACTCC
COX2 FWTsingkeAAGTCCCTGAGCATCTACGGTTT
COX2 REVTsingkeGTTGTGTTCCCTCAGCCAGATT
FLAP FWTsingkeTCAGCGTGGTCCAGAATGG
FLAP REVTsingkeGCAAGTGTTCCGGTCCTCT
FOS FWTsingkeCACCGACCTGCCTGCAAGAT
FOS REVTsingkeGCTGGGAACAGGAAGTCATCAA
FOSB FWTsingkeGCTGCAAGATCCCCTACGAAG
FOSB REVTsingkeACGAAGAAGTGTACGAAGGGTT
Fra1 FWTsingkeCCTGCCGCCCTGTACCTTGT
Fra1 REVTsingkeGTCTCCGCTGCTGCTGCTACTC
Fra2 FWTsingkeCACCATCAACGCCATCACGA
Fra2 REVTsingkeCGACGCTTCTCCTCCTCTTCAG
GCLC FWTsingkeTCAATGGGAAGGAAGGTGTGTT
GCLC REVTsingkeTTGTAGTCAGGATGGTTTGCGA
GCLM FWTsingkeGTGTGATGCCACCAGATTTGAC
GCLM REVTsingkeCACAATGACCGAATACCGCAGT
HO-1 FWTsingkeCAGAGCCTGGAAGACACCCTAA
HO-1 REVTsingkeAAACCACCCCAACCCTGCTAT
JUN FWTsingkeATGGAAACGACCTTCTATGACGA
JUN REVTsingkeCGTTGCTGGACTGGATTATCA
JUNB FWTsingkeAGCCACCTCCCGTTTACACCAA
JUNB REVTsingkeACGGTCTGCGGTTCCTCCTTGA
JUND FWTsingkeATCGACATGGACACGCAGGAGC
JUND REVTsingkeGCTGTTGACGTGGCTGAGGACT
KEAP1 FWTsingkeAACAACTCGCCCGACGGCAACAC
KEAP1 REVTsingkeCATCCCGCTCTGGCTCATACCTC
LPIN1 FWTsingkeTGACCAATCGCCAACTCTGG
LPIN1 REVTsingkeTCAGCACCAAGATGTCGGCT
mir-22 FWTsingkeGCAAGCTGCCAGTTGAAG
mir-22 REVTsingkeGTGCAGGGTCCGAGGT
mir-22-RTTsingkeGTCGTATCCAGTGCAGGGTCCGAGGTATTCGCACTGGATACGACACAGTT
NQO1 FWTsingkeAAGAAGAAAGGATGGGAGGTGG
NQO1 REVTsingkeGAACAGACTCGGCAGGATACTGA
Nrf1 FWTsingkeTGGAACAGCAGTGGCAAGATCTCA
Nrf1 REVTsingkeGGCACTGTACAGGATTTCACTTGC
Nrf2 FWTsingkeAATTGCCTGTAAGTCCTGGTCAT
Nrf2 REVTsingkeTCATTGAACTGCTCTTTGGACAT
Nrf2-/-ΔTA FWTsingkeCGACGGAAAGAGTATGAGCTGGA
Nrf2-/-ΔTA REVTsingkeACTGGTTTCTGACTGGATGTGCT
PGC1βFWTsingkeTGGTGAGATTGAGGAGTGCGA
PGC1βREVTsingkeGCCTTGTCTGAGGTATTGAGGTATTC
PSMB6 FWTsingkeTCAAGAAGGAGGGCAGGTGT
PSMB6 REVTsingkeGTAAAGTGGCAACGGCGAA
PTEN FWTsingkeTTTGAAGACCATAACCCACCAC
PTEN REVTsingkeATTACACCAGTTCGTCCCTTTC
β-actin FWTsingkeCATGTACGTTGCTATCCAGGC
β-actin REVTsingkeCTCCTTAATGTCACGCACGAT
Oligonucleotides for construct
COX1-LUC FWTsingkeGCCTCGGTACCCTGCCTGCTCTCTC
COX1-LUC REVTsingkeGATGAGAAGCTTACTACTCCTCAGACAGATC
COX1-UTR FWTsingkeGCAGGAAAGCAGCATTCTCGAGGGGAGAGCTTTGTGCTTGTC
COX1-UTR REVTsingkeCACTGATTAAAAGTCCCTCGCGGCCGCTAAAGTGCTTGTGTC
COX1-UTR-M FWTsingkeGTCTTGACTCATGTTTCTCATGAAGCTAATAAAATTCGC
COX1-UTR-M REVTsingkeAGCTTCATGAGAAACATGAGTCAAGACCTGGATG
COX2-LUC FWTsingkeCTACAAATTGAGGTACCTGGTGTAG
COX2-LUC REVTsingkeAATTGGAAGCTTACCGAGAGAACCTTC
COX2-LUC-M FWTsingkeGAGCAGATATACAGCCTATTAAGCGTATTAACTAAAACATAAAACATGTCAGCC
COX2-LUC-M REVTsingkeGGCTGACATGTTTTATGTTTTAGTTAATACGCTTAATAGGCTGTATATCTGCTC
FOS FWTsingkeGCTTTGCCTAAGCTTCACGATGATGTTCTCG
FOS REVTsingkeTTCCCTGAATTCTCACAGGGCCAGCAGCGTG
JUN FWTsingkeCACGTGAAGCTTCGGACTGTTCTATGACTGC
JUN REVTsingkeCGACGGTCTGAATTCAAAATGTTTGCAACTG
Keap1 sgRNA FWTsingkeAAACACCGTATGAGCCAGAGCGGGATG
Keap1 sgRNA REVTsingkeCTCTAAAACCATCCCGCTCTGGCTCATA
MIR-22-LUC FWTsingkeCAGTCCTCTGGGTTGAACAGAGCTATCTCAGACAGAGGAAGGTCGGACGGA
MIR-22-LUC REVTsingkeGATCTCCGTCCGACCTTCCTCTGTCTGAGATAGCTCTGTTCAACCCAGAGGACTGGTAC
MIR-22-LUC-M FWTsingkeCAGTCCTCTGGGTTGAACAGAAATATTTCAGACAGAGGAAGGTCGGACGGA
MIR-22-LUC-M REVTsingkeGATCTCCGTCCGACCTTCCTCTGTCTGAAATATTTCTGTTCAACCCAGAGGACTGGTAC
Nrf1 FWTsingkeCGGGGTACCATGCTTTCTCTGAAGAAATACTTAACGGAAGG
Nrf1 REVTsingkeGCTCTAGACACTTTCTCCGGTCCTTTGGCTTCC
Nrf1-LUC-#1 FWTsingkeCCTAGGCCTGCTAGCGCGACTGAGTTTGTCTCTACACCT
Nrf1-LUC-#1 REVTsingkeCTTCAGAGAAAAGCTTGCTGAAGGACCAGAATGTTTATGCT
Nrf1-LUC-#2 FWTsingkeCCTAGGCCTGCTAGCGCGACTGAGTTTGTCTCTACACCT
Nrf1-LUC-#2 REVTsingkeCGAACAAGTGAAGCTTCCCTGGCCTTGAC
Nrf1-LUC-#3 FWTsingkeCACCCAACGCGCTAGCCCACTAACATCG
Nrf1-LUC-#3 REVTsingkeCTTCAGAGAAAAGCTTGCTGAAGGACCAGAATGTTTATGCT
Nrf1-LUC-#4 FWTsingkeCACCCAACGCGCTAGCCCACTAACATCG
Nrf1-LUC-#4 REVTsingkeACTGCACTCAAGCTTGGGCAACAAGAGCAA
Nrf1-LUC-#5 FWTsingkeCACCCAACGCGCTAGCCCACTAACATCG
Nrf1-LUC-#5 REVTsingkeCTACTAAGCTTGACTATTCCGTCCA
Nrf1-LUC-#6 FWTsingkeCACCCAACGCGCTAGCCCACTAACATCG
Nrf1-LUC-#6 REVTsingkeGTTCAAGCTTCCGGACAAAGTC
Nrf1-LUC-#7 FWTsingkeCACCCAACGCGCTAGCCCACTAACATCG
Nrf1-LUC-#7 REVTsingkeCTGGTAAGCTTCTGCCCGGATAC
Nrf2 FWTsingkeGAGCCCGGTACCACGGTCCACAGCTC
Nrf2 REVTsingkeAAAACTAGCTCGAGAAAGGTCAAATCCTCCT
Nrf2 sgRNA-1 FWTsingkeAAACACCGTATTTGACTTCAGTCAGCGA
Nrf2 sgRNA-1 REVTsingkeCTCTAAAACTCGCTGACTGAAGTCAAATA
Nrf2 sgRNA-2 FWTsingkeAAACACCGTGCATACCGTCTAAATCAAC
Nrf2 sgRNA-2 REVTsingkeCTCTAAAACGTTGATTTAGACGGTATGCA
Nrf2 sgRNA-3 FWTsingkeAAACACCGTGGATTTGATTGACATACTT
Nrf2 sgRNA-3 REVTsingkeCTCTAAAACAAGTATGTCAATCAAATCCA
Nrf2-LUC FWTsingkeCCAGGAGTTTGGTACCAGCCTGGGCAACATAGTGA
Nrf2-LUC REVTsingkeCCAGCTCCAAGTAGATCTTGATGAGCTGTGGA
PTEN-LUC FWTsingkeGGTACTTGGAGGCTGGTACCATATTCTAGCAC
PTEN-LUC REVTsingkeCGGGAGATCTGAGGGCAGGGCAGGGCA
PTEN-LUC-M1 FWTsingkeGAGCATTGTTTTCACCTGGTCCTTTTCACCTGTGCACAGGTAACCTCAG
PTEN-LUC-M1 REVTsingkeGTGCGTTGAGCAGTGTCACTGACTCGAGTCTGAGGTTACCTGTG
PTEN-LUC-M2 FWTsingkeGAGCAGCGTGGTCACCTGGTCCTTTTCACCTGTGCACAGGTAACCTCAG
PTEN-LUC-M2 REVTsingkeGTGCGTTGATTAGTTTCACTGACTCGAGTCTGAGGTTACCTGTG
PTEN-UTR FWTsingkeATGGCAATAGGACCTCGAGTCAGATTACCAGTTATAGGAACAATTCTC
PTEN-UTR REVTsingkeCTTTCCATATGCTGGCGGCCGCGTACAGAATAATAGACAAAAGC
PTEN-UTR-M FWTsingkeCATATTGGTGCTAGAAAAAAGGAAGTGAATCTGTATTGGGGTACAG
PTEN-UTR-M REVTsingkeTGTACCCCAATACAGATTCACTTCCTTTTTTCTAGCACCAATATGCT
Recombinant DNA
pARE-lucZhang’s [97]N/A
pcDNA3.1invitrogenV79020
pGL3-BasicPromegaVQP0121
pGL3-promoterPromegaVQP0124
pRL-TKPromegaVQP0126
psiCHECK2PromegaC8021
Software and Algorithms
Canvas XCanvas GFX, Inc.https://www.canvasgfx.com/
Chromas 2.4.1Technelysium Pty Ltd.http://technelysium.com.au/wp/chromas/
cytoscape[98]http://www.cytoscape.org/
ExcelMicrosofthttps://www.microsoft.com/
FlowJo 7.6.5.FlowJohttps://www.flowjo.com/
KEGGKanehisa Laboratorieshttps://www.kegg.jp/
Primer Premier 5PREMIER Biosoft Internationalhttps://www.PremierBiosoft.com/
Targetscan 7.2[99]http://www.targetscan.org/vert_72/
Venny 2.1.0BioinfoGP, CNB-CSIChttp://bioinfogp.cnb.csic.es/tools/venny/index.html
Others
Cas9/gRNA Construct Kitv-solidVK001
KeyGEN DAPI staining kitKeyGEN BioTECHKGA215
DAB kitBoster Biological TechnologyAR1022
Dual-luciferase reporter assay systemPromegaE1910
FastTALETM TALEN Assembly KitSIDANSAI2801
GoTaq® qPCR Master MixPromegaA6001
Hematoxylin and Eosin Staining KitBeyotimeC0105
Lenti-Pac HIV Expression Packaging KitGene CopoeiaHPK-LvTR
Lipofectamine® 3000 Transfection KitInvitrogenL3000-015
Nuclei Isolation KitSigmaNUC101-1KT
Reactive Oxygen Species Assay KitBeyotimeS0033
Revert Aid First Strand Synthesis KitThermoK1622
RNAsimple Total RNA KitTiangen BiotechDP419