Automated Knowledge-Based Intensity-Modulated Proton Planning: An International Multicenter Benchmarking Study

 , , ,
, , ,
Abstract
1. Introduction
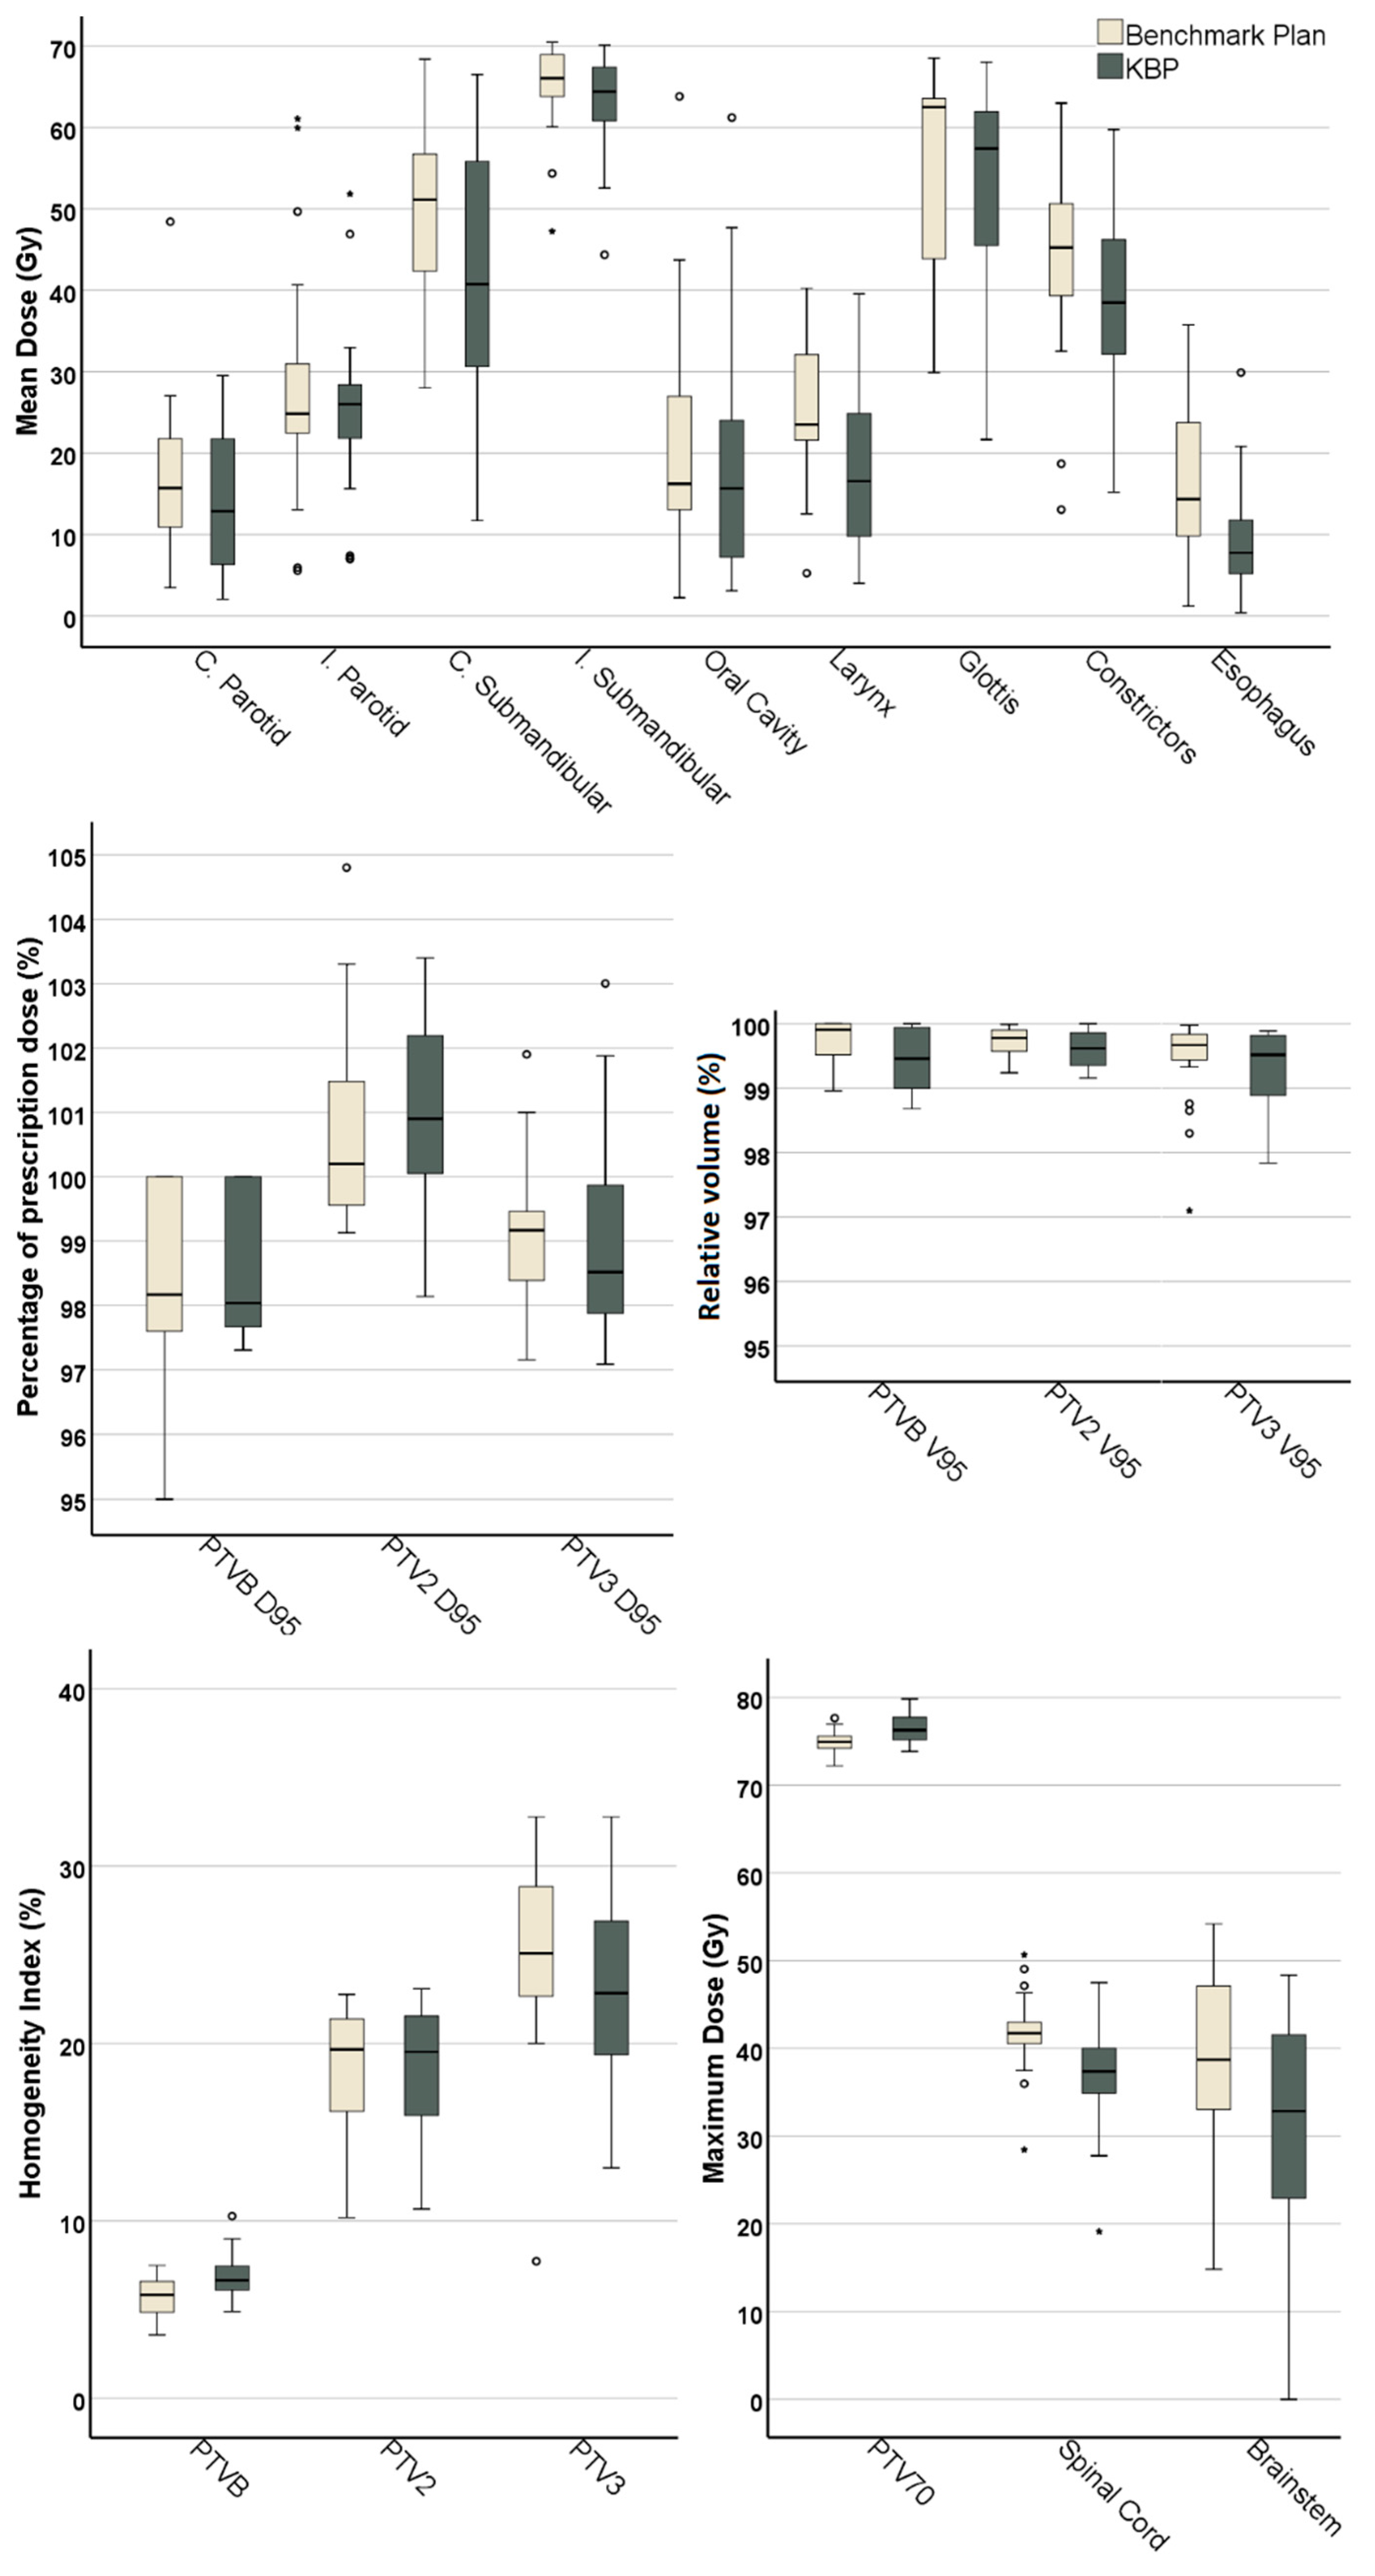
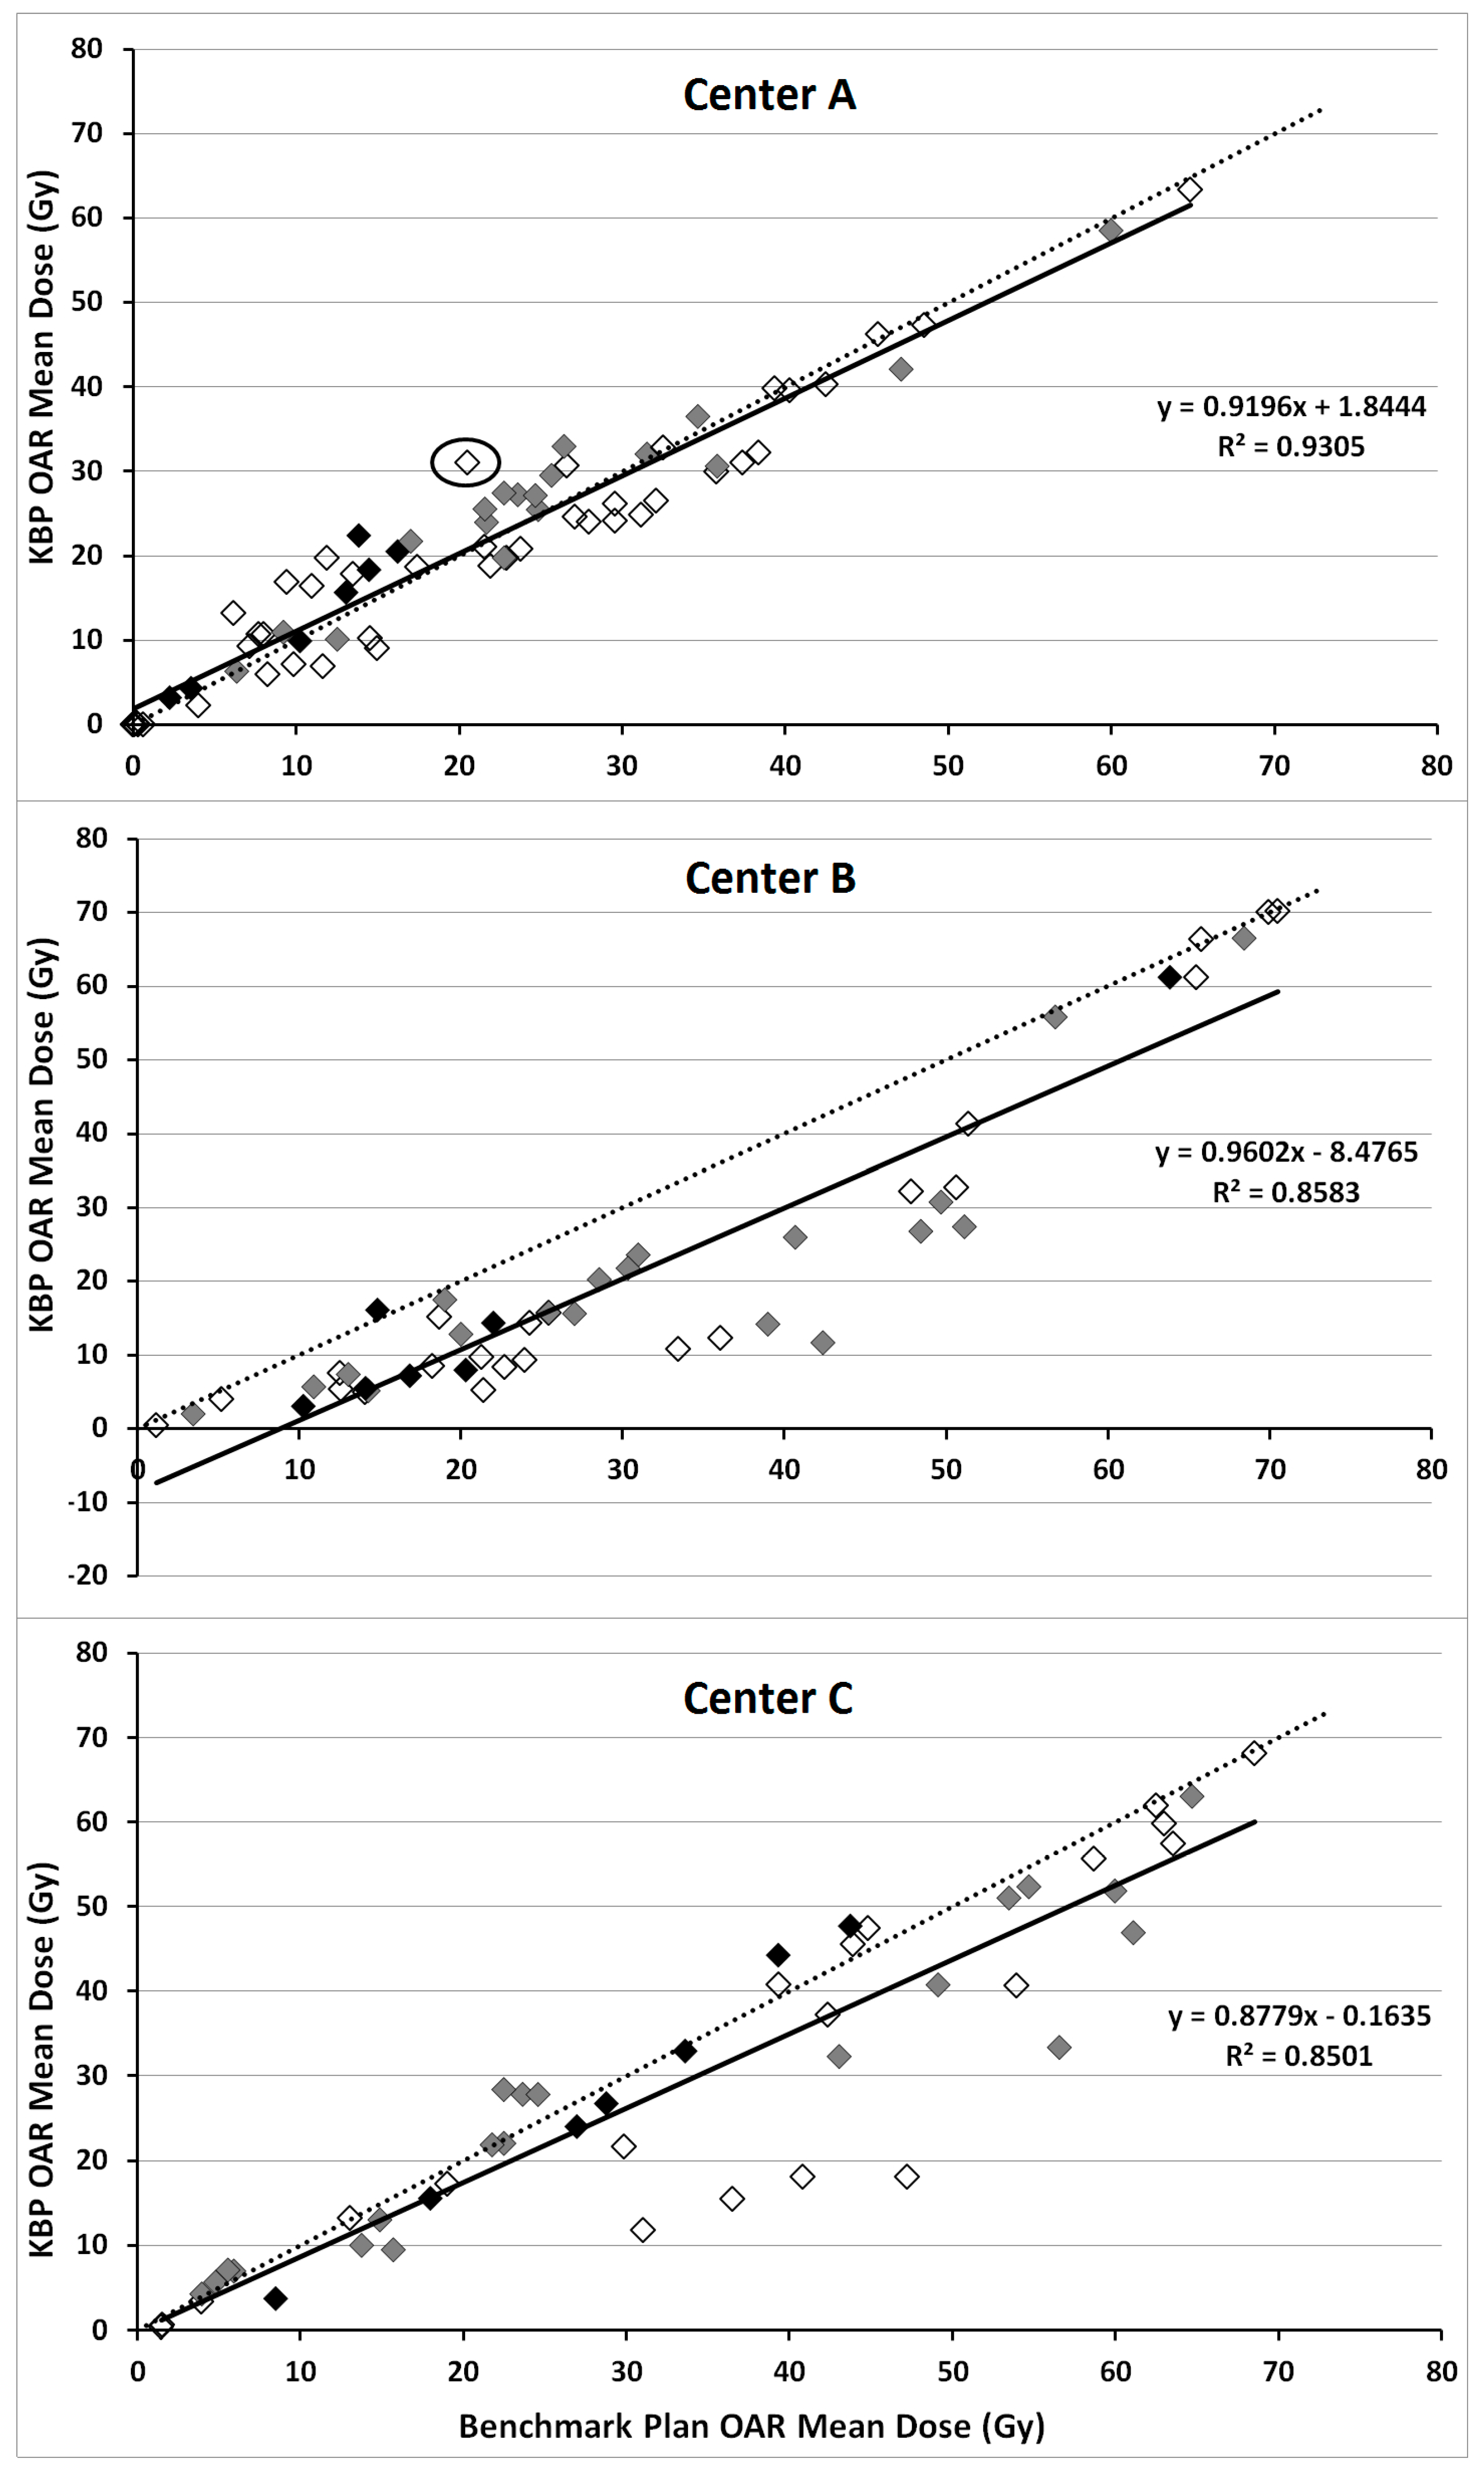
2. Results
3. Discussion
4. Conclusions
5. Materials and Methods
5.1. Treatment Planning for Populating the Knowledge-Based Planning Model
5.2. External Center Treatment Planning
5.2.1. Center-A
5.2.2. Center-B
5.2.3. Center-C
5.3. Evaluation Patients
5.4. Study Endpoints
5.5. Ethical Statement
Supplementary Materials
Author Contributions
Funding
Acknowledgments
Conflicts of Interest
References
- Particle Therapy Co-Operative Group Particle therapy Facilities under Construction. 2017. Available online: https://www.ptcog.ch/index.php/facilities-under-construction (accessed on 17 November 2017).
- Nelms, B.E.; Robinson, G.; Markham, J.; Velasco, K.; Boyd, S.; Narayan, S.; Wheeler, J.; Sobczak, M.L. Variation in external beam treatment plan quality: An inter-institutional study of planners and planning systems. Pract. Radiat. Oncol. 2012, 2, 296–305. [Google Scholar] [CrossRef] [PubMed]
- McDonald, M.W.; Liu, Y.; Moore, M.G.; Johnstone, P.A.S. Acute toxicity in comprehensive head and neck radiation for nasopharynx and paranasal sinus cancers: Cohort comparison of 3D conformal proton therapy and intensity modulated radiation therapy. Radiat. Oncol. 2016, 11, 1–10. [Google Scholar] [CrossRef] [PubMed]
- Romesser, P.B.; Cahlon, O.; Scher, E.; Zhou, Y.; Berry, S.L.; Rybkin, A.; Sine, K.M.; Tang, S.; Sherman, E.J.; Wong, R.; et al. Proton beam radiation therapy results in significantly reduced toxicity compared with intensity-modulated radiation therapy for head and neck tumors that require ipsilateral radiation. Radiother. Oncol. 2016, 118, 286–92. [Google Scholar] [CrossRef] [PubMed]
- Holliday, E.B.; Garden, A.S.; Rosenthal, D.I.; Fuller, C.D.; Morrison, W.H.; Gunn, G.B.; Phan, J.; Beadle, B.M.; Zhu, X.R.; Zhang, X.; et al. Proton therapy reduces treatment-related toxicities for patients with nasopharyngeal cancer: A case-match control study of intensity-modulated proton therapy and intensity-modulated photon therapy. Int. J. Part. Ther. 2015, 2, 19–28. [Google Scholar] [CrossRef]
- Blanchard, P.; Garden, A.S.; Gunn, G.B.; Rosenthal, D.I.; Morrison, W.H.; Hernandez, M.; Crutison, J.; Lee, J.J.; Ye, R.; Fuller, C.D.; et al. Head and neck radiotherapy Intensity-modulated proton beam therapy (IMPT) versus intensity-modulated photon therapy (IMRT) for patients with oropharynx cancer—A case matched analysis. Radiother. Oncol. 2016, 120, 48–55. [Google Scholar] [CrossRef] [PubMed]
- Quan, E.M.; Chang, J.Y.; Liao, Z.; Xia, T.; Yuan, Z.; Liu, H.; Li, X.; Wages, C.A.; Mohan, R.; Zhang, X. Automated volumetric modulated arc therapy treatment planning for stage III lung cancer: How does it compare with intensity-modulated radio therapy? Int. J. Radiat. Oncol. 2012, 84, e69–e76. [Google Scholar] [CrossRef] [PubMed]
- Wu, B.; Ricchetti, F.; Sanguineti, G.; Kazhdan, M.; Simari, P.; Jacques, R.; Taylor, R.; McNutt, T. Data-driven approach to generating achievable dose-volume histogram objectives in intensity-modulated radiotherapy planning. Int. J. Radiat. Oncol. Biol. Phys. 2011, 79, 1241–1247. [Google Scholar] [CrossRef] [PubMed]
- Wu, B.; Pang, D.; Simari, P.; Taylor, R.; Sanguineti, G.; McNutt, T. Using overlap volume histogram and IMRT plan data to guide and automate VMAT planning: A head-and-neck case study. Med. Phys. 2013, 40, 021714. [Google Scholar] [CrossRef] [PubMed]
- Breedveld, S.; Storchi, P.R.M.; Voet, P.W.J.; Heijmen, B.J.M. ICycle: Integrated, multicriterial beam angle, and profile optimization for generation of coplanar and noncoplanar IMRT plans. Med. Phys. 2012, 39, 951–963. [Google Scholar] [CrossRef] [PubMed]
- Tol, J.P.; Delaney, A.R.; Dahele, M.; Slotman, B.J.; Verbakel, W.F.A.R. Evaluation of a knowledge-based planning solution for head and neck cancer. Int. J. Radiat. Oncol. Biol. Phys. 2015, 91, 612–620. [Google Scholar] [CrossRef] [PubMed]
- Fogliata, A.; Belosi, F.; Clivio, A.; Navarria, P.; Nicolini, G.; Scorsetti, M.; Vanetti, E.; Cozzi, L. On the pre-clinical validation of a commercial model-based optimisation engine: Application to volumetric modulated arc therapy for patients with lung or prostate cancer. Radiother. Oncol. 2014, 113, 385–391. [Google Scholar] [CrossRef] [PubMed]
- Tol, J.P.; Dahele, M.; Delaney, A.R.; Slotman, B.J.; Verbakel, W.F.A.R. Can knowledge-based DVH predictions be used for automated, individualized quality assurance of radiotherapy treatment plans? Radiat. Oncol. 2015, 10. [Google Scholar] [CrossRef] [PubMed]
- Li, N.; Carmona, R.; Sirak, I.; Kasaova, L.; Followill, D.; Michalski, J.; Bosch, W.; Straube, W.; Mell, L.K.; Moore, K.L. Highly Efficient Training, Refinement, and Validation of a Knowledge-based planning quality-control system for radiation therapy clinical trials. Int. J. Radiat. Oncol. Biol. Phys. 2017, 97, 164–172. [Google Scholar] [CrossRef] [PubMed]
- Delaney, A.R.; Dahele, M.; Tol, J.P.; Kuijper, I.T.; Slotman, B.J.; Verbakel, W.F.A.R. Using a knowledge-based planning solution to select patients for proton therapy. Radiother. Oncol. 2017, 124, 263–270. [Google Scholar] [CrossRef] [PubMed]
- Fogliata, A.; Wang, P.-M.; Belosi, F.; Clivio, A.; Nicolini, G.; Vanetti, E.; Cozzi, L. Assessment of a model based optimization engine for volumetric modulated arc therapy for patients with advanced hepatocellular cancer. Radiat. Oncol. 2014, 9, 236. [Google Scholar] [CrossRef] [PubMed]
- Gu, W.; O’Connor, D.; Nguyen, D.; Yu, V.Y.; Ruan, D.; Sheng, K. Integrated beam angle and scanning spot optimization for intensity modulated proton therapy. Int. J. Radiat. Oncol. 2017, 99, S107. [Google Scholar] [CrossRef]
- Cao, W.; Lim, G.J.; Li, Y.; Zhu, X.R.; Zhang, X. Improved beam angle arrangement in intensity modulated proton therapy treatment planning for localized prostate cancer. Cancer 2015, 7, 574–584. [Google Scholar] [CrossRef] [PubMed]
- Michiels, S.; Barragán, A.M.; Souris, K.; Poels, K.; Crijns, W.; Lee, J.A.; Sterpin, E.; Nuyts, S.; Haustermans, K.; Depuydt, T. Patient-specific bolus for range shifter air gap reduction in intensity-modulated proton therapy of head-and-neck cancer studied with Monte Carlo based plan optimization. Radiother. Oncol. 2017, 128, 161–166. [Google Scholar] [CrossRef] [PubMed]
- Widesott, L.; Lomax, A.J.; Schwarz, M. Is there a single spot size and grid for intensity modulated proton therapy? Simulation of head and neck, prostate and mesothelioma cases. Med. Phys. 2012, 39, 1298–1308. [Google Scholar] [CrossRef] [PubMed]
- Langner, U.W.; Eley, J.G.; Dong, L.; Langen, K. Comparison of multi-institutional Varian ProBeam pencil beam scanning proton beam commissioning data. J. Appl. Clin. Med. Phys. 2017, 18, 96–107. [Google Scholar] [CrossRef] [PubMed]
- Delaney, A.R.; Tol, J.P.; Dahele, M.; Cuijpers, J.; Slotman, B.J.; Verbakel, W.F.A.R. Effect of dosimetric outliers on the performance of a commercial knowledge-based planning solution. Int. J. Radiat. Oncol. Biol. Phys. 2016, 94, 469–477. [Google Scholar] [CrossRef] [PubMed]
- Hussein, M.; South, C.P.; Barry, M.A.; Adams, E.J.; Jordan, T.J.; Stewart, A.J.; Nisbet, A. Clinical validation and benchmarking of knowledge-based IMRT and VMAT treatment planning in pelvic anatomy. Radiother. Oncol. 2016, 120, 473–479. [Google Scholar] [CrossRef] [PubMed]
- Hall, D.C.; Trofimov, A.V.; Winey, B.; Paganetti, H. A Geometric knowledge-based model to quickly predict the patient-specific benefits of proton therapy in clival chordoma patients. Int. J. Radiat. Oncol. 2016, 96, S81–S82. [Google Scholar] [CrossRef]
- Bijman, R.G.; Breedveld, S.; Arts, T.; Astreinidou, E.; de Jong, M.A.; Granton, P.V.; Petit, S.F.; Hoogeman, M.S. Impact of model and dose uncertainty on model-based selection of oropharyngeal cancer patients for proton therapy. Acta Oncol. 2017, 56, 1444–1450. [Google Scholar] [CrossRef] [PubMed]
- Hennings, F.; Lomax, A.; Pica, A.; Weber, D.C.; Hrbacek, J. Automated treatment planning system for uveal melanomas treated with proton therapy: A proof of concept analysis. Int. J. Radiat. Oncol. 2018, 5, 1–16. [Google Scholar] [CrossRef] [PubMed]
- Liao, Z.; Lee, J.J.; Komaki, R.; Gomez, D.R.; O’Reilly, M.S.; Fossella, F.V.; Blumenschein, G.R.; Heymach, J.V.; Vaporciyan, A.A.; Swisher, S.G.; et al. Bayesian adaptive randomization trial of passive scattering proton therapy and intensity-modulated photon radiotherapy for locally advanced non–small-cell lung cancer. J. Clin. Oncol. 2018, 36, 1813–1822. [Google Scholar] [CrossRef] [PubMed]
- Paganetti, H.; Niemierko, A.; Ancukiewicz, M.; Gerweck, L.E.; Goitein, M.; Loeffler, J.S.; Suit, H.D. Relative biological effectiveness ({RBE}) values for proton beam therapy. Int. J. Rad. Oncol. Biol. Phys. 2002, 53, 407–421. [Google Scholar] [CrossRef]
- Tol, J.P.; Doornaert, P.; Witte, B.I.; Dahele, M.; Slotman, B.J.; Verbakel, W.F.A.R. A longitudinal evaluation of improvements in radiotherapy treatment plan quality for head and neck cancer patients. Radiother. Oncol. 2016, 119, 337–343. [Google Scholar] [CrossRef] [PubMed]
- Christianen, M.E.M. C.; Langendijk, J.A.; Westerlaan, H.E.; van de Water, T.A.; Bijl, H.P. Delineation of organs at risk involved in swallowing for radiotherapy treatment planning. Radiother. Oncol. 2011, 101, 394–402. [Google Scholar] [CrossRef] [PubMed]
- Barten, D.L.J.; Tol, J.P.; Dahele, M.; Slotman, B.J.; Verbakel, W.F. Comparison of organ-at-risk sparing and plan robustness for spot-scanning proton therapy and volumetric modulated arc photon therapy in head-and-neck cancer. Med. Phys. 2015, 42, 6589–6598. [Google Scholar] [CrossRef] [PubMed]
- Tol, J.P.; Dahele, M.; Doornaert, P.; Slotman, B.J.; Verbakel, W.F.A.R. Toward optimal organ at risk sparing in complex volumetric modulated arc therapy: An exponential trade-off with target volume dose homogeneity. Med. Phys. 2014, 41, 021722. [Google Scholar] [CrossRef] [PubMed]


| Center A | Center B | Center C | ||||
|---|---|---|---|---|---|---|
| PTVs | Benchmark | KBP | Benchmark | KBP | Benchmark | KBP |
| PTVB D95 (%) | 100 ± 0 | 99.8 ± 0.6 | 97.5 ± 1.2 | 97.6 ± 0.4 | 97.8 ± 0.5 | 98 ± 0.3 |
| (100–100) | (98.36–100) | (95–98.4) | (97.3–98.3) | (97.2–98.6) | (97.6–98.6) | |
| PTVB V95 (%) | 100 ± 0 | 99.8 ± 0.5 | 99.5 ± 0.4 | 99.1 ± 0.2 * | 99.7 ± 0.3 | 99.6 ± 0.4 |
| (100–100) | (98.7–100) | (99–100) | (99–99.5) | (99.2–100) | (99–100) | |
| PTVB MaxDose (Gy) | 75.4 ± 0.9 | 75.9 ± 0.9 | 74.7 ± 1.7 | 77.7 ± 1.4 * | 74.5 ± 1.2 | 75.8 ± 1.8 |
| (74.2–77) | (75.2–77.5) | (72.2–77.6) | (75.1–79.8) | (72.7–76.2) | (73.9–78.9) | |
| PTVB MinDose (Gy) | 66 ± 2.3 | 64.9 ± 2.8 * | 62.2 ± 2 | 56.5 ± 4 * | 62.1 ± 2.3 | 60.5 ± 4.8 |
| (62–68.7) | (60–67.7) | (59.6–65.2) | (52–62.9) | (58.9–64.7) | (53–65.8) | |
| HIB (%) | 6.2 ± 1 | 7.6 ± 1.5 | 5.3 ± 1.2 | 7 ± 0.7 * | 5.7 ± 1.3 | 5.8 ± 1.3 |
| (4.9–7.5) | (6.2–10.3) | (3.9–7.2) | (6–8.1) | (3.6–7.2) | (4.9–8.4) | |
| PTVE1 D95 (%) | 100.6 ± 0.9 | 101.3 ± 1 | 99.5 ± 0 | 98.1 ± 0 | 101.2 ± 2.2 | 101.1 ± 1.8 |
| (99.4–101.8) | (100–102.5) | (99.5–99.5) | (98.1–98.1) | (99.1–104.8) | (98.7–103.4) | |
| PTVE1 V95 (%) | 99.8 ± 0.2 | 99.6 ± 0.3 | 100 ± 0 | 99.3 ± 0 | 99.6 ± 0.3 | 99.6 ± 0.3 |
| (99.5–99.9) | (99.2–99.9) | (100–100) | (99.3–99.3) | (99.2–100) | (99.2–100) | |
| HIE1 (%) | 20.7 ± 2.6 | 21.3 ± 2.4 | 10.2 ± 0 | 10.7 ± 0 | 18 ± 2.7 | 17.4 ± 2 |
| (15.4–22.8) | (16.1–23.1) | (10.2–10.2) | (10.7–10.7) | (13.7–20.9) | (15.4–20) | |
| PTVE2 D95 (%) | 99.9 ± 1.5 | 100.7 ± 1.7 | 98.8 ± 0.4 | 98 ± 0.7 * | 98.7 ± 1.1 | 98.5 ± 0.8 |
| (97.2–101.9) | (98.3–103) | (98.1–99.3) | (97.1–98.9) | (97.4–100.4) | (97.6–99.9) | |
| PTVE2 V95 (%) | 99.4 ± 1 | 99.8 ± 0.1 | 99.7 ± 0.2 | 98.9 ± 0.6 * | 99.2 ± 0.7 | 99.2 ± 0.6 |
| (97.1–100) | (99.7–99.9) | (99.3–99.9) | (97.8–99.5) | (98.3–99.9) | (98.4–99.9) | |
| HIE2 (%) | 26.4 ± 3.6 | 24.3 ± 5.5 | 22.7 ± 2 | 22.5 ± 1.7 | 25.6 ± 8.8 | 24.1 ± 8.4 |
| (20.3–29.3) | (15.8–31.2) | (20–25.1) | (19.4–24.7) | (7.7–32.8) | (13–32.8) | |
| OAR Mean Doses (Gy) | ||||||
| Contra. Parotid | 16.5 ± 7.3 | 17.7 ± 8.7 | 20.5 ± 14.4 | 12.3 ± 8.7 * | 14.07 ± 7.55 | 13.2 ± 8.7 |
| (6.4–25.7) | (6.3–29.5) | (3.5–48.4) | (2–26.8) | (4–23.6) | (4.3–27.8) | |
| Ipsi. Parotid | 25.1 ± 3.2 | 28 ± 3.3 * | 31.2 ± 11.6 | 20.8 ± 7.6 * | 28.9 ± 23 | 27.3 ± 17.5 |
| (21.7–31.5) | (24–33) | (13.1–49.7) | (7.4–30.8) | (5.6–61.1) | (7–51.8) | |
| Contra. Sub | 45.1 ± 14.9 | 42.5 ± 15.6 | 51.5 ± 11.8 | 35.2 ± 24.8 * | 53.6 ± 7.3 | 45.5 ± 12.1 * |
| (28–64.9) | (24–63.3) | (39–68.4) | (11.7–66.5) | (43.1–64.7) | (32.3–63) | |
| Ipsi. Sub | 63.1 ± 8.1 | 60 ± 7.81 | 67.9 ± 2.7 | 66.9 ± 4.2 | 64.2 ± 5.9 | 63.5 ± 6.4 |
| (47.3–68.9) | (44.4–65) | (65.5–70.5) | (61.1–70.1) | (54.4–69.9) | (52.6–68.8) | |
| Oral Cavity | 10.5 ± 5.5 | 13.5 ± 7.7 * | 23.2 ± 18.4 | 16.5 ± 20.3 * | 28.4 ± 12.2 | 27.9 ± 15.5 |
| (2.2–16.2) | (3.2–22.4) | (10.3–63.8) | (3.1–61.2) | (8.5–43.7) | (3.7–47.7) | |
| Constrictors | 40.6 ± 5.4 | 38.5 ± 6.7 | 42.2 ± 15.7 | 30.4 ± 11 | 50.1 ± 8.5 | 39.5 ± 16.7 * |
| (32.5–48.5) | (31–47.3) | (18.7–51.4) | (15.2–41.4) | (40.8–63) | (18–59.8) | |
| Esophagus | 17 ± 9.7 | 12.8 ± 9.1 * | 16.7 ± 8.3 | 7.1 ± 4.8 * | 12.4 ± 13.4 | 7.2 ± 6.3 |
| (8.3–35.8) | (5.9–30) | (1.2–25.4) | (0.4–15.8) | (1.5–31) | (0.4–13.2) | |
| Larynx | 28.5 ± 6.9 | 25.2 ± 7 * | 22.2 ± 10.8 | 9.6 ± 3.4 * | ||
| (21.6–40.3) | (18.7–39.6) | (5.2–36) | (4–14.3) | |||
| Glottis | 53.7 ± 16.3 | 50.9 ± 18.3 | ||||
| (29.9–68.5) | (21.7–68.1) | |||||
| OAR Max Doses (Gy) | ||||||
| Spinal Cord | 39 ± 5.2 | 38.8 ± 3.4 | 45 ± 3.2 | 34.4 ± 4.5 * | 40.9 ± 3.8 | 36.7 ± 8.7 |
| (28.5–42) | (34.7–43.1) | (41.9–50.7) | (27.8–38.7) | (37.5–49) | (19.1–47.5) | |
| Brainstem | 43.4 ± 7.3 | 42.5 ± 5.1 | 34.2 ± 12.6 | 27.3 ± 6.7 | 34.5 ± 15.3 | 22 ± 18.8 * |
| (34.4–53) | (33.7–48.3) | (15.8–54.2) | (18.3–36.7) | (14.8–52.4) | (0–41.5) | |
| PTVs | Center A * | Center B | Center C |
|---|---|---|---|
| D95% | ≥100% | ≥95% | |
| V95% | ≥99% | ||
| Dmax | ≤110% | ≤115% | |
| D99% | ≥93% | ≥90% | |
| D2% | ≤107% | ||
| D5% | ≤105% | ||
| Max Dose (Gy) | |||
| Spinal Cord | ≤45 | ≤45 | ≤41 |
| Spinal Cord PRV | ≤50 | ||
| Brainstem | ≤54 | ≤54 | ≤62 |
| Brain | ALARA | ≤65 | |
| Optic Nerve | ≤54 | ≤54 | ≤60 |
| Chiasm | ≤54 | ≤54 | ≤60 |
| Esophagus | ≤71.4 | ||
| Larynx | ≤71.4 | ||
| TMJoint | ≤70 | ||
| Trachea | ≤71.4 | ||
| Eye | ≤50 | ||
| Mandible-PTV | ≤70 | ||
| Mean Dose (Gy) | |||
| Parotid | <26 | <26 | <24 |
| Submandibular | <30 | <26 | |
| Oral Cavity | <20 | <30 | <45 (<35 if distal to target) |
| Pharynx | <50 | <45 | |
| Larynx | <20 | <30 | |
| Esophagus | <20 | <30 | <40 if not in PTV |
| Middle Ears | <30 | <30 | |
| Eye | <35 | ALARA | <35 |
| Glottis | <45 (<20 if distal to target) | ||
| Trachea | <40 |
© 2018 by the authors. Licensee MDPI, Basel, Switzerland. This article is an open access article distributed under the terms and conditions of the Creative Commons Attribution (CC BY) license (http://creativecommons.org/licenses/by/4.0/).
Share and Cite
Delaney, A.R.; Dong, L.; Mascia, A.; Zou, W.; Zhang, Y.; Yin, L.; Rosas, S.; Hrbacek, J.; Lomax, A.J.; Slotman, B.J.; et al. Automated Knowledge-Based Intensity-Modulated Proton Planning: An International Multicenter Benchmarking Study. Cancers 2018, 10, 420. https://doi.org/10.3390/cancers10110420
Delaney AR, Dong L, Mascia A, Zou W, Zhang Y, Yin L, Rosas S, Hrbacek J, Lomax AJ, Slotman BJ, et al. Automated Knowledge-Based Intensity-Modulated Proton Planning: An International Multicenter Benchmarking Study. Cancers. 2018; 10(11):420. https://doi.org/10.3390/cancers10110420
Chicago/Turabian StyleDelaney, Alexander R., Lei Dong, Anthony Mascia, Wei Zou, Yongbin Zhang, Lingshu Yin, Sara Rosas, Jan Hrbacek, Antony J. Lomax, Ben J. Slotman, and et al. 2018. "Automated Knowledge-Based Intensity-Modulated Proton Planning: An International Multicenter Benchmarking Study" Cancers 10, no. 11: 420. https://doi.org/10.3390/cancers10110420
APA StyleDelaney, A. R., Dong, L., Mascia, A., Zou, W., Zhang, Y., Yin, L., Rosas, S., Hrbacek, J., Lomax, A. J., Slotman, B. J., Dahele, M., & Verbakel, W. F. A. R. (2018). Automated Knowledge-Based Intensity-Modulated Proton Planning: An International Multicenter Benchmarking Study. Cancers, 10(11), 420. https://doi.org/10.3390/cancers10110420