1. Introduction
Carcinoembryonic antigen (CEA) is a polysaccharide-protein complex with a molecular weight that ranges from 180 to 220 kD, and has 28 potential N-linked glycosylation sites. CEA is primarily produced by the embryonic intestinal mucous membranes prior to birth. Thus, the concentration of CEA is usually very low in the serum of a healthy adult. However, the serum concentration of CEA can become elevated in the presence of several types of cancer, such as lung [
1,
2], breast [
3,
4], colorectal [
5,
6], or gastric [
7] cancers, as well as colon adenocarcinoma [
8]. This means that CEA can be considered a broad-spectrum biomarker for cancer diagnosis and prognosis.
A variety of immunoassay methods have been developed for detecting CEA in serum, such as enzyme-linked immunosorbent assays (ELISA) [
9], radioimmunoassays [
10], fluorescence immunoassays [
11], chemiluminescence immunoassays [
12] and amperometric immunoassays [
13]. However, a common drawback of these testing methods is that multiple washing steps are required. These repeated washing steps can give rise to increasing measuring errors, which decreases the efficiency while requiring complex instrumentation. Recently, a wash-free one-step immunoassay [
14] was developed using a centrifugal microfluidic device, which has great potential for use in clinical applications. This immunoassay method is based on the principle of centrifugal density gradient equilibrium, which takes place inside a microfluidic device. Analytes with fluorescent labels were separated from the bulk serum in one step, using the centrifugal force, through the dense medium located in the microchannels. Afterwards, the fluorescence microbeads, which aggregated at the end of microchannel, could be collected for quantitative analysis.
Following this strategy, Interleukin 6 was rapidly measured (within 15 min) in whole blood by Ulrich et al. [
14]. Chung-Yan Koh et al. accomplished the ultrasensitive detection of botulinum toxin in a 2 μL unprocessed sample in 30 min from sample to answer [
15]. These studies showed that it is possible to develop a rapid, accurate, high-throughput centrifugal microfluidic chip for the detection of CEA in serum.
In this study, chitosan, which is safe and has good biocompatibility, was used as the dense medium in the centrifugal microfluidic. When combined with ELISA testing, the CEA could be separated by the action of the centrifugal force produced by the rotation, and the concentration of CEA could be detected using a semi-quantitative fluorescence method. This enables the rapid and convenient detection of CEA in serum with high throughput.
2. Materials and Methods
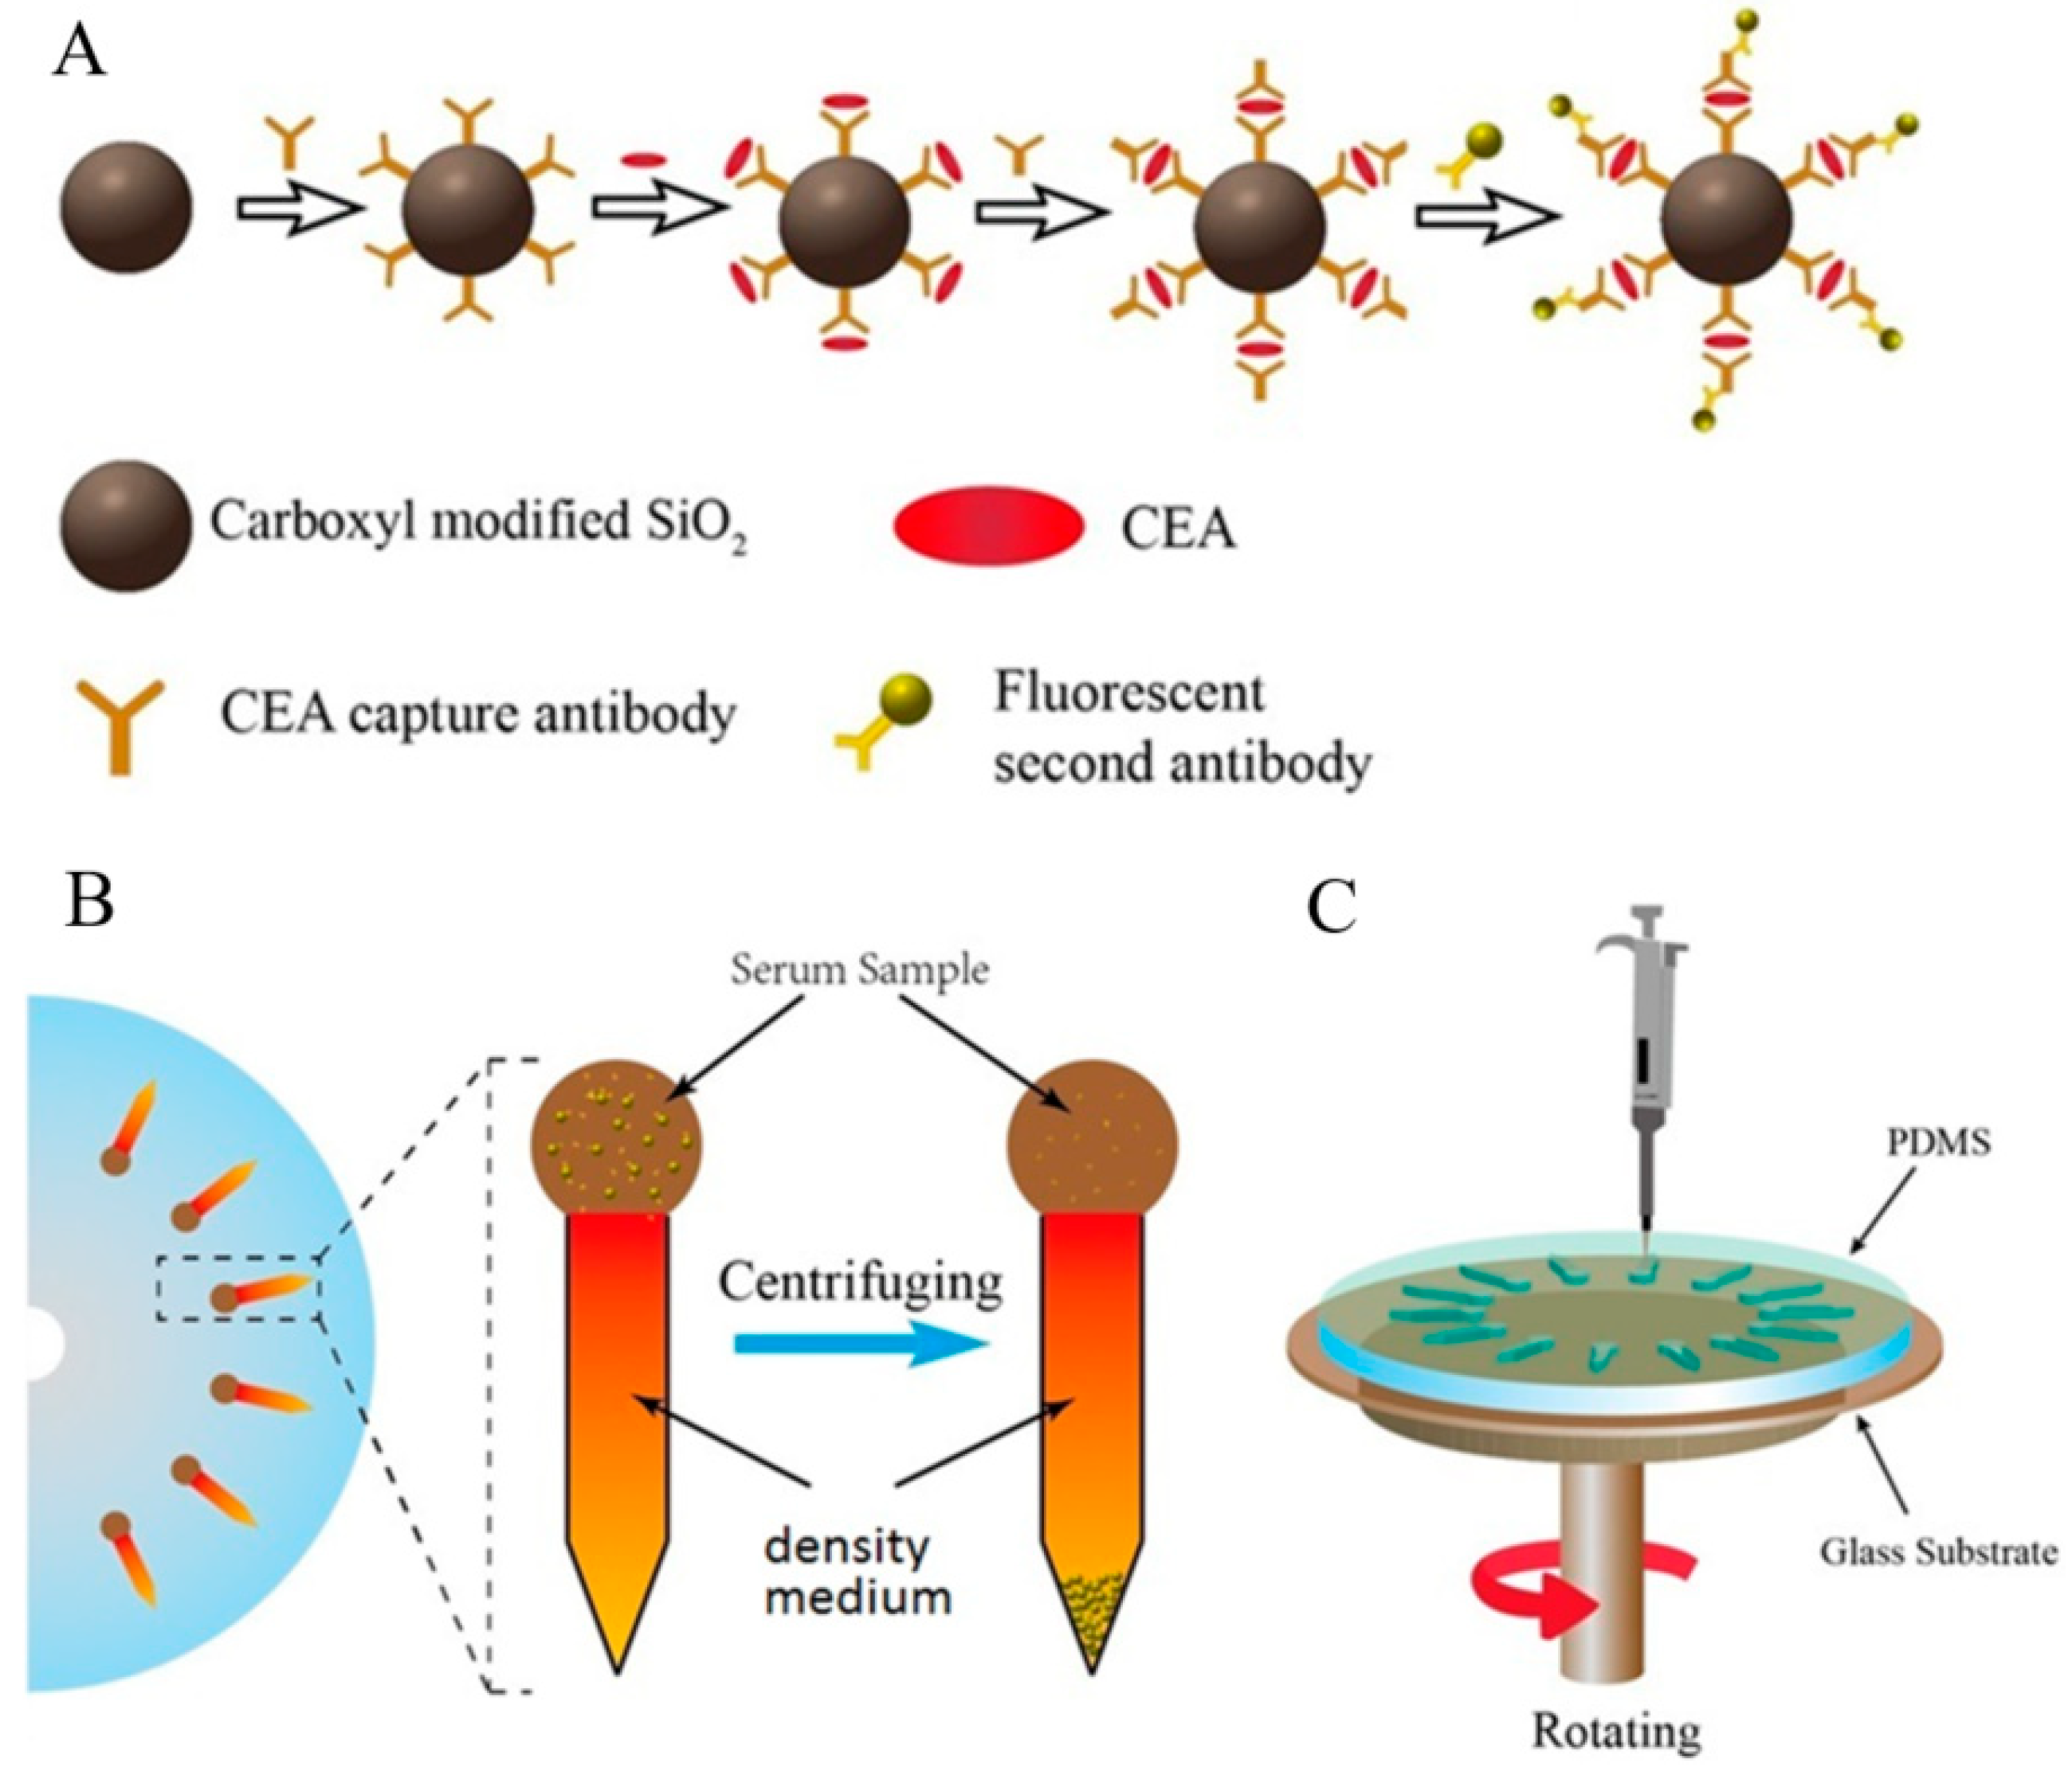
2.1. Design and Manufacture of the Centrifugal Microfluidic Device
A polydimethylsiloxane (PDMS, Sylgard 184, DowDuPont Inc., Midland, MI, USA) glass microfluidic device was designed, as shown in
Figure 1A. The height, width, and length of the individual microchannels were 150 μm, 4.2 mm and 1.5 cm, respectively. The diameter of the inlet hole was 5 mm. The distance between the center of the chip and the inlet hole was 6.5 cm. With this geometry, the micro-channels were patterned in PDMS using replica molding. The mold was prepared by spin-coating a thin layer of negative photoresist (SU-8, MicroChem, Corp., Westborough, MA, USA) onto a single side of a polished silicon wafer, which was patterned using UV exposure. Next, the micro-channel layer was obtained by pouring PDMS with a 10:1 (
w/
w) base-to-crosslinker ratio onto the mold to a thickness of approximately 3 mm. After curing the elastomer for 2 h at 80 °C, the PDMS slab was peeled from the mold, and was then punched and hermetically bonded to a coverslip by plasma oxidation.
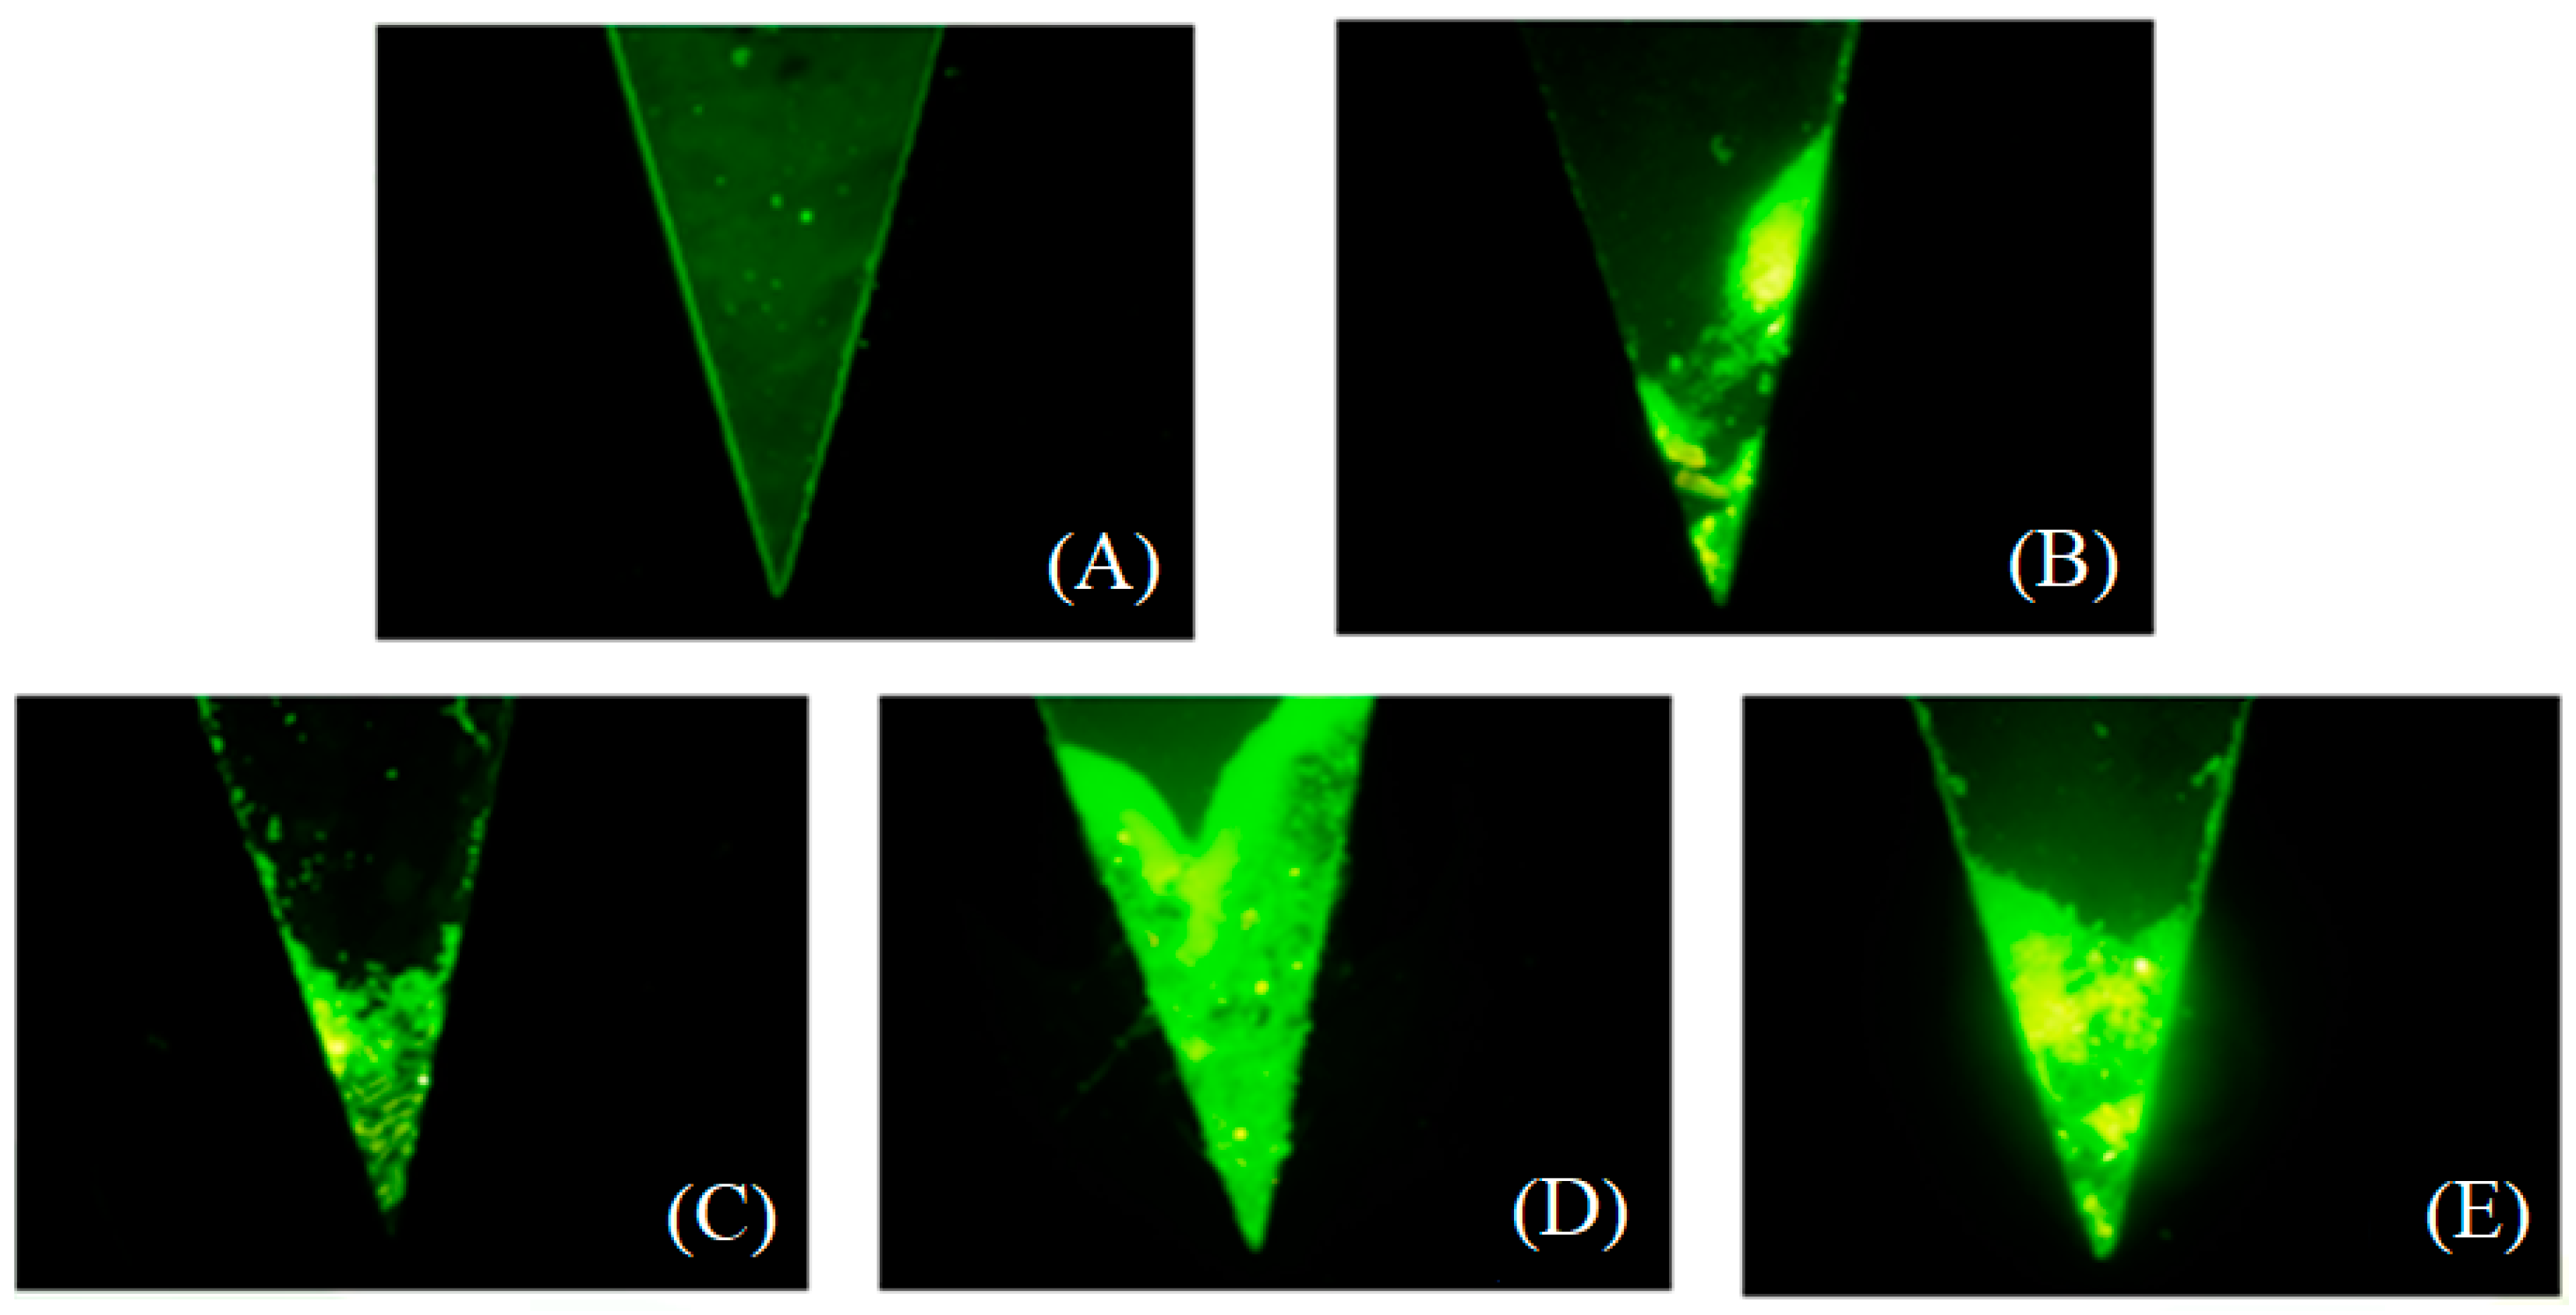
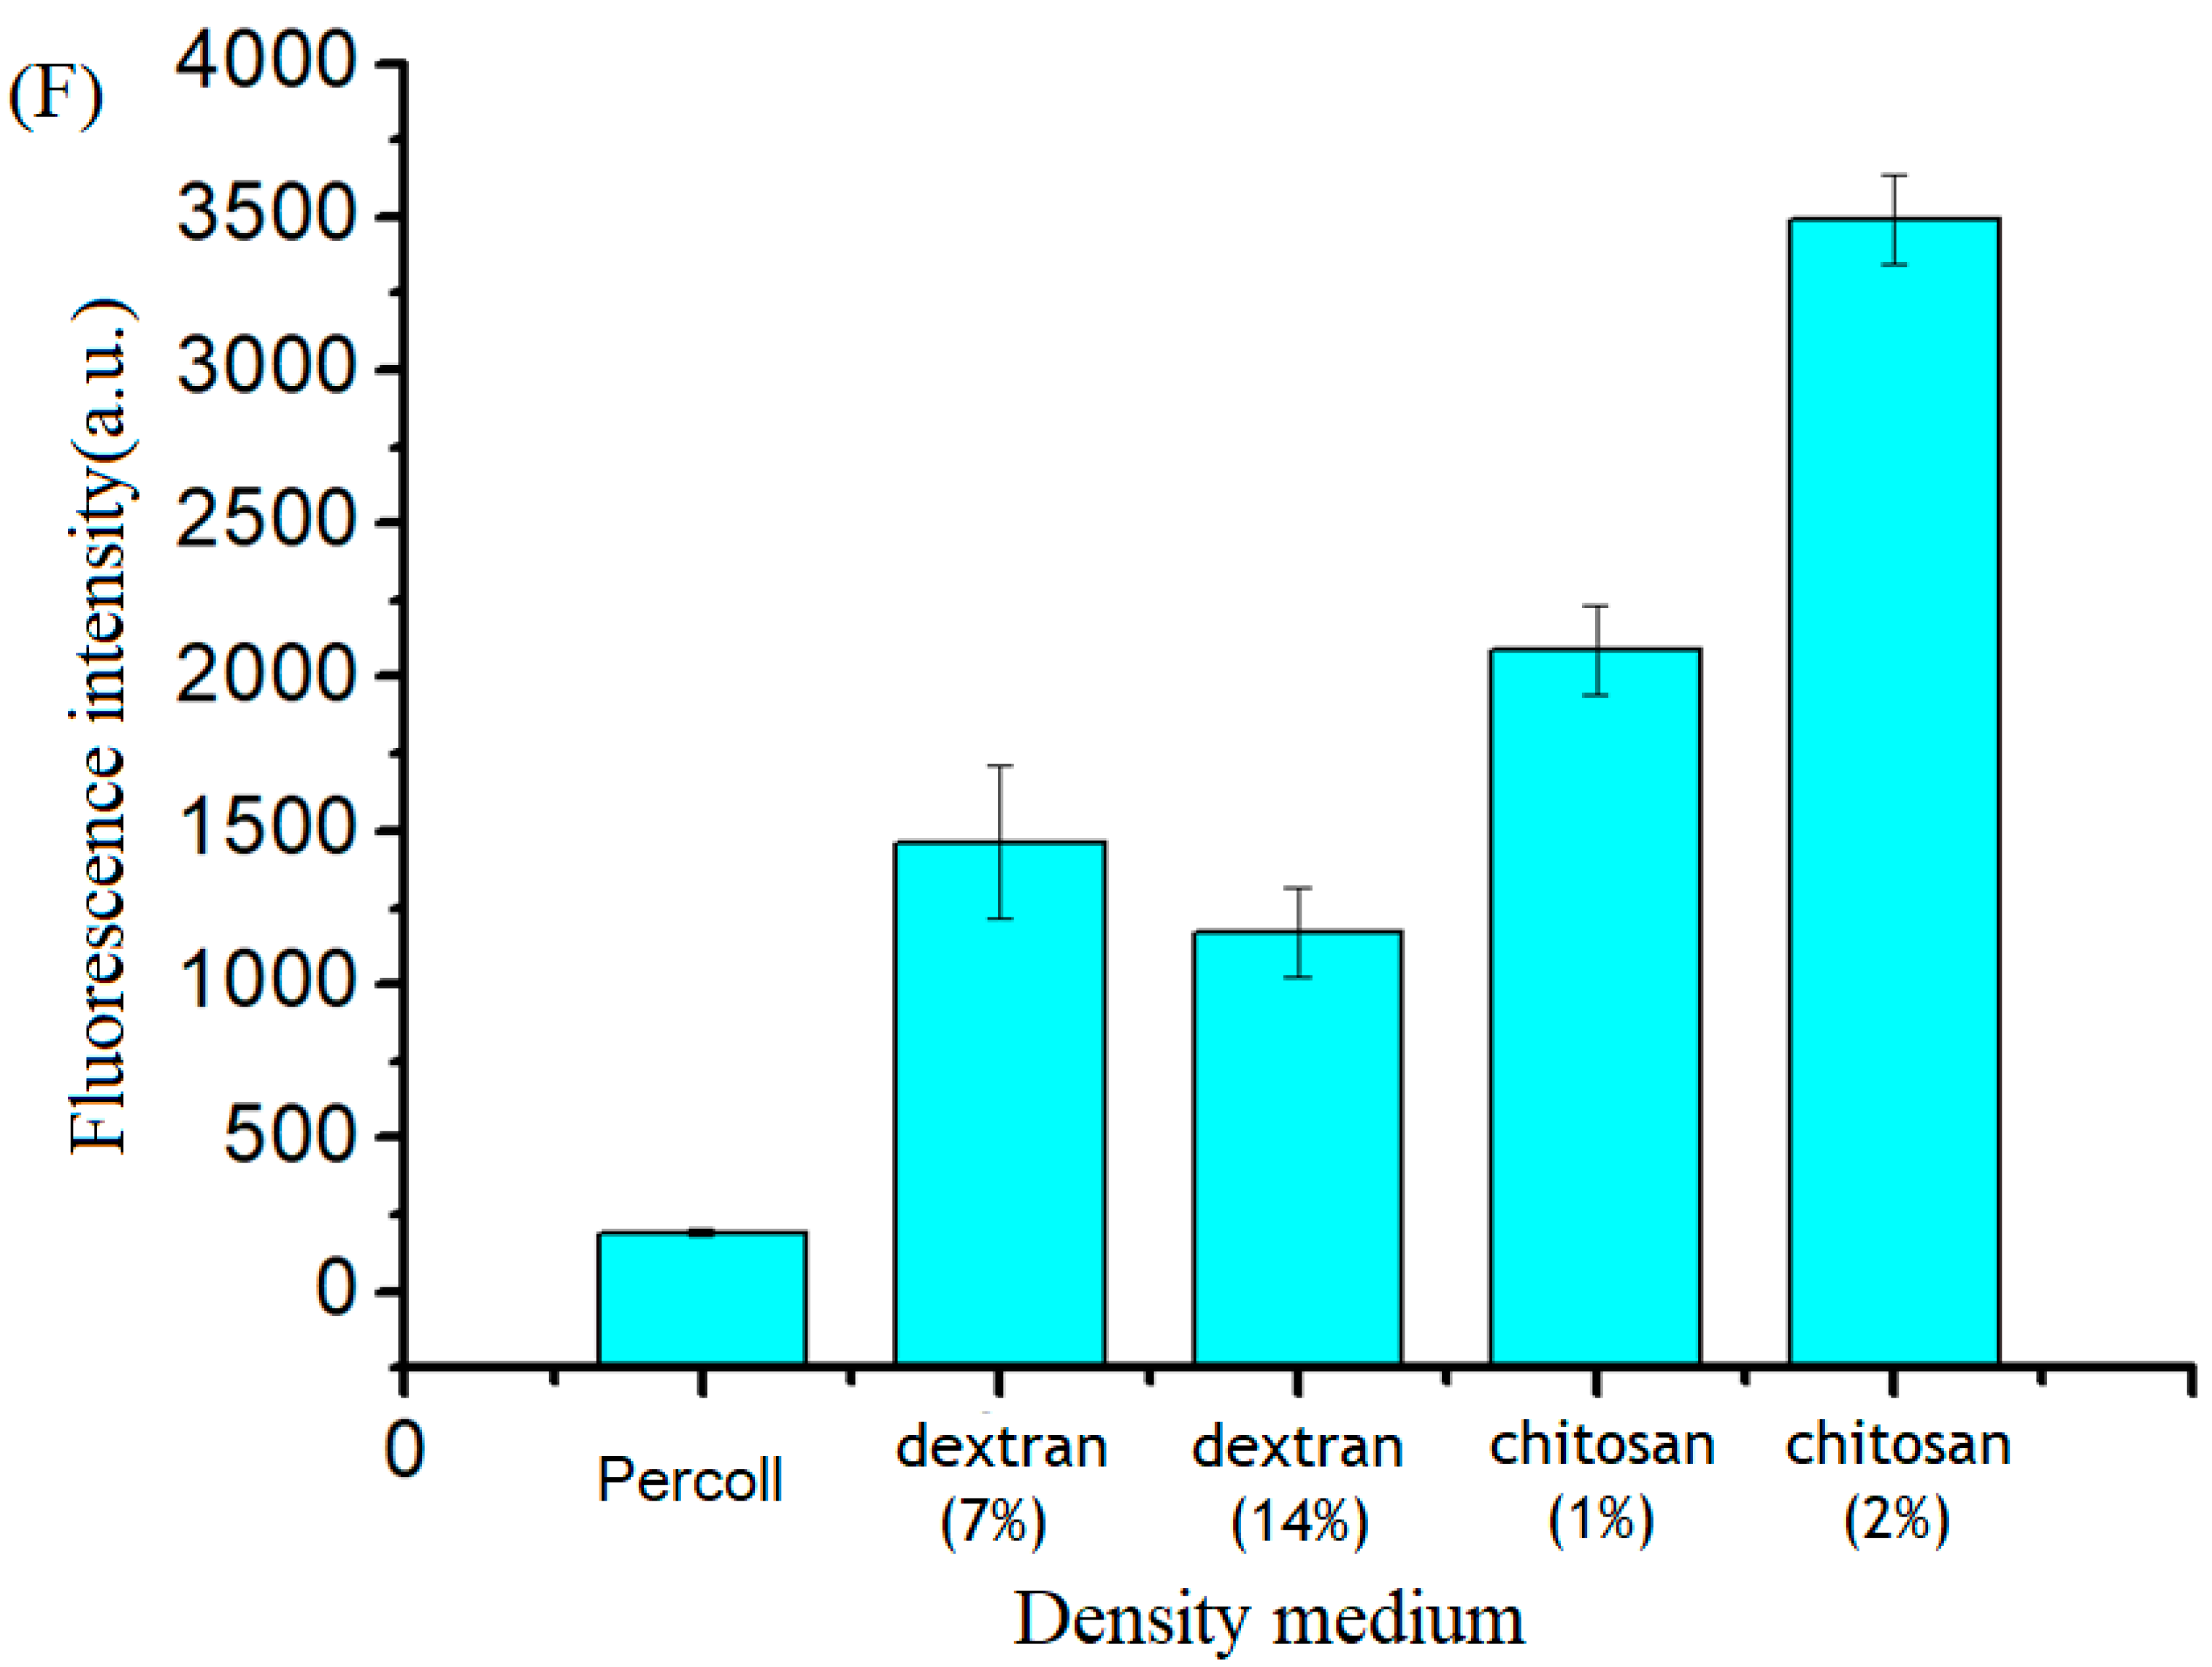
2.2. Medium Density Screening
Based on the sedimentation process, a theoretical calculation pertaining to the relationship between the density of a material and the centrifugal sedimentation has been proposed [
16]. In the case of particle transport in fluids, as in a sedimentation processes, the particles are subject to a viscous force, called drag (
Fd). It is given by:
where
ρfluid and
u are the density and velocity of the fluid relative to a particle, respectively,
Aparticle is the particle cross-sectional area, and
Cd is the drag coefficient. In the laminar flow regime (Stoke’s drag), the drag coefficient is proportional to the fluid viscosity
μ and inversely proportional to its velocity
u relative to the particle, so that for a spherical particle with radius
r, the drag force is
Based on this, materials with intermediate densities, but various viscosities were tested. The isolating effects of Percoll (Aladdin Inc., Los Angeles, CA, USA) at a concentration at 1.13 g/mL, 7% or 14% dextran (Aladdin Inc.), as well as 1% or 2% chitosan (Aladdin Inc.) were compared in this study. To start, 1.4 g of dextran and 0.01 g Poloxamer (127 F) were dissolved in 9.8 mL hot water, and then mixed with 0.2 mL 5% bovine serum albumin (BSA) solution and stored at 4 °C. Then, 2 g chitosan powder was dissolved in a 0.1 M hydrochloric acid solution for 24 h using a centrifugal mixer. Finally, the solution was used as the dense medium to be added to the centrifugal microfluidic channel.
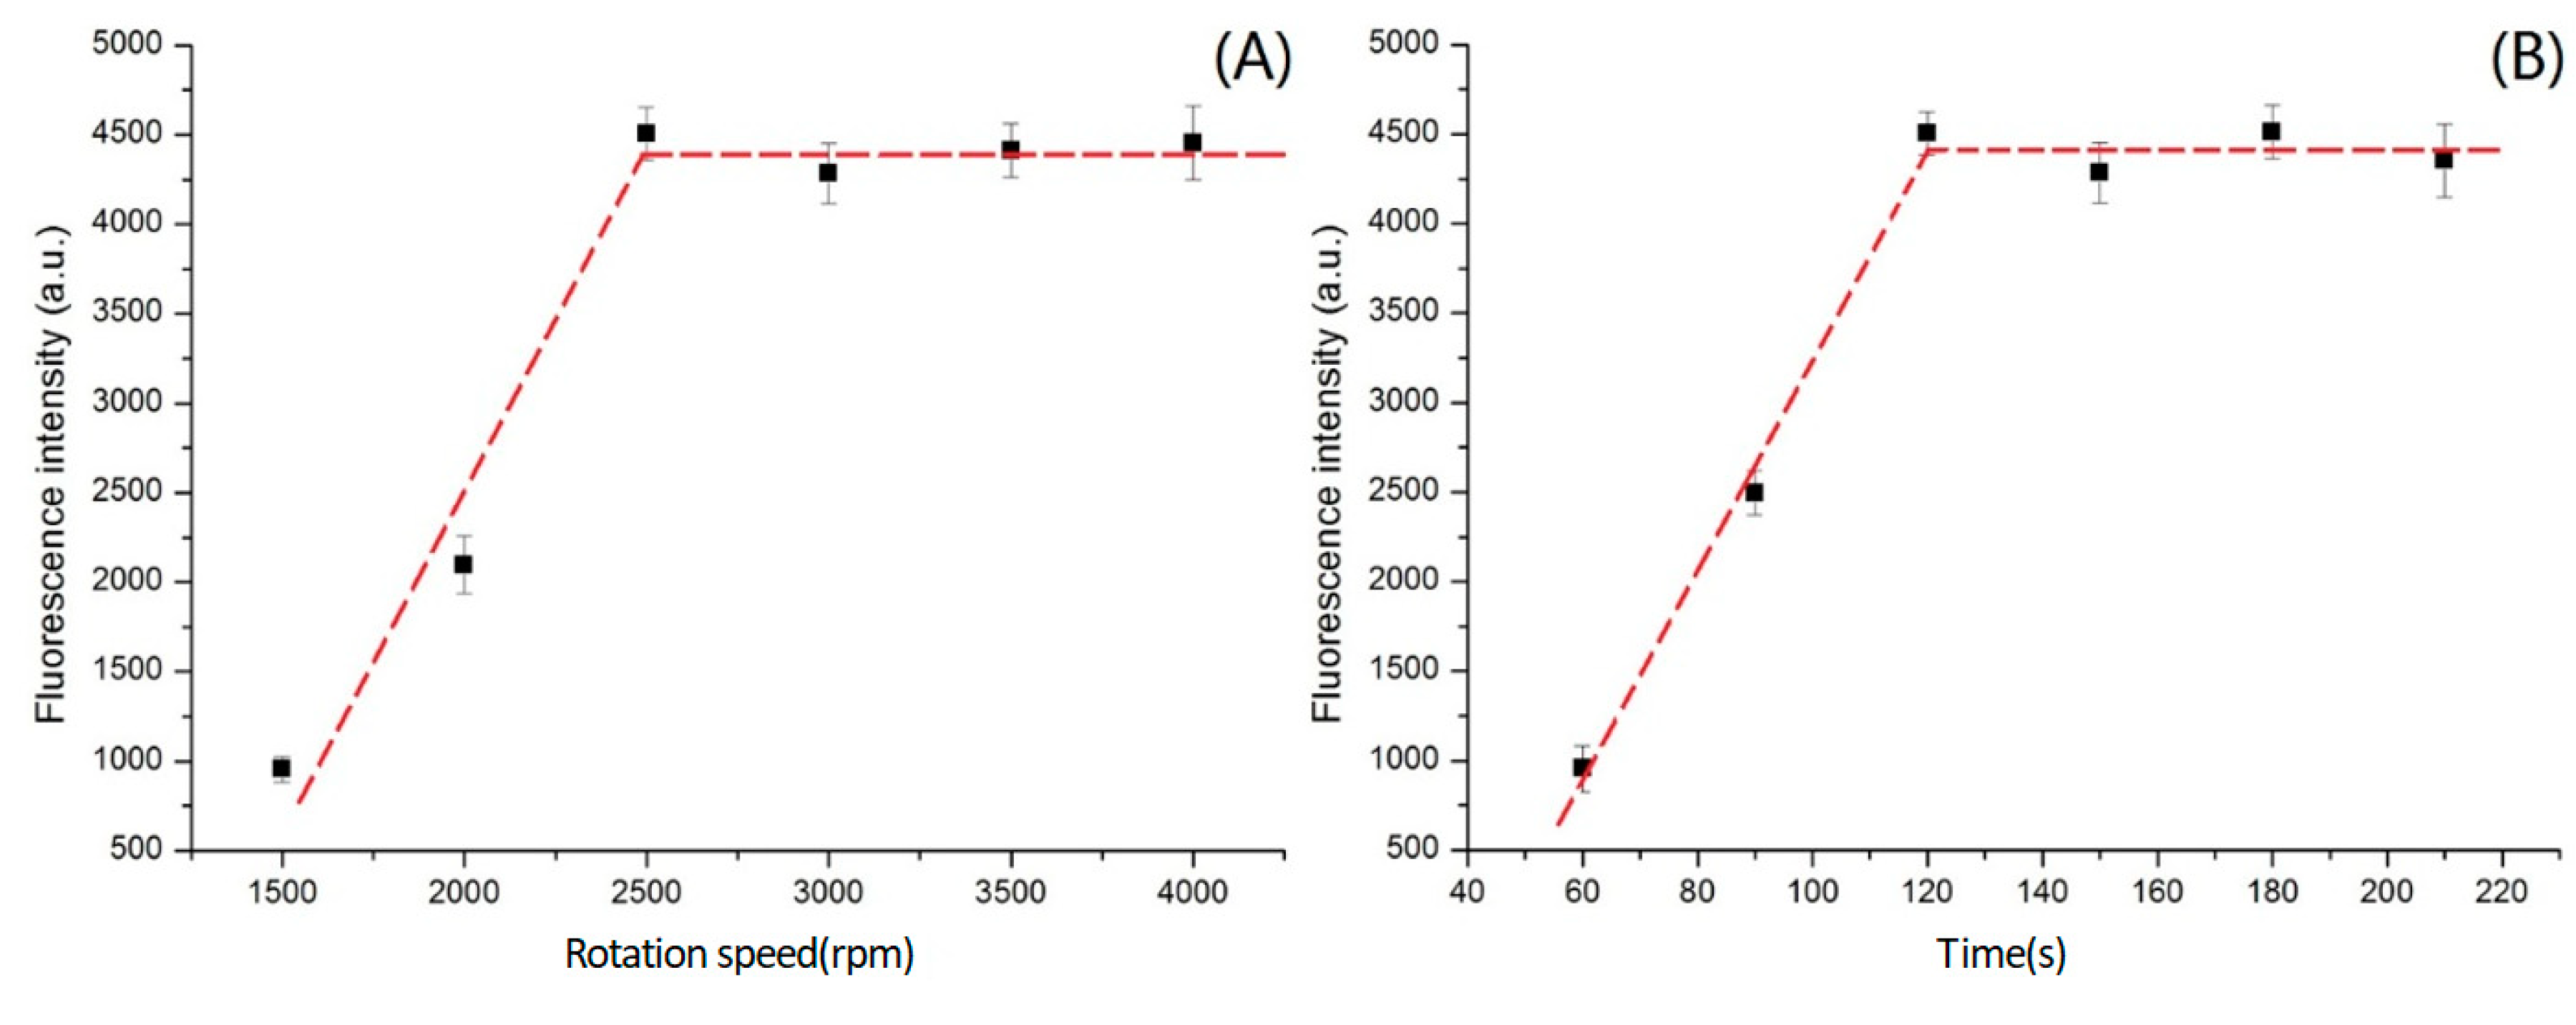
2.3. Optimization of the Rotation Speed and Spin Time
After the channels of the microfluidic device were cleaned with Phosphate Buffered Saline (PBS), 10 μL of 1% BSA (Aladdin Inc.) were added, and the devices were stored in a refrigerator at 4 °C to block the protein binding sites on the PDMS. Prior to adding 5 μL of 2% chitosan into the microfluidic device, the channels were washed five times with PBS, and stored in a 4 °C refrigerator until just before use. Then, 30 μL carboxyl-modified silica microspheres (Mozhidong Ldt., Beijing, China) were added to a 500 μL centrifuge tube, diluted to 200 μL, and then packaged with 10 μL of the primary antibodies (18.1 g/mL, Abcam, London, UK). After incubation on a table concentrator at room temperature for 2 h, and being stored at 4 °C in a refrigerator overnight, the beads with antibodies became stabilized. Then, the bead–antibody complexes were washed three times with PBS (pH 7.4), and diluted to 200 μL. Then, 5 μL BSA at a concentration at 5% was added to the solution, which was incubated at room temperature on a table concentrator for 2 h to block the remaining protein binding sites. Then, 30 ng/mL CEA samples (Abcam), with labeled primary antibodies and fluorescence labeled secondary antibodies, were successively added into microchannels with syringes or pipettes. The microfluidic device was centrifuged at various angular velocities (1000, 1500, 2000, 2500, 3000, 3500 or 4000 rpm) or at 2500 rpm for various spin durations (60, 90, 120, 150, 180 or 240 s). Afterwards, fluorescence images were obtained using a fluorescence microscope (IX71, Olympus, Tokyo, Japan) that used a high-power mercury lamp as the fluorescence light source and an exposure time of 3.5 s. After the fluorescence images were obtained, the fluorescence intensity values, with the background subtracted, were read by ImageJ software (version 2.1, National Institutes of Health, Bethesda, MD, USA). Then, statistical analyses were performed based on the particular requirements.
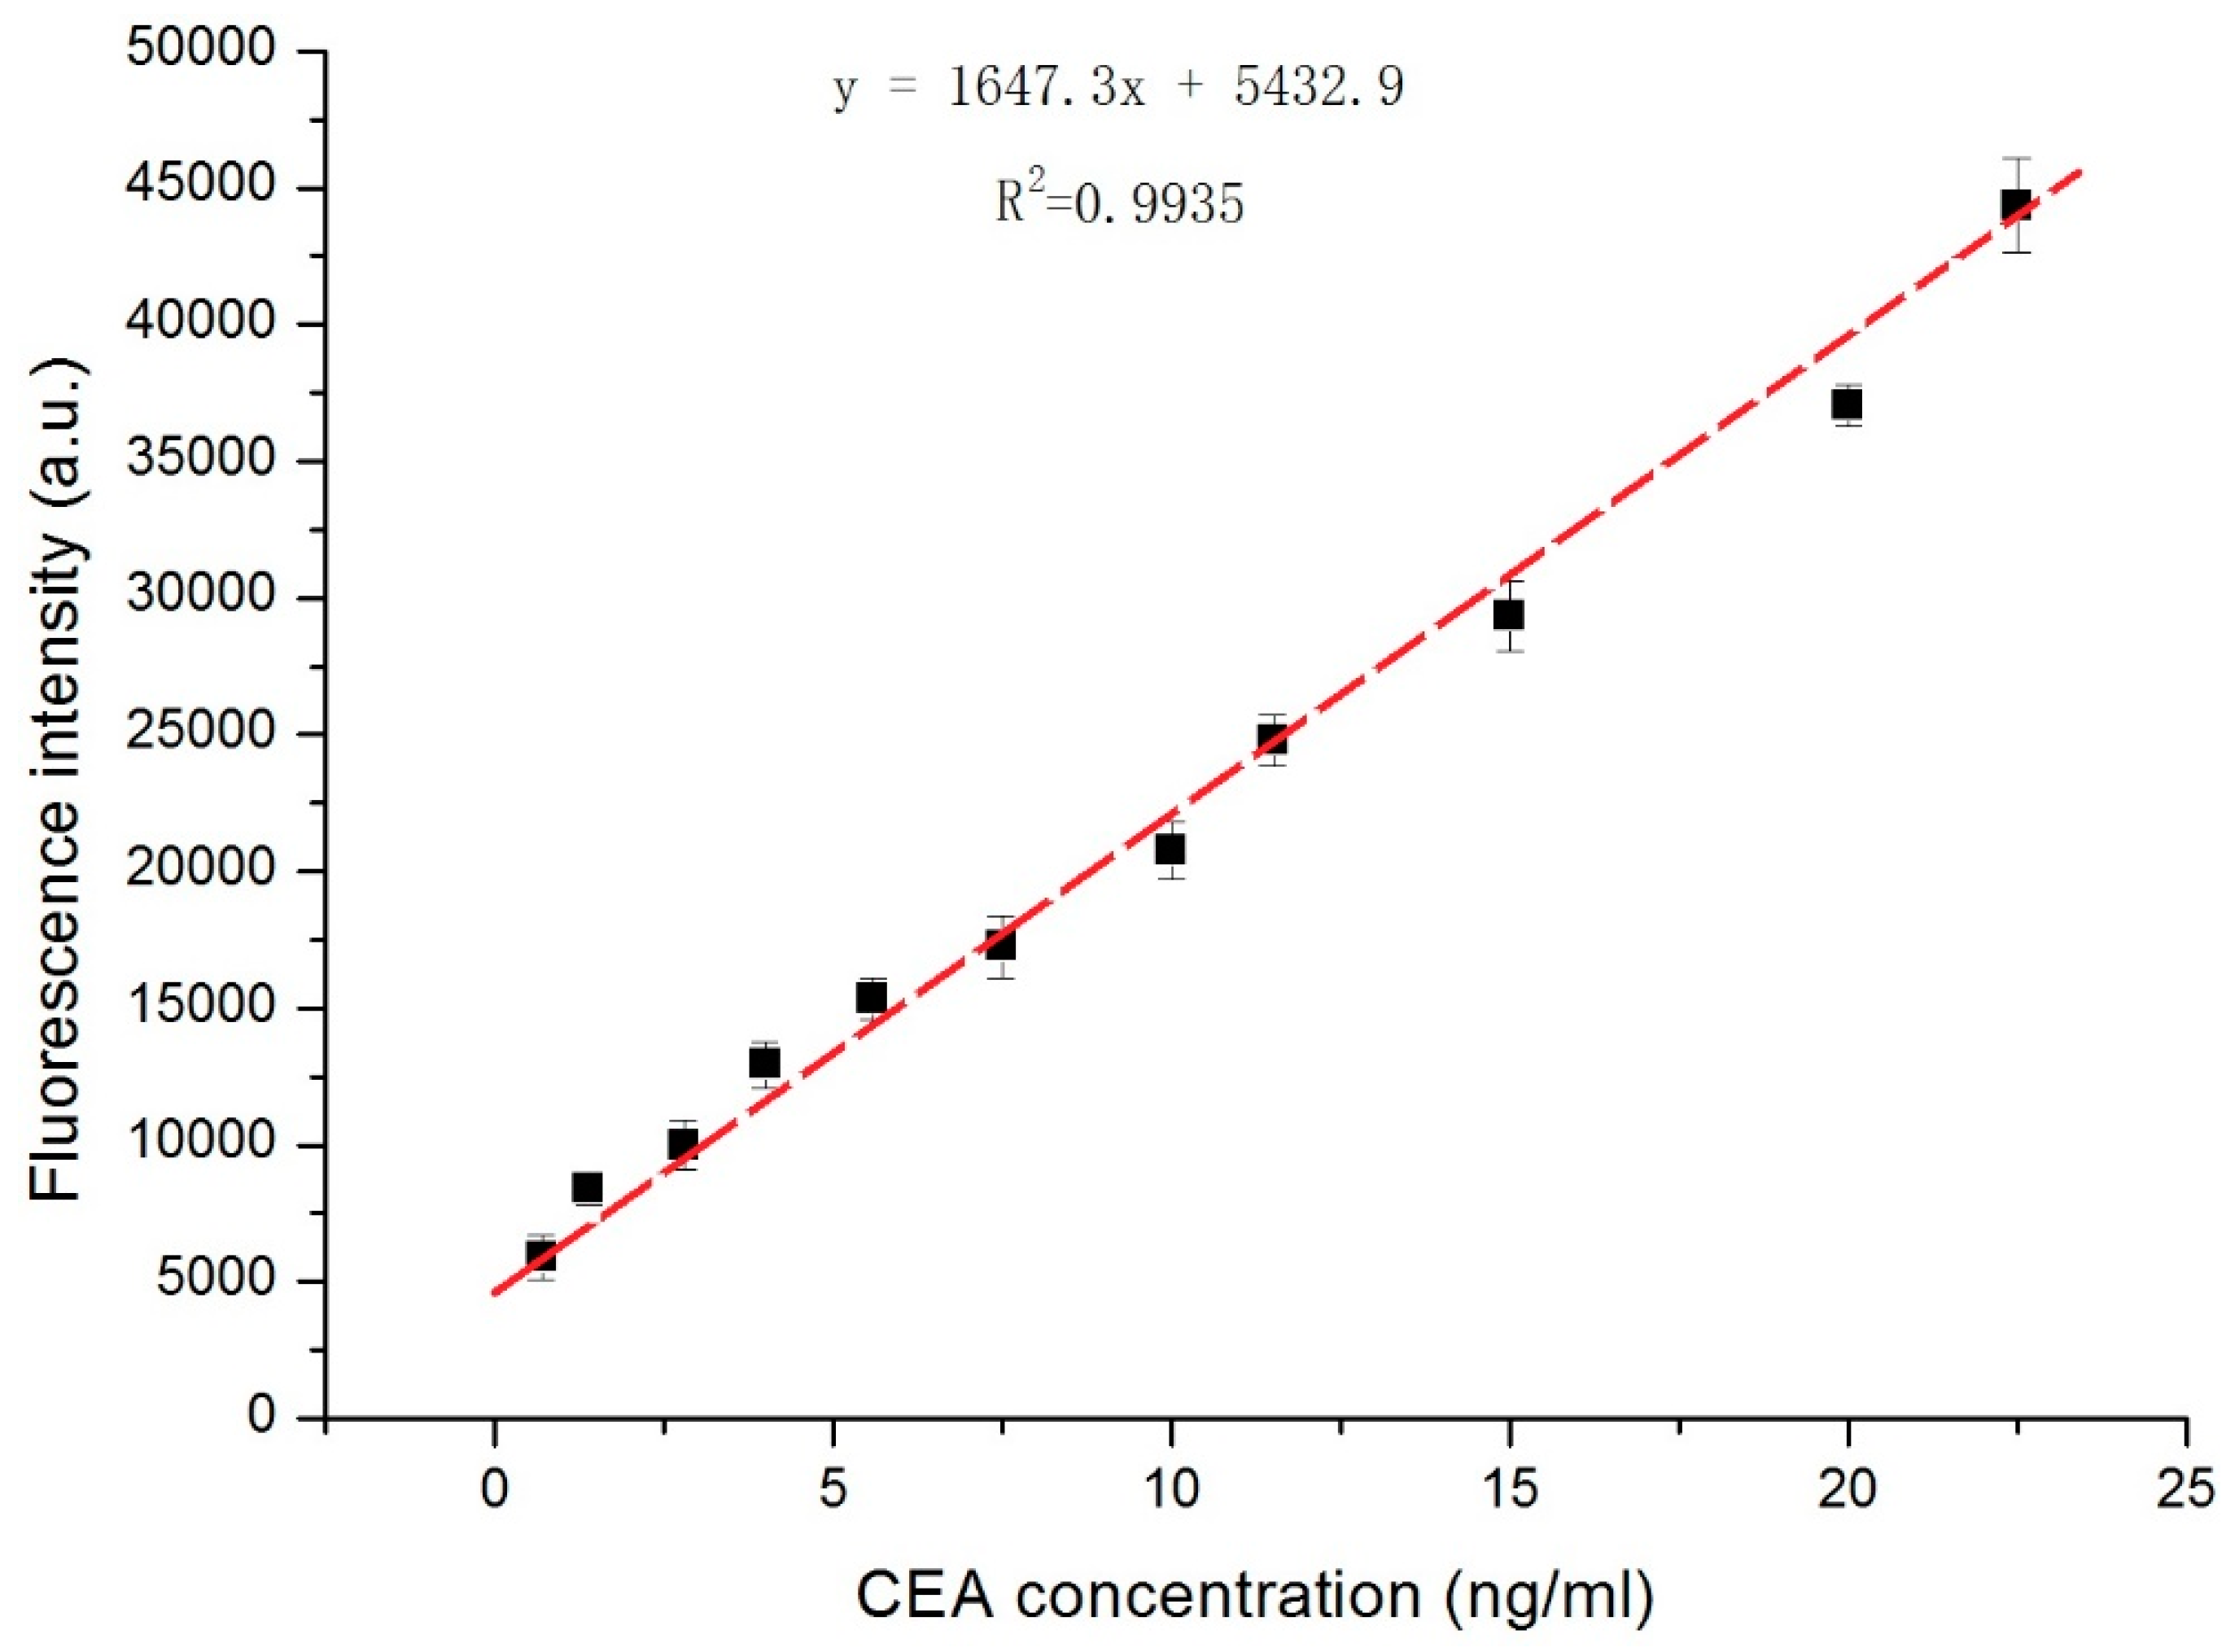
2.4. Establishing a CEA Standard Curve
CEA antigen samples at various concentrations, with labeled primary antibodies and fluorescence-labeled secondary antibodies, were successively added and incubated. Finally, the microfluidic device was centrifuged for 150 s at 2500 rpm in a horizontal centrifuge. At the same time, fluorescence images were obtained using a fluorescence microscope with exposure time of 3.5 s. The fluorescence images were analyzed with ImageJ software to establish a standard curve between the concentration of CEA and the corresponding fluorescence intensity.
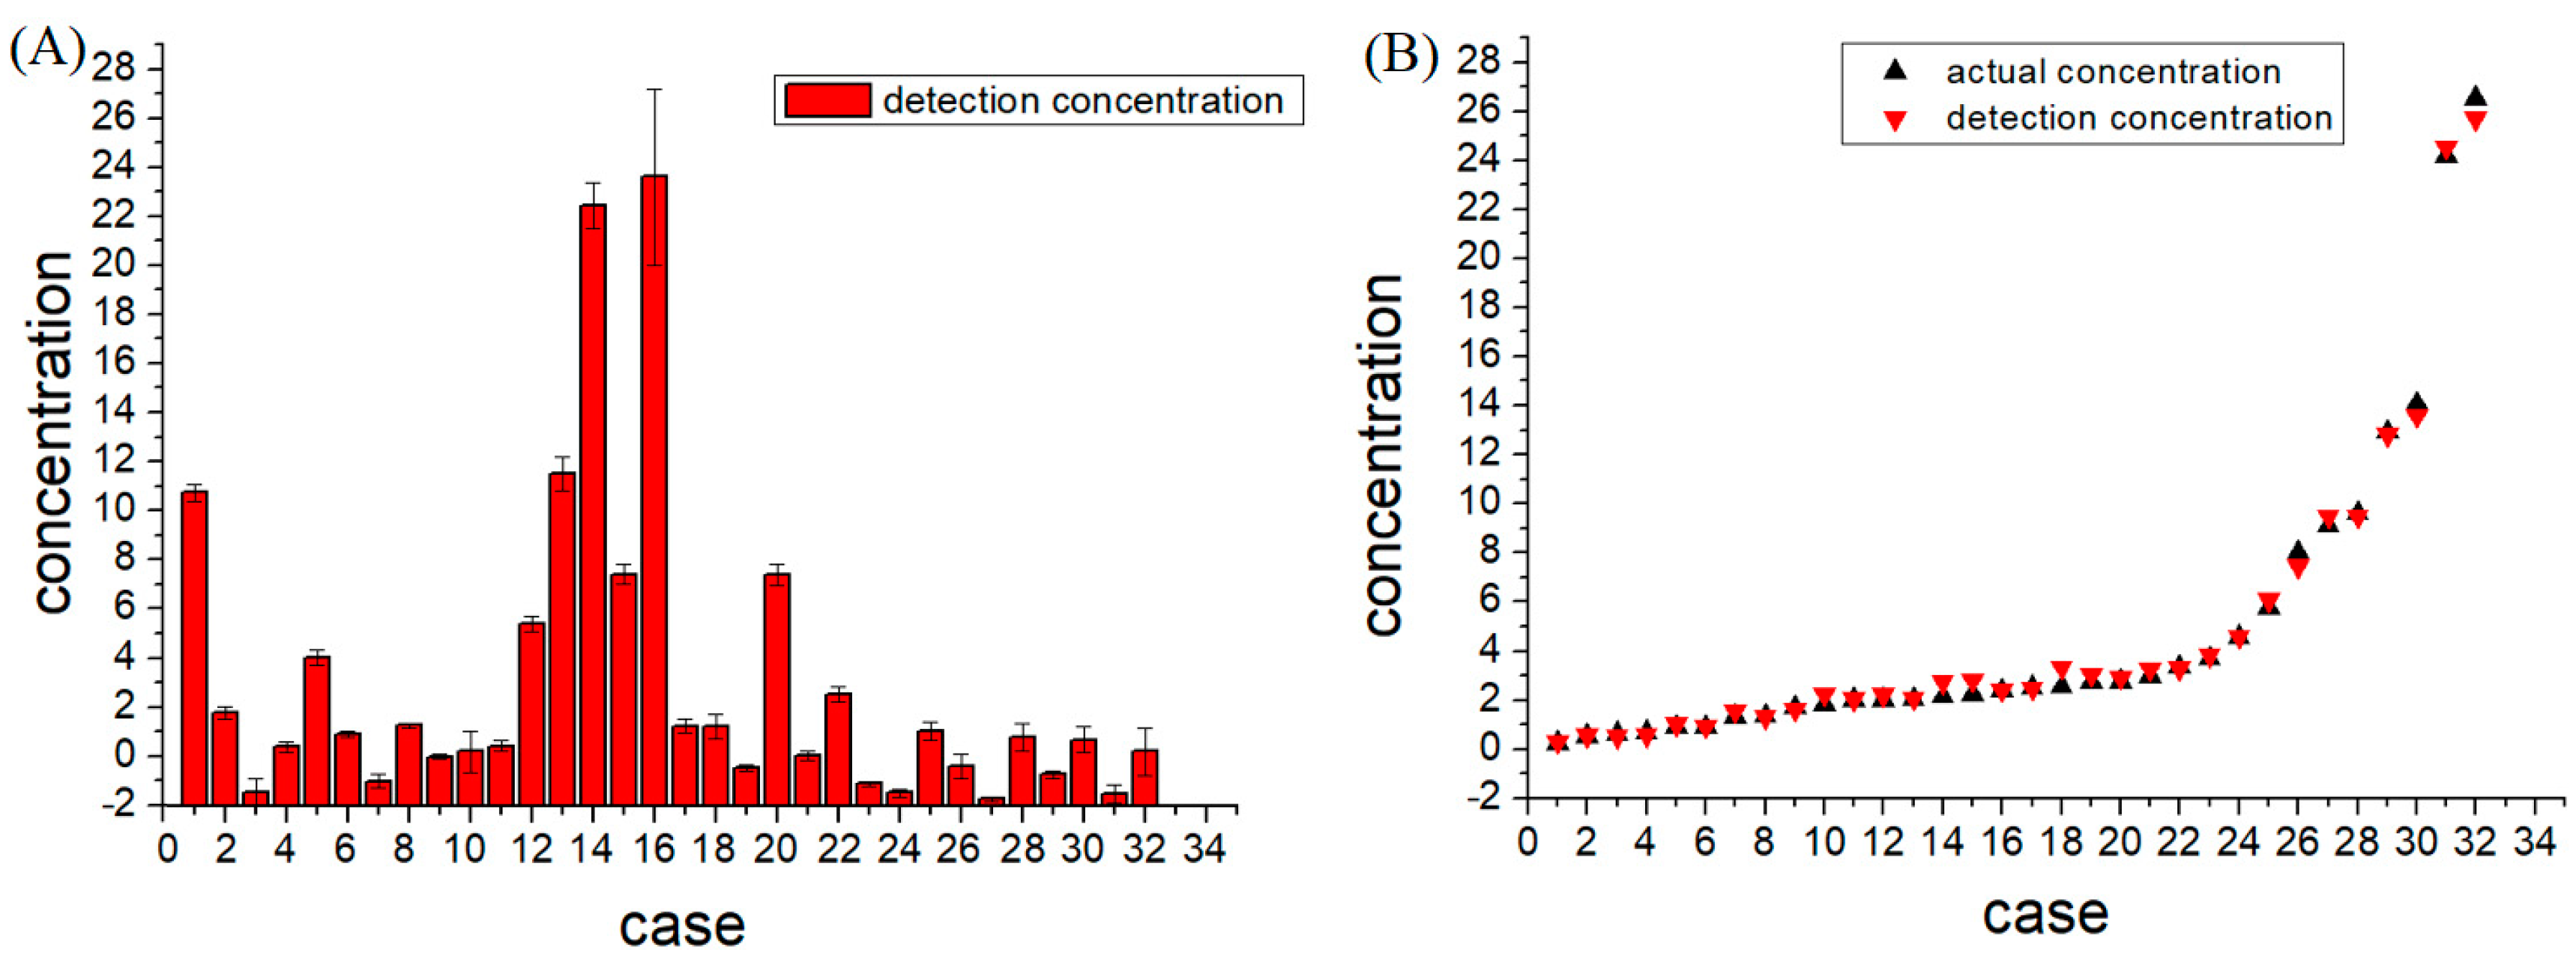
2.5. Detection of CEA in Human Serum
BSA blocked bead–antibody complexes, and labeled primary antibodies and fluorescence-labeled secondary antibodies were added to the centrifuge microfluidic device and incubated at room temperature for 2 h. Then, clinical serum samples, which were collected and provided by the Affiliated Hospital of Dalian Medical University from both healthy and cancer person, were added to the centrifuge chip, and spun at 2500 rpm for 2.5 min. After obtaining the fluorescence images using the fluorescence microscope and processing with the ImageJ software, the standard concentration curve were used to obtain the experimental CEA concentrations.
2.6. Statistical Analysis
The SPSS 18.0. (IBM, New York, NY, USA) was used for mean value and standard deviation calculation as well as significance testing.
3. Results
3.1. Design, Fabrication, and Verification of the Centrifugal Microfluidic Device
Figure 1 shows the centrifugal microfluidic platform for detecting CEA using a sedimentation-based immunoassay. The sample was mixed with a detection cocktail consisting of silica microbeads (1 μm diameter), which were coated with specific antibodies for the target of interest, in this case, CEA. The detection antibodies were labeled with a fluorescent tag, which binds to the capture beads in the presence of the corresponding antigen (
Figure 1A). After the serum samples were mixed with the antibody-conjugated capture beads and fluorescent detection antibodies in solution, they were added to a preloaded dense medium. The beads were pushed to the bottom of the channel to form pellets by the centrifugal force. Eventually, the target analytes separated from the rest of the sample (
Figure 1B). The entire process of CEA detection could be completed in one step, as shown in
Figure 1C. The samples were added at the entrance of the centrifugal microfluidic platform, which was split into 14 radially arranged pencil-like microchannels. Then, the target analyte could be detected using a sedimentation-based immunoassay. This simple, one-step centrifugal microfluidic platform provides high analytical accuracy and repeatability, which cannot be achieved by processes that require multiple steps.
To validate the effectiveness of the chemiluminescence immunoassay used in this device, CEA standard samples were measured using a double-antibody sandwich ELISA with the conventional method and the centrifugal microfluidic device. The proposed method was shown to be equivalent to the conventional method based on the linearity of the response (see
supplementary material in the supporting information).
3.2. Medium Screening and Structure Optimization of the Microfluidic Device
Based on Equation (2), we screened various media to determine the optimal density and viscosity, as one of the critical aspects in this study. Percoll, dextran (7% or 14%), and chitosan (1% or 2%) were tested as dense media, as shown in
Figure 2. It was suggested that the microbeads could not be separated in a Percoll solution at a concentration of 1.13 g/mL (
Figure 2A). However, if the sample is whole blood with a density of 1.09 to 1.11 g/mL of red blood cells, Percoll can separate red blood cells from plasma. Although dextran can separate the microbeads from solution as a clinical plasma substitute, the separating effect is not as good as with the chitosan solution (
Figure 2B,C). Because the concentration of the dense medium solution is 1%, the modified antigen antibody beads can become separated at the end of the microchannel. Furthermore, the rest of the solution will have been mixed with the medium because this is beyond the abilities of the separation process (
Figure 2D,E). In addition, if the concentration of the dense medium is 2%, the modified antigen antibody beads can pass through the medium to reach the bottom of the channel. Therefore, a chitosan solution with a concentration of 2% was selected as the dense medium in the centrifugal microfluidic device to separate the microbeads modified by antigen antibodies in solution.
3.3. Effects of Rotation Speed and Spin Duration on the Detection of CEA
The effects of rotation speed and spin duration were also considered in this study. In the centrifugal microfluidic device with chitosan as the dense medium, the effects of various angular velocities on the isolation power of CEA standard samples (25 ng/mL) were investigated.
In
Figure 3A, the fluorescence intensity of aggregated microbeads increased as the rotation speed increased from 1000 to 2500 rpm. However, even if the rotation speed was set to greater than 2500 rpm, the fluorescence intensity of the aggregated microbeads did not increase, and instead plateaued at a constant value. This indicates that spinning at 2500 rpm caused all the microbeads in the bulk serum to migrate to the end of the microchannel. Thus, 2500 rpm was used as the rotation speed for CEA detection.
Similarly, the effects of various spin durations of the centrifugal microfluidic device using chitosan as the dense medium on the isolation of CEA in a standard sample (25 ng/mL) were investigated at 2500 rpm. As shown in
Figure 3B, in the first two minutes, the microbeads were gradually separated to the end of the microchannel, and the fluorescence intensity increased over time. After two minutes, the microbeads in the sample were almost completely in the detection area, and the fluorescence intensity was constant thereafter. To have a margin of safety, 2.5 min was selected as the centrifugal spin duration.
3.4. CEA Detection in Human Serum Samples
CEA standard samples with various concentrations were measured using this device, and the relationship between CEA concentration (
x) and the fluorescence intensity (
y) was established with a standard curve (
y = 1647.3
x + 5432.9). It is suggested that the analytical sensitivity of the standard curve is 1673.4. Based on
Figure 4, the repeatability at each concentration was good (
n = 4), and the curve was linear within the CEA concentration range of 0.7–22.5 ng/mL (R
2 = 0.993). Thus, these equations can be used as a standard curve for sample detection, including human serum samples.
CEA in clinical human serum samples with known concentrations were measured using the centrifugal microfluidic device, and comparisons between the known and measured concentrations are shown in
Table 1 and
Figure 4. It can be seen from the table that the sample testing errors from 90% of the samples are less than 20%, and the average relative error was only 9.22%. This indicates that the detection results obtained by this device were reliable. In addition, as shown in
Figure 5A, in these tests, excluding the poor repeatability of certain outlier samples, the repeatability of the remaining samples was good for CEA concentrations in the range of 0.5 ng/mL to 27 ng/mL. In addition, it was determined from
Figure 5B that, when the carcinoembryonic antigen concentration was less than 2.0 ng/mL, the detection concentration was consistent with the known concentration, and when the concentration of the serum sample was higher than 10 ng/mL, there were some slight differences between the actual and measured concentrations.
The CEA detection results using the centrifugal microfluidic device and the hospital instruments were compared. As shown in
Table 2, when excluding samples 7, 18 and 26, the
p-value of samples were above 0.05. This suggests that there were no significant differences between the detection method of the centrifugal microfluidic device and the hospital’s method.
4. Discussion
A centrifugal microfluidic chip was constructed for detecting CEA in clinical serum samples. The device is based on a sandwiched immunoassay with biocompatible chitosan as the dense medium. It is driven by centrifugal force to implement rapid, high-throughput detection of serum CEA and other biomarkers. This centrifugal microfluidic chip does not require any washing steps, and can simplify the experimental procedure with increased accuracy and efficiency, compared with traditional immunoassays. Thus, this centrifugal microfluidic device can be expected to be used for CEA determination in hospitals.
The dense medium used in this microfluidic device was 2% chitosan to eliminate the need for the complicated washing steps of the traditional detection method. This device was able to separate the analyte from the solution in a one-step centrifugal process. Therefore, the samples could be detected directly and easily. In addition, the 14 individual pencil channels acted as parallel systems on the centrifugal microfluidic chip, with a relative standard deviation (RSD) value of just 4.95%.
The rotation speed and spin duration were optimized for the microfluidic device. It was determined that 2500 rpm for 150 s was able to completely move the analytes of the samples to the detection area. Thus, this microfluidic device can improve upon the current clinical detection methods.
Finally, the CEA detection results obtained from this centrifugal microfluidic device were compared and verified with clinical values. Thirty clinical serum samples were measured based on the standard curve established between the CEA concentration and fluorescence intensity. The detection error in 90% of the samples was less than 20% (
Table 1), and the repeatability of the samples was good over the range of concentrations of 0.5 ng/mL to 27 ng/mL. Although a few samples showed low reproducibility, this might have been because the CEA was not uniformly distributed in the serum, and the volume of samples added to microfluidic device was microscale, thus making the contents to be measured in each sample unstable.
In conclusion, this study describes a centrifugal microfluidic device that was developed for detecting CEA. This method uses density gradient centrifugation and is free of washing steps, and is thus more accurate than traditional ELISA methods. It also can achieve high-throughput detection, with the potential to be used in central labs.
Supplementary Materials
The following are available online at
https://www.mdpi.com/2072-666X/9/9/470/s1, Figure S1: Chip channel parallelism measurement, Figure S2: Standard curve for determination of protein content, Figure S3: The comparation of fluorescence concentration curve between conventional ELISA method and centrifugal microfluidic device. (A) conventional ELISA method; (B) centrifugal microfluidic device.
Author Contributions
Z.G., Y.L. (Yong Luo), W.Z., B.L., Y.L. (Yao Lu) and T.L. conceived and designed the experiments; Z.G., X.L., and L.X. performed the experiments; Z.G., J.D., Y.L. (Yong Luo) and L.X. analyzed the data; Z.C., Y.Q., W.Z., B.L., Y.L. (Yao Lu) and T.L. contributed reagents/materials/analysis tools; Z.G., Z.C. and Y.L. (Yong Luo) wrote the paper.
Funding
This work was supported by the National Natural Science Foundation of China (No. 21675017), and the National Key Research and Development Program of China (No. SQ2017YFC170204-001).
Acknowledgments
The authors would like to appreciate Affiliated Hospital of Dalian Medical University to provide CEA Clinical samples.
Conflicts of Interest
All authors declare no conflict of interest.
References
- Braik, T.; Gupta, S.; Poola, H.; Jain, P.; Beiranvand, A.; Lad, T.E.; Hussein, L. Carcino embryonic antigen (CEA) elevation as a predictor of better response to first line pemetrexed in advanced lung adenocarcinoma. J. Thorac. Oncol. 2012, 7, S310. [Google Scholar]
- Yu, D.H.; Li, J.H.; Wang, Y.C.; Xu, J.G.; Pan, P.T.; Wang, L. Serum anti-p53 antibody detection in carcinomas and the predictive values of serum p53 antibodies, carcino-embryonic antigen and carbohydrate antigen 12–5 in the neoadjuvant chemotherapy treatment for III stage non-small cell lung cancer patients. Clin. Chim. Acta 2011, 412, 930–935. [Google Scholar] [CrossRef] [PubMed]
- Bao, H.; Yu, D.; Wang, J.; Qiu, T.; Yang, J.; Wang, L. Predictive value of serum anti-p53 antibodies, carcino-embryonic antigen, carbohydrate antigen 15-3, estrogen receptor, progesterone receptor and human epidermal growth factor receptor-2 in taxane-based and anthracycline-based neoadjuvant chemotherapy in locally advanced breast cancer patients. Anti-Cancer Drug 2008, 19, 317–323. [Google Scholar]
- Thriveni, K.; Krishnamoorthy, L.; Ramaswamy, G. Correlation study of carcino embryonic antigen & cancer antigen 15.3 in pretreated female breast cancer patients. India J. Clin. Biochem. 2007, 22, 57–60. [Google Scholar]
- Cierpinski, A.; Stein, A.; Ruessel, J.; Ettrich, T.; Schmoll, H.J.; Arnold, D. Prognostic impact of carcino embryonic antigen (CEA), carbohydrate antigen (CA 19–9), and lactate dehydrogenase (LDH) decrease in patients with metastatic colorectal cancer (mCRC) receiving a bevacizumab- or cetuximab-chemotherapy combination. Onkologie 2011, 34, 250. [Google Scholar]
- Wang, Y.R.; Yan, J.X.; Wang, L.N. The diagnostic value of serum carcino-embryonic antigen, alpha fetoprotein and carbohydrate antigen 19-9 for colorectal cancer. J. Cancer Res. Ther. 2014, 10, 307–309. [Google Scholar] [PubMed]
- Lai, H.; Jin, Q.; Lin, Y.; Mo, X.; Li, B.; He, K.; Chen, J. Combined use of lysyl oxidase, carcino-embryonic antigen, and carbohydrate antigens improves the sensitivity of biomarkers in predicting lymph node metastasis and peritoneal metastasis in gastric cancer. Tumor Biol. 2014, 35, 10547–10554. [Google Scholar] [CrossRef] [PubMed][Green Version]
- Szajda, S.D.; Snarska, J.; Jankowska, A.; Roszkowska-Jakimiec, W.; Puchalski, Z.; Zwierz, K. Cathepsin D and carcino-embryonic antigen in serum, urine and tissues of colon adenocarcinoma patients. Hepatogastroenterology 2008, 55, 388–393. [Google Scholar] [PubMed]
- Zhao, L.; Xu, S.; Fjaertoft, G.; Pauksen, K.; Hakansson, L.; Venge, P. An enzyme-linked immunosorbent assay for human carcinoembryonic antigen-related cell adhesion molecule 8, a biological marker of granulocyte activities in vivo. J. Immunol. Methods 2004, 293, 207–214. [Google Scholar] [CrossRef] [PubMed]
- Chester, S.J.; Maimonis, P.; Vanzuiden, P.; Finklestein, M.; Bookout, J.; Vezeridis, M.P. A new radioimmunoassay detecting early stages of colon cancer: a comparison with CEA, AFP, and Ca 19-9. Dis. Markers 1991, 9, 265–271. [Google Scholar] [PubMed]
- Yan, F.; Zhou, J.; Lin, J.; Ju, H.; Hu, X. Flow injection immunoassay for carcinoembryonic antigen combined with time-resolved fluorometric detection. J. Immunol. Methods 2005, 305, 120–127. [Google Scholar] [CrossRef] [PubMed]
- Lin, J.; Yan, F.; Hu, X.; Ju, H. Chemiluminescent immunosensor for CA19-9 based on antigen immobilization on a cross-linked chitosan membrane. J. Immunol. Methods 2004, 291, 165–174. [Google Scholar] [CrossRef] [PubMed]
- Zhang, S.; Yang, J.; Lin, J. 3,3′-diaminobenzidine (DAB)-H2O2-HRP voltammetric enzyme-linked immunoassay for the detection of carcionembryonic antigen. Bioelectrochemistry 2008, 72, 47–52. [Google Scholar] [CrossRef] [PubMed]
- Schaff, U.Y.; Sommer, G.J. Whole blood immunoassay based on centrifugal bead sedimentation. Clin. Chem. 2011, 57, 753–761. [Google Scholar] [CrossRef] [PubMed]
- Koh, C.-Y.; Schaff, U.Y.; Piccini, M.E.; Stanker, L.H.; Cheng, L.W.; Ravichandran, E.; Singh, B.-R.; Sommer, G.J.; Singh, A.K. Centrifugal microfluidic platform for ultrasensitive detection of botulinum toxin. Anal. Chem. 2015, 87, 922–928. [Google Scholar] [CrossRef] [PubMed]
- Strohmeier, O.; Keller, M.; Schwemmer, F.; Zehnle, S.; Mark, D.; Von Stetten, F.; Zengerle, R.; Paust, N. Centrifugal microfluidic platforms: advanced unit operations and applications. Chem. Soc. Rev. 2015, 44, 6187–6229. [Google Scholar] [CrossRef] [PubMed][Green Version]
© 2018 by the authors. Licensee MDPI, Basel, Switzerland. This article is an open access article distributed under the terms and conditions of the Creative Commons Attribution (CC BY) license (http://creativecommons.org/licenses/by/4.0/).