
Optofluidic Device Based Microflow Cytometers for Particle/Cell Detection: A Review


Abstract
:1. Introduction
1.1. The Principles of Flow Cytometry
1.2. Microflow Cytometer
2. Major Components of an Optofluidic Microflow Cytometer
2.1. Flow Control
2.1.1. 2D Hydrodynamic Flow Focusing
2.1.2. 3D Hydrodynamic Flow Focusing
2.1.3. Other Methods
2.2. Light Guide and Collection
2.2.1. Excitation Sources and Optical Fibers
2.2.2. Waveguides
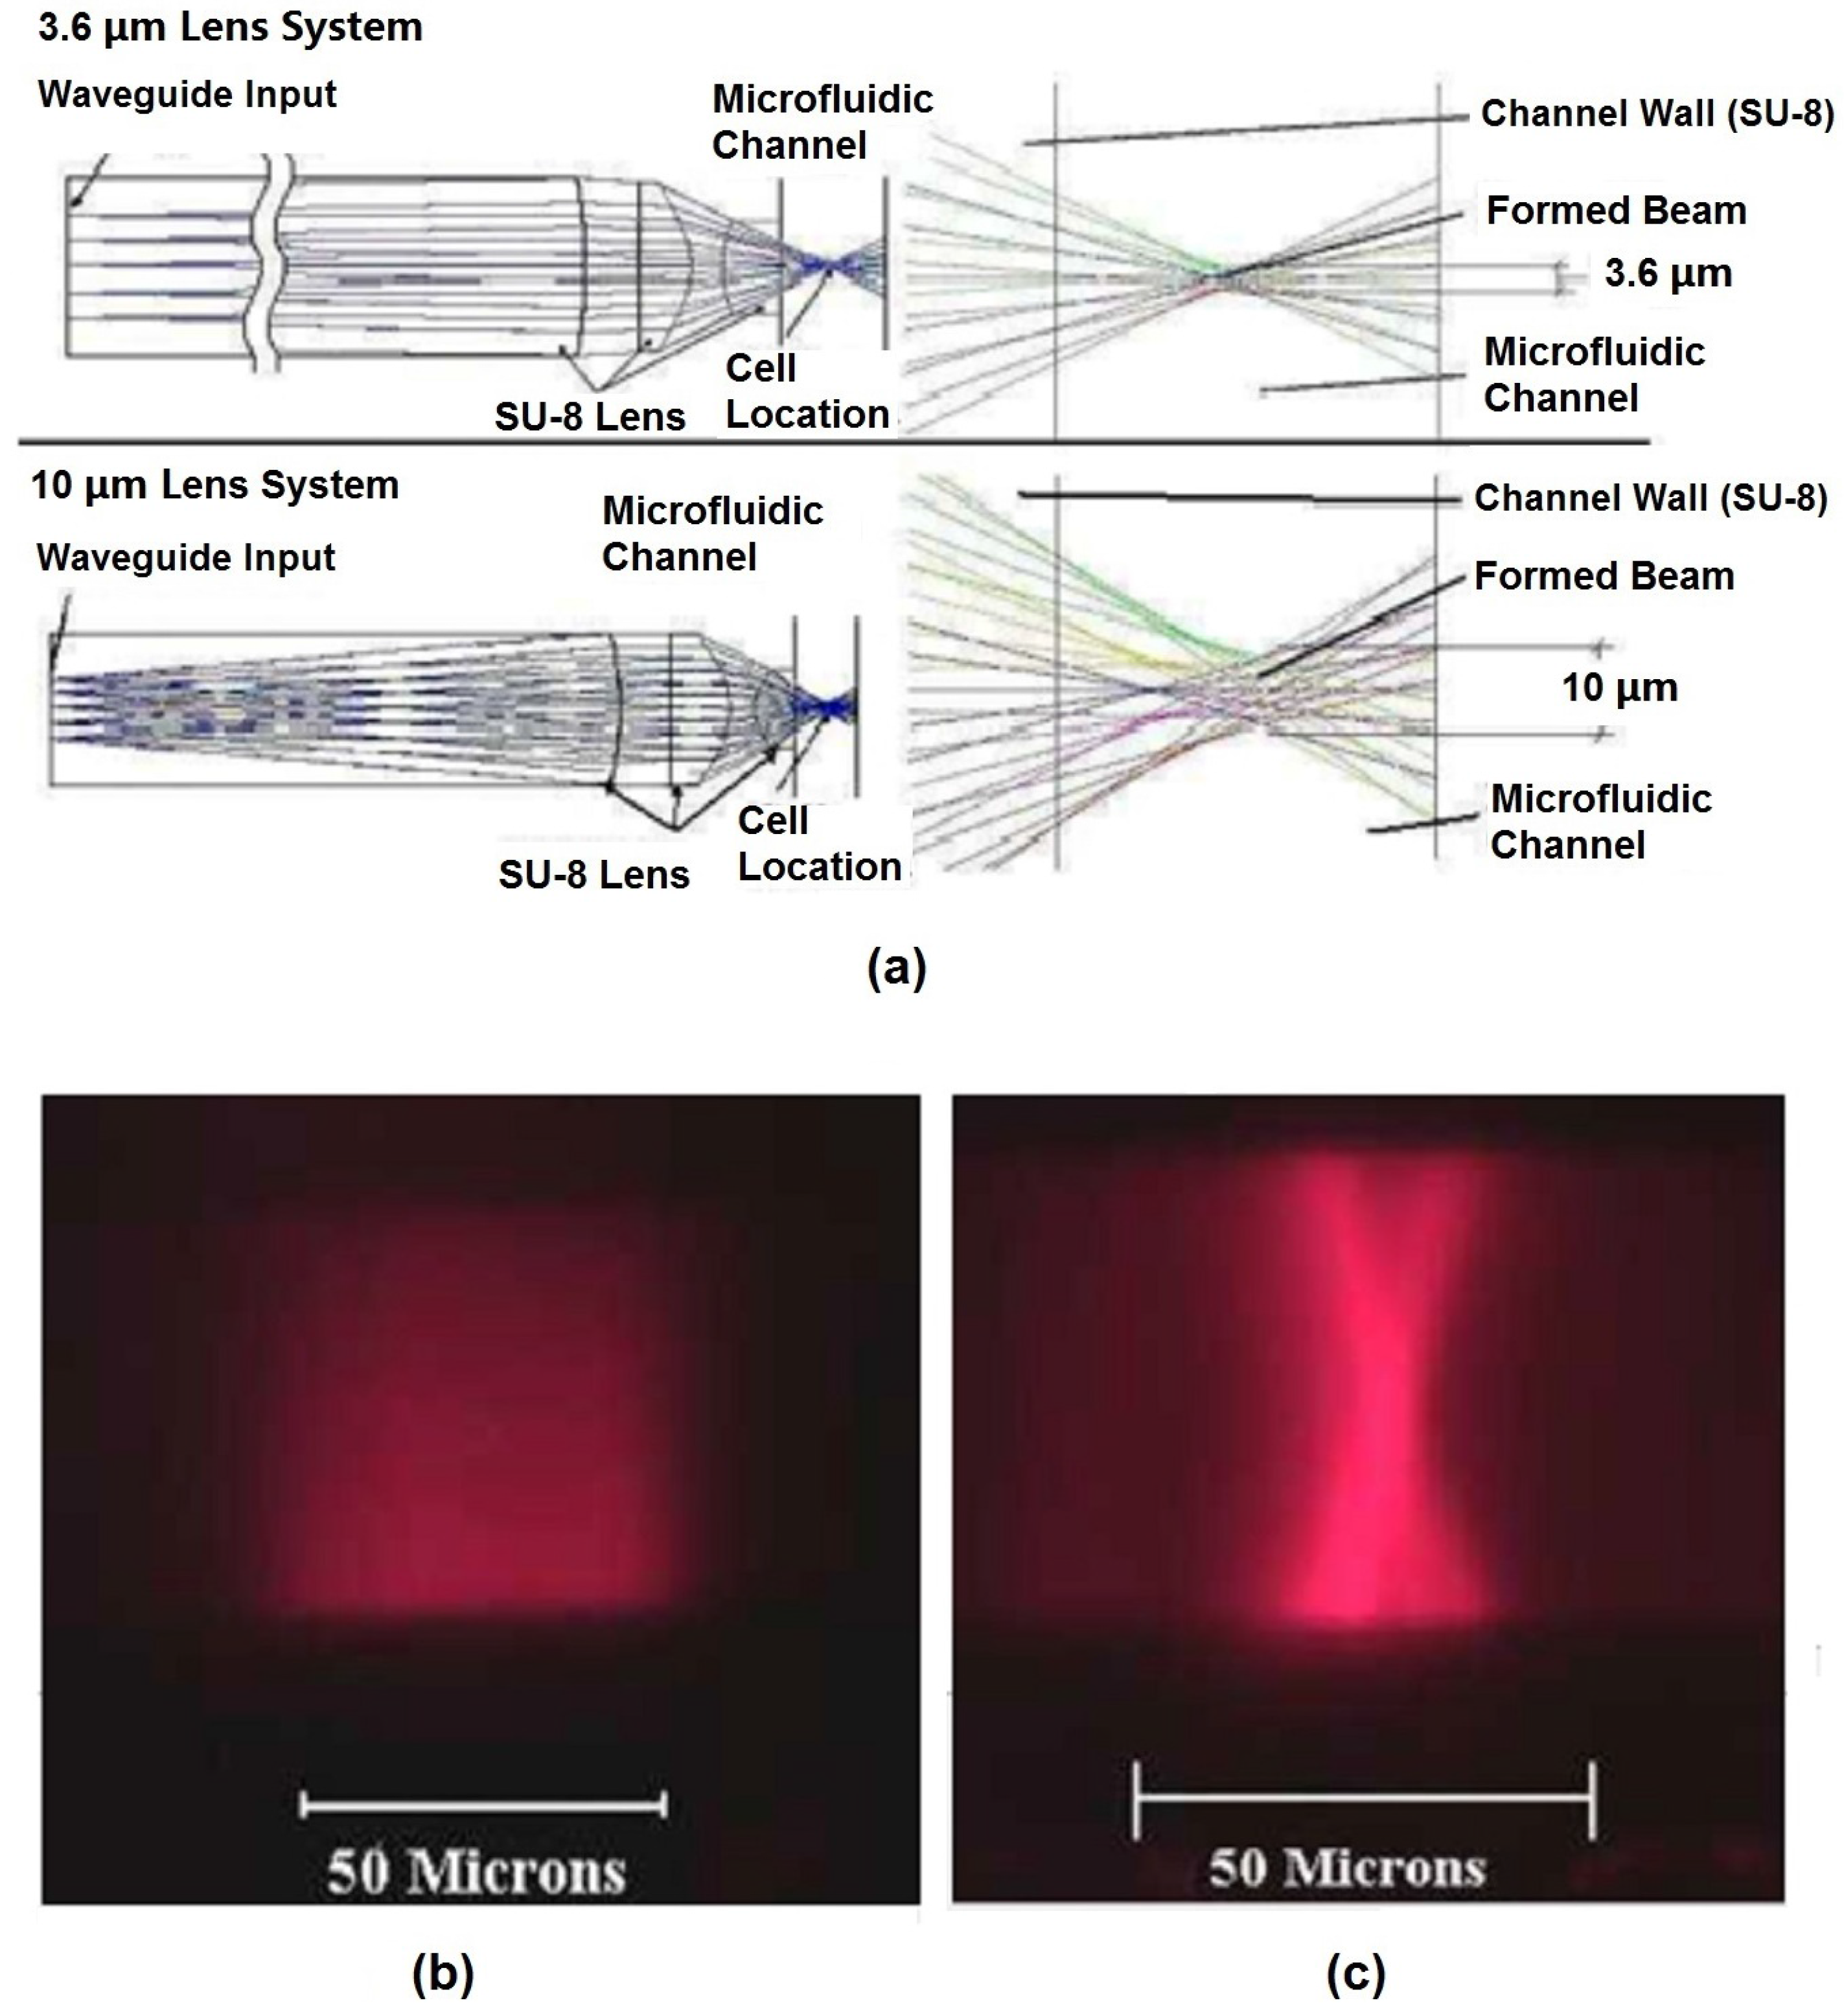
2.2.3. On-Chip Lens System
2.3. Data Collection
2.4. Data Analysis
3. Fabrication and Integration
3.1. Materials
3.2. Device Integration
4. Performance of Optofluidic Microflow Cytometers
5. Conclusions and Future Perspective
Acknowledgments
Author Contributions
Conflicts of Interest
References
- Piyasena, M.E.; Graves, S.W. The intersection of flow cytometry with microfluidics and microfabrication. Lab Chip 2014, 14, 1044–1059. [Google Scholar] [CrossRef] [PubMed]
- Barat, D.; Spencer, D.; Benazzi, G.; Mowlem, M.C.; Morgan, H. Simultaneous high speed optical and impedance analysis of single particles with a microfluidic cytometer. Lab Chip 2012, 12, 118–126. [Google Scholar] [CrossRef] [PubMed]
- Volpatti, L.R.; Yetisen, A.K. Commercialization of microfluidic devices. Trends Biotechnol. 2014, 32, 347–350. [Google Scholar] [CrossRef] [PubMed]
- Psaltis, D.; Quake, S.R.; Yang, C. Developing optofluidic technology through the fusion of microfluidics and optics. Nature 2006, 442, 381–386. [Google Scholar] [CrossRef] [PubMed]
- Horowitz, V.R.; Awschalow, D.D.; Pennathur, S. Optofluidics: Field or technique? Lab Chip 2008, 8, 1856–1863. [Google Scholar] [PubMed]
- Huang, N.T.; Zhang, H.L.; Chung, M.T.; Seo, J.H.; Kurabayashi, K. Recent advancements in optofluidics-based single-cell analysis: Optical on-chip cellular manipulation, treatment, and property detection. Lab Chip 2014, 14, 1230–1245. [Google Scholar] [CrossRef] [PubMed]
- Crosland-Taylor, P.J. A device for counting small particles suspended in a fluid through a tube. Nature 1953, 171, 37–38. [Google Scholar] [CrossRef] [PubMed]
- Justin, G.A.; Denisin, A.K.; Nasir, M.; Shriver-Lake, L.C.; Golden, J.P.; Ligler, F.S. Hydrodynamic focusing for impedance-based detection of specifically bound microparticles and cells: Implications of fluid dynamics on tunable sensitivity. Sens. Actuators B Chem. 2012, 166–167, 386–393. [Google Scholar] [CrossRef]
- Song, H.; Wang, Y.; Rosano, J.M.; Prabhakarpandian, B.; Garson, C.; Pant, K.; Lai, E. A microfluidic impedance flow cytometer for identification of differentiation state of stem cells. Lab Chip 2013, 13, 2300–2310. [Google Scholar] [CrossRef] [PubMed]
- Han, M.; Lee, W.; Lee, S.K.; Lee, S.S. 3D microfabrication with inclined/rotated UV lithography. Sens. Actuators A Phys. 2004, 111, 14–20. [Google Scholar] [CrossRef]
- Lee, C.Y.; Chang, C.L.; Wang, Y.N.; Fu, L.M. Microfluidic Mixing: A Review. Int. J. Mol. Sci. 2011, 12, 3263–3287. [Google Scholar] [CrossRef] [PubMed]
- Abgrall, P.; Gué, A.M. Lab-on-chip technologies: Making a microfluidic network and coupling it into a complete microsystem–A review. J. Micromech. Microeng. 2007, 17, R15–R49. [Google Scholar] [CrossRef]
- Whitesides, G.M. The origins and the future of microfluidics. Nature 2006, 442, 368–373. [Google Scholar] [CrossRef] [PubMed]
- Brennan, D.; Justice, J.; Corbett, B.; McCarthy, T.; Galvin, P. Emerging optofluidic technologies for point-of-care genetic analysis systems: A review. Anal. Bioanal. Chem. 2009, 395, 621–636. [Google Scholar] [CrossRef] [PubMed]
- Titmarsh, D.M.; Chen, H.; Glass, N.R.; Cooper-White, J.J. Concise review: Microfluidic technology platforms: Poised to accelerate development and translation of stem cell-derived therapies. Stem Cells Transl. Med. 2014, 3, 81–90. [Google Scholar] [CrossRef] [PubMed]
- Hashemi, N.; Erickson, J.S.; Golden, J.P.; Jackson, K.M.; Ligler, F.S. Microflow cytometer for optical analysis of phytoplankton. Biosens. Bioelectron. 2011, 26, 4263–4269. [Google Scholar] [CrossRef] [PubMed]
- Lei, K.F. Microfluidic Systems for Diagnostic Applications: A Review. J. Lab. Autom. 2012, 17, 330–347. [Google Scholar] [CrossRef] [PubMed]
- Tang, S.K.Y.; Stan, C.A.; Whitesides, G.M. Dynamically reconfigurable liquid-core liquid-cladding lens in a microfluidic channel. Lab Chip 2008, 8, 395–401. [Google Scholar] [CrossRef] [PubMed]
- Liang, L.; Zuo, Y.F.; Wu, W.; Zhu, X.Q.; Yang, Y. Optofluidic restricted imaging, spectroscopy and counting of nanoparticles by evanescent wave using immiscible liquids. Lab Chip 2016. [Google Scholar] [CrossRef] [PubMed]
- Guo, T.; Wei, Y.; Xu, C.; Watts, B.R.; Zhang, Z.; Fang, Q.; Zhang, H.; Selvaganapathy, P.R.; Deen, M.J. Counting of Escherichia coli by a microflow cytometer based on a photonic-microfluidic integrated device. Electrophoresis 2015, 36, 298–304. [Google Scholar] [CrossRef] [PubMed]
- Huh, D.; Gu, W.; Kamotani, Y.; Grotberg, J.B.; Takayama, S. Microfluidics for flow cytometric analysis of cells and particles. Physiol. Meas 2005, 26, R73–R98. [Google Scholar] [CrossRef] [PubMed]
- Lau, A.T.H.; Yip, H.M.; Ng, K.C.C.; Cui, X.; Lam, R.H.W. Dynamics of microvalve operations in integrated microfluidics. Micromachines 2014, 5, 50–65. [Google Scholar] [CrossRef]
- Ainla, A.; Jeffries, G.; Jesorka, A. Hydrodynamic flow confinement technology in microfluidic perfusion devices. Micromachines 2012, 3, 442–461. [Google Scholar] [CrossRef]
- Mu, C.; Zhang, F.; Zhang, Z.; Lin, M.; Cao, X. Highly efficient dual-channel cytometric-detection of micron-sized particles in microfluidic device. Sens. Actuators B Chem. 2011, 151, 402–409. [Google Scholar] [CrossRef]
- McClain, M.A.; Culbertson, C.T.; Jacobson, S.C.; Ramsey, J.M. Flow cytometry of Escherichia coli on microfluidic devices. Anal. Chem. 2001, 73, 5334–5338. [Google Scholar] [CrossRef] [PubMed]
- Tung, Y.C.; Zhang, M.; Lin, C.T.; Kurabayashi, K.; Skerlos, S.J. PDMS-based opto-fluidic micro flow cytometer with two-color, multi-angle fluorescence detection capability using PIN photodiodes. Sens. Actuators B Chem. 2004, 98, 356–367. [Google Scholar] [CrossRef]
- Fu, L.M.; Tsai, C.H.; Lin, C.H. A high-discernment microflow cytometer with microweir structure. Electrophoresis 2008, 29, 1874–1880. [Google Scholar] [CrossRef] [PubMed]
- Frankowski, M.; Theisen, J.; Kummrow, A.; Simon, P.; Ragusch, H.; Bock, N.; Schmidt, M.; Neukammer, J. Microflow cytometers with integrated hydrodynamic focusing. Sensors 2013, 13, 4674–4693. [Google Scholar] [CrossRef] [PubMed]
- Frankowski, M.; Simon, P.; Bock, N.; El-Hasni, A.; Schnakenberg, U.; Neukammer, J. Simultaneous optical and impedance analysis of single cells: A comparison of two microfluidic sensors with sheath flow focusing. Eng. Life Sci. 2015, 15, 286–296. [Google Scholar] [CrossRef]
- Lee, G.B.; Hung, C.I.; Ke, B.J.; Huang, G.R.; Hwei, B.H.; Lai, H.F. Hydrodynamic Focusing for a Micromachined Flow Cytometer. J. Fluids Eng. 2001, 123, 672. [Google Scholar] [CrossRef]
- Testa, G.; Persichetti, G.; Bernini, R. Micro flow cytometer with self-aligned 3D hydrodynamic focusing. Biomed. Opt. Express 2014, 6, 54. [Google Scholar] [CrossRef] [PubMed]
- Kim, D.S.; Kim, D.S.D.; Han, K.; Yang, W. An efficient 3-dimensional hydrodynamic focusing microfluidic device by means of locally increased aspect ratio. Microelectron. Eng. 2009, 86, 1343–1346. [Google Scholar] [CrossRef]
- Sundararajan, N.; Pio, M.S.; Lee, L.P.; Berlin, A.A. Three-dimensional hydrodynamic focusing in polydimethylsiloxane (PDMS) microchannels. J. Microelectromech. Syst. 2004, 13, 559–567. [Google Scholar] [CrossRef]
- Hairer, G.; Pärr, G.S.; Svasek, P.; Jachimowicz, A.; Vellekoop, M.J. Investigations of micrometer sample stream profiles in a three-dimensional hydrodynamic focusing device. Sens. Actuators B Chem. 2008, 132, 518–524. [Google Scholar] [CrossRef]
- Golden, J.P.; Kim, J.S.; Erickson, J.S.; Hilliard, L.R.; Howell, P.B.; Anderson, G.P.; Nasir, M.; Ligler, F.S. Multi-wavelength microflow cytometer using groove-generated sheath flow. Lab Chip 2009, 9, 1942–1950. [Google Scholar] [CrossRef] [PubMed]
- Kim, J.S.; Anderson, G.P.; Erickson, J.S.; Golden, J.P.; Nasir, M.; Ligler, F.S. Multiplexed detection of bacteria and toxins using a microflow cytometer. Anal. Chem. 2009, 81, 5426–5432. [Google Scholar] [CrossRef] [PubMed]
- Sato, H.; Yagyu, D.; Ito, S.; Shoji, S. Improved inclined multi-lithography using water as exposure medium and its 3D mixing microchannel application. Sens. Actuators A Phys. 2006, 128, 183–190. [Google Scholar] [CrossRef]
- Nawaz, A.A.; Zhang, X.; Mao, X.; Rufo, J.; Lin, S.C.S.; Guo, F.; Zhao, Y.; Lapsley, M.; Li, P.; McCoy, J.P.; et al. Sub-micrometer-precision, three-dimensional (3D) hydrodynamic focusing via “microfluidic drifting”. Lab Chip 2014, 14, 415–423. [Google Scholar] [CrossRef] [PubMed][Green Version]
- Shi, J.; Mao, X.; Ahmed, D.; Colletti, A.; Huang, T.J. Focusing microparticles in a microfluidic channel with standing surface acoustic waves (SSAW). Lab Chip 2007, 8, 221–223. [Google Scholar] [CrossRef] [PubMed]
- Shi, J.; Yazdi, S.; Lin, S.C.S.; Ding, X.; Chiang, I.K.; Sharp, K.; Huang, T.J. Three-dimensional continuous particle focusing in a microfluidic channel via standing surface acoustic waves (SSAW). Lab Chip 2011, 11, 2319–2324. [Google Scholar] [CrossRef] [PubMed]
- Chen, Y.; Nawaz, A.A.; Zhao, Y.; Huang, P.H.; McCoy, J.P.; Levine, S.J.; Wang, L.; Huang, T.J. Standing surface acoustic wave (SSAW)-based microfluidic cytometer. Lab Chip 2014, 14, 916–923. [Google Scholar] [CrossRef] [PubMed]
- Schmid, L.; Weitz, D.A.; Franke, T. Sorting drops and cells with acoustics: acoustic microfluidic fluorescence-activated cell sorter. Lab Chip 2014, 14, 3710–3718. [Google Scholar] [CrossRef] [PubMed]
- Yu, C.; Qian, X.; Chen, Y.; Yu, Q.; Ni, K.; Wang, X. Three-dimensional electro-sonic flow focusing ionization microfluidic chip for mass spectrometry. Micromachines 2015, 6, 1890–1902. [Google Scholar] [CrossRef]
- Zhu, J.; Xuan, X. Dielectrophoretic focusing of particles in a microchannel constriction using DC-biased AC flectric fields. Electrophoresis 2009, 30, 2668–2675. [Google Scholar] [CrossRef] [PubMed]
- Chu, H.; Doh, I.; Cho, Y.H. A three-dimensional particle focusing channel using the positive dielectrophoresis (pDEP) guided by a dielectric structure between two planar electrodes. Trans. Korean Soc. Mech. Eng. A 2009, 33, 261–264. [Google Scholar] [CrossRef]
- Zhang, J.; Yan, S.; Alici, G.; Nguyen, N.T.; Di Carlo, D.; Li, W. Real-time control of inertial focusing in microfluidics using dielectrophoresis (DEP). RSC Adv. 2014, 4, 62076–62085. [Google Scholar] [CrossRef]
- Bender, B.F.; Garrell, R.L. Digital microfluidic system with vertical functionality. Micromachines 2015, 6, 1655–1674. [Google Scholar] [CrossRef]
- James, C.D.; McClain, J.; Pohl, K.R.; Reuel, N.; Achyuthan, K.E.; Bourdon, C.J.; Rahimian, K.; Galambos, P.C.; Ludwig, G.; Derzon, M.S. High-efficiency magnetic particle focusing using dielectrophoresis and magnetophoresis in a microfluidic device. J. Micromech. Microeng. 2010, 20, 045015. [Google Scholar] [CrossRef]
- Zeng, J.; Chen, C.; Vedantam, P.; Brown, V.; Tzeng, T.R.J.; Xuan, X. Three-dimensional magnetic focusing of particles and cells in ferrofluid flow through a straight microchannel. J. Micromech. Microeng. 2012, 22, 105018. [Google Scholar] [CrossRef]
- Fernandes, A.C.; Duarte, C.M.; Cardoso, F.A.; Bexiga, R.; Cardoso, S.; Freitas, P.P. Lab-on-chip cytometry based on magnetoresistive sensors for bacteria detection in milk. Sensors 2014, 14, 15496–15524. [Google Scholar] [CrossRef] [PubMed]
- Ateya, D.A.; Erickson, J.S.; Howell, P.B.; Hilliard, L.R.; Golden, J.P.; Ligler, F.S. The good, the bad, and the tiny: A review of microflow cytometry. Anal. Bioanal. Chem. 2008, 391, 1485–1498. [Google Scholar] [CrossRef] [PubMed]
- Lin, C.H.; Lee, G.B.; Fu, L.M.; Hwey, B.H. Vertical focusing device utilizing dielectrophoretic force and its application on microflow cytometer. J. Microelectromech. Syst. 2004, 13, 923–932. [Google Scholar] [CrossRef]
- Blue, R.; Dudus, A.; Uttamchandani, D. A Review of Single-Mode Fiber Optofluidics. IEEE J. Sel. Top. Quantum Electron 2015, 22, 1–12. [Google Scholar] [CrossRef]
- Watts, B.R.; Kowpak, T.; Zhang, Z.; Xu, C.Q.; Zhu, S.; Cao, X.; Lin, M. Fabrication and performance of a photonic-microfluidic integrated device. Micromachines 2012, 3, 62–77. [Google Scholar] [CrossRef]
- Watts, B.R.; Zhang, Z.; Xu, C.Q.; Cao, X.; Lin, M. Scattering detection using a photonic-microfluidic integrated device with on-chip collection capabilities. Electrophoresis 2013, 35, 271–281. [Google Scholar] [CrossRef] [PubMed]
- Matteucci, M.; Triches, M.; Nava, G.; Kristensen, A.; Pollard, M.R.; Berg-Sørensen, K.; Taboryski, R.J. Fiber-based, injection-molded optofluidic systems: Improvements in assembly and applications. Micromachines 2015, 6, 1971–1983. [Google Scholar] [CrossRef]
- Yalizay, B.; Morova, Y.; Dincer, K.; Ozbakir, Y.; Jonas, A.; Erkey, C.; Kiraz, A.; Akturk, S. Versatile liquid-core optofluidic waveguides fabricated in hydrophobic silica aerogels by femtosecond-laser ablation. Opt. Mater. 2015, 47, 478–483. [Google Scholar] [CrossRef]
- Fan, S.K.; Lee, H.P.; Chien, C.C.; Lu, Y.W.; Chiu, Y.; Lin, F.Y. Reconfigurable liquid-core/liquid-cladding optical waveguides with dielectrophoresis-driven virtual microchannels on an electromicrofluidic platform. Lab Chip 2016, 6, 847–854. [Google Scholar] [CrossRef] [PubMed]
- Chen, X.; Sakurazawa, A.; Sato, K.; Tsunoda, K.I.; Wang, J. A solid-cladding/liquid-core/liquid-cladding sandwich optical waveguide for the study of dynamic extraction of dye by ionic liquid BmimPF 6. Appl. Spectrosc. 2012, 66, 798–802. [Google Scholar] [CrossRef] [PubMed]
- Shi, Y.; Liang, L.; Zhu, X.; Zhang, X.; Yang, Y. Tunable self-imaging effect using hybrid optofluidic waveguides. Lab Chip 2015, 15, 4398–4403. [Google Scholar] [CrossRef] [PubMed]
- Choi, J.; Lee, K.S.; Jung, J.H.; Sung, H.J.; Kim, S.S. Integrated real-time optofluidic SERS via a liquid-core/liquid-cladding waveguide. RSC Adv. 2015, 5, 922–927. [Google Scholar] [CrossRef]
- Lim, J.M.; Kim, S.H.; Choi, J.H.; Yang, S.M. Fluorescent liquid-core/air-cladding waveguides towards integrated optofluidic light sources. Lab Chip 2008, 8, 1580–1585. [Google Scholar] [CrossRef] [PubMed]
- Yang, Y.; Liu, A.Q.; Lei, L.; Chin, L.K.; Ohl, C.D.; Wang, Q.J.; Yoon, H.S. A tunable 3D optofluidic waveguide dye laser via two centrifugal Dean flow streams. Lab Chip 2011, 11, 3182–3187. [Google Scholar] [PubMed]
- Yang, Y.; Liu, A.Q.; Chin, L.K.; Zhang, X.M.; Tsai, D.P.; Lin, C.L.; Lu, C.; Wang, G.P.; Zheludev, N.I. Optofluidic waveguide as a transformation optics device for lightwave bending and manipulation. Nat. Commun. 2012, 3, 651. [Google Scholar] [CrossRef] [PubMed]
- Watts, B.R. Development of a Microchip-Based Flow Cytometer with Integrated Optics—Device Design, Fabrication, and Testing. Ph.D Thesis, McMaster University, Hamilton, ON, Canada, 2012. [Google Scholar]
- Emile, O.; Emile, J. Soap films as 1D waveguides. Optofluid. Microfluid Nanofluid. 2014, 1, 27–33. [Google Scholar] [CrossRef]
- Watts, B.R.; Kowpak, T.; Zhang, Z.; Xu, C.Q.; Zhu, S. Formation and characterization of an ideal excitation beam geometry in an optofluidic device. Biomed. Opt. Express 2010, 1, 848–860. [Google Scholar] [CrossRef] [PubMed]
- Watts, B.R.; Zhang, Z.; Xu, C.Q.; Cao, X.; Lin, M. A photonic-microfluidic integrated device for reliable fluorescence detection and counting. Electrophoresis 2012, 33, 3236–3244. [Google Scholar] [CrossRef] [PubMed]
- Watts, B.R.; Zhang, Z.; Xu, C.Q.; Cao, X.; Lin, M. Integration of optical components on-chip for scattering and fluorescence detection in an optofluidic device. Biomed. Opt. Express 2012, 3, 2784–2793. [Google Scholar] [CrossRef] [PubMed]
- Watts, B.R.; Zhang, Z.; Xu, C.Q.; Cao, X.; Lin, M. A method for detecting forward scattering signals on-chip with a photonic-microfluidic integrated device. Biomed. Opt. Express 2013, 4, 1051–1060. [Google Scholar] [CrossRef] [PubMed]
- Ungerbock, B.; Charwat, V.; Ertl, P.; Mayr, T. Microfluidic oxygen imaging using integrated optical sensor layers and a color camera. Lab Chip 2013, 13, 1593–1601. [Google Scholar] [CrossRef] [PubMed]
- Yang, S.; Undar, A.; Zahn, J.D. A microfluidic device for continuous, real time blood plasma separation. Lab Chip 2006, 6, 871–880. [Google Scholar] [CrossRef] [PubMed]
- Eyer, K.; Root, K.; Robinson, T.; Dittrich, P.S. A simple low-cost method to enhance luminescence and fluorescence signals in PDMS-based microfluidic devices. RSC Adv. 2015, 5, 12511–12516. [Google Scholar] [CrossRef]
- Kettlitz, S.W.; Valouch, S.; Sittel, W.; Lemmer, U. Flexible planar microfluidic chip employing a light emitting diode and a PIN-photodiode for portable flow cytometers. Lab Chip 2012, 12, 197–203. [Google Scholar] [CrossRef] [PubMed]
- Hoera, C.; Ohla, S.; Shu, Z.; Beckert, E.; Nagl, S.; Belder, D. An integrated microfluidic chip enabling control and spatially resolved monitoring of temperature in micro flow reactors. Anal. Bioanal. Chem. 2014, 407, 387–396. [Google Scholar] [CrossRef] [PubMed]
- Nedbal, J.; Visitkul, V.; Ortiz-Zapater, E.; Weitsman, G.; Chana, P.; Matthews, D.R.; Ng, T.; Ameer-Beg, S.M. Time-domain microfluidic fluorescence lifetime flow cytometry for high-throughput Förster resonance energy transfer screening. Cytom. A 2015, 87, 104–118. [Google Scholar] [CrossRef] [PubMed]
- Liu, H.; Crooks, R.M. Three-dimensional paper microfluidic devices assembled using the principles of origami. J. Am. Chem. Soc. 2011, 133, 17564–17566. [Google Scholar] [CrossRef] [PubMed]
- Nge, P.N.; Rogers, C.I.; Woolley, A.T. Advances in microfluidic materials, functions, integration, and applications. Chem. Rev. 2013, 113, 2550–2583. [Google Scholar] [CrossRef] [PubMed]
- Zhang, Z.; Zhao, P.; Xiao, G.; Watts, B.R.; Xu, C. Sealing SU-8 microfluidic channels using PDMS. Biomicrofluidics 2011, 5, 1–8. [Google Scholar] [CrossRef] [PubMed]
- Ren, Y.; Huang, S.H.; Mosser, S.; Heuschkel, M.O.; Bertsch, A.; Fraering, P.C.; Chen, J.J.J.; Renaud, P. A Simple and Reliable PDMS and SU-8 Irreversible Bonding Method and Its Application on a Microfluidic-MEA Device for Neuroscience Research. Micromachines 2015, 6, 1923–1934. [Google Scholar] [CrossRef]
- Yang, C.C.; Wen, R.C.; Shen, C.R.; Yao, D.J. Using a microfluidic gradient generator to characterize BG-11 medium for the growth of cyanobacteria synechococcus elongatus PCC7942. Micromachines 2015, 6, 1755–1767. [Google Scholar] [CrossRef]
- Chen, H.T.; Wang, Y.N. Optical microflow cytometer for particle counting, sizing and fluorescence detection. Microfluid. Nanofluid. 2009, 6, 529–537. [Google Scholar] [CrossRef]


| Terminology | Main Device Used | Description |
|---|---|---|
| Microflow cytometer | Microfluidic device | Integrated optics are not necessary |
| Optofluidic microflow cytometer | Optofluidic device | Integrated optics are necessary |
| Flow Control | Light Guide | Light Collection | Collected Signal |
|---|---|---|---|
| 2D hydrodynamic focusing | Free-space/on-chip | Free-space/on-chip | Fluorescence collection (FL) |
| 3D hydrodynamic focusing | Free-space/on-chip | Free-space/on-chip | Side scattered light (SSC) |
| Other methods | Free-space | Free-space | Forward scattered light (FSC) |
| Flow Control | Beam Shaping | Light Collection | Sample | CV of SSC (%) | CV of FL (%) | Throughput (Cells or Particles/s) | Ref. |
|---|---|---|---|---|---|---|---|
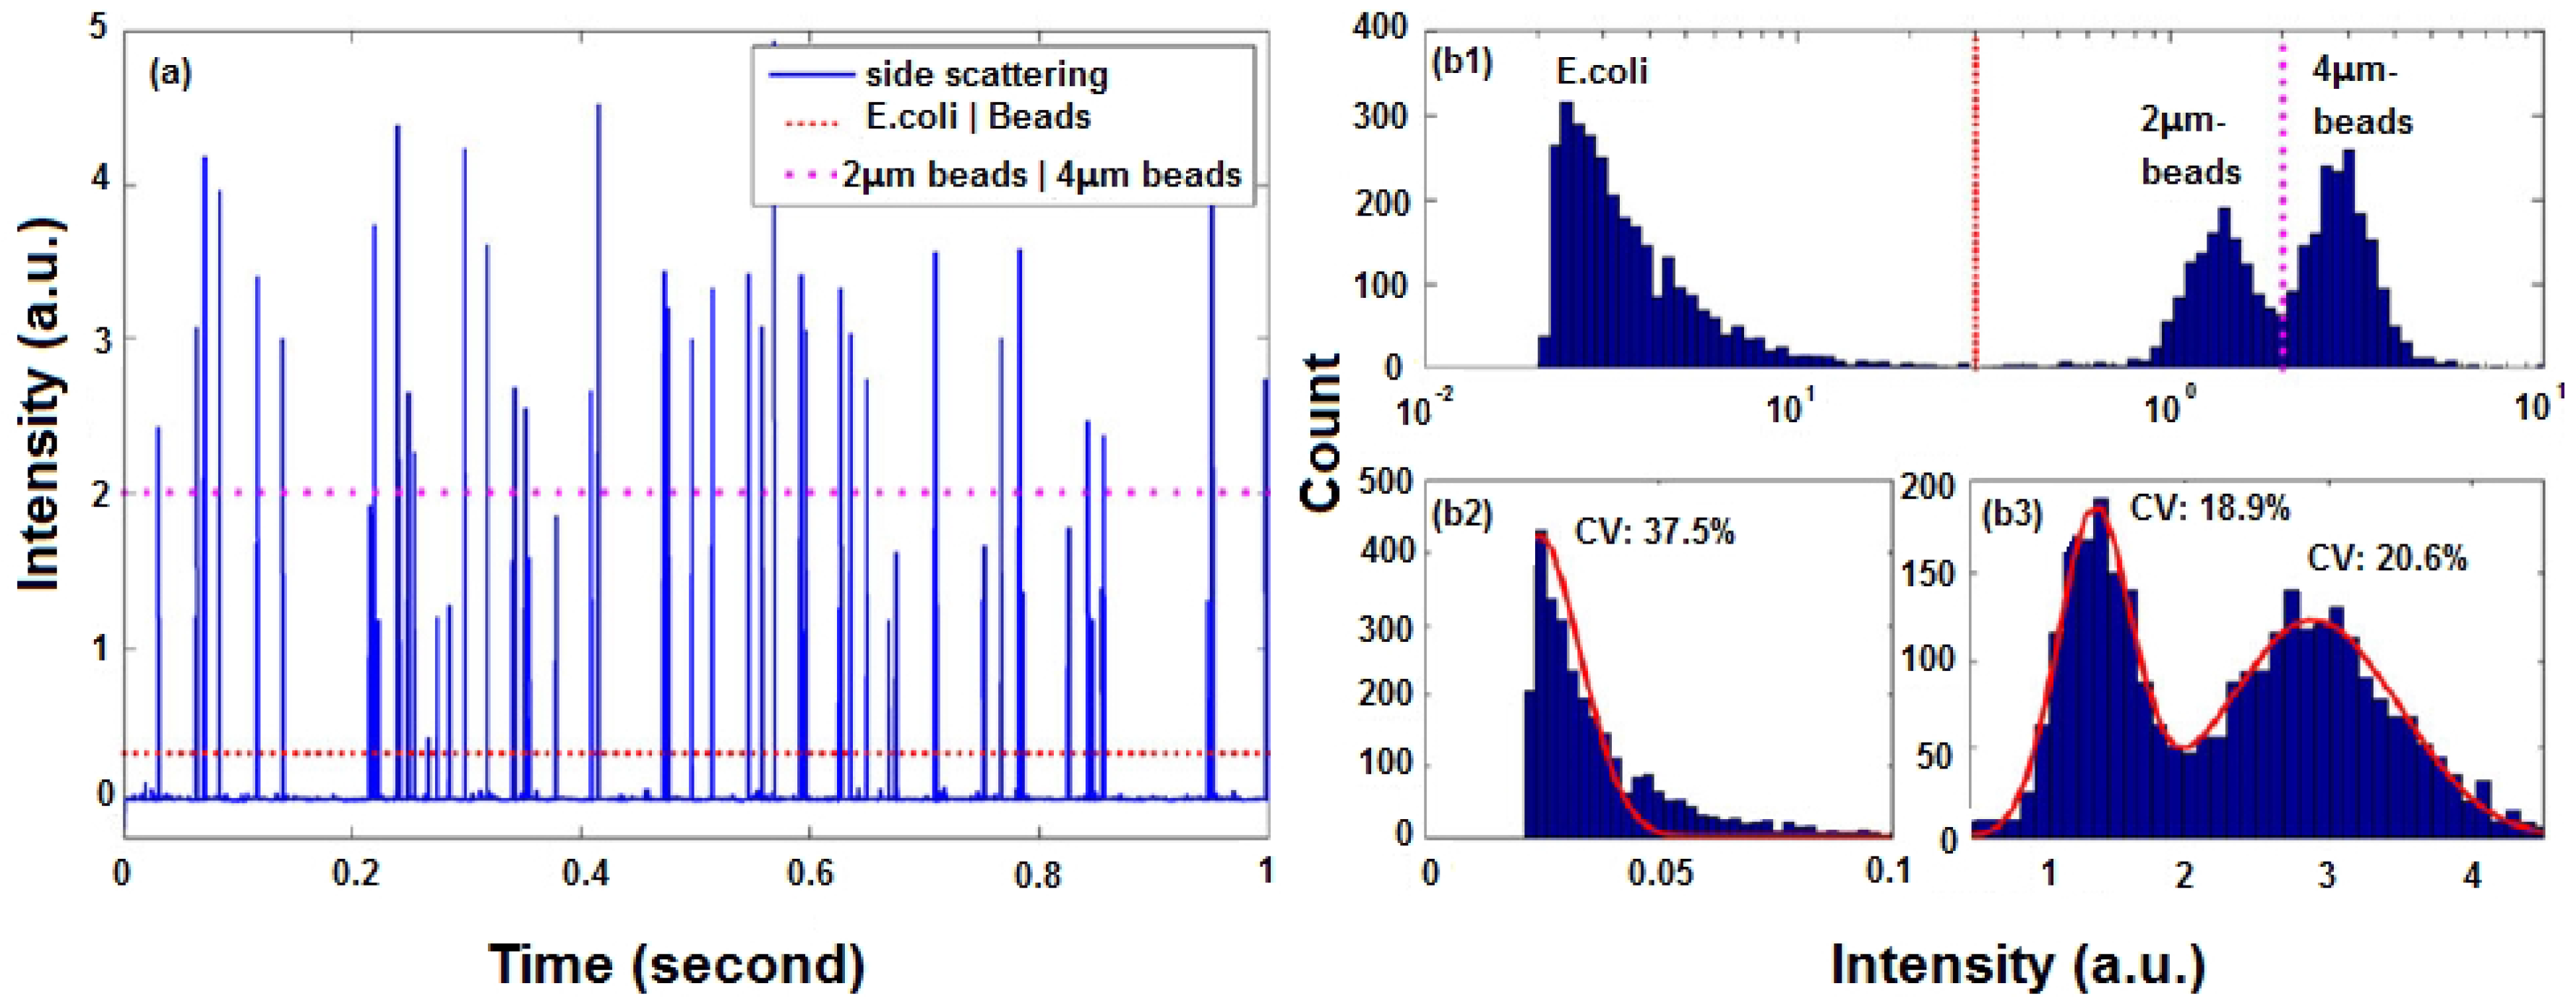
| 2D HF | Yes | Free-space | E. coli | 37.5 | – | ∼101 | [20] |
| 2D HF | Yes | On-chip | 2 µm beads | 11 | – | ∼30 | [55] |
| 2D HF | Yes | On-chip | 15 µm beads | 12 | 17.1 | ∼100 | [2] |
| 2D HF | No | Free-space | Labeled E. coli | 36.2 | 30.7 | ∼350 | [24] |
| 2D HF | No | Free-space | 1 µm beads | 14.95 | 24.73 | ∼83 | [24] |
| 2D HF | Yes | Free-space | 2.5 µm beads | – | 9.0 | ∼28 | [54] |
| 3D HF | No | On-chip | 10 µm beads | 12 | 8.3 | - | [31] |
| 3D HF (cascade focusing) | No | Free-space | 8.12 µm beads | – | 3.2 | – | [29] |
| 3D HF (microfluidic drifting) | No | Free-space | 1.9 µm beads | – | 2.4 | ∼2163 | [38] |
| 3D HF (microfluidic drifting) | No | Free-space | HEK 293 cells | – | 13.4 | – | [38] |
| 3D HF (cascade focusing) | No | Free-space | Beads | – | 3.0 | – | [28] |
| 3D SSAW | No | Free-space | HL–60 cells | – | 22.0 | – | [41] |
| 3D SSAW | No | Free-space | 7 µm beads | – | 19.4 | ∼772 | [41] |
| 3D SSAW | No | Free-space | 10 µm beads | – | 10.9 | ∼537 | [41] |
© 2016 by the authors. Licensee MDPI, Basel, Switzerland. This article is an open access article distributed under the terms and conditions of the Creative Commons by Attribution (CC-BY) license ( http://creativecommons.org/licenses/by/4.0/).
Share and Cite
Zhang, Y.; Watts, B.R.; Guo, T.; Zhang, Z.; Xu, C.; Fang, Q. Optofluidic Device Based Microflow Cytometers for Particle/Cell Detection: A Review. Micromachines 2016, 7, 70. https://doi.org/10.3390/mi7040070
Zhang Y, Watts BR, Guo T, Zhang Z, Xu C, Fang Q. Optofluidic Device Based Microflow Cytometers for Particle/Cell Detection: A Review. Micromachines. 2016; 7(4):70. https://doi.org/10.3390/mi7040070
Chicago/Turabian StyleZhang, Yushan, Benjamin R. Watts, Tianyi Guo, Zhiyi Zhang, Changqing Xu, and Qiyin Fang. 2016. "Optofluidic Device Based Microflow Cytometers for Particle/Cell Detection: A Review" Micromachines 7, no. 4: 70. https://doi.org/10.3390/mi7040070
APA StyleZhang, Y., Watts, B. R., Guo, T., Zhang, Z., Xu, C., & Fang, Q. (2016). Optofluidic Device Based Microflow Cytometers for Particle/Cell Detection: A Review. Micromachines, 7(4), 70. https://doi.org/10.3390/mi7040070