Abstract
Single-cell electrical properties (e.g., specific membrane capacitance (Cspecific membrane) and cytoplasm conductivity (σcytoplasm)) have been regarded as potential label-free biophysical markers for the evaluation of cellular status. However, whether there exist correlations between these biophysical markers and cellular status (e.g., membrane-associate protein expression) is still unknown. To further validate the utility of single-cell electrical properties in cell type classification, Cspecific membrane and σcytoplasm of single PC-3 cells with membrane staining and/or fixation were analyzed and compared in this study. Four subtypes of PC-3 cells were prepared: untreated PC-3 cells, PC-3 cells with anti-EpCAM staining, PC-3 cells with fixation, and fixed PC-3 cells with anti-EpCAM staining. In experiments, suspended single cells were aspirated through microfluidic constriction channels with raw impedance data quantified and translated to Cspecific membrane and σcytoplasm. As to experimental results, significant differences in Cspecific membrane were observed for both live and fixed PC-3 cells with and without membrane staining, indicating that membrane staining proteins can contribute to electrical properties of cellular membranes. In addition, a significant decrease in σcytoplasm was located for PC-3 cells with and without fixation, suggesting that cytoplasm protein crosslinking during the fixation process can alter the cytoplasm conductivity. Overall, we have demonstrated how to classify single cells based on cellular electrical properties.
1. Introduction
Single-cell electrical properties (e.g., specific membrane capacitance (Cspecific membrane) and cytoplasm conductivity (σcytoplasm)) are promising biophysical markers for understanding cellular functions and status [1,2,3,4], enabling cell type classification (e.g., tumor cells [5,6,7,8,9], stem cells [10], red blood cells [11,12], and white blood cells [13,14]).
Techniques capable of characterizing cellular Cspecific membrane and σcytoplasm include patch clamping, electrorotation, and micro electrical impedance spectroscopy (μEIS) [4]. Although powerful, these techniques cannot obtain statistically meaningful data (data points from hundreds and even thousands of cells for each cell type) due to limited assay throughput (e.g., 20 cells per cell type based on electrorotation [15] and 23 cells per cell type based on μEIS [16]).
By combining μEIS with flow cytometry, Renaud et al. [17,18,19,20] and Morgan et al. [21,22,23] demonstrated the high-throughput characterization of single-cell electrical properties. Due to the lack of corresponding electrical models, raw size-dependent electrical data cannot be translated to size-independent intrinsic electrical parameters, limiting their functionalities in cell status evaluation and cell type classification.
Recently, we proposed microfluidic platforms to aspirate single cells through the constriction channel (cross sectional area smaller than cells) continuously with two-frequency impedance data sampled and translated to Cspecific membrane and σcytoplasm based on equivalent lumped [24] or distributed [25] electrical models. Leveraging these platforms, intrinsic cellular electrical properties of hundreds of single cells were obtained, enabling the classification of wild-type tumor cells and their counterparts with single oncogenes under regulation [6]. However, whether there exist correlations between label-free biophysical markers (e.g., Cspecific membrane and σcytoplasm) and cellular biochemical properties (e.g., membrane-associate protein expression) was still unknown.
To address this issue, in this study, the electrical properties of untreated and treated human prostate tumor cells (PC-3) (e.g., untreated PC-3 cells (GNS&NF), PC-3 cells with anti-EpCAM staining (GS&NF), PC-3 cells with fixation (GNS&F), and fixed PC-3 cells with anti-EpCAM staining (GS&F)) were characterized and compared (see Figure 1).
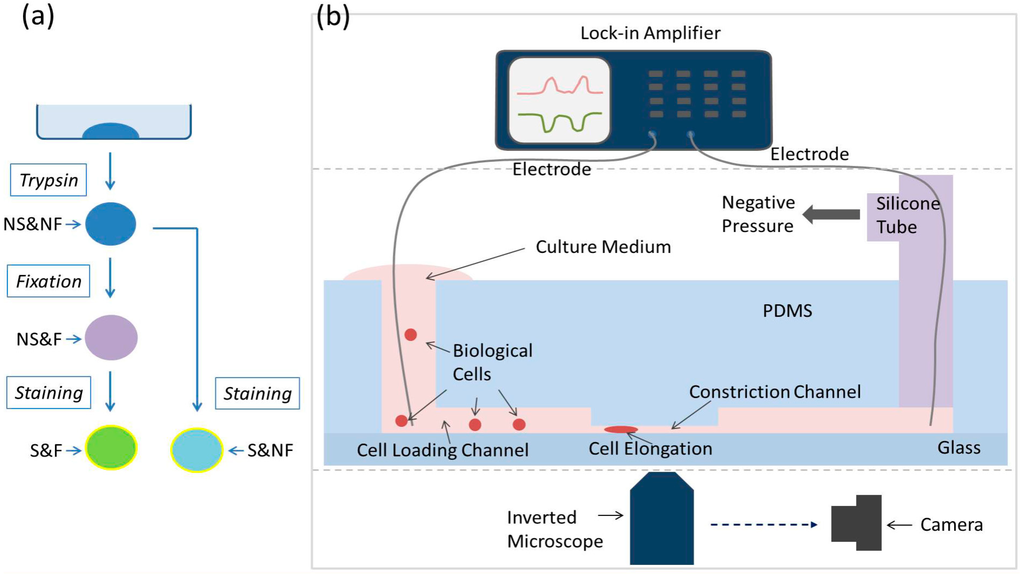
Figure 1.
(a) The cell preparation flow chart where four sub-types of human prostate tumor cells (PC-3) were prepared: untreated PC-3 cells (GNS&NF), PC-3 cells with anti-EpCAM staining (GS&NF), PC-3 cells with fixation (GNS&F), and fixed PC-3 cells with anti-EpCAM/FITC staining (GS&F). (b) Schematic of the microfluidic system for single-cell electrical property characterization where single cells are aspirated continuously through the constriction channel with impedance data and cell elongation length measured and translated to Cspecific membrane and σcytoplasm.
2. Materials and Methods
2.1. Materials
Unless otherwise indicated, all cell-culture reagents were purchased from Life Technologies Corporation (Carlsbad, CA, USA). Materials required for device fabrication included a SU-8 photoresist (MicroChem Corporation, Newton, MA, USA) and a 184 silicone elastomer (Dow Corning Corporation, Midland, MI, USA).
2.2. Cell Culture, Membrane Staining, and Fixation
Human prostate tumor cells (PC-3) were cultured with RPMI-1640 medium supplemented with 10% fetal bovine serum and 1% penicillin and streptomycin. As shown in Figure 1a, untreated PC-3 cells were harvested by trypsinization to form suspended single cells, which were then fixed (mixture with 0.1% paraformaldehyde for 3 min) and/or stained with anti-EpCAM/FITC (mixture with 0.05 μg/μL anti-Human EpCAM Alexa Fluor 488 (ebioscience, cat. 11-5791-82) for 30 min).
2.3. Device Fabrication and Operation
The two-layer polydimethylsiloxane (PDMS) device (constriction channel cross-section area of 10 μm × 10 μm) was replicated from a double-layer SU-8 mold based on conventional lithography. Briefly, the first layer of SU-8 5 was to form the constriction channel (10 μm) and the second layer of SU-8 25 was to form the cell loading channel (25 μm). PDMS prepolymer and curing agent were mixed, degassed, poured on channel masters, and baked in an oven. PDMS channels were then peeled from the SU-8 masters with reservoir holes punched through and bonded to a glass slide.
The operation process was summarized as follows (see Figure 1b). The cell samples were pipetted to the entrance of the cell loading channel of the microfluidic device, where a negative pressure of 1 kPa was applied to aspirate cells continuously through the constriction channel with two-frequency impedance data (1 kHz + 100 kHz) and images recorded.
2.4. Data Analysis
The detailed procedures for data analysis were described previously [24,25], and are summarized as follows. Raw impedance data at 1 kHz were used to evaluate the sealing properties of deformed cells with constriction channel walls, and raw impedance data at 100 kHz were used to quantify equivalent cellular membrane capacitance and cytoplasm resistance, respectively. By combining cell elongation length during its traveling process within the constriction channel based on image processing, equivalent membrane capacitance and cytoplasm resistance were further translated to Cspecific membrane and σcytoplasm.
2.5. Statistical Analysis
All results were expressed as means ± standard deviations. In the statistical analysis, the Student’s t-test was used for two group comparisons. P < 0.01 was considered statistically significant.
3. Results and Discussion
The experimental results of fixed PC-3 cells with and without anti-EpCAM staining (GNS&F vs. GS&F) were first compared since the only difference between these two sub-cell types is the stained membrane protein (anti-Human EpCAM Alexa Fluor 488), which selectively binds EpCAM expressed in PC-3 cell membranes. There is no disturbance of endocytosis and other cytoplasm activities due to the fixation of PC-3 cells. Figure 2a shows the bright field and fluorescent images of fixed and stained PC-3 cells (GS&F), which indicated the existence of anti-Human EpCAM Alexa Fluor 488.
Figure 2b shows a scatterplot of Cspecific membrane vs. σcytoplasm for GNS&F (ncell = 208) and GS&F (ncell = 252) cells, which were quantified as 2.16 ± 0.72 vs. 1.66 ± 0.46 μF/cm2 of Cspecific membrane and 0.59 ± 0.10 vs. 0.59 ± 0.10 S/m of σcytoplasm (Figure 2c). No significant difference in σcytoplasm was observed, indicating that for fixed PC-3 cells, surface antigen staining cannot alter cytoplasm properties. In addition, a significant difference in Cspecific membrane for GNS&F vs. GS&F cells was observed, indicating the contribution of anti-EpCAM on cellular membrane electrical properties as a correlation between a specific membrane protein and Cspecific membrane.
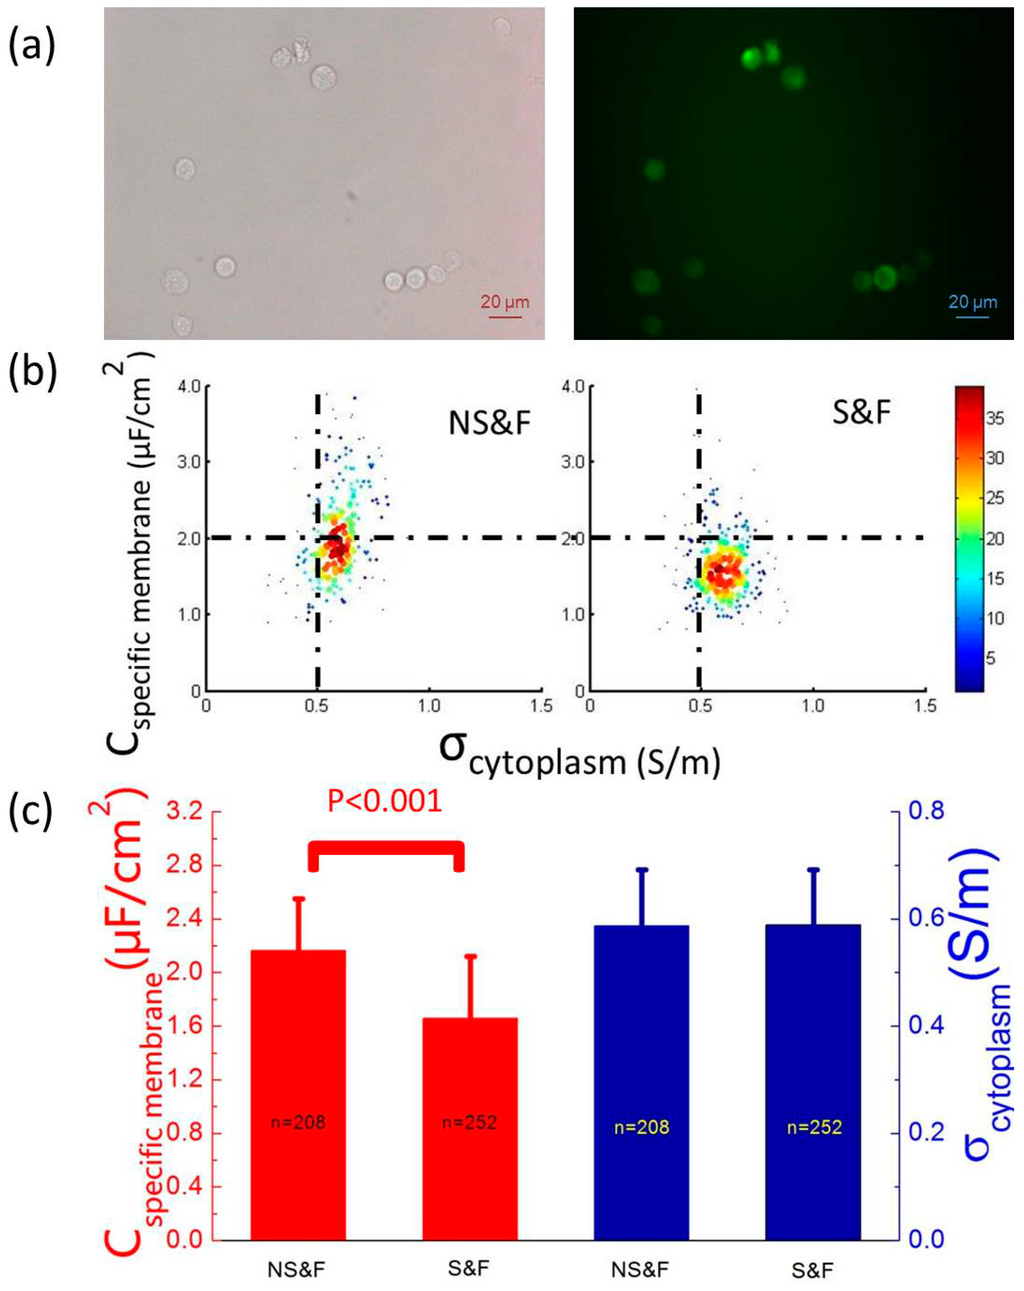
Figure 2.
(a) The bright field and fluorescent images of fixed and stained PC-3 cells (GS&F), which confirmed the existence of anti-Human EpCAM Alexa Fluor 488. (b) A scatterplot of Cspecific membrane vs. σcytoplasm for GNS&F (ncell = 208) and GS&F (ncell = 252) cells, which were quantified as 2.16 ± 0.72 vs. 1.66 ± 0.46 μF/cm2 of Cspecific membrane and 0.59 ± 0.10 vs. 0.59 ± 0.10 S/m of σcytoplasm, respectively. (c) No significant difference of σcytoplasm between GNS&F and GS&F was observed, suggesting that for fixed PC-3 cells, surface antigen staining cannot alter cytoplasm properties. In addition, a significant difference in Cspecific membrane was observed, indicating the contribution of anti-Human EpCAM Alexa Fluor 488 on cellular membrane electrical properties as a correlation between a specific type of membrane proteins and Cspecific membrane.
The experimental results of live PC-3 cells with and without anti-EpCAM staining (GNS&NF vs. GS&NF) were then compared to investigate the effect of surface antigen staining on electrical properties of live cells. Figure 3a shows the bright field and fluorescent images of stained PC-3 cells without fixation (GS&NF), which suggested the existence of anti-Human EpCAM Alexa Fluor 488.
Figure 3b shows a scatterplot of Cspecific membrane vs. σcytoplasm for GNS&NF (ncell = 415) and GS&NF (ncell = 417) cells, which were quantified as 2.21 ± 0.49 vs. 1.97 ± 0.39 μF/cm2 of Cspecific membrane and 0.77 ± 0.15 vs. 0.90 ± 0.13 S/m of σcytoplasm, respectively (Figure 3c). A significant difference in Cspecific membrane for GNS&NF vs. GS&NF cells was observed, indicating the contribution of anti-EpCAM on Cspecific membrane values. Compared to the difference of Cspecific membrane between GNS&F and GS&F (2.16 ± 0.72 vs. 1.66 ± 0.46 μF/cm2), a smaller difference of Cspecific membrane was observed between GNS&NF and GS&NF (2.21 ± 0.49 vs. 1.97 ± 0.39 μF/cm2), which may result from the endocytosis of anti-EpCAM after binding with surface antigen EpCAM. In addition, a significant difference in σcytoplasm for GNS&NF vs. GS&NF cells was observed, further suggesting the possibility of surface antigen endocytosis and the triggering of the downstream signal pathways [26].
As to the effects of fixation on cellular electrical properties, a significant difference in σcytoplasm (0.77 ± 0.15 vs. 0.59 ± 0.10 S/m) rather than Cspecific membrane (2.21 ± 0.49 vs. 2.16 ± 0.72 μF/cm2) was observed for GNS&NF (ncell = 415) vs. GNS&F (ncell = 208) (see Figure 4). This significant decrease in σcytoplasm of fixed cells compared to live counterparts may result from the crosslinking of cytoplasm proteins in the fixing process, which was consistent with previous results [19].
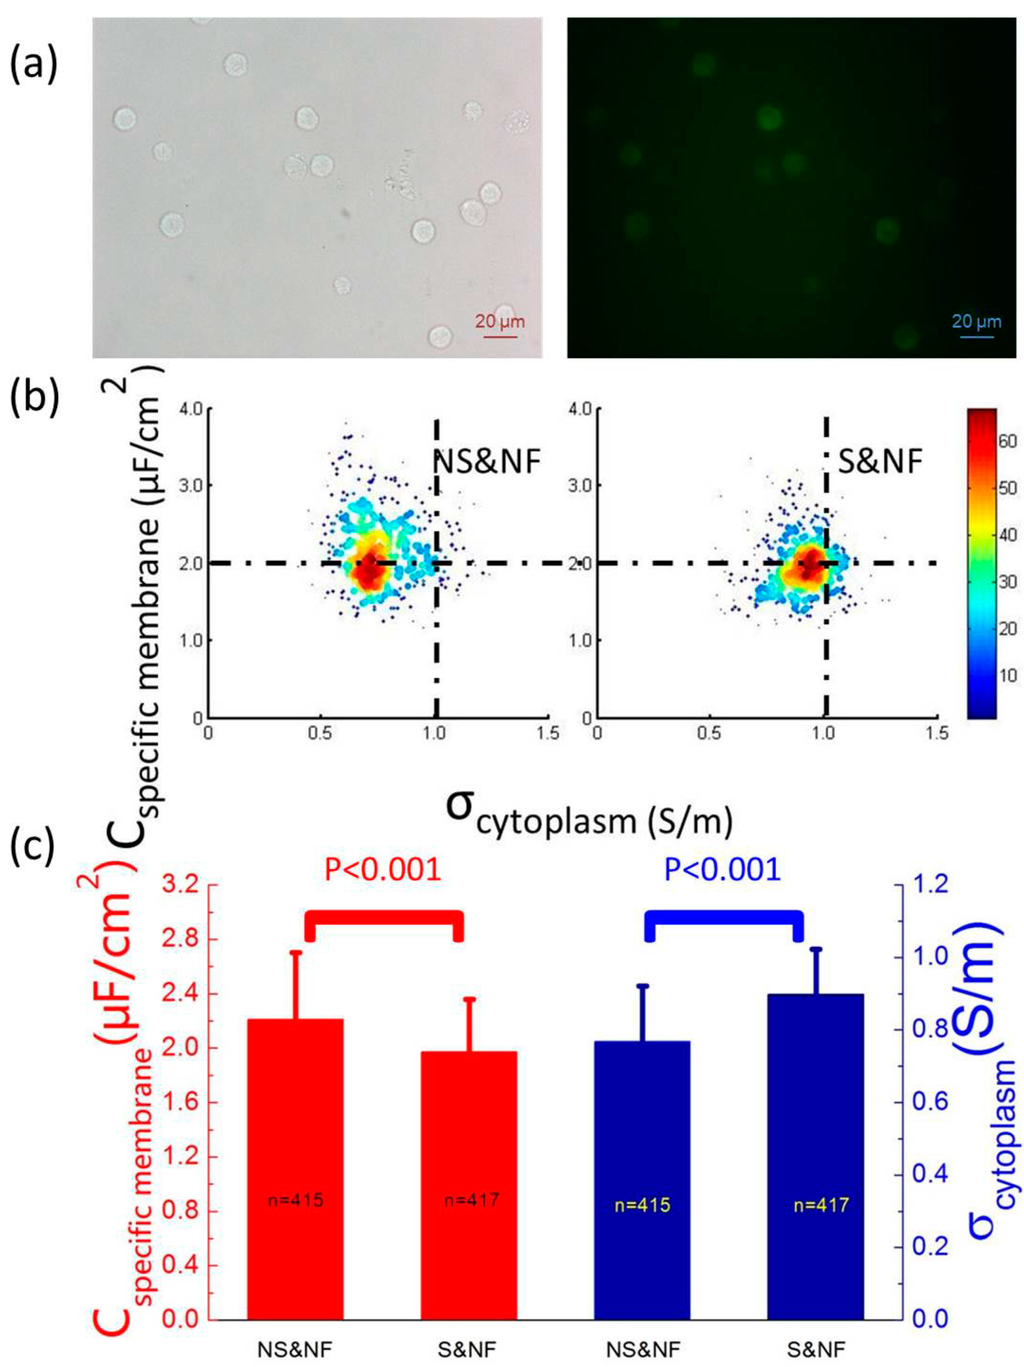
Figure 3.
(a) The bright field and fluorescent images of stained PC-3 cells without fixation (GS&NF), confirming the existence of anti-Human EpCAM Alexa Fluor 488. (b) A scatterplot of Cspecific membrane vs. σcytoplasm for GNS&NF (ncell = 415) and GS&NF (ncell = 417) cells, which were quantified as 2.21 ± 0.49 vs. 1.97 ± 0.39 μF/cm2 of Cspecific membrane and 0.77 ± 0.15 vs. 0.90 ± 0.13 S/m of σcytoplasm, respectively. (c) Significant differences in both Cspecific membrane and σcytoplasm for GNS&NF and GS&NF cells were observed, suggesting the potential contribution of anti-Human EpCAM Alexa Fluor on Cspecific membrane and the possible existence of surface antigen endocytosis of anti-Human EpCAM Alexa Fluor, which may trigger downstream signal pathways in cytoplasm.
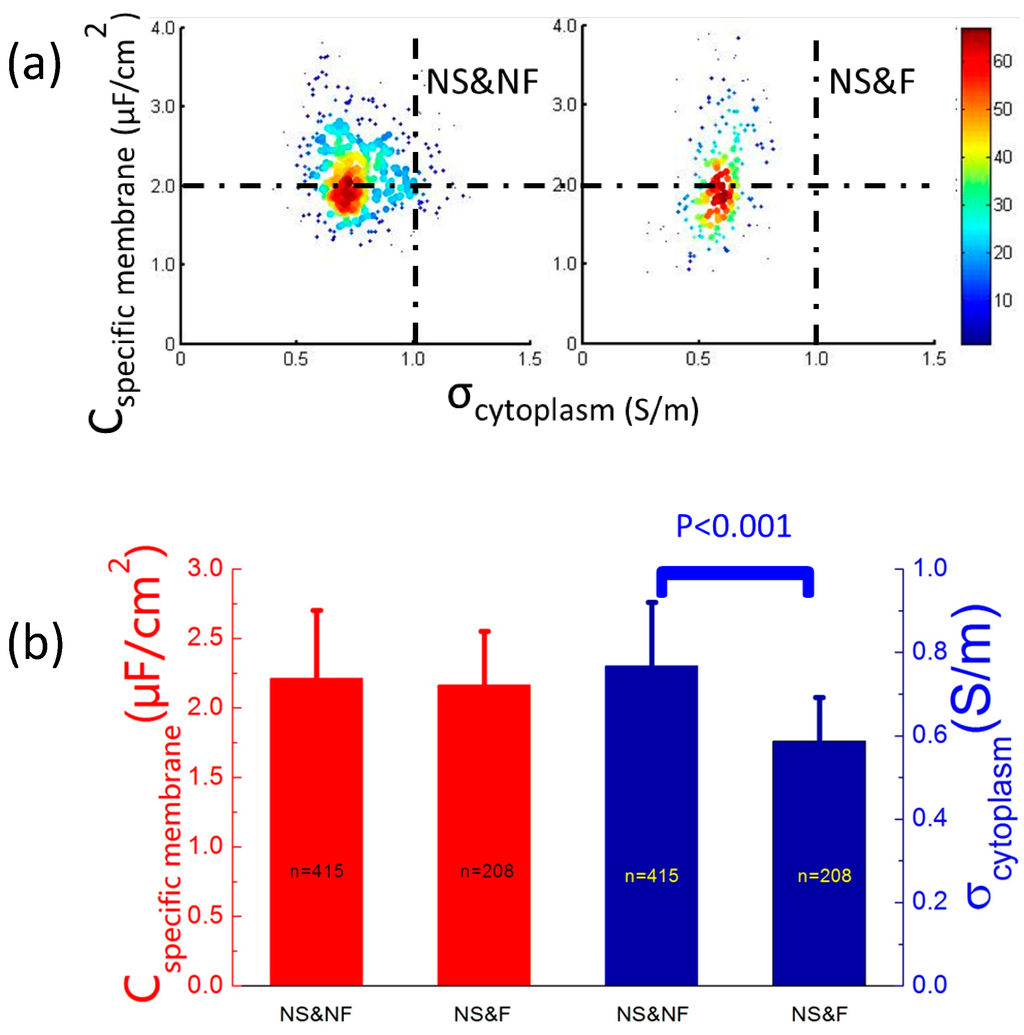
Figure 4.
(a) A scatterplot of Cspecific membrane vs. σcytoplasm for GNS&NF (ncell = 415) and GNS&F (ncell = 208) cells, which were quantified as 2.21 ± 0.49 vs. 2.16 ± 0.72 μF/cm2 of Cspecific membrane and 0.77 ± 0.15 vs. 0.59 ± 0.10 S/m of σcytoplasm, respectively. (b) A significant difference in σcytoplasm rather than Cspecific membrane for GNS&NF vs. GNS&F cells was observed, which may result from the crosslinking of cytoplasm proteins in the fixing process.
4. Conclusions
In summary, this paper reported the electrical properties of four sub-types of PC-3 cells: Cspecific membrane of 2.16 ± 0.72 μF/cm2 and σcytoplasm of 0.59 ± 0.10 S/m for GNS&F cells (ncell = 208), Cspecific membrane of 1.66 ± 0.46 μF/cm2 and σcytoplasm of 0.59 ± 0.10 S/m for GS&F cells (ncell = 252), Cspecific membrane of 2.21 ± 0.49 μF/cm2 and σcytoplasm of 0.77 ± 0.15 S/m for GNS&NF cells (ncell = 415), and Cspecific membrane of 1.97 ± 0.39 μF/cm2 and σcytoplasm of 0.90 ± 0.13 S/m for GS&NF cells (ncell = 417). For GNS&F vs. GS&F, a significant difference was observed only in Cspecific membrane rather than σcytoplasm, as a correlation between anti-Human EpCAM Alexa Fluor and Cspecific membrane. Furthermore, for GNS&NF vs. GS&NF, significant differences in Cspecific membrane and σcytoplasm were observed, indicating the contribution of the anti-Human EpCAM Alexa Fluor 488 on cellular membrane electrical properties and the possible trigger of downstream signal pathways in the process of live cell staining. In addition, for GNS&NF vs. GNS&F, a significant decrease in σcytoplasm was observed, suggesting the potential effect of fixation in cytoplasm protein crosslinking, leading to decreased ion transportation capabilities. On the whole, we have demonstrated how to classify single cells based on cellular electrical properties.
Acknowledgments
The authors would like to acknowledge financial support from the National Basic Research Program of China (973 Program, Grant No. 2014CB744602), the Natural Science Foundation of China (Grant No. 61201077, 61431019 and 81261120561), the National High Technology Research and Development Program of China (863 Program, Grant No. 2014AA093408), the Beijing NOVA Program, and Chang Gung Memorial Hospital in Taiwan (CMRPD2D0041).
Author Contributions
Song-Bin Huang, Yang Zhao, and Deyong Chen designed and conducted experiments; Shing-Lun Liu and Yana Luo conducted cell culture; Tzu-Keng Chiu and Junbo Wang were responsible for data processing; and Jian Chen and Min-Hsien Wu organized the experiments and drafted the manuscript.
Conflicts of Interest
The authors declare no conflict of interest.
References
- Morgan, H.; Sun, T.; Holmes, D.; Gawad, S.; Green, N.G. Single cell dielectric spectroscopy. J. Phys. D Appl. Phys. 2007, 40, 61–70. [Google Scholar] [CrossRef]
- Sun, T.; Morgan, H. Single-cell microfluidic impedance cytometry: A review. Microfluid. Nanofluid. 2010, 8, 423–443. [Google Scholar] [CrossRef]
- Valero, A.; Braschler, T.; Renaud, P. A unified approach to dielectric single cell analysis: Impedance and dielectrophoretic force spectroscopy. Lab Chip 2010, 10, 2216–2225. [Google Scholar] [CrossRef] [PubMed]
- Zheng, Y.; Nguyen, J.; Wei, Y.; Sun, Y. Recent advances in microfluidic techniques for single-cell biophysical characterization. Lab Chip 2013, 13, 2464–2483. [Google Scholar] [CrossRef] [PubMed]
- Liang, X.; Graham, K.A.; Johannessen, A.C.; Costea, D.E.; Labeed, F.H. Human oral cancer cells with increasing tumorigenic abilities exhibit higher effective membrane capacitance. Integr. Biol. 2014, 6, 545–554. [Google Scholar] [CrossRef]
- Zhao, Y.; Zhao, X.T.; Chen, D.Y.; Luo, Y.N.; Jiang, M.; Wei, C.; Long, R.; Yue, W.T.; Wang, J.B.; Chen, J. Tumor cell characterization and classification based on cellular specific membrane capacitance and cytoplasm conductivity. Biosens. Bioelectron. 2014, 57, 245–253. [Google Scholar] [CrossRef] [PubMed]
- Cho, Y.; Kim, H.S.; Frazier, A.B.; Chen, Z.G.; Shin, D.M.; Han, A. Whole-cell impedance analysis for highly and poorly metastatic cancer cells. J. Microelectromechan. Syst. 2009, 18, 808–817. [Google Scholar] [CrossRef]
- Han, K.H.; Han, A.; Frazier, A.B. Microsystems for isolation and electrophysiological analysis of breast cancer cells from blood. Biosens. Bioelectron. 2006, 21, 1907–1914. [Google Scholar] [CrossRef] [PubMed]
- Kang, G.; Kim, Y.-J.; Moon, H.-S.; Lee, J.-W.; Yoo, T.-K.; Park, K.; Lee, J.-H. Discrimination between the human prostate normal cell and cancer cell by using a novel electrical impedance spectroscopy controlling the cross-sectional area of a microfluidic channel. Biomicrofluidics 2013, 7, 044126. [Google Scholar] [CrossRef]
- Song, H.; Wang, Y.; Rosano, J.M.; Prabhakarpandian, B.; Garson, C.; Pant, K.; Lai, E. A microfluidic impedance flow cytometer for identification of differentiation state of stem cells. Lab Chip 2013, 13, 2300–2310. [Google Scholar] [CrossRef] [PubMed]
- Du, E.; Ha, S.; Diez-Silva, M.; Dao, M.; Suresh, S.; Chandrakasan, A.P. Electric impedance microflow cytometry for characterization of cell disease states. Lab Chip 2013, 13, 3903–3909. [Google Scholar] [CrossRef] [PubMed]
- Zheng, Y.; Shojaei-Baghini, E.; Azad, A.; Wang, C.; Sun, Y. High-throughput biophysical measurement of human red blood cells. Lab Chip 2012, 12, 2560–2567. [Google Scholar] [CrossRef] [PubMed]
- Watkins, N.N.; Hassan, U.; Damhorst, G.; Ni, H.; Vaid, A.; Rodriguez, W.; Bashir, R. Microfluidic CD4+ and CD8+ T lymphocyte counters for point-of-care HIV diagnostics using whole blood. Sci. Transl. Med. 2013, 5, 214ra170. [Google Scholar] [CrossRef] [PubMed]
- Han, X.; van Berkel, C.; Gwyer, J.; Capretto, L.; Morgan, H. Microfluidic lysis of human blood for leukocyte analysis using single cell impedance cytometry. Anal. Chem. 2012, 84, 1070–1075. [Google Scholar] [CrossRef] [PubMed]
- Becker, F.F.; Wang, X.B.; Huang, Y.; Pethig, R.; Vykoukal, J.; Gascoyne, P.R.C. Separation of human breast-cancer cells from blood by differential dielectric affinity. Proc. Natl. Acad. Sci. USA 1995, 92, 860–864. [Google Scholar] [CrossRef] [PubMed]
- Tan, Q.; Ferrier, G.A.; Chen, B.K.; Wang, C.; Sun, Y. Quantification of the specific membrane capacitance of single cells using a microfluidic device and impedance spectroscopy measurement. Biomicrofluidics 2012, 6, 034112. [Google Scholar] [CrossRef]
- Gawad, S.; Schild, L.; Renaud, P. Micromachined impedance spectroscopy flow cytometer for cell analysis and particle sizing. Lab Chip 2001, 1, 76–82. [Google Scholar] [CrossRef] [PubMed]
- Gawad, S.; Cheung, K.; Seger, U.; Bertsch, A.; Renaud, P. Dielectric spectroscopy in a micromachined flow cytometer: Theoretical and practical considerations. Lab Chip 2004, 4, 241–251. [Google Scholar] [CrossRef] [PubMed]
- Cheung, K.; Gawad, S.; Renaud, P. Impedance spectroscopy flow cytometry: On-chip label-free cell differentiation. Cytom. Part A 2005, 65A, 124–132. [Google Scholar] [CrossRef]
- Shaker, M.; Colella, L.; Caselli, F.; Bisegna, P.; Renaud, P. An impedance-based flow microcytometer for single cell morphology discrimination. Lab Chip 2014, 14, 2548–2555. [Google Scholar] [CrossRef] [PubMed]
- Holmes, D.; Pettigrew, D.; Reccius, C.H.; Gwyer, J.D.; van Berkel, C.; Holloway, J.; Davies, D.E.; Morgan, H. Leukocyte analysis and differentiation using high speed microfluidic single cell impedance cytometry. Lab Chip 2009, 9, 2881–2889. [Google Scholar] [CrossRef] [PubMed]
- Holmes, D.; Morgan, H. Single cell impedance cytometry for identification and counting of CD4 T-cells in human blood using impedance labels. Anal. Chem. 2010, 82, 1455–1461. [Google Scholar] [CrossRef] [PubMed]
- Barat, D.; Spencer, D.; Benazzi, G.; Mowlem, M.C.; Morgan, H. Simultaneous high speed optical and impedance analysis of single particles with a microfluidic cytometer. Lab Chip 2012, 12, 118–126. [Google Scholar] [CrossRef]
- Zhao, Y.; Chen, D.; Li, H.; Luo, Y.; Deng, B.; Huang, S.B.; Chiu, T.K.; Wu, M.H.; Long, R.; Hu, H.; et al. A microfluidic system enabling continuous characterization of specific membrane capacitance and cytoplasm conductivity of single cells in suspension. Biosens. Bioelectron. 2013, 43C, 304–307. [Google Scholar] [CrossRef] [PubMed]
- Zhao, Y.; Chen, D.; Luo, Y.; Li, H.; Deng, B.; Huang, S.-B.; Chiu, T.-K.; Wu, M.-H.; Long, R.; Hu, H.; et al. A microfluidic system for cell type classification based on cellular size-independent electrical properties. Lab Chip 2013, 13, 2272–2277. [Google Scholar] [CrossRef] [PubMed]
- Schnell, U.; Cirulli, V.; Giepmans, B.N. Epcam: Structure and function in health and disease. Biochim. Biophys. Acta Biomembr. 2013, 1828, 1989–2001. [Google Scholar] [CrossRef]
© 2015 by the authors; licensee MDPI, Basel, Switzerland. This article is an open access article distributed under the terms and conditions of the Creative Commons Attribution license (http://creativecommons.org/licenses/by/4.0/).