1. Introduction
MEMS are a promising platform for next generation sensors and actuators. Impressive developments in recent years have been achieved and the results are seen in industrial applications. Despite a substantial amount of research in the field, there are still many challenges in our understanding of, and ability to control, energy dissipation in MEMS. This deficiency in MEMS engineering limits the performance and reliability of current devices. It is also a significant problem in the developing field of non-destructive testing.
Analytical and finite element methods can be used to calculate MEMS actuators stiffness, natural frequency, pull-in voltage, and the magnitude and waveform of their actuation voltage or current. Our ability to estimate those parameters has seen marked improvement in recent years to the point where we can use those modeling tools to effectively design MEMS. On the other hand, similar improvements have not been achieved for damping in MEMS. The dominant method to estimate the damping parameters is to fabricate and test the system then extract estimates of damping from test results. Even then, there are significant challenges in standardization, accuracy, and precision of the experimental equipment and methods used to obtain the device response and the analytical methods used to extract damping estimates from those measurements.
Typically, damping in MEMS is reported in terms of the quality factor
Q, the ratio of energy loss per cycle of free oscillations to the total system energy. Castellini
et al. [
1] presented a flexible work station for characterization of MEMS devices including the measurement of
Q. The key features of their system are Laser Doppler Vibrometer (LDV), micro-positioners, digital signal processing, image acquisition and processing. Lübbe
et al. [
2] measured the quality factor for AFM probes from ultra-vacuum to normal pressure using a least-squares fit of the displacement frequency-response curve to the transfer function of a linear oscillator. Kuter-Arnebeck
et al. [
3] estimated the quality factor of MEMS resonators using least-squares fits of the displacement and velocity frequency-response curves to thermal noise measured using a LDV. Experimentally measured time series of the ring-down response to initial excitation were also used to estimate the quality factor by means of the logarithmic decrement method.
Cantilever-based MEMS have been widely implemented as mass, gas, and chemical sensors due to their high sensitivity. Furthermore, they are commonly used as actuators (probes) in atomic force microscopy. Therefore, we consider a typical micro-cantilever actuator in our analysis.
The purpose of this work is to initiate the development of a standard experimental procedure and analytical techniques to estimate Q for MEMS devices. Towards that end, we test the response of MEMS cantilever beam actuators to excitation in air and under soft vacuum; while the actuator is free standing and while its tip is in contact with the substrate. We also analyze the relative merits and drawbacks, as far as accuracy and precision are concerned, of standard and emerging Q estimation techniques.
2. Experimental Section
2.1. Experimental Set-up
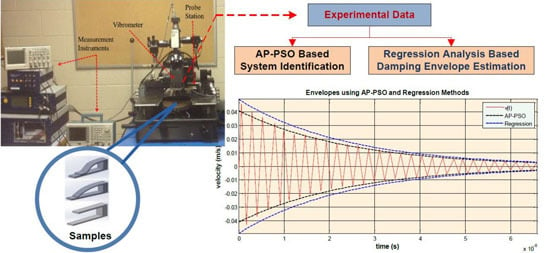
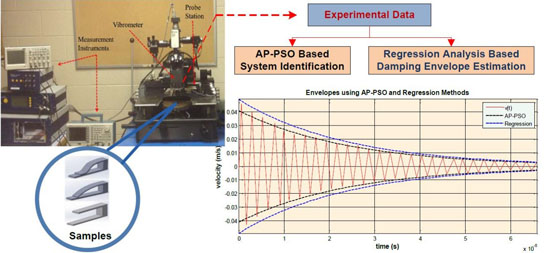
The experimental work station, shown in
Figure 1, is composed of:
- (1)
A scanning LDV (MSV-400) (Polytec GmbH, Waldbronn, Germany) [
4].
- (2)
A probe station used for positioning of the sample and vacuum chamber;
- (3)
Electrical drive and measurement instrumentation.
Figure 1.
Experimental set-up.
Figure 1.
Experimental set-up.
Vibrometers are precision transducers used for non-contact measurement of displacement and velocity in time-domain. The vibrometer used in the experiments described here can achieve pico-meter resolution and up to 20 MHz bandwidth. The work station was set-up in order to obtain the dynamic response of a point on a MEMS device.
Due to the small foot-print of MEMS, it is necessary to use non-contact methods to measure their motions. In addition to the optical methods employed by LDVs, it also possible to measure MEMS motions using inductive coupling. For example, Marioli
et al. [
5] and Andó
et al. [
6] used inductive coupling and inductive-capacitive (LC) resonant architecture in a hybrid MEMS to measure the temperature in harsh environments.
The vacuum system includes a vacuum chamber, vacuum pump and control devices. Experiments were conducted while the actuator was placed inside the chamber and pressure was pumped down to approximately 1 Torr.
2.2. Specimens
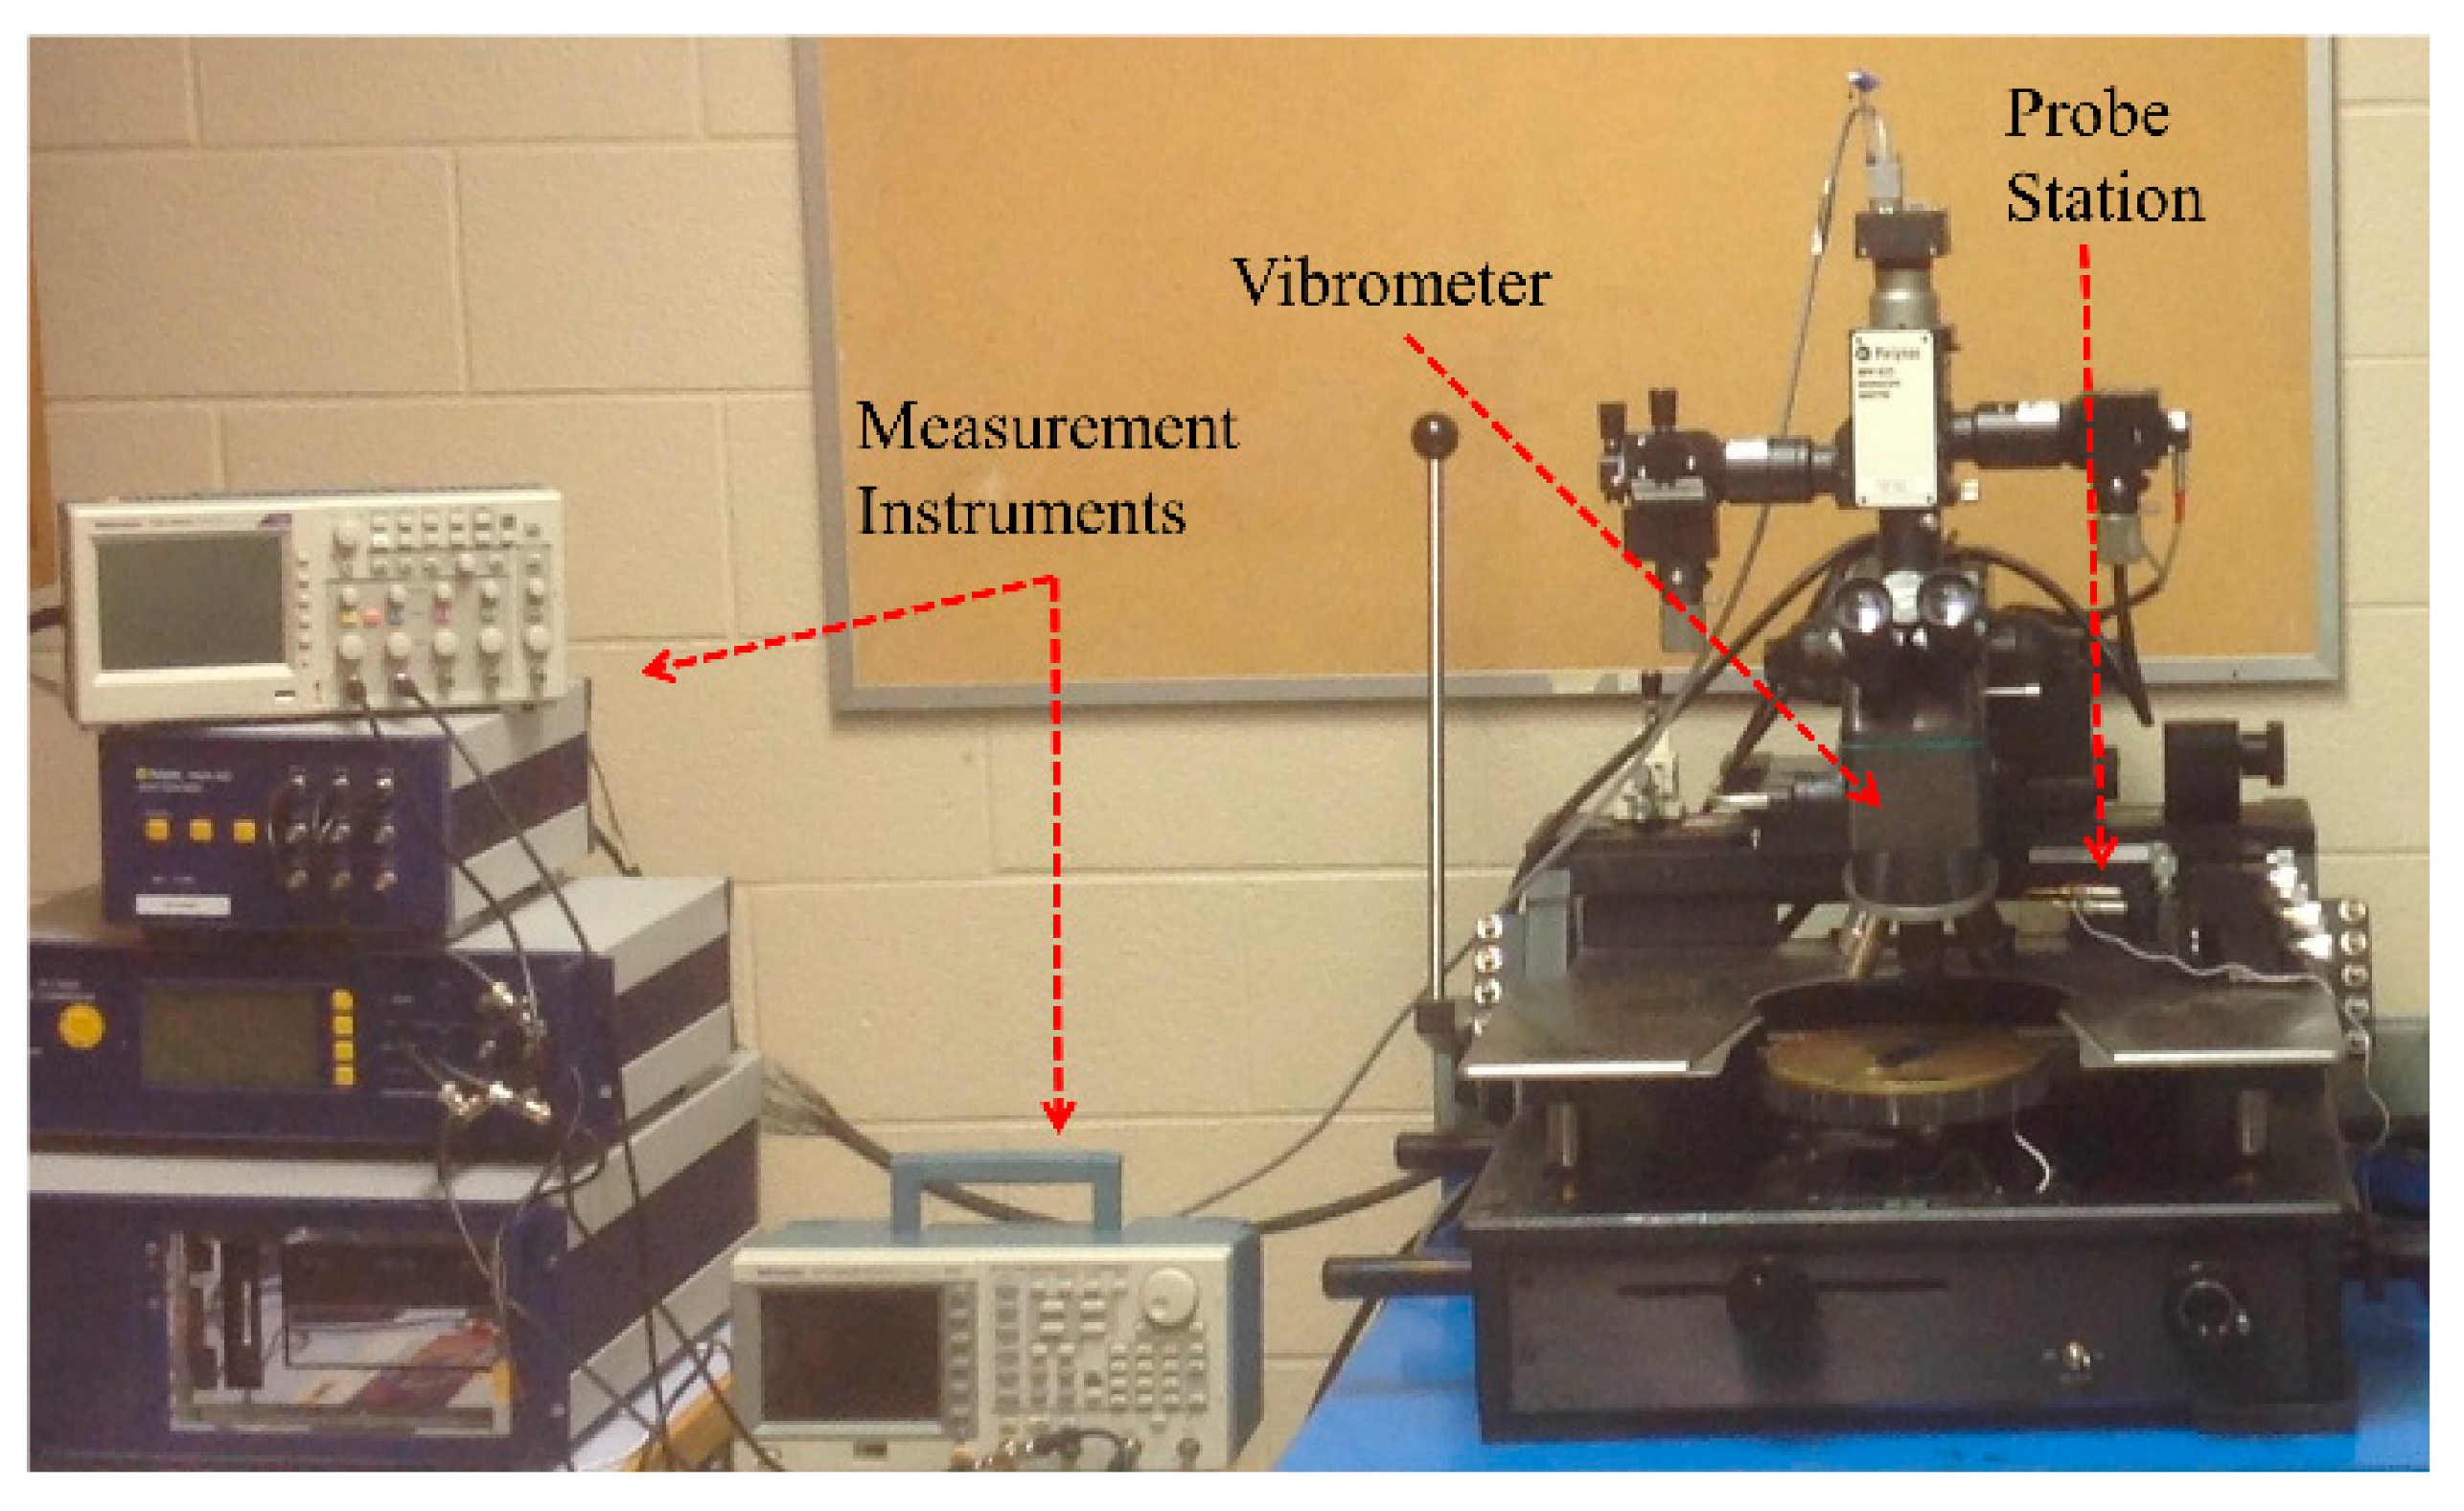
Experiments were conducted on number of electrostatic MEMS cantilever beam actuators. Each actuator was tested in the three configurations:
- (1).
Free standing,
Figure 2a: where the actuation voltage is set below primary pull-in voltage.
- (2).
Arc-shaped,
Figure 2b: where the actuation voltage is set above primary pull-in but below secondary pull-in voltages resulting in the actuator tip adhering to the substrate along a narrow line.
- (3).
s-Shaped,
Figure 2c: where the actuation voltage is set above secondary pull-in voltage, resulting in the actuator adhering to the substrate over an area extending for a distance along the beam axis [
7].
Figure 2.
Schematics of the (a) free standing (b) arc and (c) s-Shaped cantilever beam actuators.
Figure 2.
Schematics of the (a) free standing (b) arc and (c) s-Shaped cantilever beam actuators.
The fabricated actuator dimensions are: beam length L = 175 μm, width w = 10 μm, thickness t = 1.5 μm, and capacitor gap h = 1.2 μm. The actuators were fabricated using polyMUMPS fabrication process from polysilicon with density of ρ = 2330 kg/m3 and a Young’s modulus of E = 160 GPa. An actuation electrode was patterned on the substrate under the beam span extending from the tip to 5 μm from the post supporting the fixed end of the beam.
2.3. Experimental Procedure
The pull-in voltage of the actuator was measured experimentally at 16.5 V. Accordingly, the actuation voltage was set to pulse train of amplitude 1 V, a 1% duty cycle, and the bias voltage to 14 V and 15.5 V for the free standing and arc actuators, respectively. The bias voltage for the s-shaped actuator was set to 20.5 V, which resulted in contact with the substrate along the terminal 30% of the beam length span.
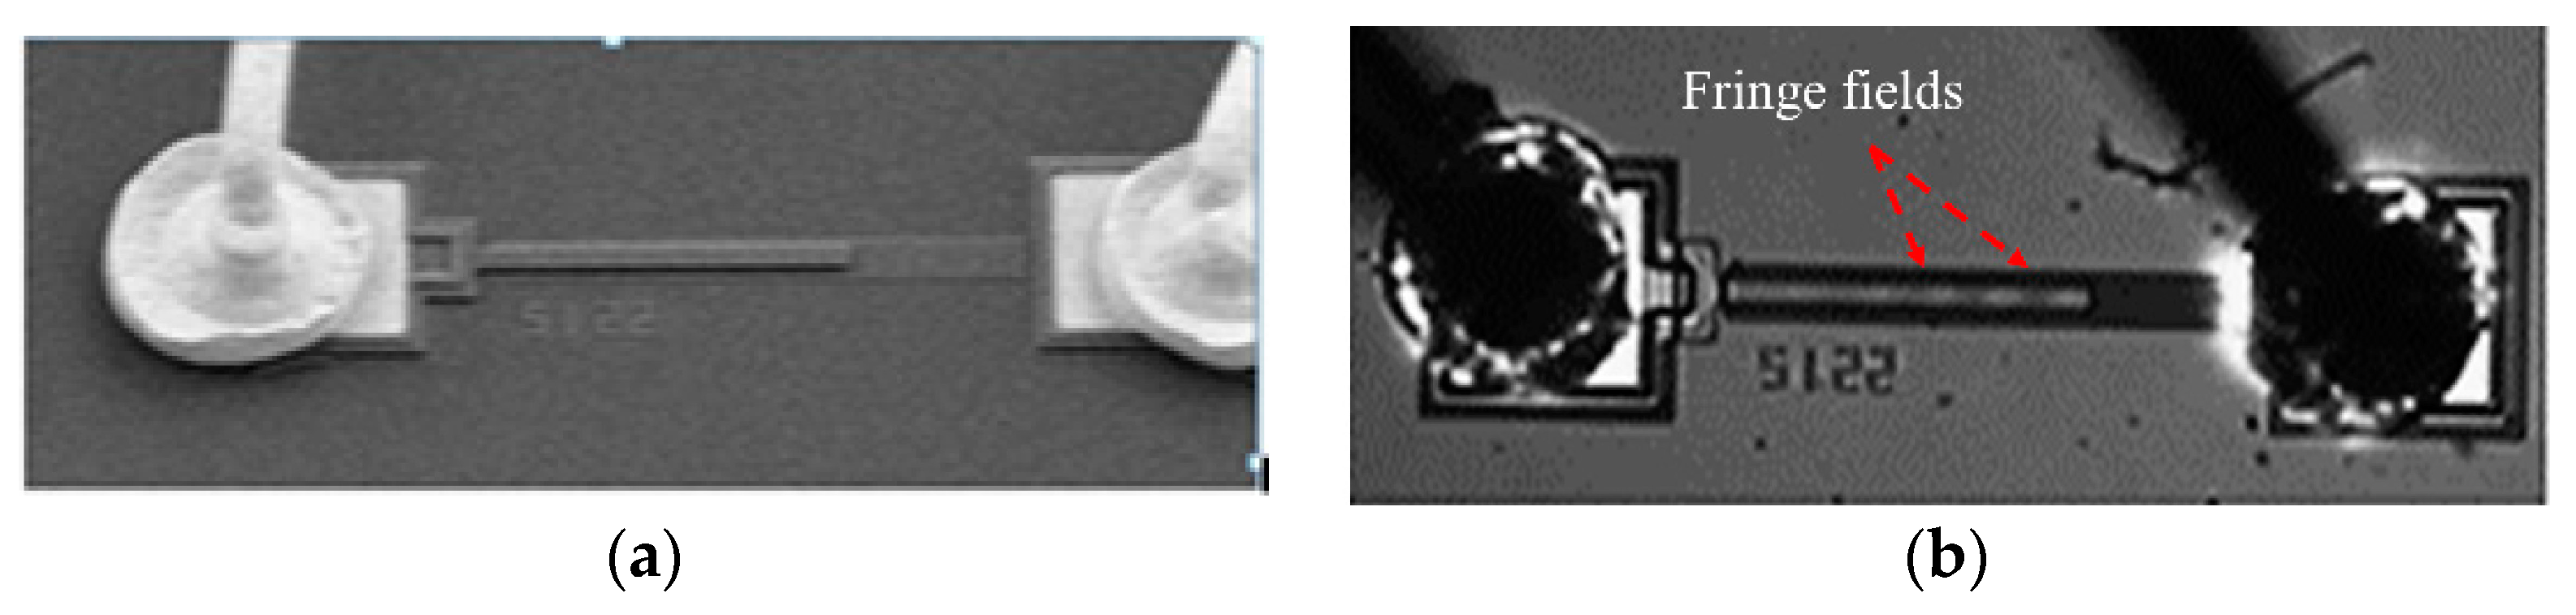
Figure 3 shows a sample actuator in free standing and arc configurations. The dark and light strips appearing along the actuator length are fringing fields caused by the difference in height between the actuator’s fixed end and its tip in contact with the substrate.
The distinction between the beam span length in-air and in-contact is obtained by measuring the cantilever beam height above the substrate using the LDV. In arc-shaped beams, the vibrometer measures zero height at the beam tip only and finite values throughout the beam span. In the s-shaped beams, the vibrometer measures zero height over a portion of the beam length extending from the tip to the end of the contact length.
Figure 3.
Images of the actuator in (a) free standing and (b) arc configurations.
Figure 3.
Images of the actuator in (a) free standing and (b) arc configurations.
The laser spot of the vibrometer was placed close to the actuator tip, while avoiding the contact pad. The vibrometer measured the velocity variation over time of the ring down oscillations following the falling edge of each pulse. The frequency of the pulse train was kept low enough to guarantee that those oscillations settled down before the next pulse took place. Accordingly, the frequency of the pulse train was set to 0.5, 2.5, and 2.5 kHz for the free standing, arc, and s-shaped actuator configurations, respectively.
3. Q Estimation
Damping estimation methods are divided into two categories: time domain, such as logarithmic decrement, step-response and hysteretic loop methods, and frequency domain, such as magnification factor and half-power bandwidth methods. Among these methods, logarithmic decrement and half-power bandwidth are the most commonly used methods to measure damping in MEMS. In this paper, we demonstrate and compare the relative merits of two approaches to implement the Logarithmic Decrement method.
3.1. Damping Envelope Estimation
The concept of logarithmic decrement is derived from the linear underdamped free response, ring-down, to an initial disturbance given by [
8]:
where
is the natural frequency of the system, the damped period
and frequency
of oscillations are related by
, and
A and
are the amplitude and phase of the response determined by the initial disturbance.
A record of the MEMS displacement
) discretized over time
or velocity
) discretized over time
are typically used to estimate damping [
8]. Instead, we follow Brincker
et al. [
9] and use the damping envelope of the signal,
) or
), to estimate
Q. Specifically, the time envelope of the velocity can written as:
Setting the phase angle to
when
t = 0, we can write the peaks of
) lying on the time-envelope as the series:
where
N is the number of sampled peak points.
Due to external mechanical disturbances, circuit noise, discretization error and the lack of synchronization between the system response and sampling frequency, the sampled velocity
, unlike
, does not necessarily lie on the time-envelope. Linear regression [
10] is employed here to overcome this challenge and obtain a best-fit that accounts for all the peak velocities
in the data set.
To apply linear regression, we transform Equation (2) to a linear equation by taking the natural logarithm of the equation:
Comparing to a line equation:
Y = mt+ b, we find that the slope of the line obtained from applying linear regression to
Y = Ln is:
and the
Y intercept is:
The slope and intercept of the line are obtained by linear regression as follows:
where
and
are the average values of
Y and
t, respectively.
Applying Equations (7) and (8) to the sampled velocity peaks to obtain m and b, and estimating the frequency of oscillations f from the time history of the velocity signal ), we can use Equations (5) and (6) to obtain and Q. A code was developed to estimate these parameters and to plot the best-fit time-envelope.
A spreadsheet was developed to implement the method described above. The sheet can process up to 10,000 data points. First, it filters out high-frequency noise from the velocity signal. It then detects the zero cross-over points in the signal and finds the absolute maxima between the cross-over points to obtain up to 10 positive or negative peaks. Finally, the “best fit” routine uses the method described above to obtain the regression line, the “best fit” damping envelope and to estimate Q.
3.2. System Identification
Particle swarm optimization (PSO) is a population based stochastic optimization technique which is deployed effectively to solve nonlinear, non-differentiable, multi-modal optimization problems [
11,
12,
13]. In this technique, each particle (individual optimization process) updates its position (estimate of the solution) on the basis of its direction of motion (change in estimates of the solution), its best position in the past (its previous best solution) and the best position across the entire swarm (population best solution) of particles.
The position of the
ith individual is denoted by
xk (
i)
. Its velocity and fitness value (closeness of the estimate to the actual solution) is represented by
vk (
i) and
Jk (
i) respectively. The best position of the
ith individual and its fitness value are represented by
pk (
i) and
Jpk (
i) and the best swarm position and fitness value are represented by
gk and
Jgk, respectively. The position of the
ith individual for the next iteration is updated following the relationships:
The parameter w is called the inertial weight, rand( ) is a uniformly distributed random number in the range [0,1] and the parameters c1 and c2 are called the social and cognitive acceleration parameters. These search parameters define the exploratory behavior of the swarm.
In adaptive parameter PSO (AP-PSO) [
13], the search parameters are updated adaptively depending on the state of the optimization:
where
Vmax is the maximum allowed velocity variation in each iteration,
M is the maximum number of PSO iterations and
m is the current iteration number. Adaptation ensures an effective balance between local search and global search of the parameter space. In this way, the solution space is searched efficiently and quickly.
Q estimation is formulated as a system identification problem. The response of the MEMS is assumed to follow that of a linear time-invariant second-order oscillator represented by the transfer function:
where
is the DC gain of the system,
and
. The identified oscillator represents a lumped model of the actuator dynamics localized at the measurement point.
The objective of the AP-PSO algorithm is to identify the parameters and . The parameter estimates are substituted in Equation (14). The absolute difference between the identified oscillator response, evaluated at each sampling point, and the measured velocity is summed to form an integral absolute error that is minimized during the course of optimization.
An initial population of 25-individuals with 50-iterations of PSO was used in the AP-PSO algorithm. The initial generation of individuals uses a Gaussian model. The mean value of the three parameters is set to an initial guess and a suitable variance is selected for each parameter reflecting the confidence level in the underlying experimental measurements. The damping envelope is computed following Equation (2).
4. Results and Discussion
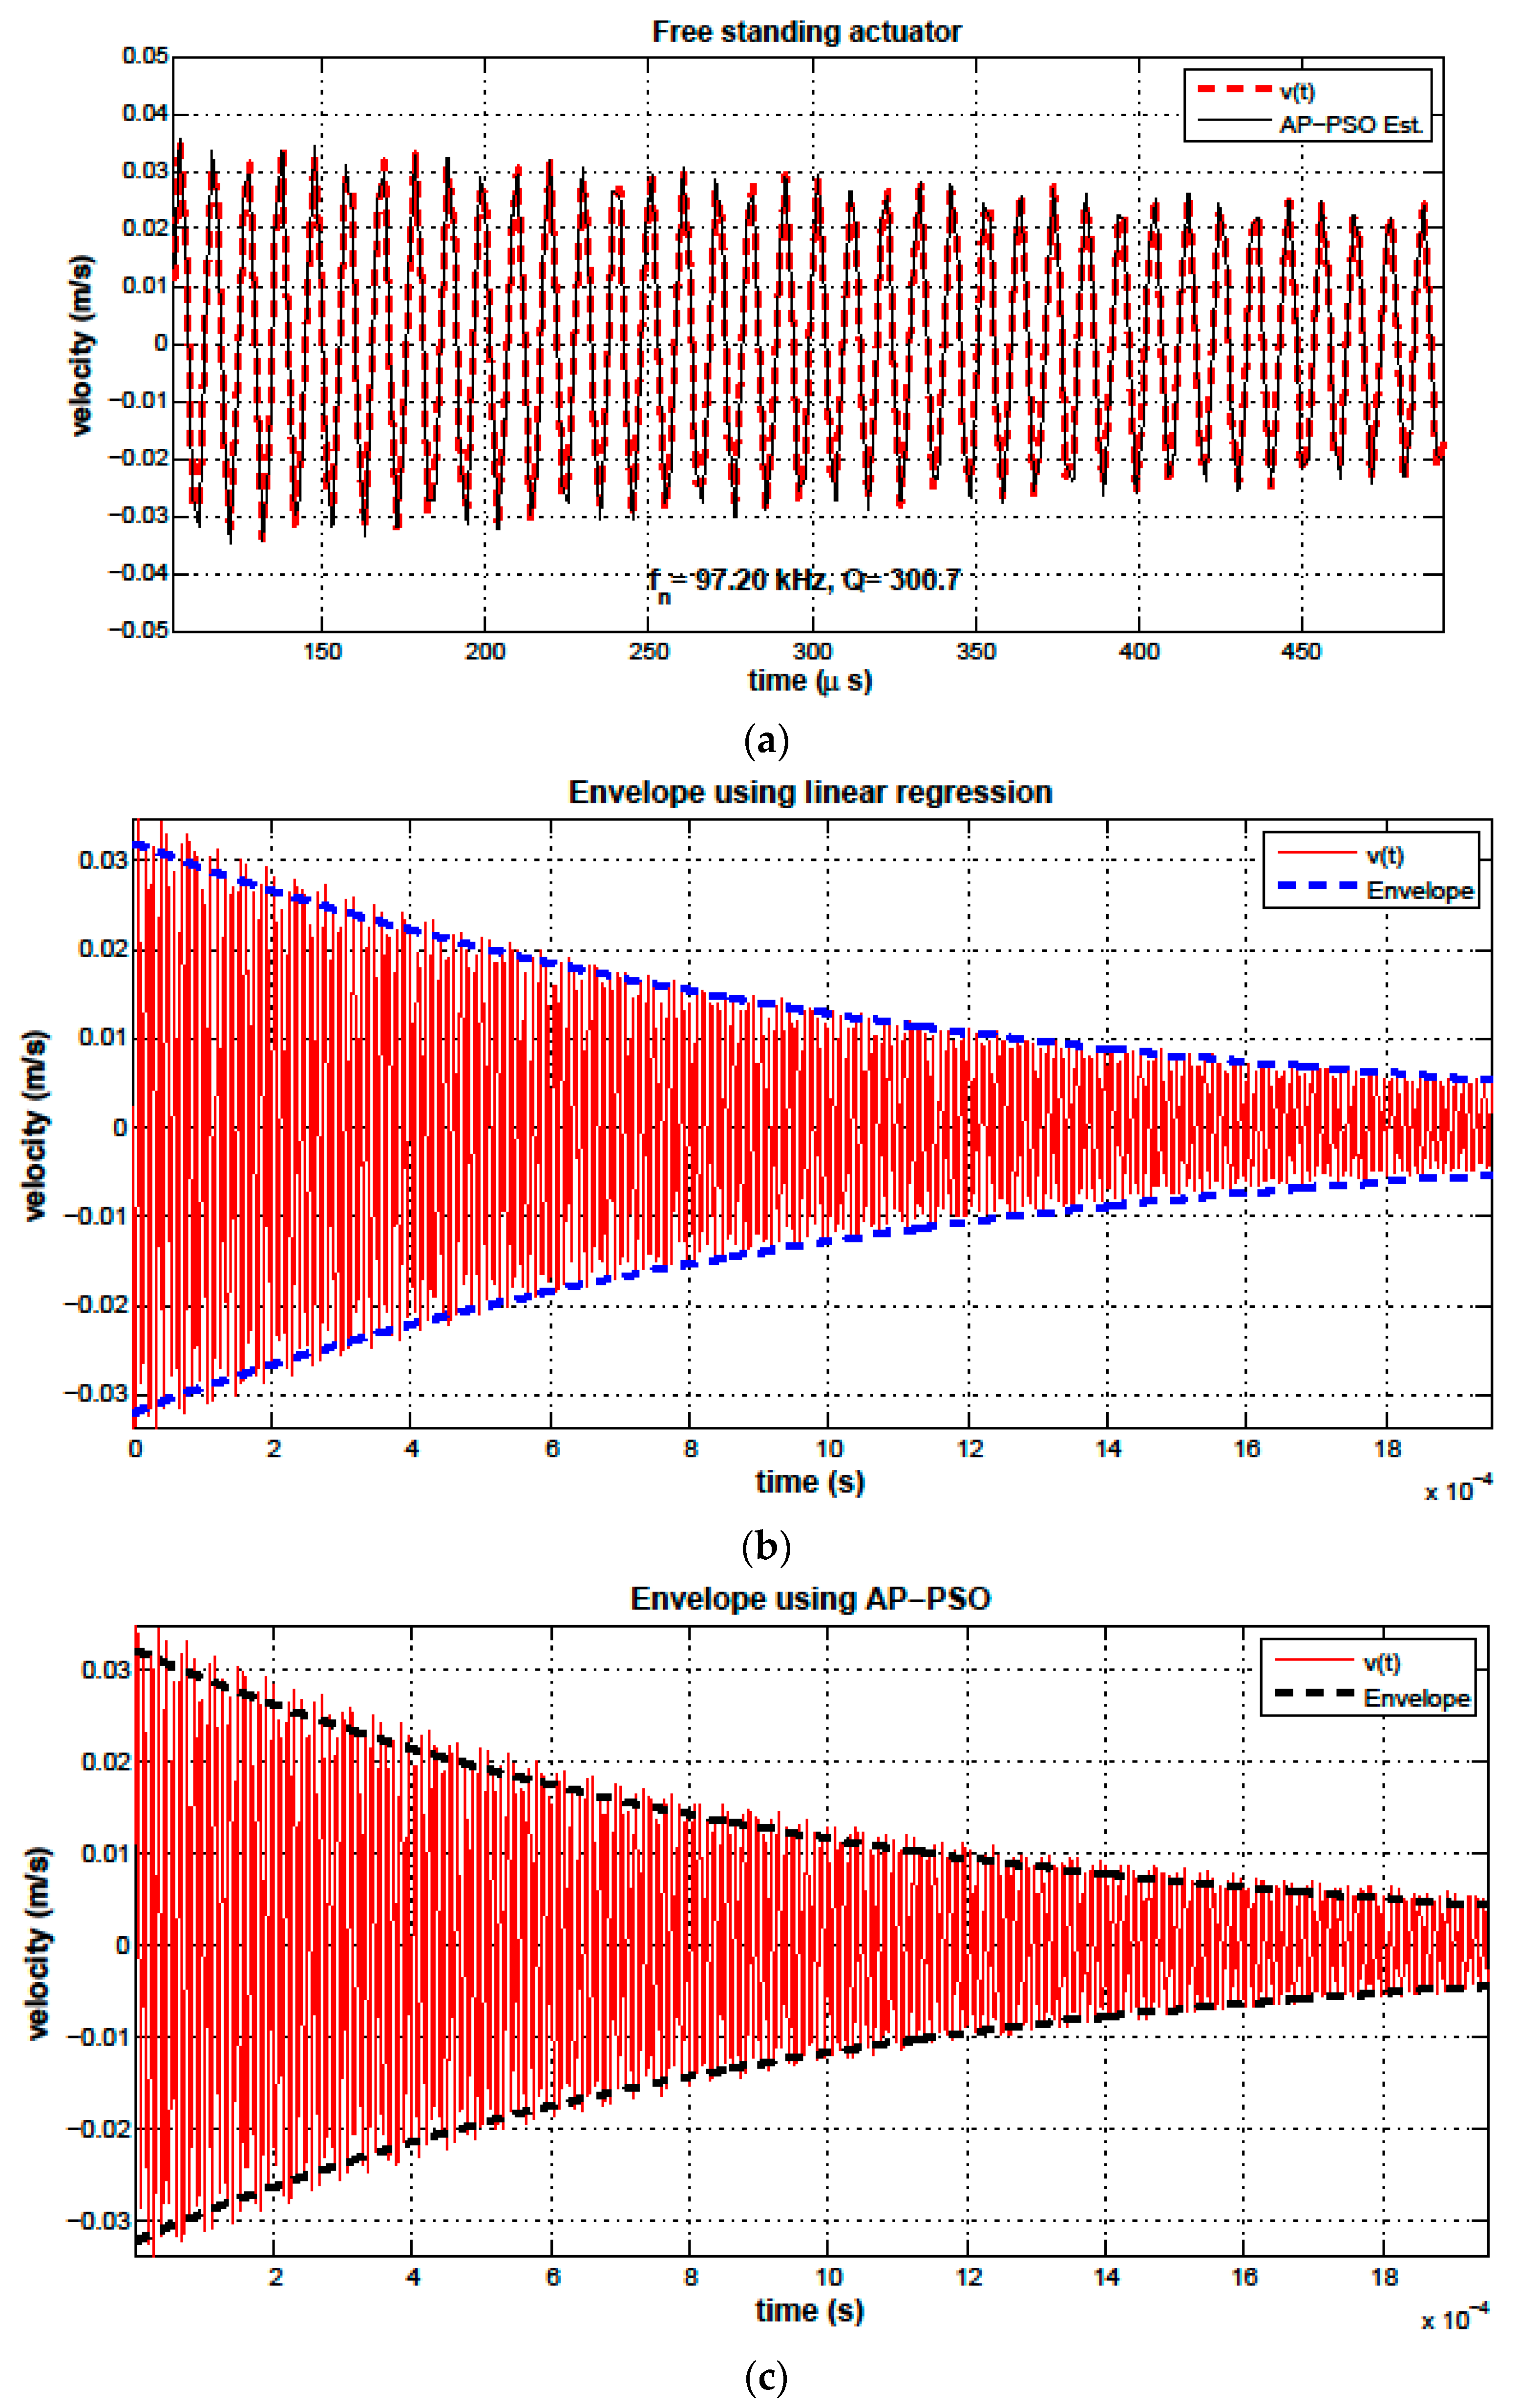
Figure 4a shows the time-history of the free standing actuator tip velocity
and time-history of the oscillator identified via the system identification technique in Equation (14). The response describes the ring down oscillations of the actuator in response to a square pulse excitation with a frequency of 0.5 kHz and a 1% duty cycle. The figure compares 40 periods of the measured velocity of the actuator tip and the reconstructed velocity of the identified oscillator. We note that the identified oscillator agrees closely with the amplitude and period (zero crossing) of the measured velocity.
Figure 4b shows the estimated damping envelopes obtained using the linear regression code and system identification techniques, respectively.
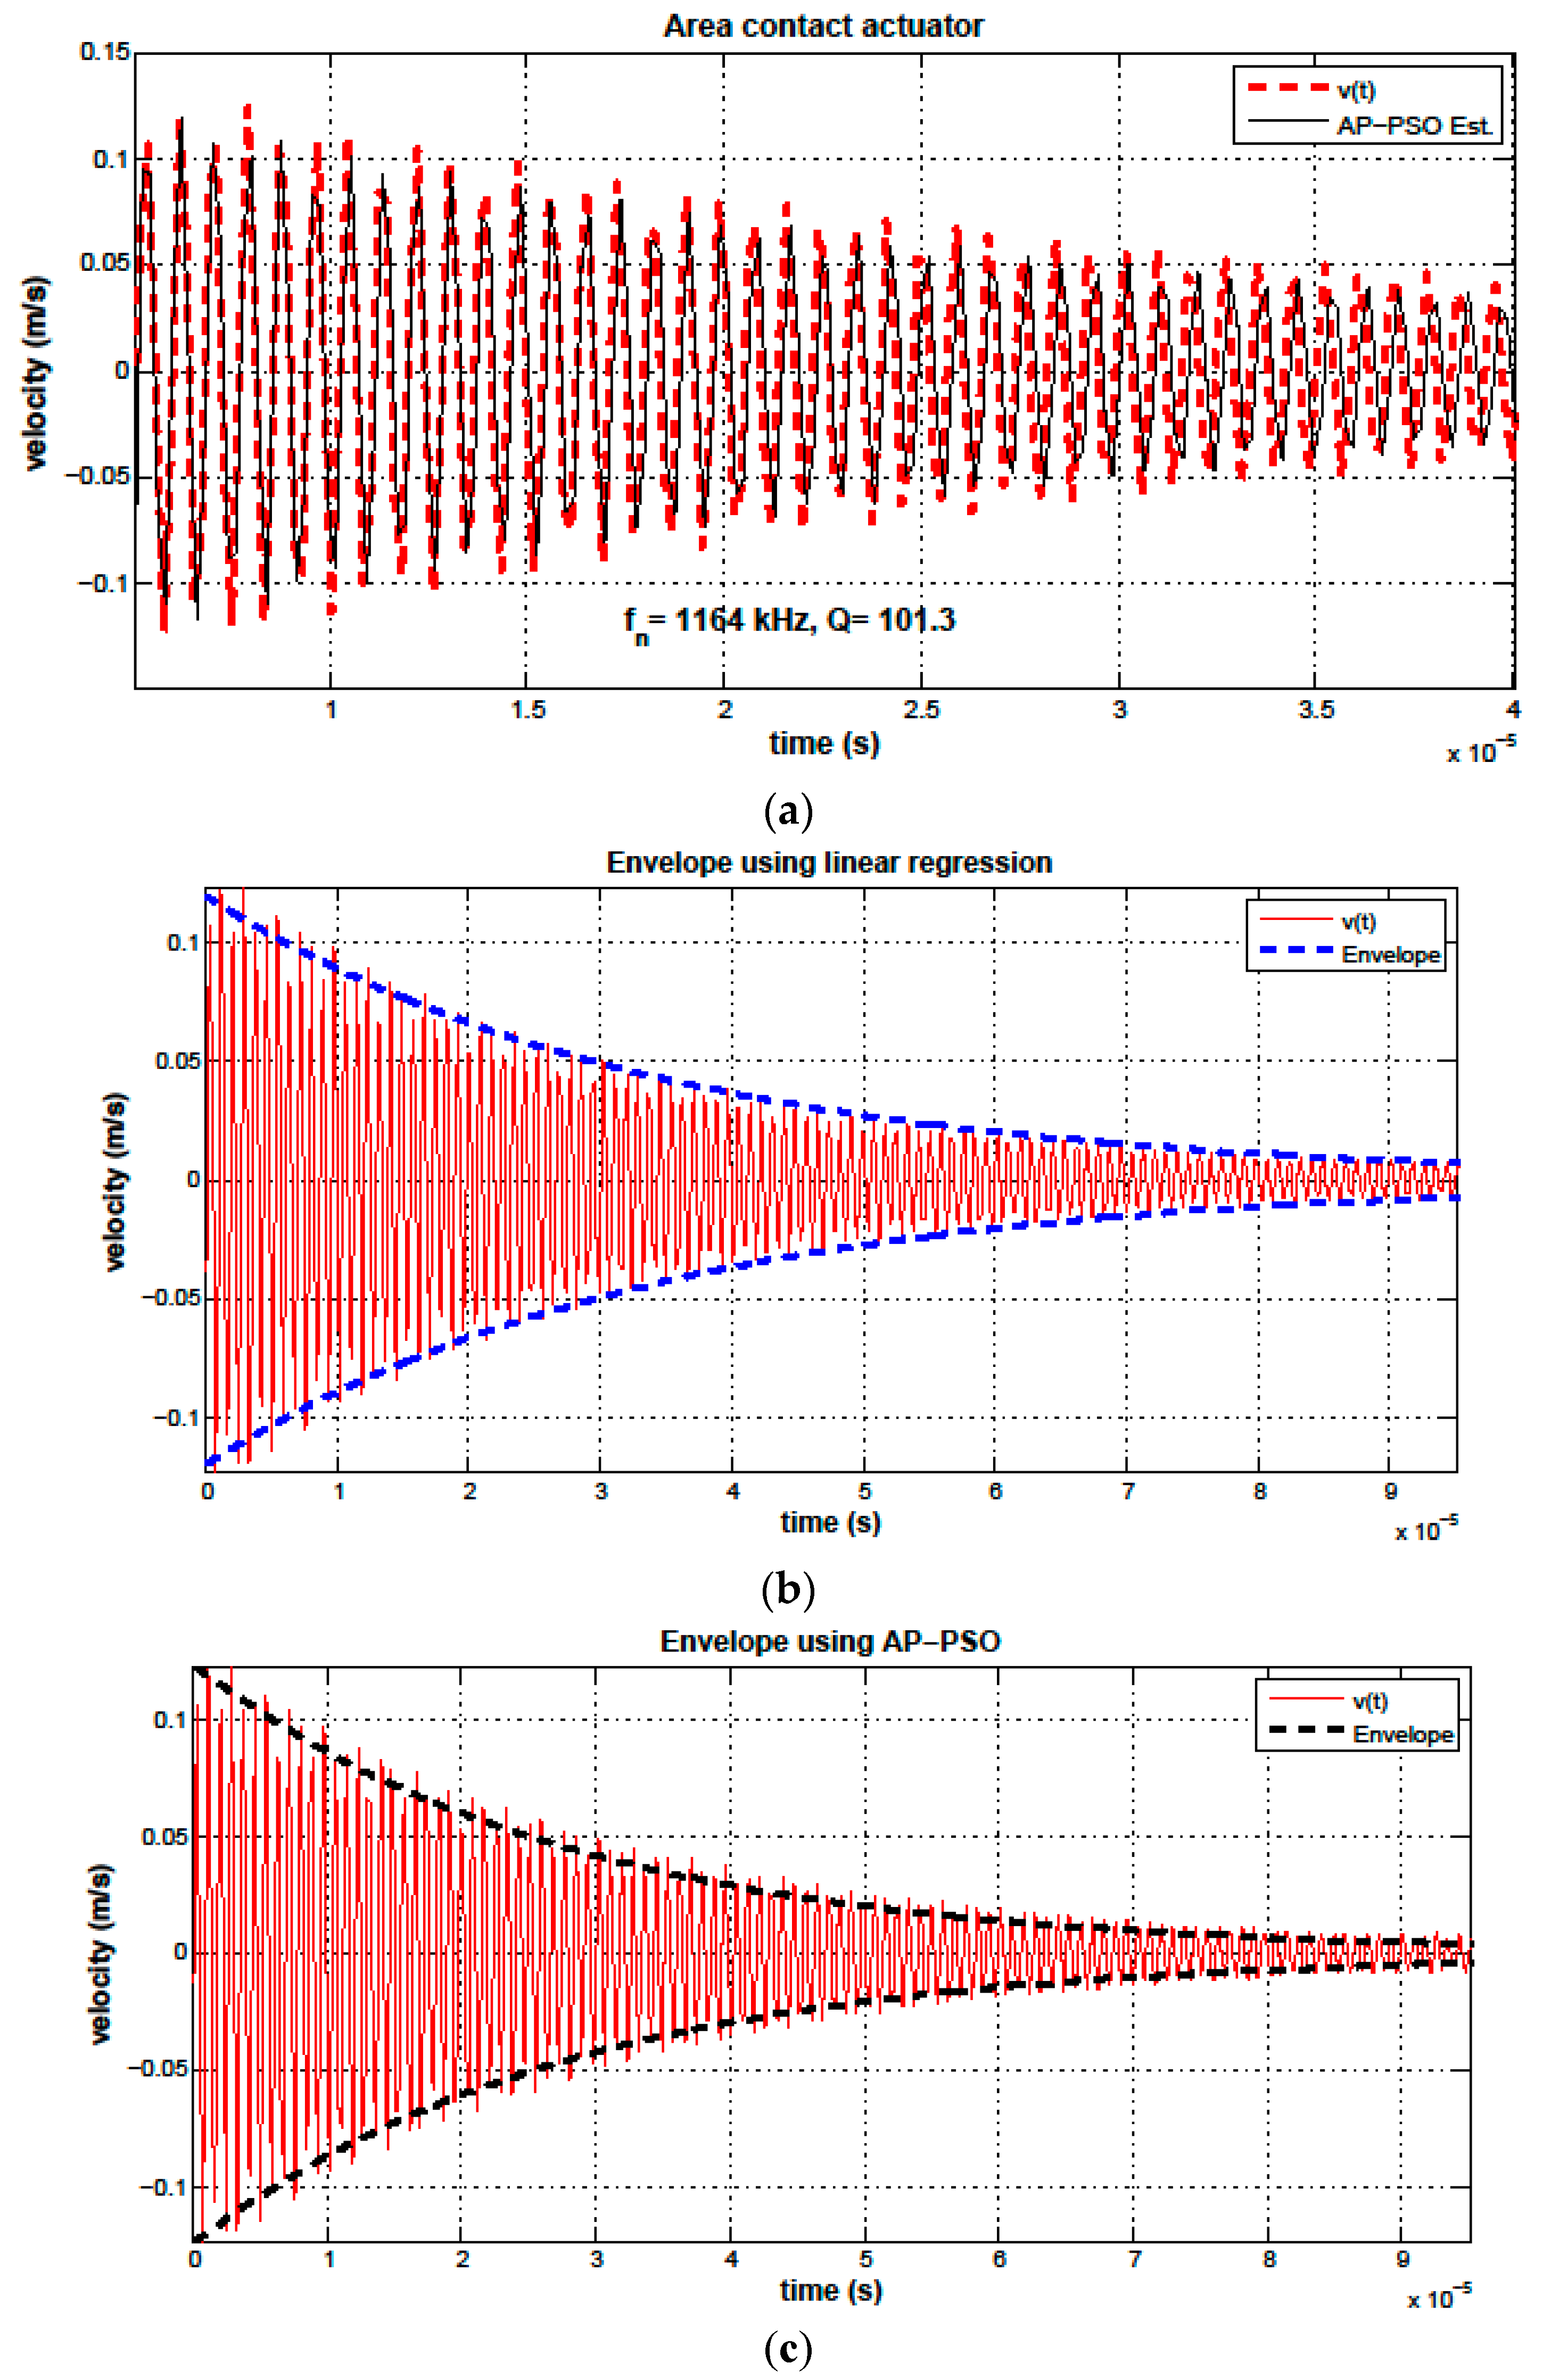
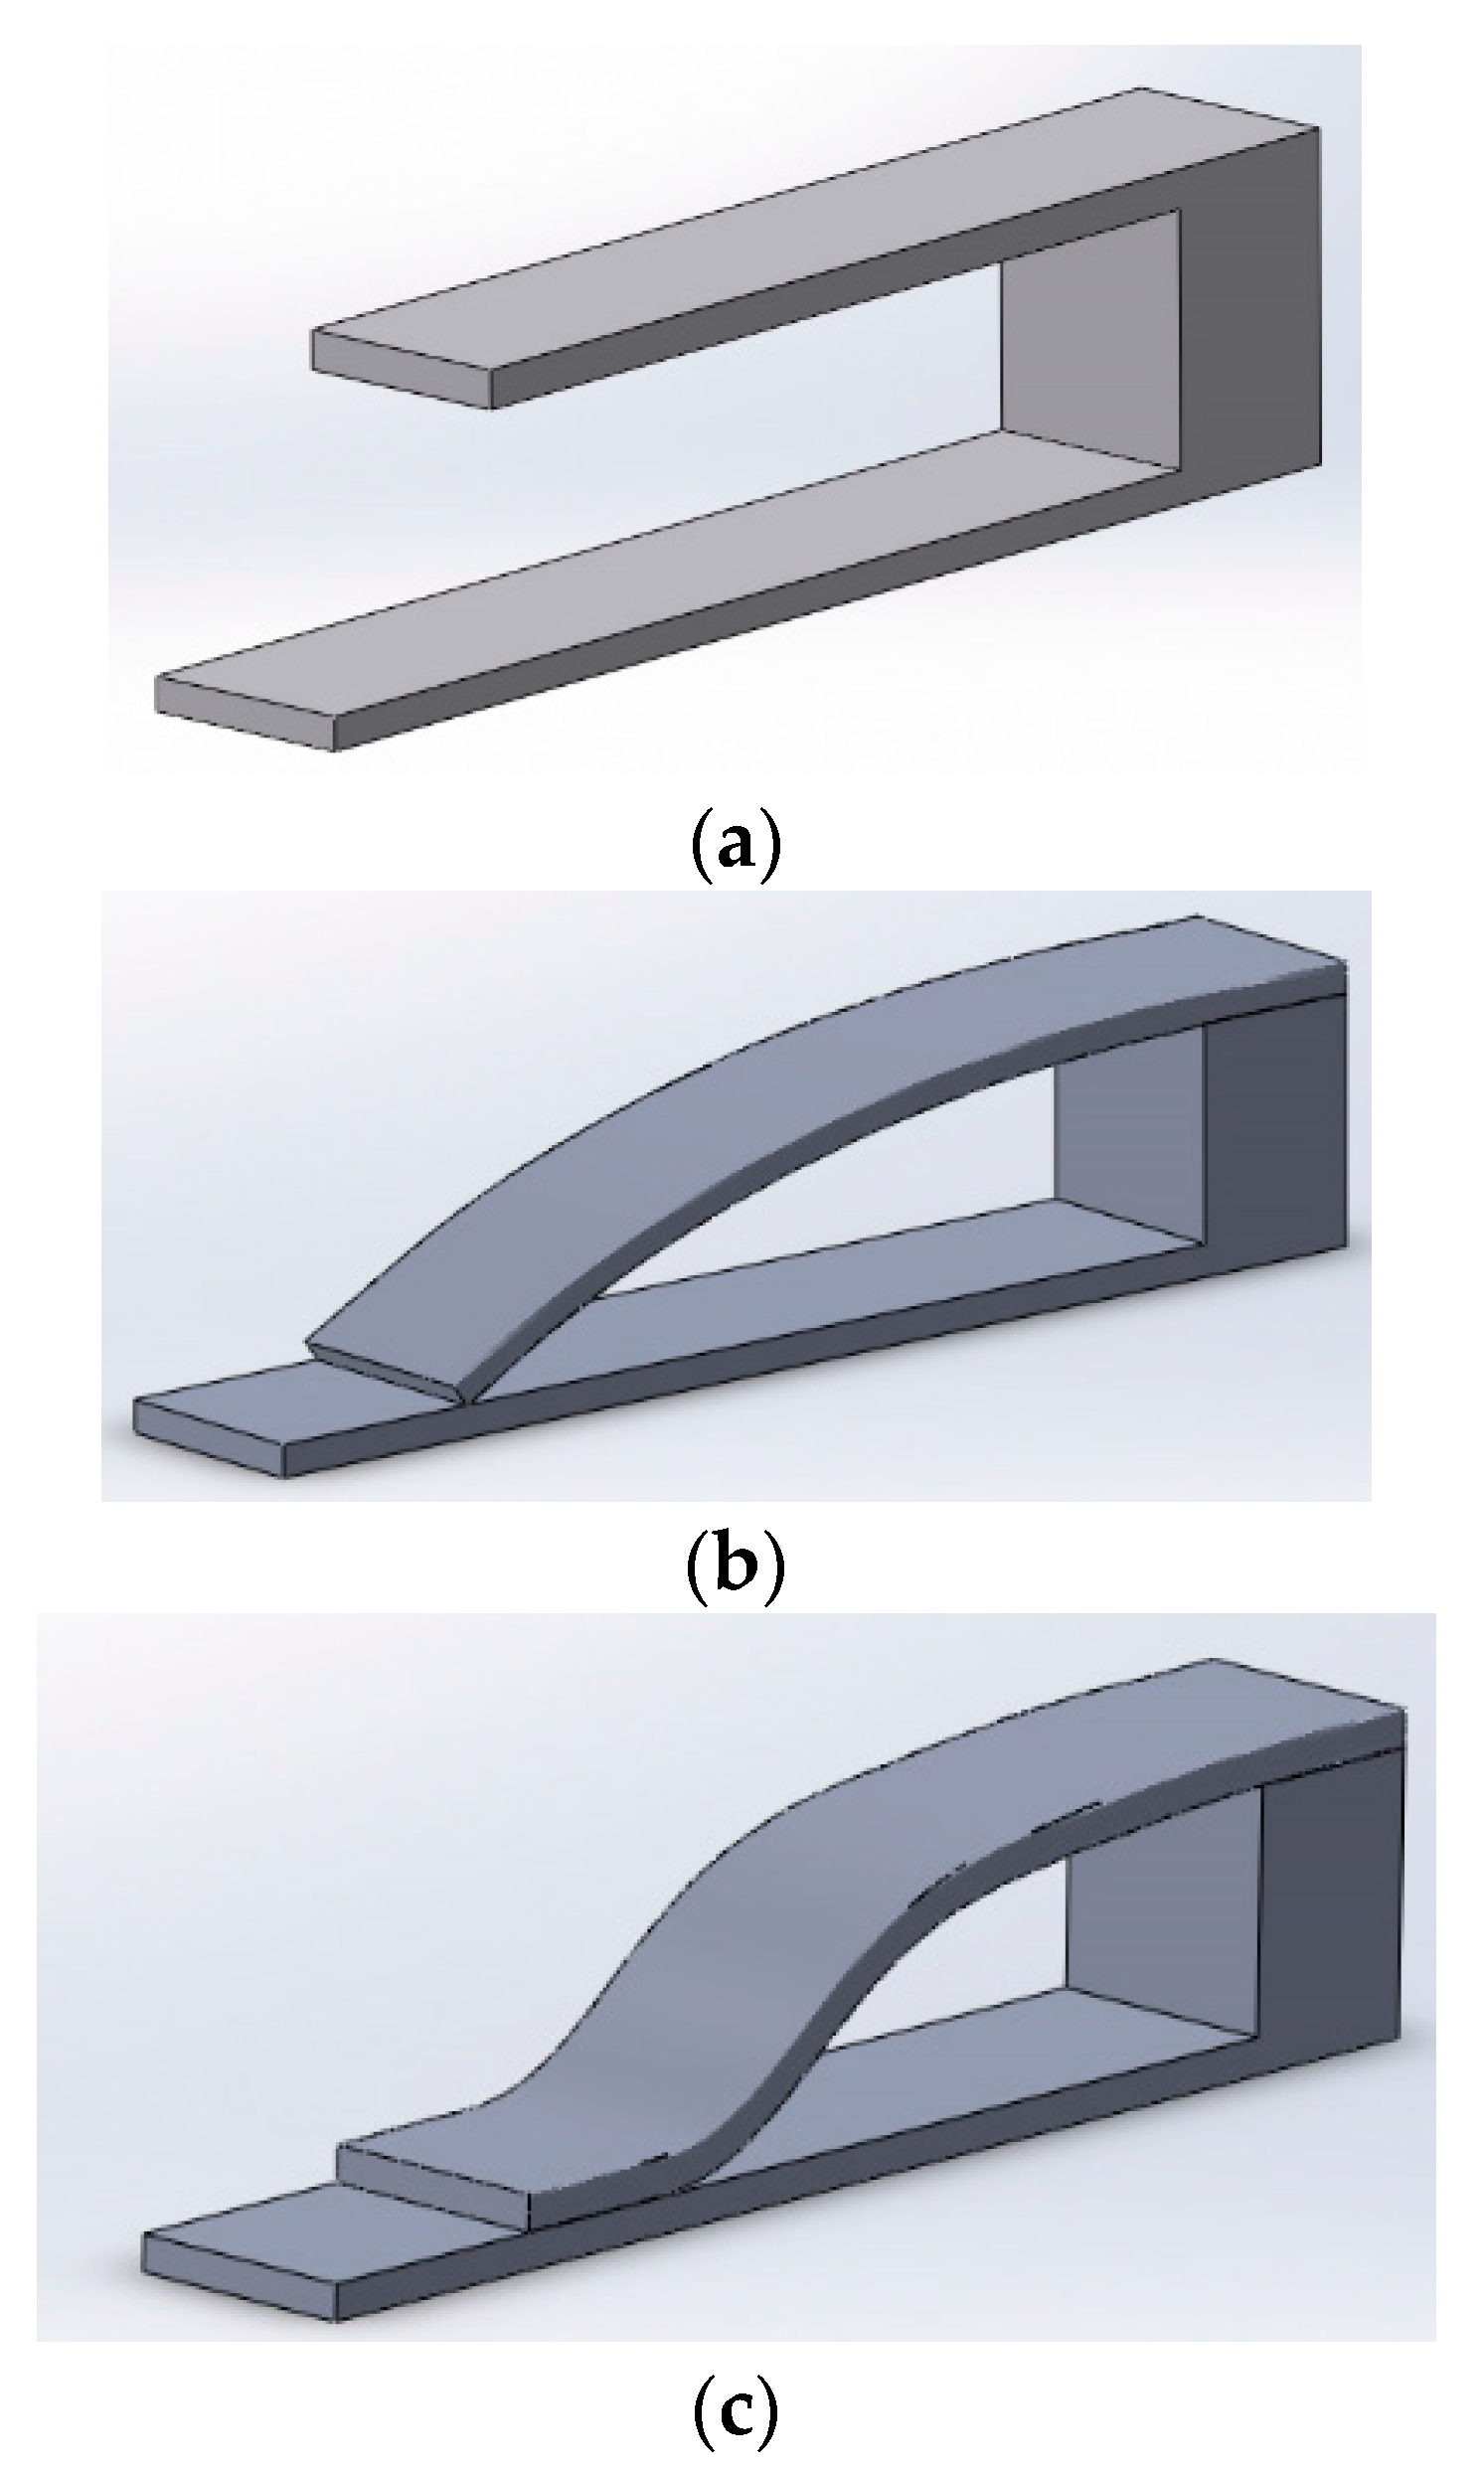
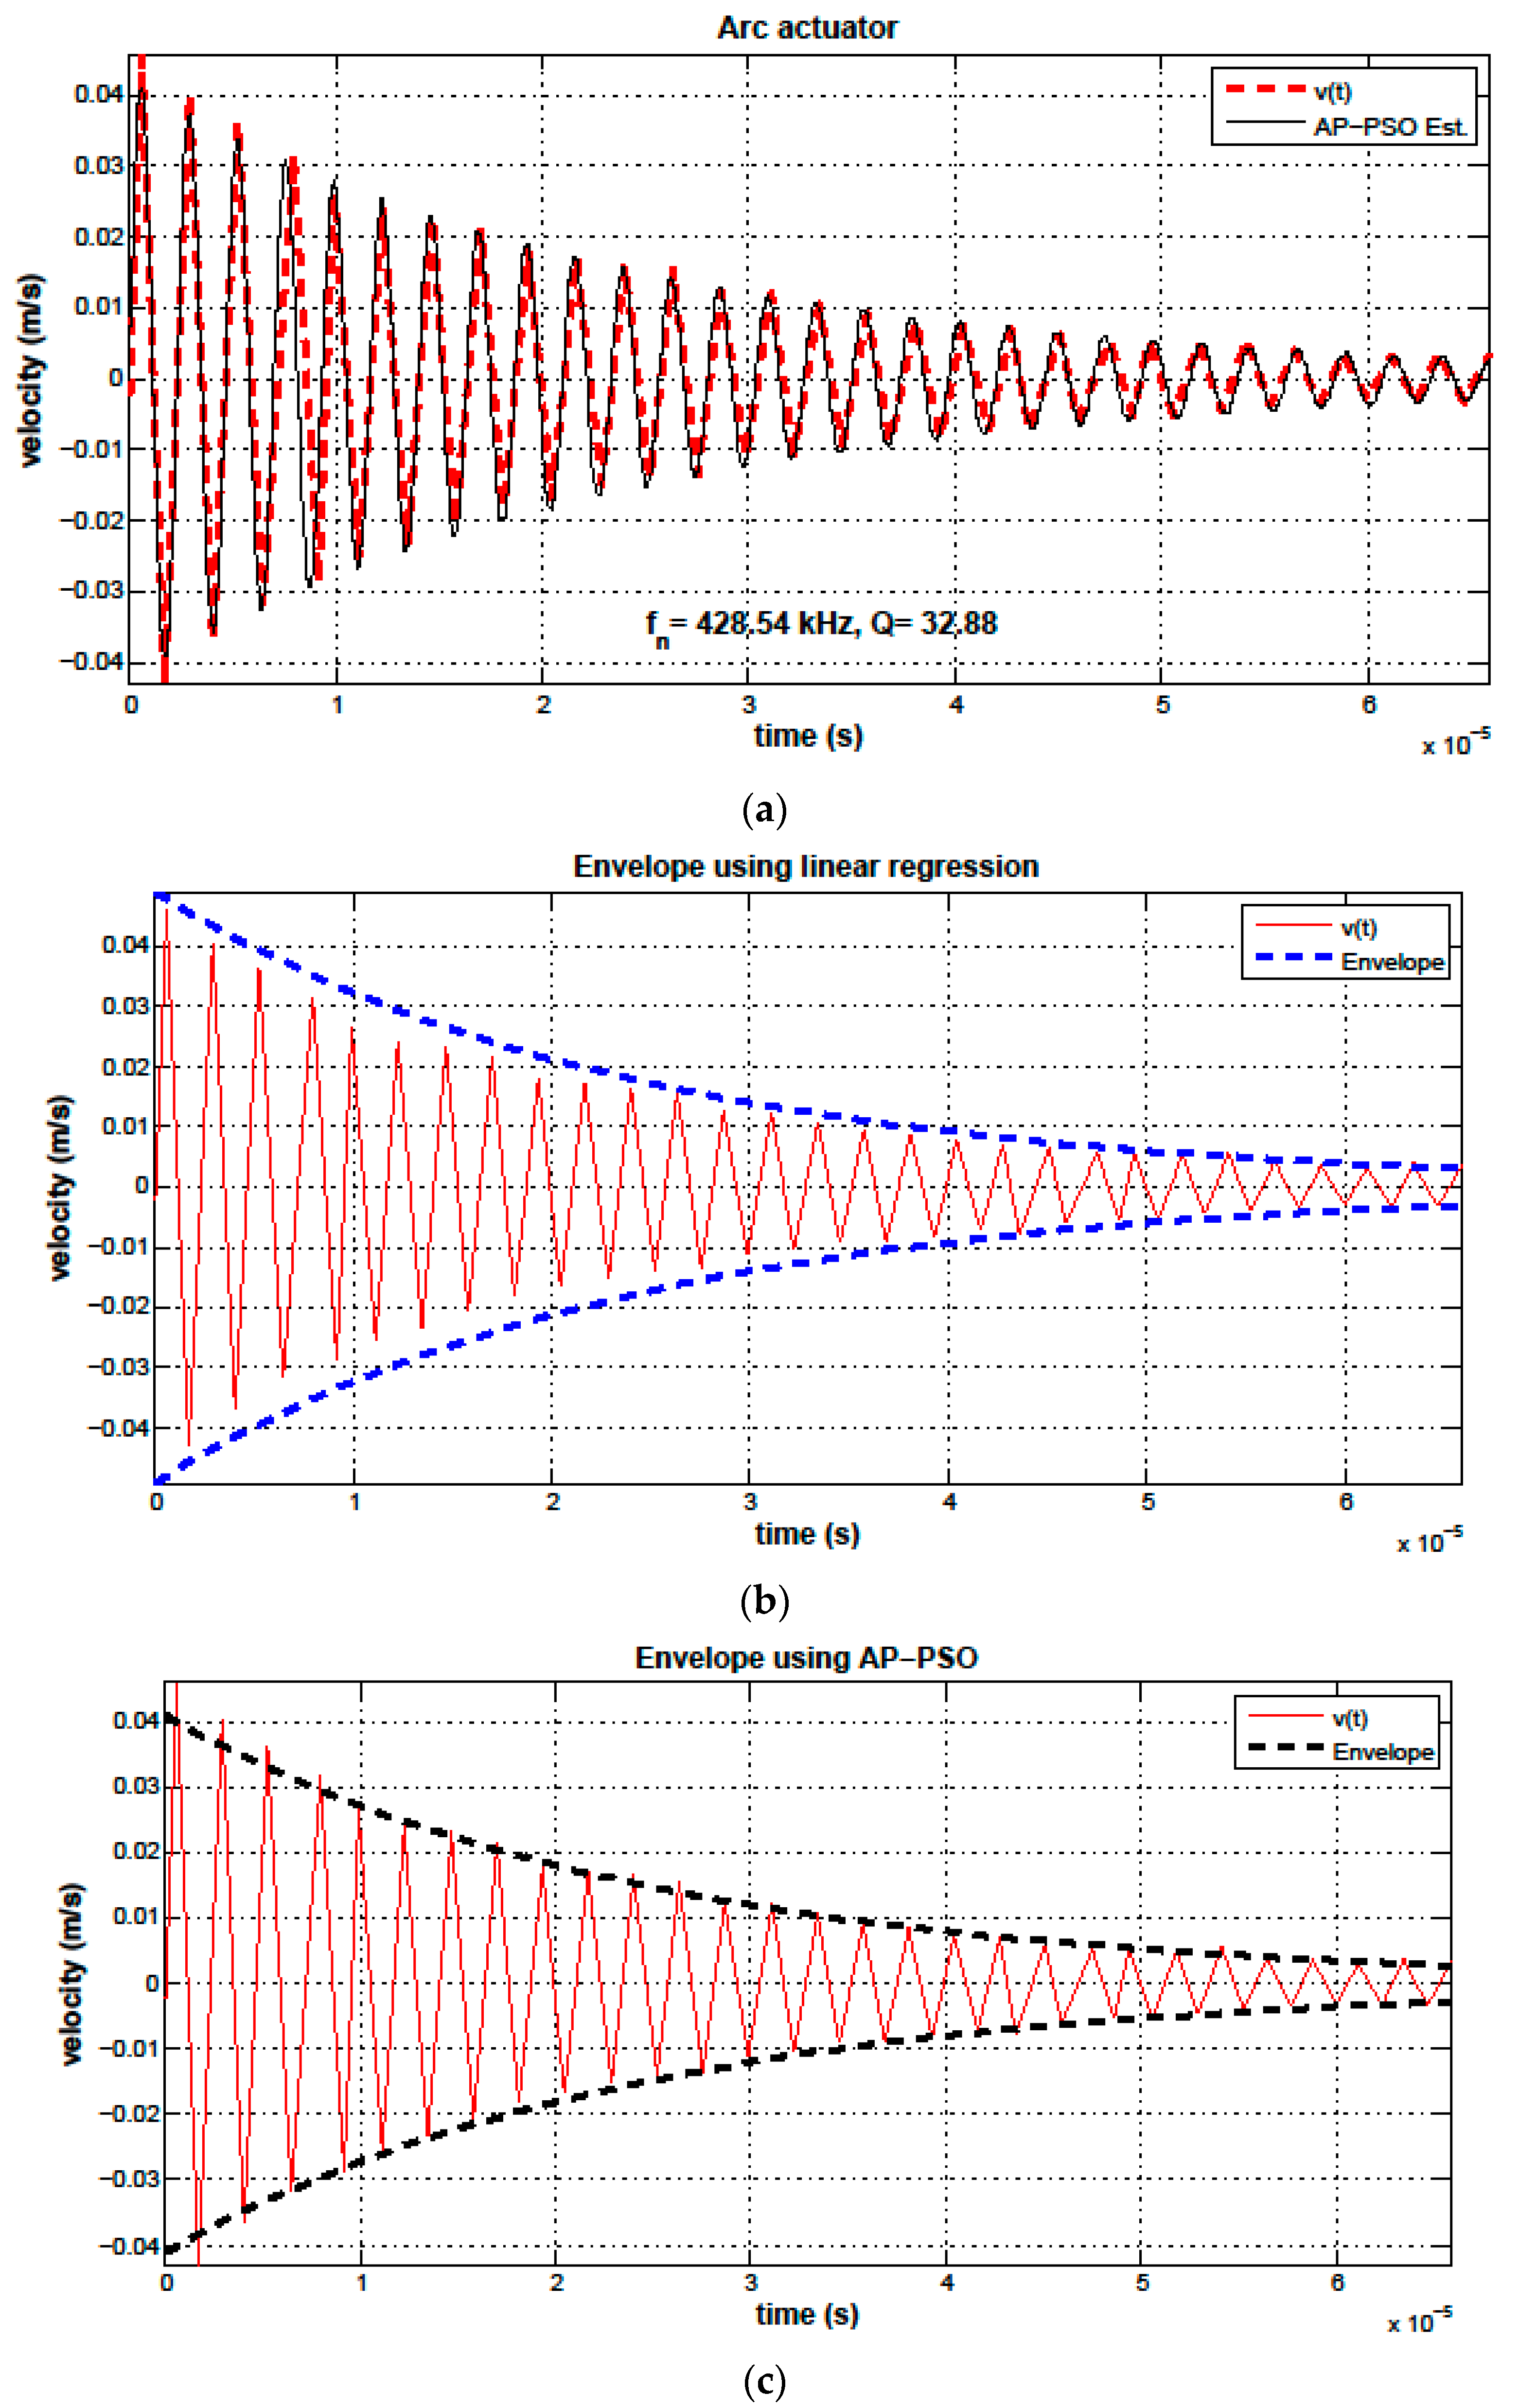
Figure 5 and
Figure 6 show the time-history of the velocity
) of a point near the actuator tip and the identified oscillator for the arc and s-shaped actuators respectively. The response describes the ring down oscillations of the actuator in response to a square pulse with a frequency of 2.5 kHz and a 1% duty cycle.
Figure 5a and
Figure 6a compare the measured actuator velocity and the reconstructed velocity of the two oscillators. The smaller number of periods shown in the time-histories of
Figure 5 and
Figure 6 are due to the higher damping and, therefore, the shorter time span of the ring down oscillations for the actuators in contact with the substrate.
Figure 5b and
Figure 6b show the estimated damping envelopes obtained using linear regression and system identification techniques for the arc and s-shaped actuators, respectively.
The damping envelope parameters and the values of the natural frequency and quality factor obtained using damping envelope method for the three configurations of the actuator are listed in
Table 1. The corresponding values of the natural frequency and quality factor obtained using system identification are listed in,
Table 2.
Figure 4.
(a) The measured vs. AP-PSO estimated time-history of the free standing actuator velocity and the estimated damping envelopes obtained using (b) linear regression and (c) AP-PSO system identification.
Figure 4.
(a) The measured vs. AP-PSO estimated time-history of the free standing actuator velocity and the estimated damping envelopes obtained using (b) linear regression and (c) AP-PSO system identification.
Figure 5.
(a) The measured vs. AP-PSO estimated time-history of the arc actuator velocity and the estimated damping envelopes obtained using (b) linear regression and (c) AP-PSO system identification.
Figure 5.
(a) The measured vs. AP-PSO estimated time-history of the arc actuator velocity and the estimated damping envelopes obtained using (b) linear regression and (c) AP-PSO system identification.
Figure 6.
(a) The measured vs. AP-PSO estimated time-history of the s-shaped actuator velocity and the estimated damping envelopes obtained using (b) linear regression and (c) AP-PSO system identification.
Figure 6.
(a) The measured vs. AP-PSO estimated time-history of the s-shaped actuator velocity and the estimated damping envelopes obtained using (b) linear regression and (c) AP-PSO system identification.
Table 1.
Damping Envelope Estimates for and Q.
Table 1.
Damping Envelope Estimates for and Q.
| Parameter | Free Standing | Arc | s-Shaped |
|---|
| Number of data points, N | 1777 | 190 | 497 |
| Avg. period (μs), Td | 10.8 | 2.37 | 0.867 |
| Natural frequency (kHz), fn | 92.7 | 422 | 1150 |
| Quality factor, Q | 318 | 31.7 | 122 |
| Initial amplitude (mm/s), A0 | 0.032 | 0.0491 | 0.120 |
| Number of maxima | 564 | 59 | 198 |
Table 2.
System Identification Estimates of and Q.
Table 2.
System Identification Estimates of and Q.
| Actuator | (kHz) | Q |
|---|
| Free standing | 97.20 | 300.71 |
| Arc | 428.54 | 32.88 |
| s-Shaped | 1164.12 | 101.32 |
5. Conclusions
MEMS cantilever actuators were tested to estimate their quality factor Q and natural frequency under various operating conditions. The actuators were tested in a vacuum chamber under a pressure of approximately 1 torr. The actuator was tested in three configurations: free standing, where the cantilever tip is free to move; arc, where the tip is in contact with the substrate along a narrow line; and s-shaped, where the actuator was in contact with the substrate along a finite (measurable) length of the beam span. A vibrometer was used to measure the velocity of the actuator ring-down oscillations following a pulse excitation.
Two methods were used to estimate the quality factor and their results were compared to determine their efficacy. The first method, based on logarithmic decrement, uses linear regression to identify the damping envelope and, thereby, calculate the quality factor Q and natural frequency . The second method uses adaptive parameter particle swarm optimization to identify the quality factor Q and natural frequency of an “assumed” a second-order time-invariant linear oscillator from the measured velocity time-history.
We found that traditional damping estimation techniques obtain either inaccurate or imprecise results, when applied to MEMS. Specifically, logarithmic decrement techniques lack precision, while frequency-domain (half-power bandwidth) techniques lack accuracy. We also found that an optimization technique that seeks to identify a linear oscillator model by minimizing, in a least squares-sense, the difference between model predictions and measured data can overcome both shortcomings.
The precision of logarithmic decrement techniques is undermined by the fact they use only the time-envelope information in the measured signal. Since the sampling frequency fs is not, in general, commensurate with the frequency of ring-down oscillations, it introduces significant discretization errors in the envelope data, in addition to the other error sources, such as external disturbances and thermal noise. Small variations in the implementation of logarithmic decrement, lead to significant variations in the calculated quality factor. The accuracy of half-power bandwidth techniques is undermined by the relatively large bin size of the fast Fourier transform (FFT) for the response of typical MEMS. The bin size is proportional to (fs/N), where fs > 2fn. Since typical MEMS sensors and resonators have natural frequencies in the order of tens to hundreds of kHz, the bin size is typically large, thereby reducing the accuracy of our estimates of the half-power bandwidth and Q.
On one hand, an optimization based system identification technique seeks to minimize the error between the assumed model and all measured data points in the time-domain, thereby utilizing all available data. It also does not have limitations on accuracy due to Nyquist criteria. In fact, the accuracy of the identification process can be improved to approach the noise floor by expanding the length of the measured time-history used in the identification process. We demonstrated that AP-PSO is a computationally efficient approach to optimization based system identification as a method to estimate the quality factor.
Finally, an important outcome of the experiments reported here is the increase in Q obtained for s-shaped actuators compared to that for arc actuators. The results show that Q increases by three-fold as the actuator contact with the substrate evolves from a line to an area. The reason for this is the drop in energy losses due to friction as the contact area expands along the beam span.
Acknowledgments
All sources of funding of the study should be disclosed. Please clearly indicate grants that you have received in support of your research work. Clearly state if you received funds for covering the costs to publish in open access.
Author Contributions
Mahmoud E. Khater, Eihab M. Abdel-Rahman and Mustafa Yavuz conceived and designed the experiments; Savas Ozdemir and Mahmoud E. Khater carried out the experiments, Savas Ozdemir, Sohail Akhtar and Ozgur E. Gunal analyzed the data; Resul Saritas contributed materials and analytical tools; Savas Ozdemir, Sohail Akhtar, Ozgur E. Gunal, Mahmoud E. Khater and Eihab M. Abdel-Rahman wrote the paper.
Conflicts of Interest
The authors declare no conflict of interest.
References
- Castellini, P.; Marchetti, B.; Tomasini, E. Scanning laser doppler vibrometer for dynamic measurements on small microsystems. In Proceedings of Fifth International Conference on Vibration Measurements by Laser Techniques: Advances and Applications, Ancona, Italy, 18 June 2002.
- Lübbe, J.; Temmen, M.; Schneider, H.; Reichling, M. Measurement and modelling of non-contact atomic force microscope cantilever properties from ultra-high vacuum to normal pressure conditions. J. Meas. Sci. Technol. 2011, 22, 055501. [Google Scholar] [CrossRef]
- Kuter-Arnebeck, O.; Labuda, A.; Joshi, S.; Das, K.; Vengallatore, S. Estimating damping in microresonators by measuring thermomechanical noise using laser doppler vibrometry. J. MEMS 2014, 23, 592–599. [Google Scholar] [CrossRef]
- Laser Doppler Vibrometer, Polytec Inc. Available online: www. polytec.com (accessed on 1 May 2013).
- Marioli, D.; Sardini, E.; Serpelloni, M.; Andò, B.; Baglio, S.; Savalli, N.; Trigona, C. Hybrid telemetric MEMS for high temperature measurements into harsh industrial environments. In Proceedings of I2MTC 2009 International Instrumentation and Measurement Technology Conference, Singapore, 5–7 May 2009.
- Andó, B.; Baglio, S.; Pitrone, N.; Savalli, N.; Trigona, C. Bent beam MEMS temperature sensors for contactless measurements in harsh environments. In Proceedings of IEEE Instrumentation and Measurement Technology Conference, Victoria, Canada, 12–15 May 2008.
- Zhao, Y.; Wang, L.; Yu, T. Mechanics of adhesion in MEMS—A review. J. Adhesion Sci. Technol. 2003, 17, 519–546. [Google Scholar] [CrossRef]
- Inman, D.J. Engineering Vibrations; Prentice Hall: Englewood Cliffs, NJ, USA, 1994. [Google Scholar]
- Brincker, R.; Ventura, C.E.; Andersen, P. Damping estimation by frequency domain decomposition. In Proceedings of the SPIE 19th International Modal Analysis Conference, Orlando, FL, USA, 5–8 February 2001.
- Heiman, G.W. Basic Statistics; Houghton Mifflin Company: Boston, MA, USA, 2003. [Google Scholar]
- Kennedy, J.; Eberhart, R. Particle swarm optimization. In Proceedings of IEEE International Conference on Neural Networks, Perth, Australia, 27 November–1 December 1995.
- Kennedy, J.; Eberhart, R.C. The particle swarm: social adaptation in information-processing systems. In New Ideas in Optimization; McGraw-Hill Ltd.: Maidenhead, UK, 1999; pp. 379–388. [Google Scholar]
- Akhtar, S.; Abdel-Rahman, E.; Ahmad, A. A New Fitness Based Adaptive Parameter Particle Swarm Optimizer. In Proceedings of The 11th Conference on Computer and Robot Vision: CRV, Montreal, QC, Canada, 7–9 May 2014.
© 2015 by the authors; licensee MDPI, Basel, Switzerland. This article is an open access article distributed under the terms and conditions of the Creative Commons by Attribution (CC-BY) license (http://creativecommons.org/licenses/by/4.0/).


 and
and 


