Interlocking Interfaces for Enhanced Mechanical Properties in Bi-Component 3D Printing of Biodegradable Materials
 , , , , , ,
 , , and
Abstract
1. Introduction
 , in the mirror, turned around 2), and FFF process parameters is poorly studied. Thus, design techniques and experimental correlations cannot transform biodegradable multimaterial components from sensitive interfaces to durable structural sections. This study examines samples from UltraFuse PLA Blue and PLA/PHA Shining Silver bicomponent 3D printed with the above interfaces, which undergo tensile strength, bending, Charpy impact, fracture, topography, and X-ray Computed Tomography (XCT) tests to evaluate mechanical properties, surface topography, and void analysis.
2. Materials and Methods
. Three samples were printed for each experiment.3. Results and Discussion
3.1. Tensile Tests
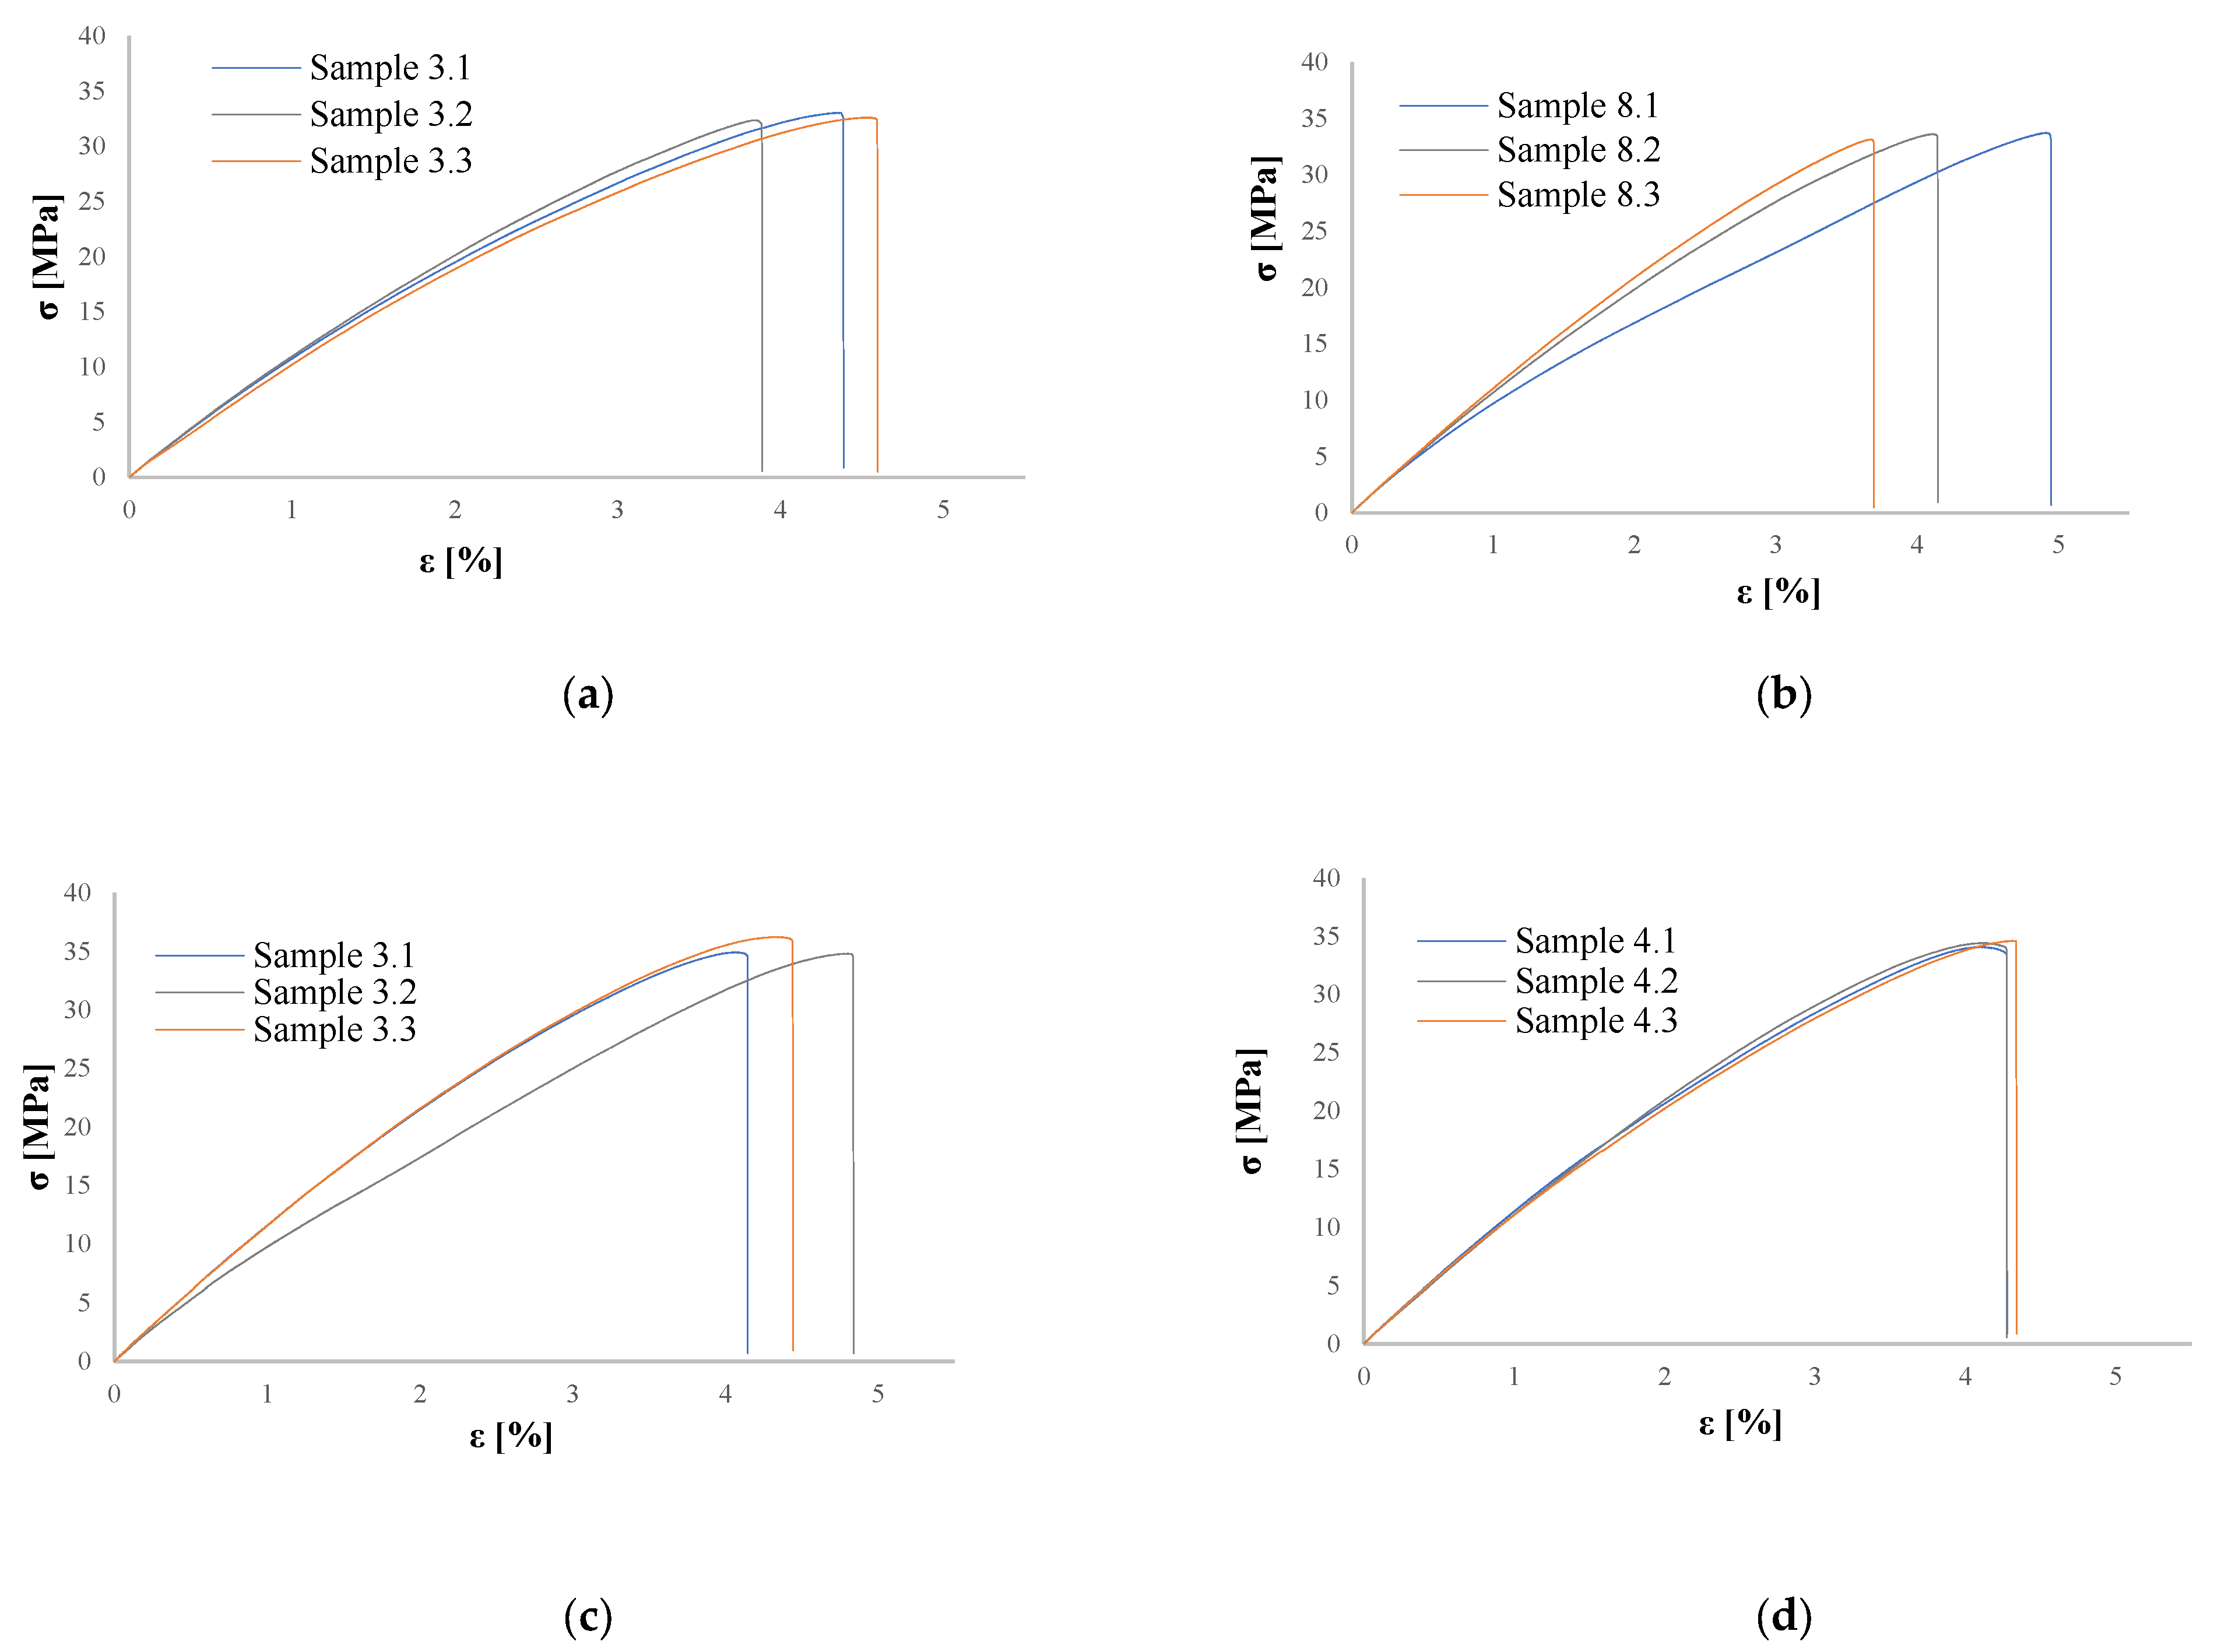
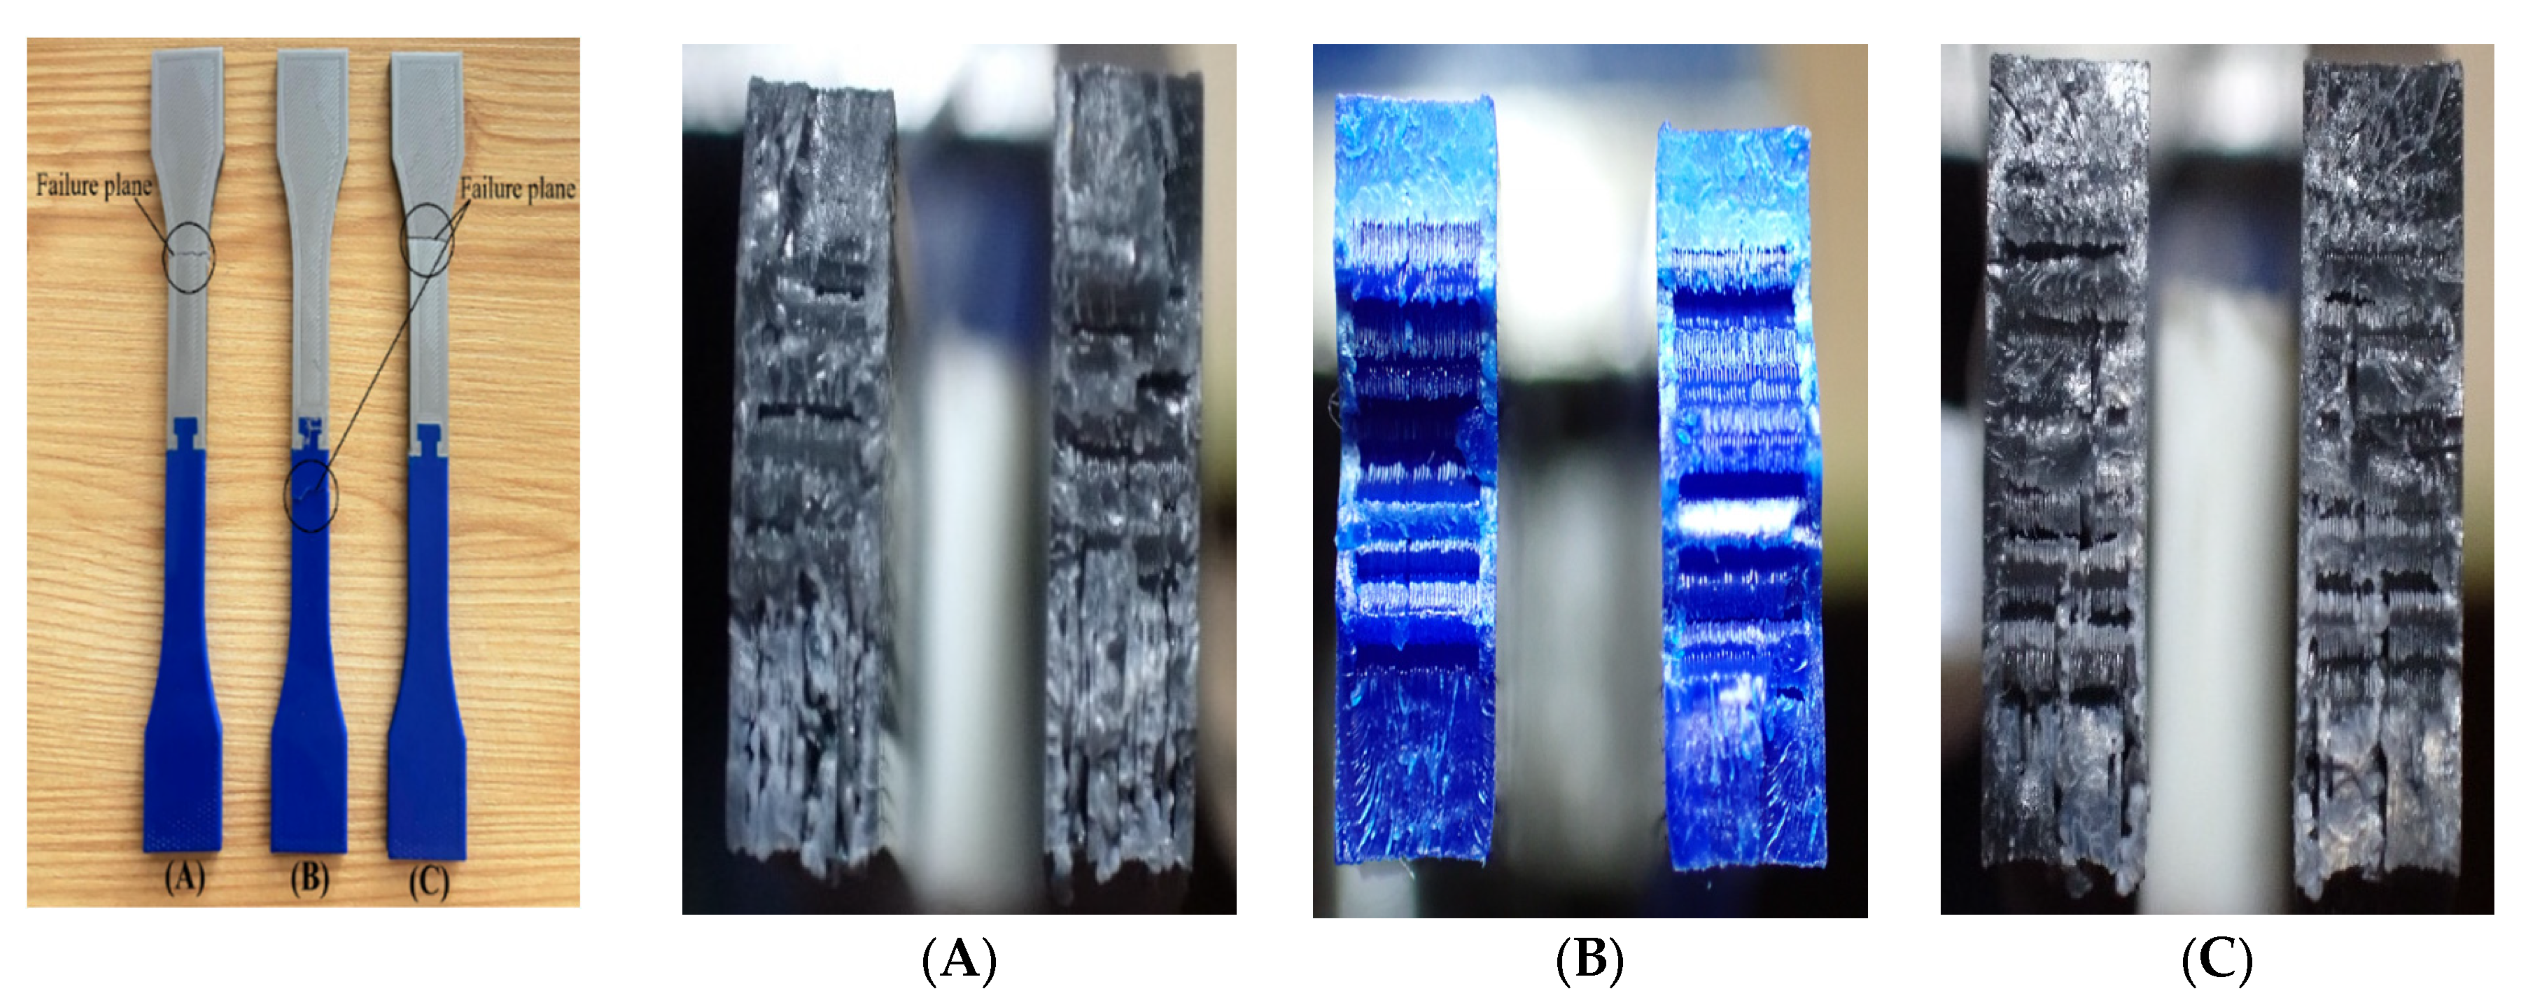
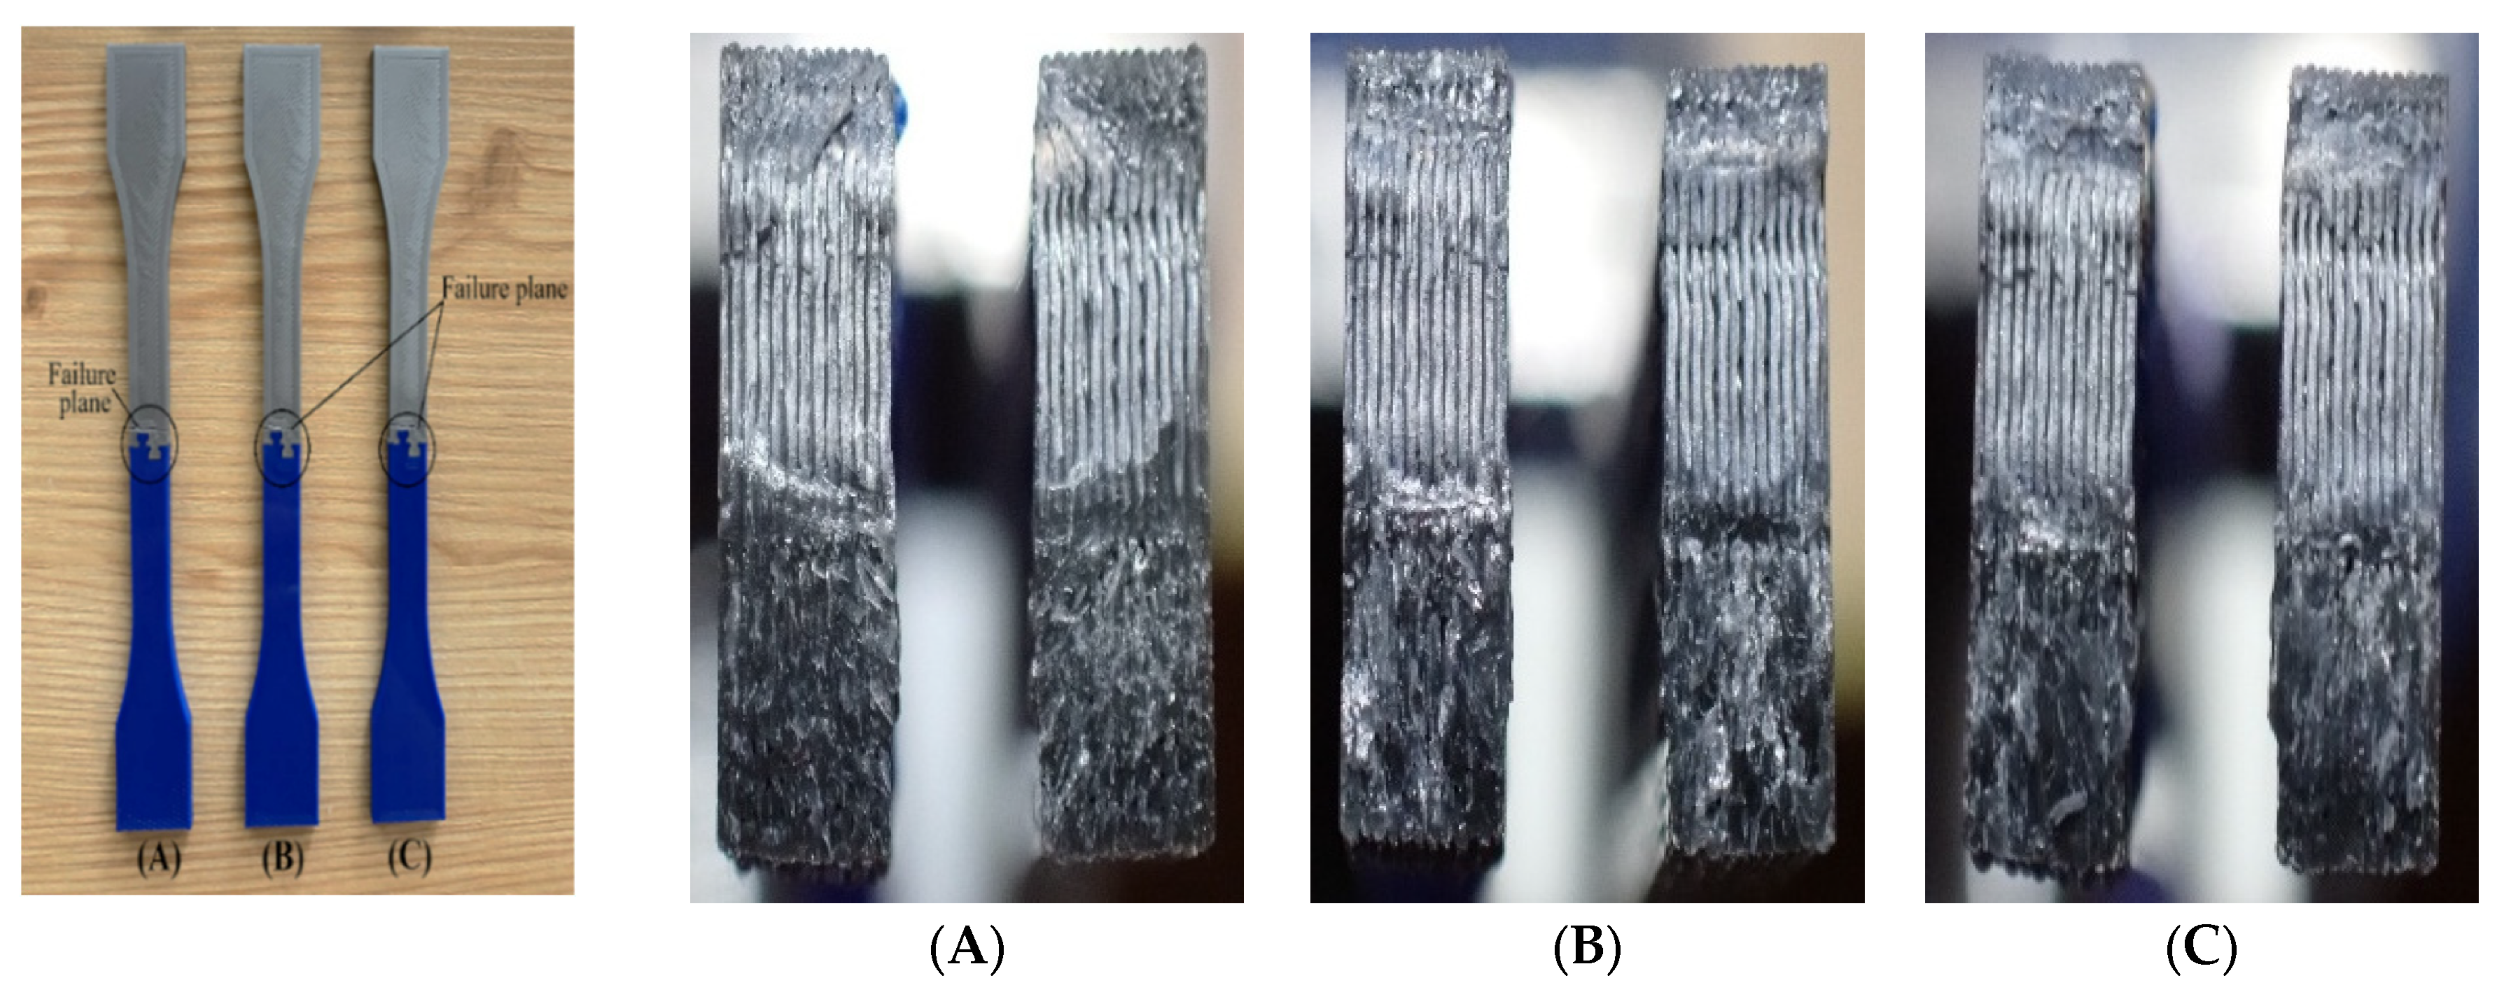
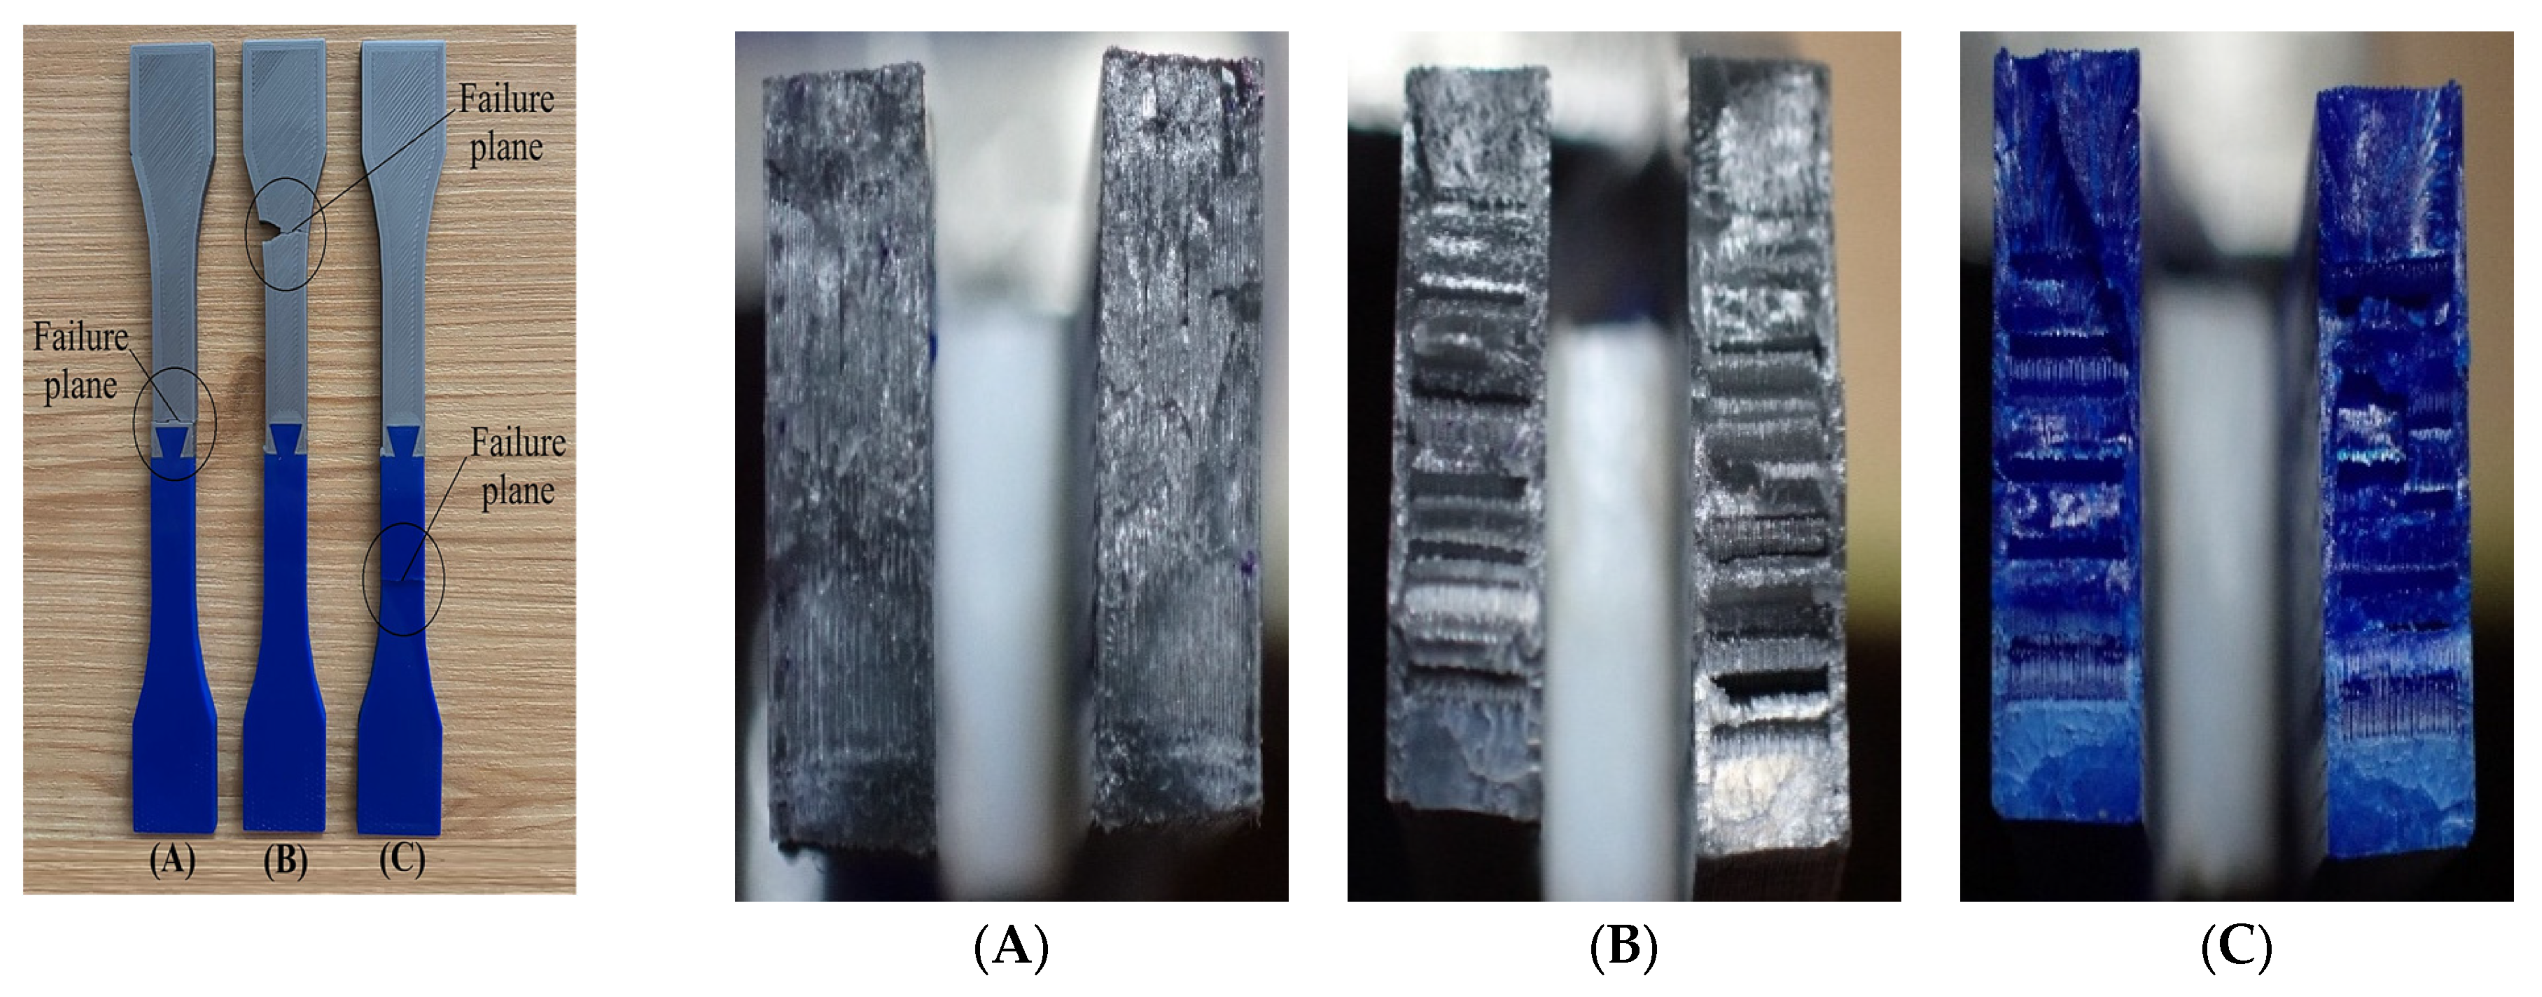
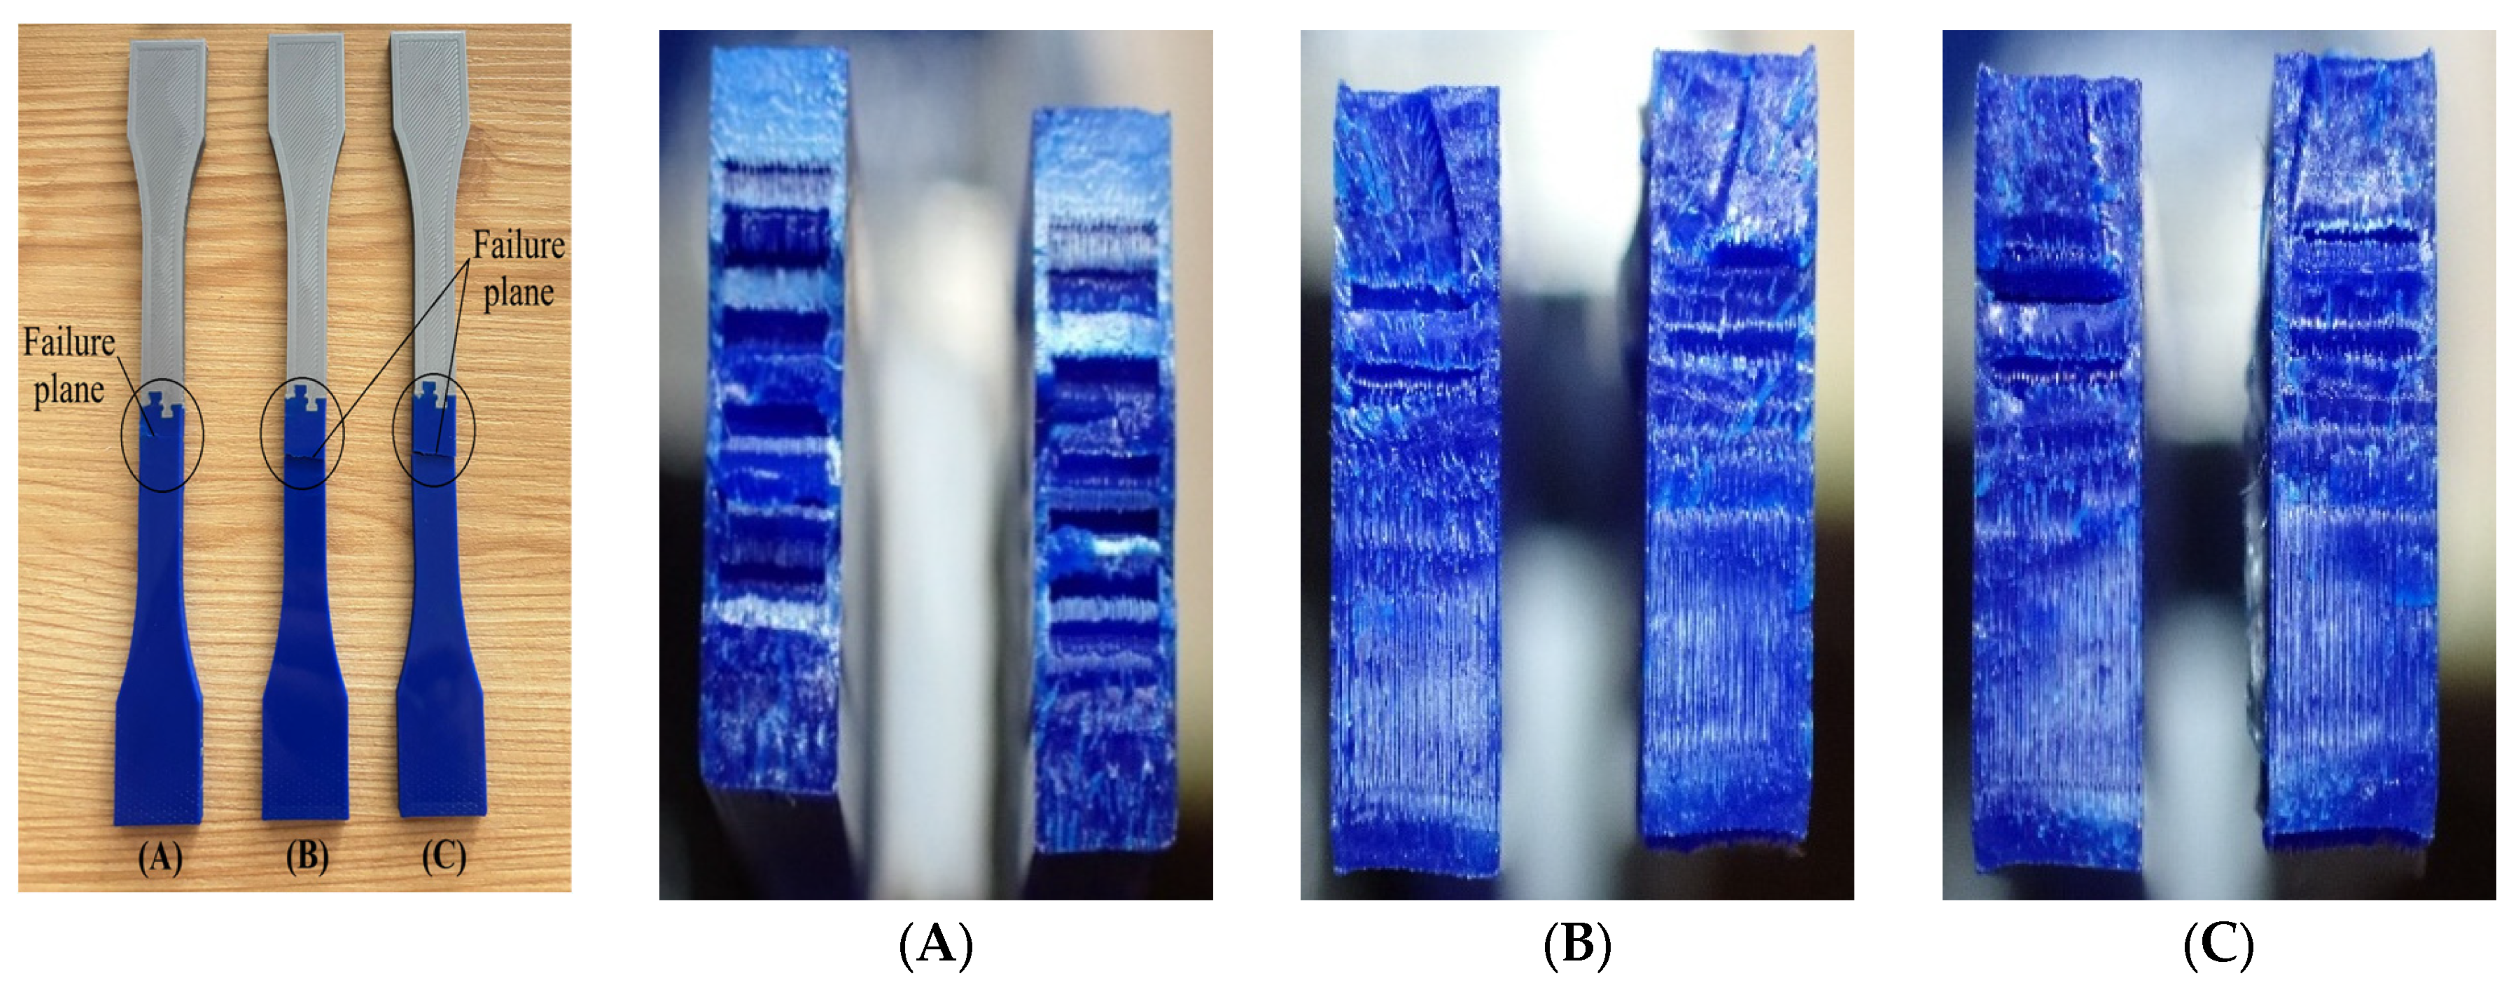
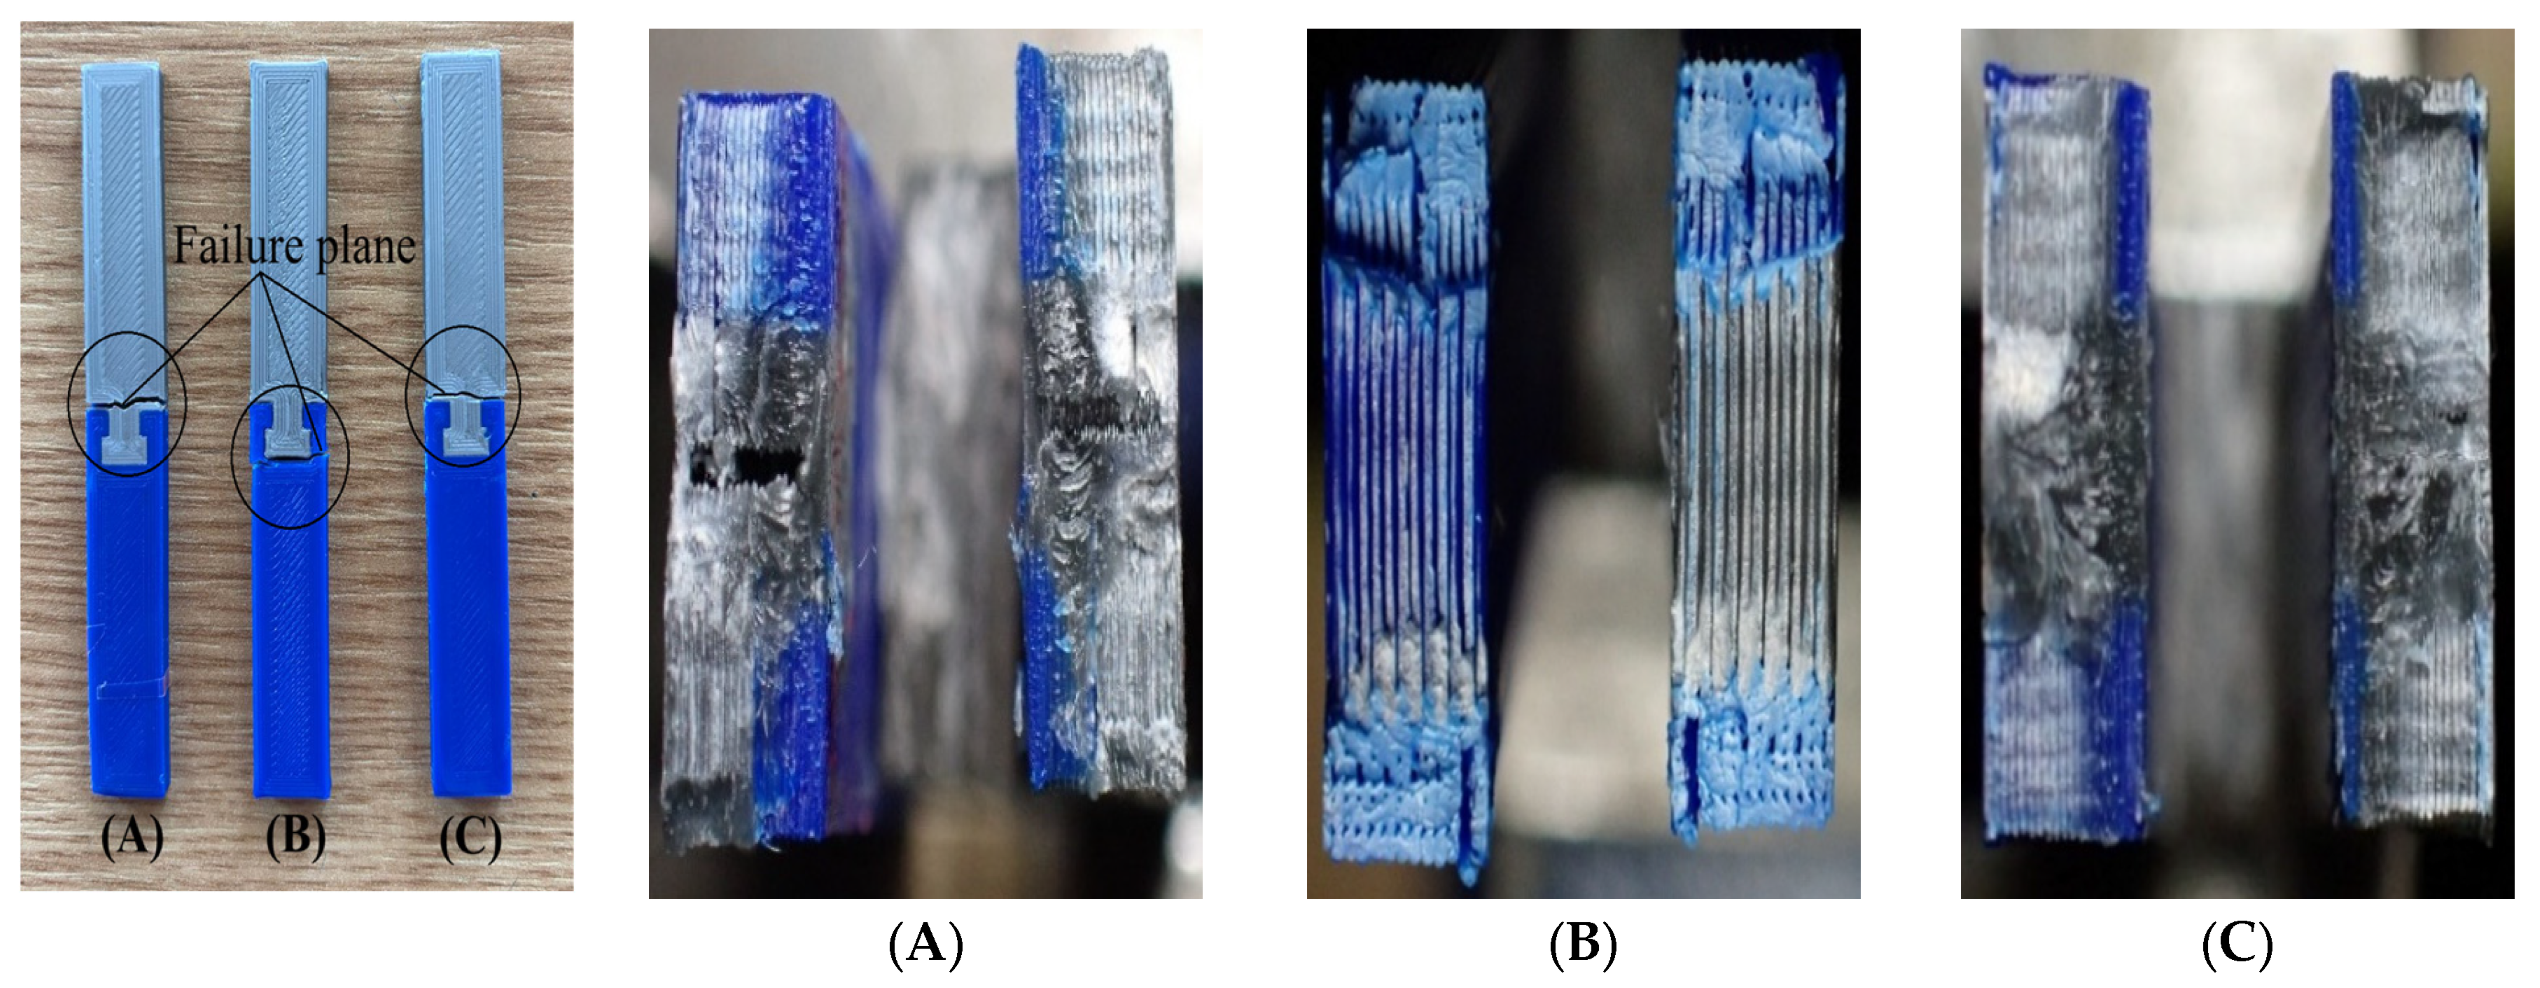
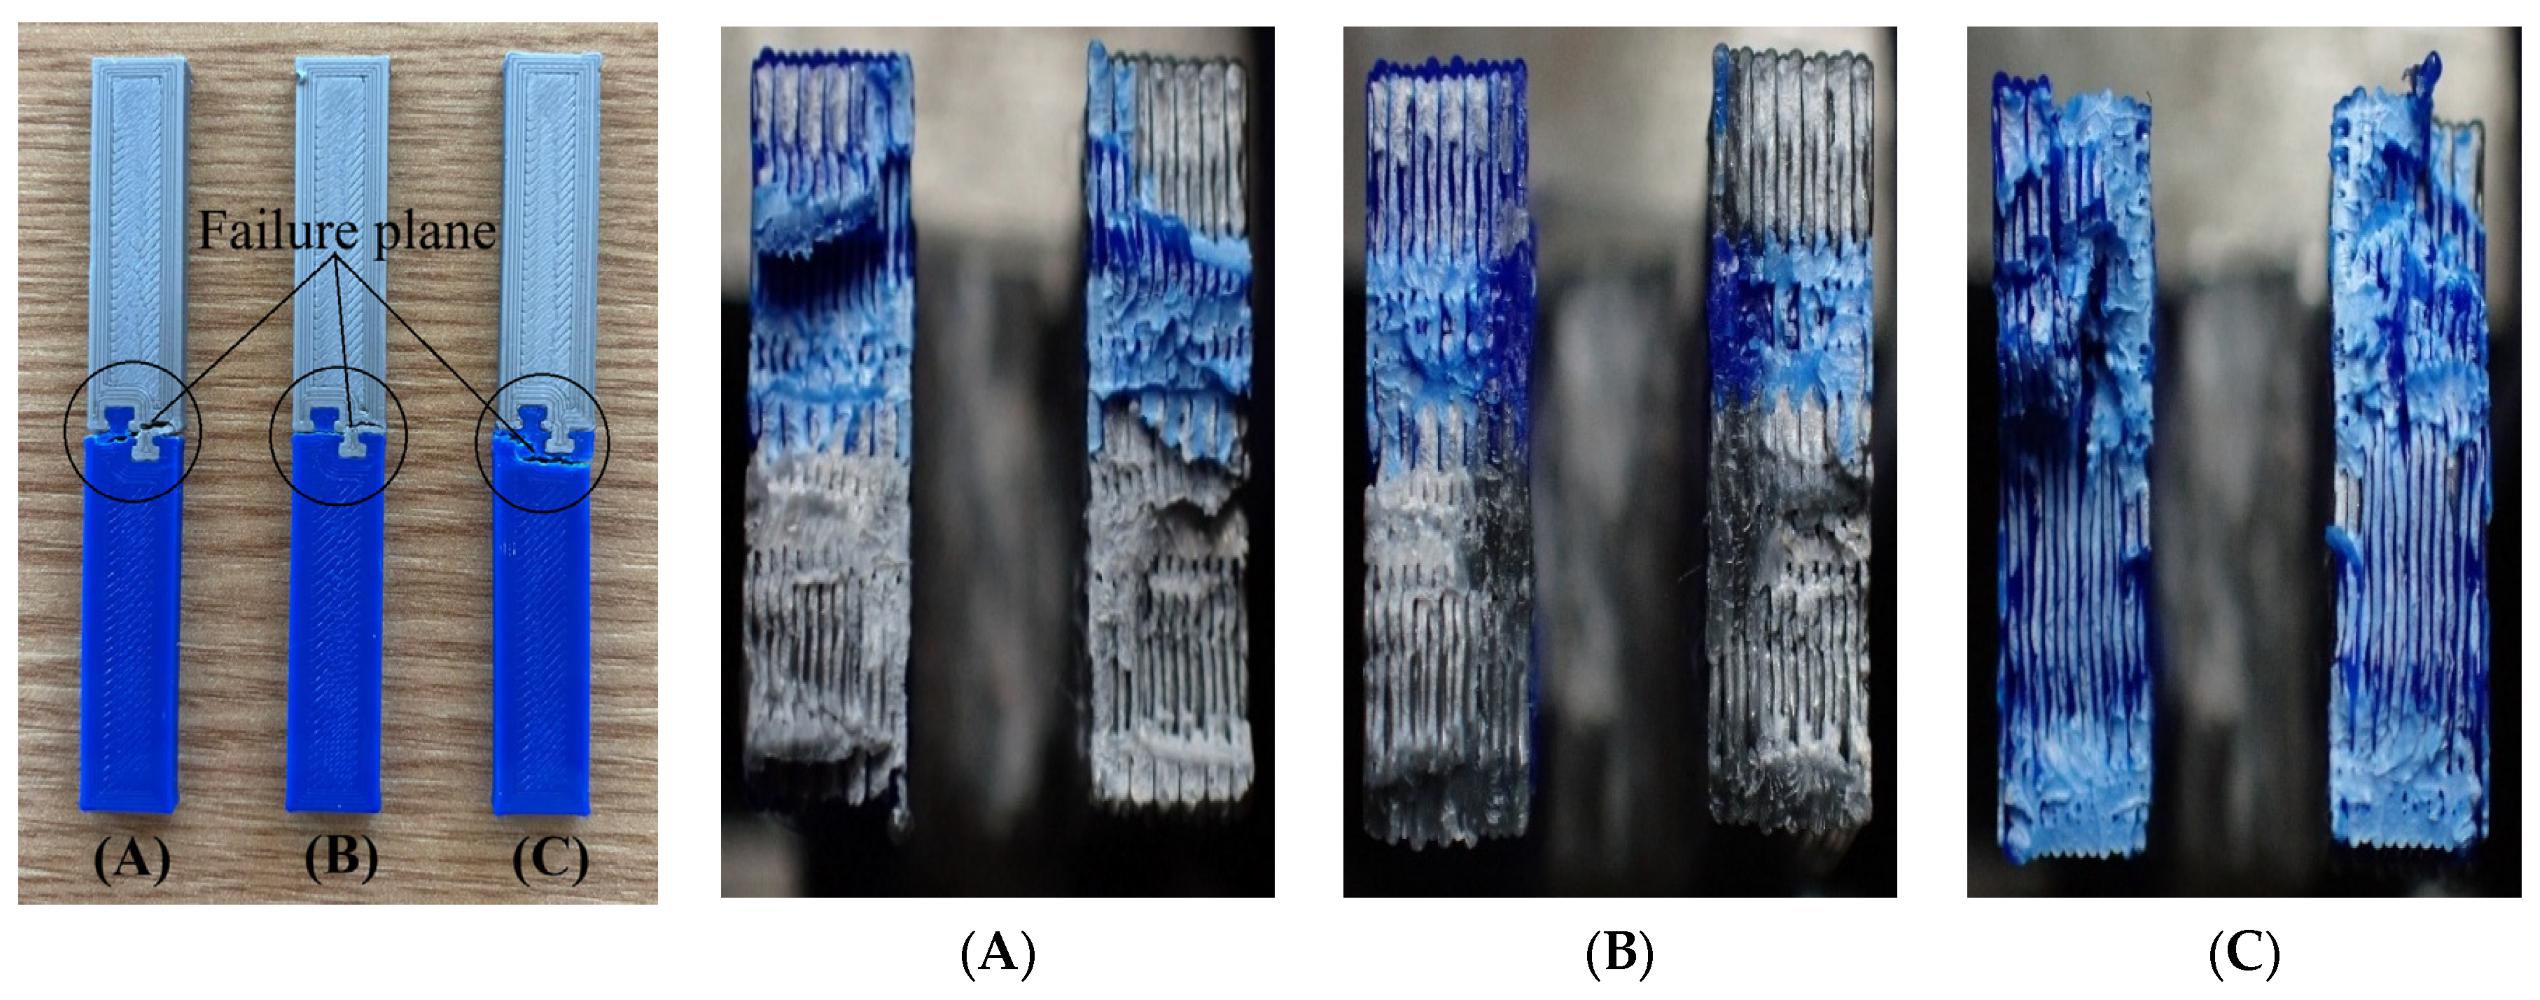
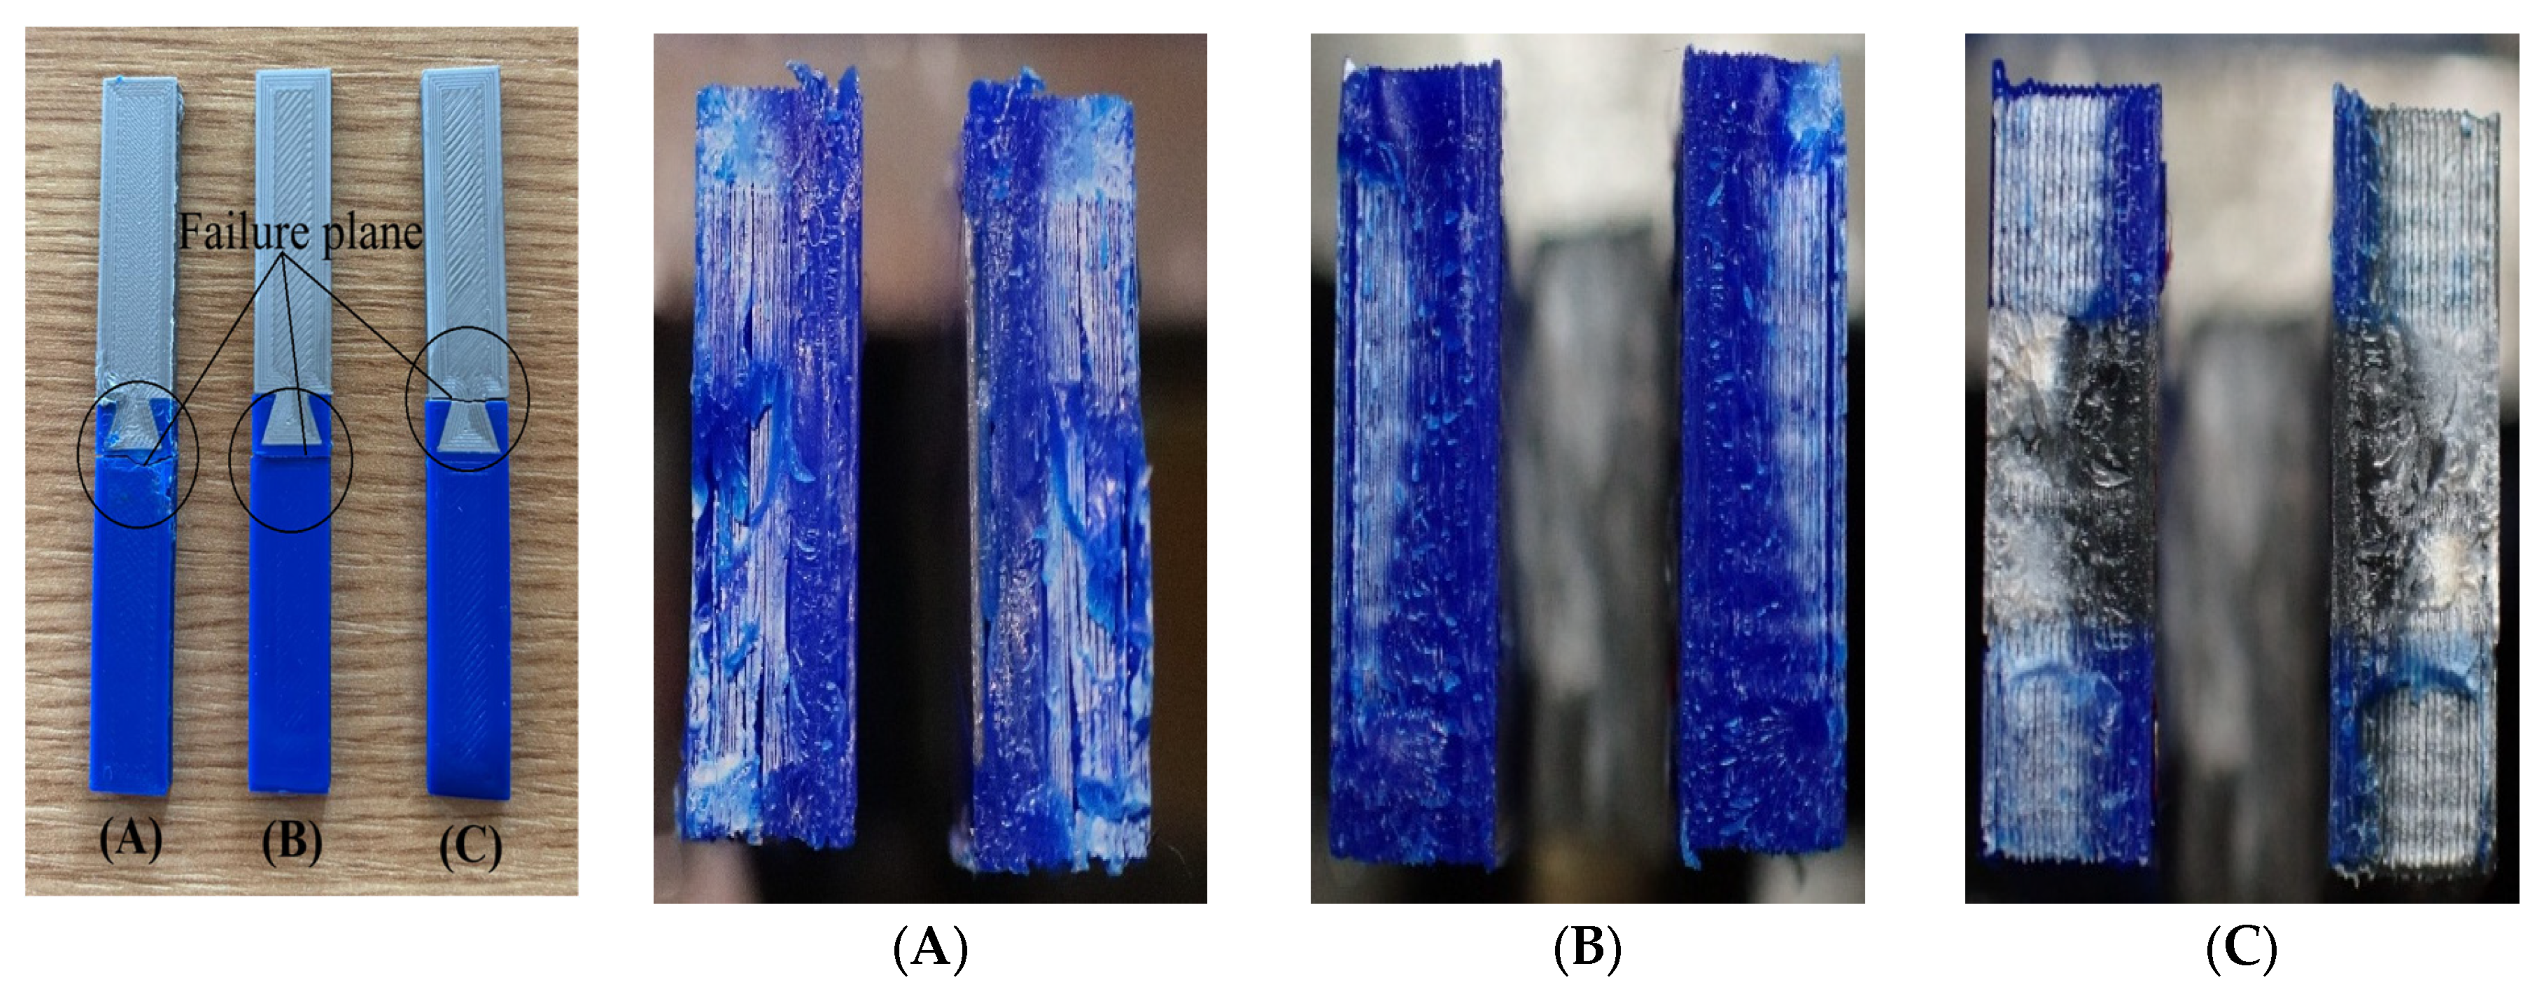
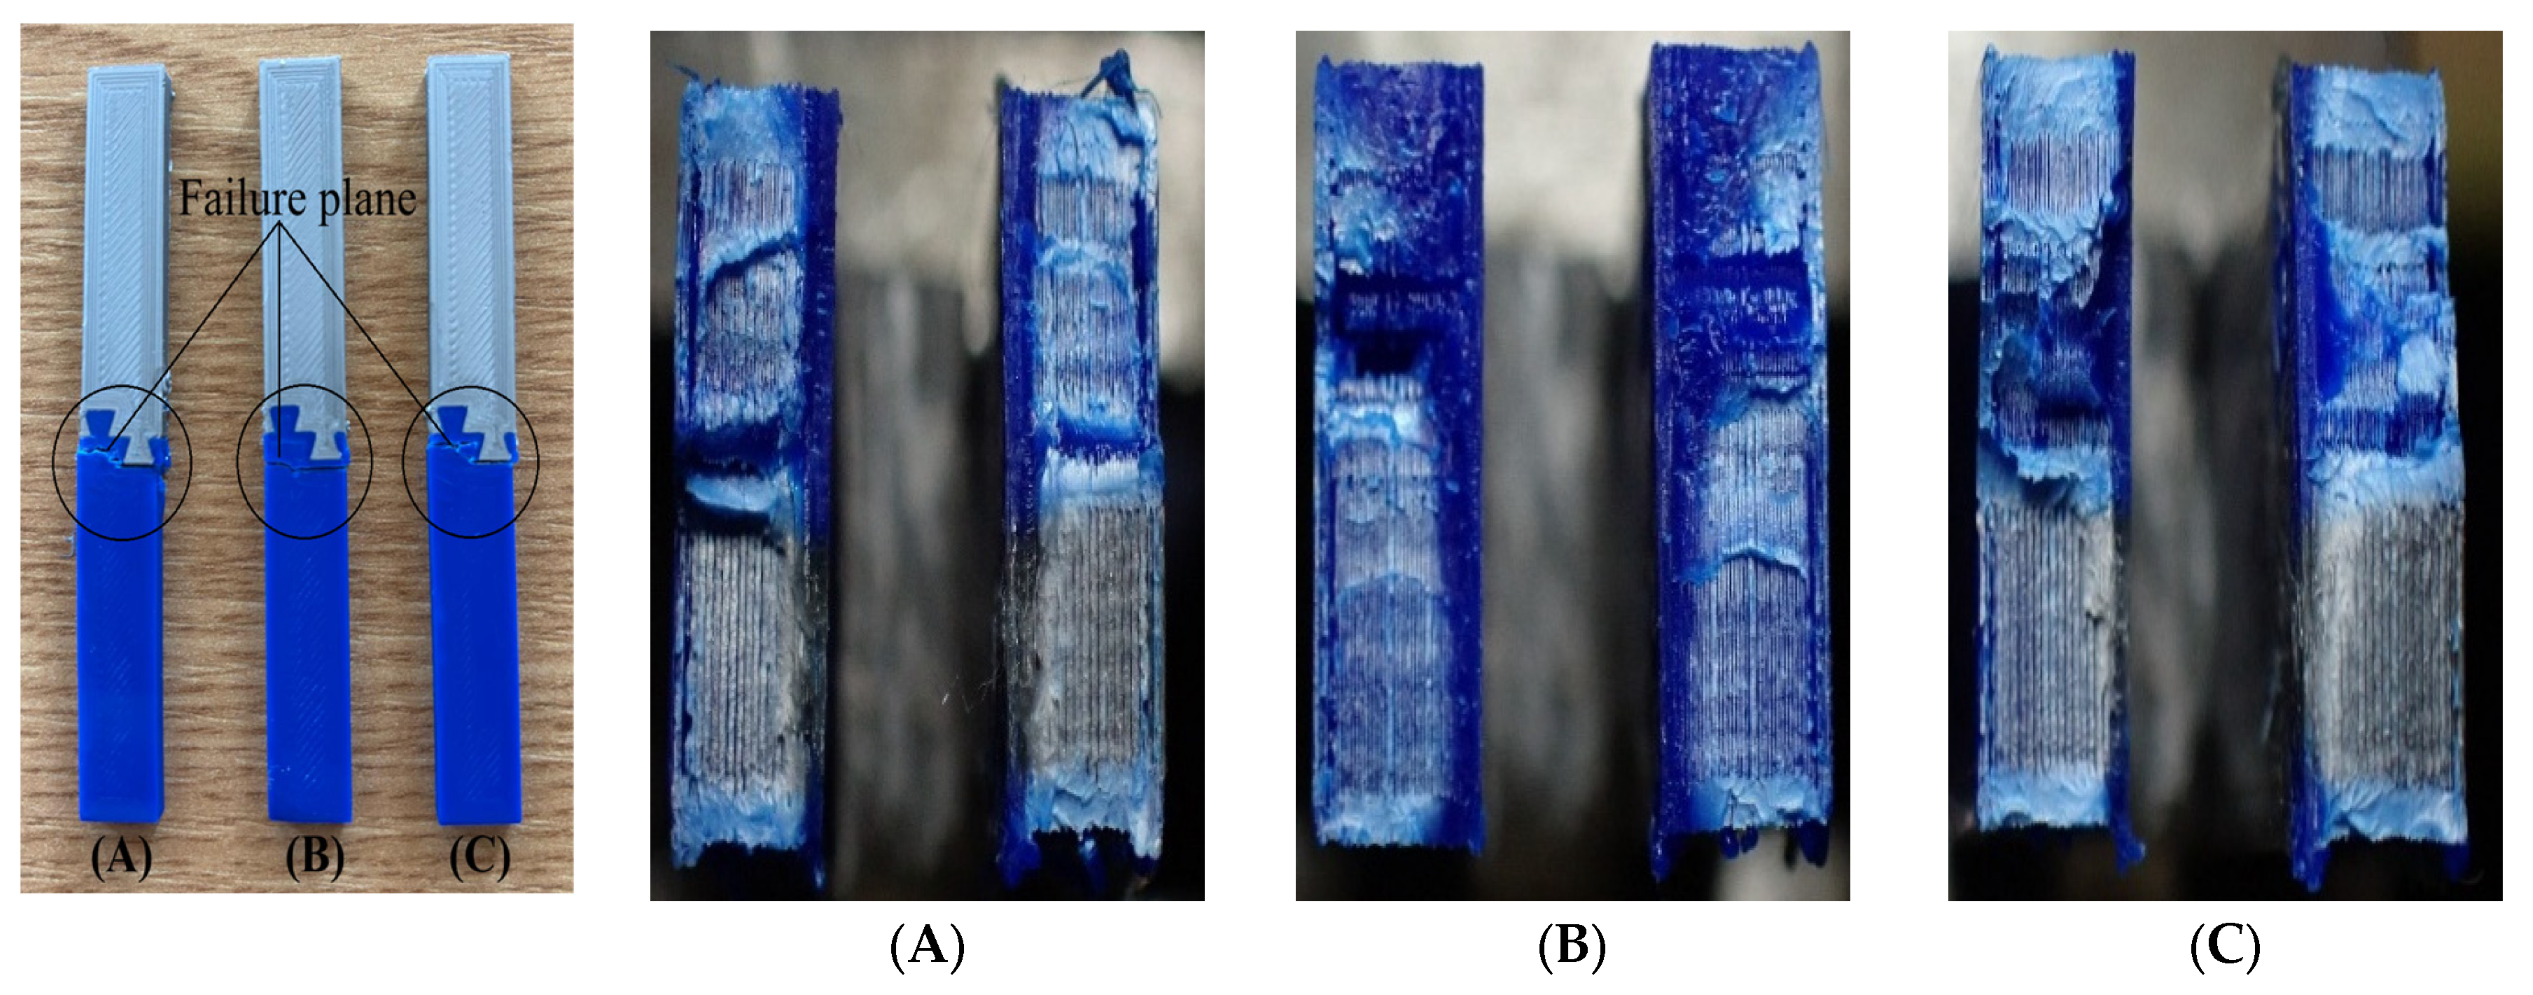
), and in the mirror turned around (2)), the failure mode and the achieved strength level were strongly correlated with the interconnection mechanism between the two materials and with the filament orientation relative to the loading direction., and 2 interfaces, printed from UltraFuse PLA Blue and PLA/PHA Shining Silver materials. interface): The results shown in Figure 2c,d revealed the most varied fracture patterns of the entire experiment. The fracture in the first A sample occurred in the PLA/PHA Shining Silver material in the area where the shells are oriented transversely to the direction of the tensile force (where adhesion is minimal). In sample B, the fracture occurred in the PLA/PHA Shining Silver material. Due to the four shells (as explained in the T interface), the mechanical properties are higher than those recorded in the first two experiments. The fracture micrographs in Figure 5 confirm that all samples with a dovetail interface fractured in areas near the interface, particularly in the PLA/PHA Shining Silver material, where the transverse shells create mechanical discontinuities. interface): In the first specimen (A) (Figure 6), the fracture occurred approximately 10 mm from the interface. In the other two specimens (B, C), the fracture was observed near the interface, in the UltraFuse PLA Blue region, where the shells are oriented transversely to the direction of the tensile force. The mechanical property results are the best and most homogeneous (minimal dispersion) across the entire experimental setup.- –
- Failure in the section consisting of shells oriented in the direction of the tensile force and the infill;
- –
- Delamination between the shells in the sections where the shells were oriented perpendicular to the direction of the tensile force.
interface allowed for a more uniform distribution of stresses in the interface region (resulting in lower stresses), which led to improved mechanical properties at fracture.3.2. Bending
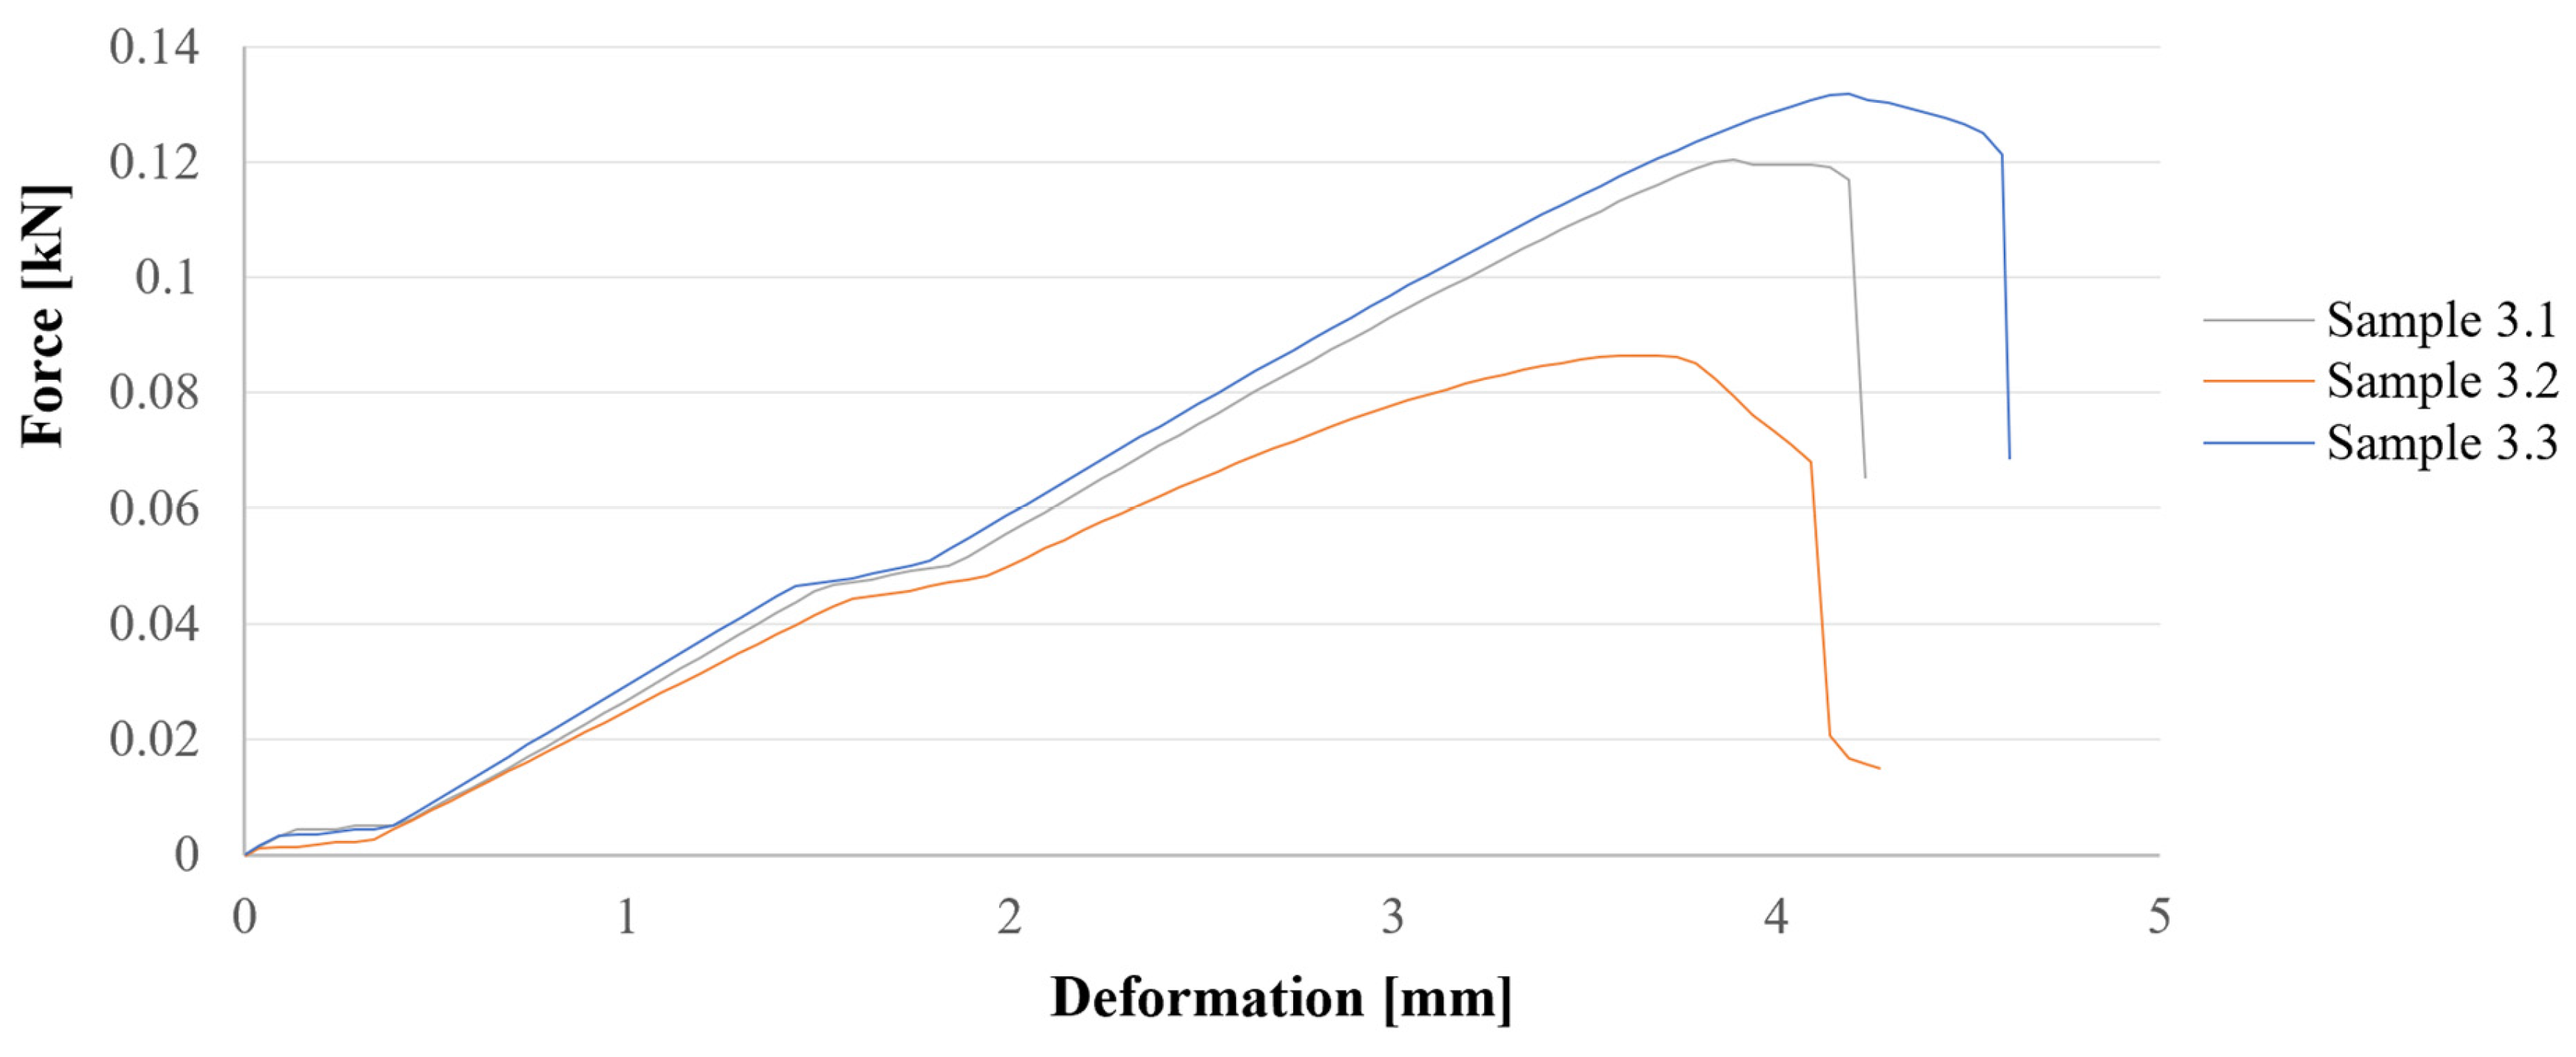
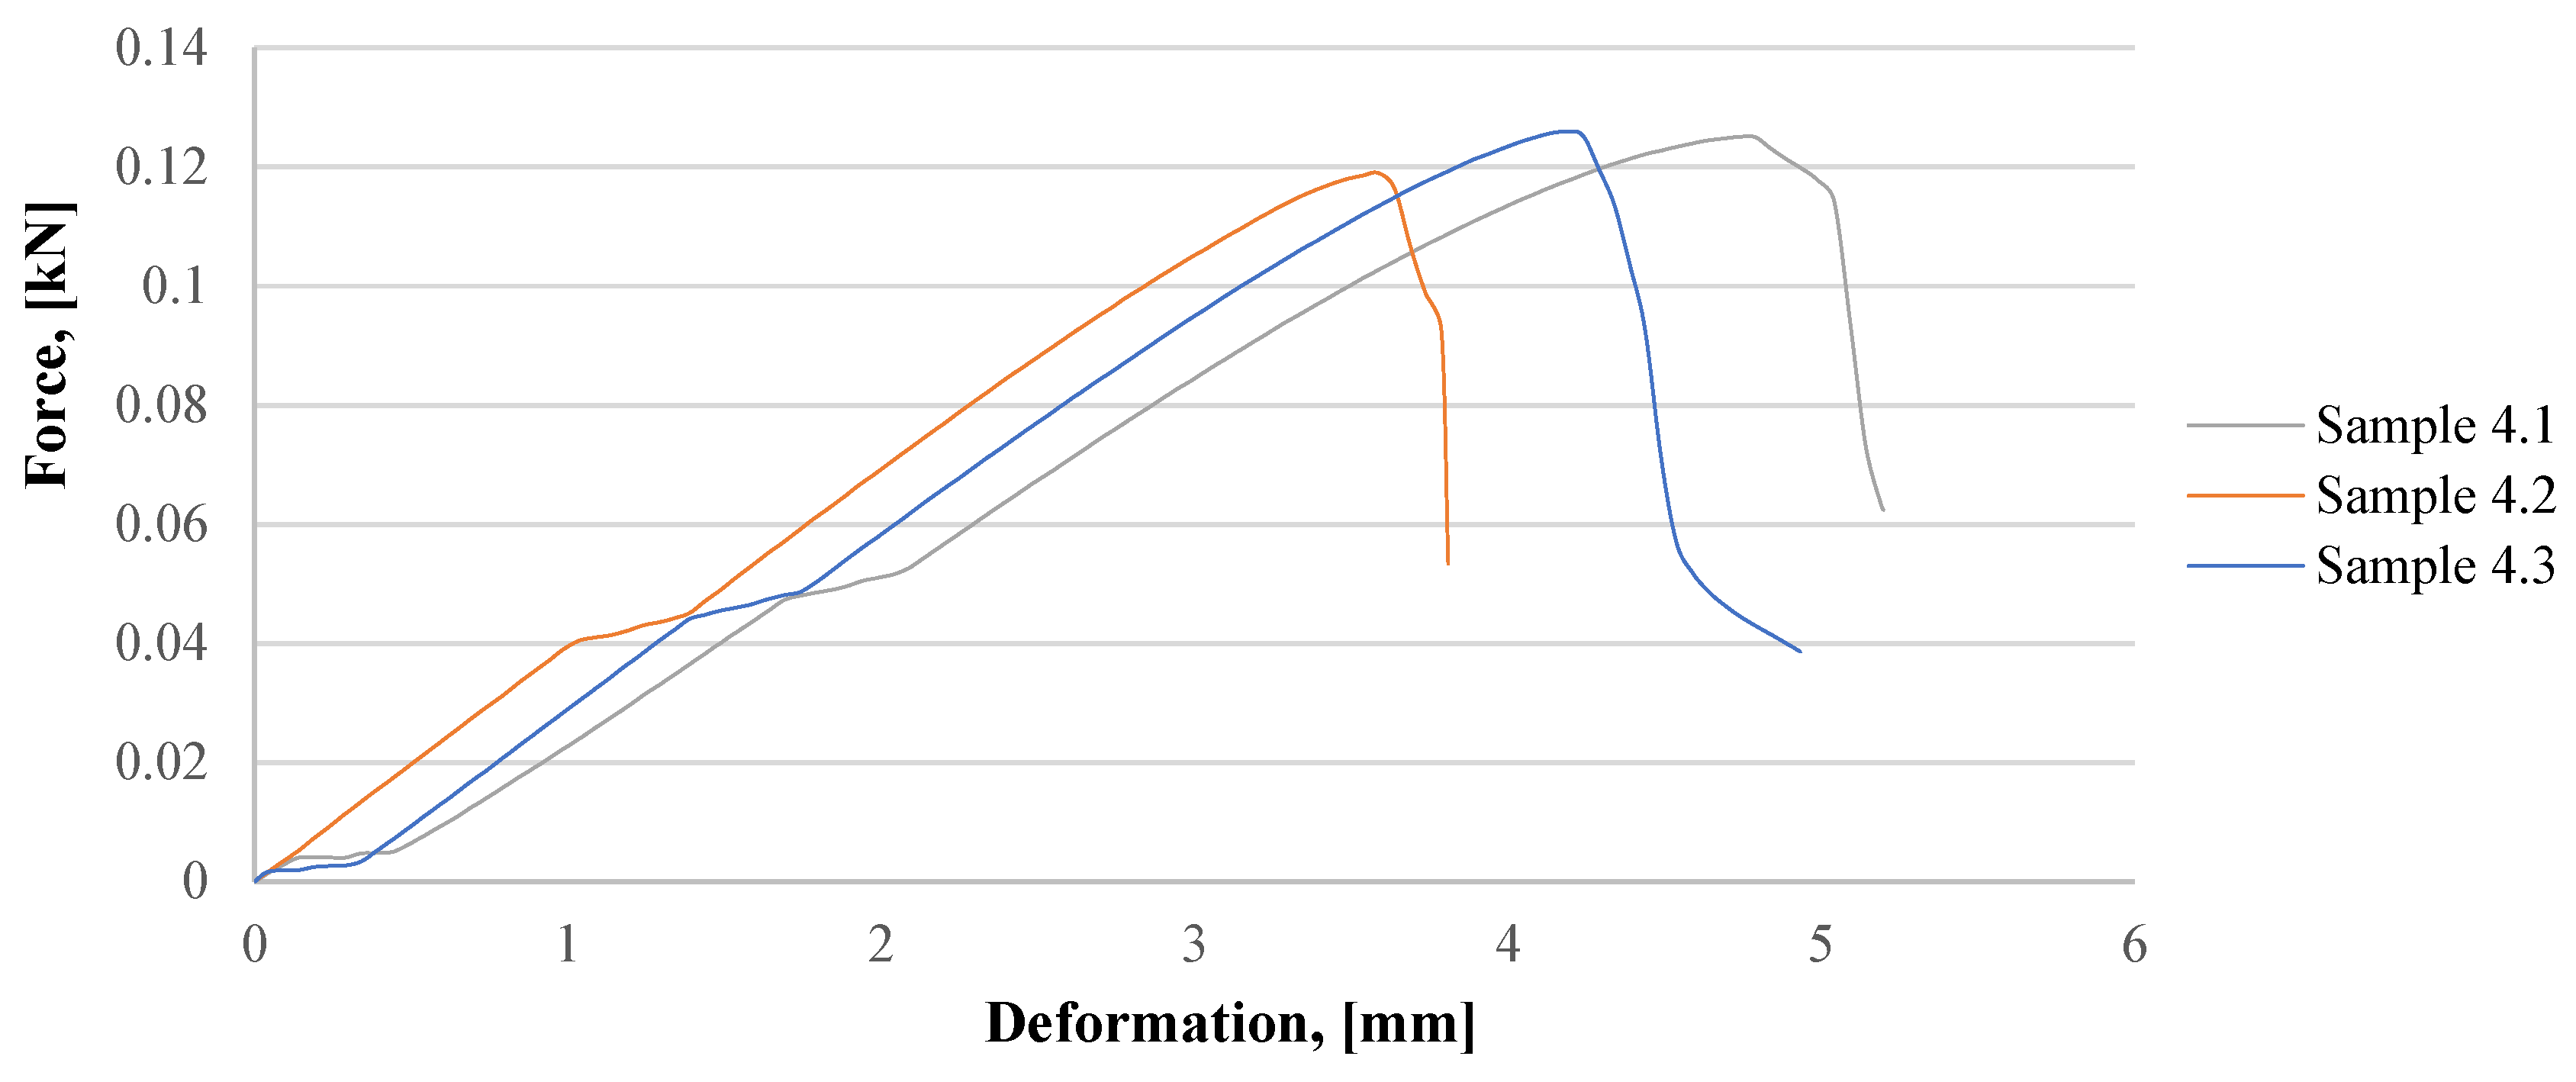
interface and 2 interface) printed using UltraFuse PLA Blue and PLA/PHA Shining Silver materials are shown below (Figure 11 and Figure 12). interface. interface.3.3. Charpy Impact
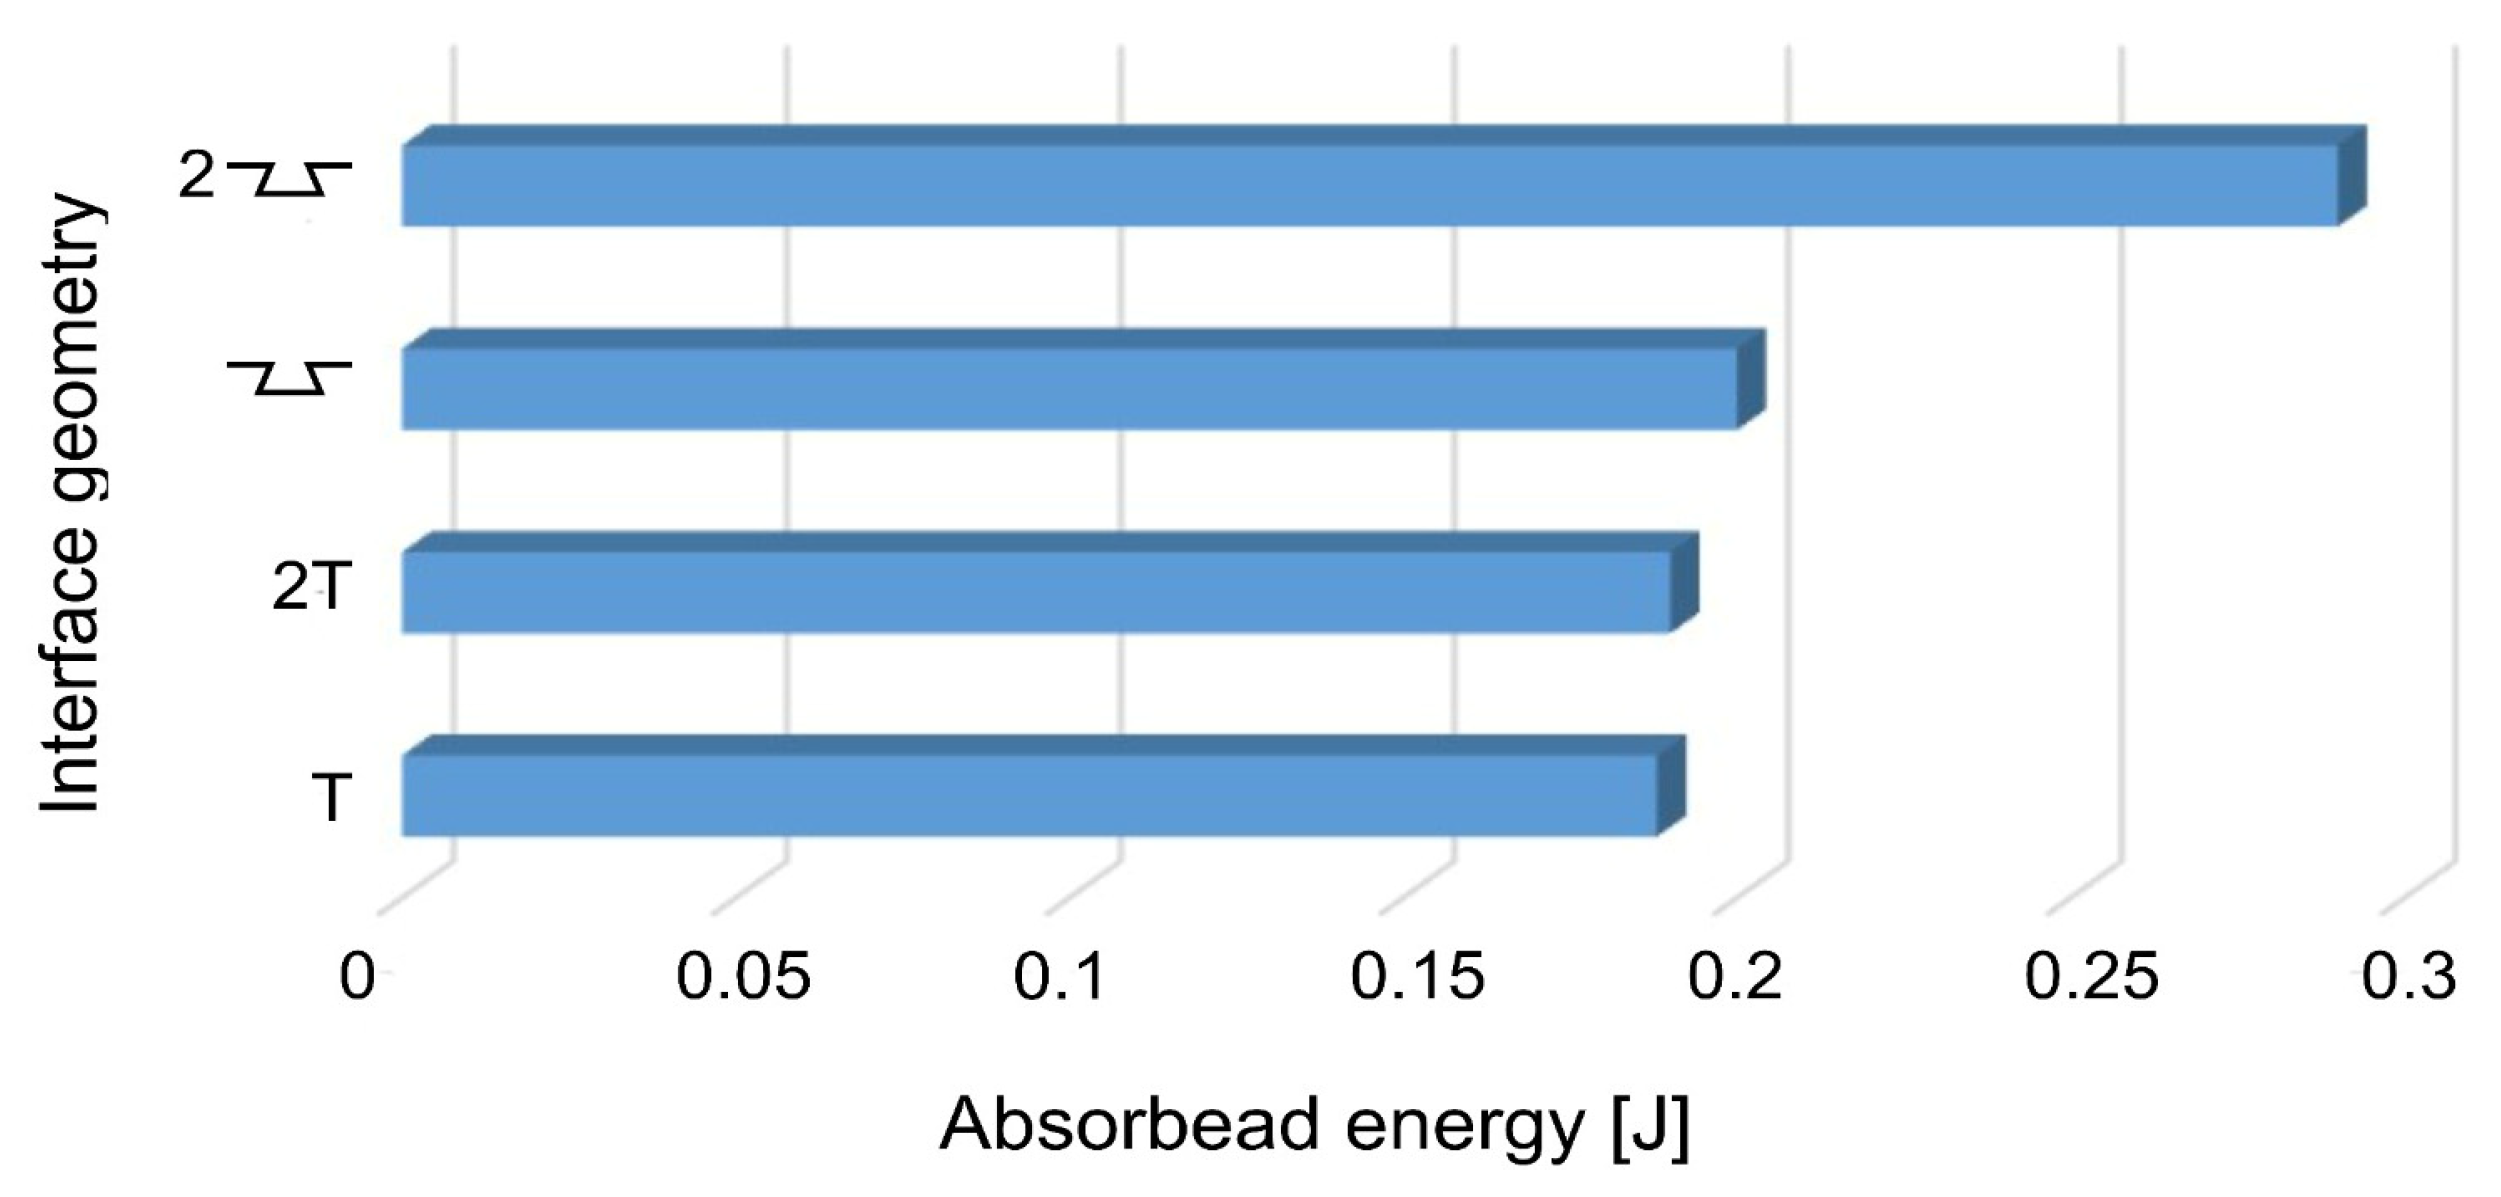
interface, and Figure 19—2 interface). interface (Figure 18), the fracture surfaces exhibit significant irregularities. Extensive areas of tearing and mixed fracture are observed. The images in Figure 19 show fracture surfaces with very significant irregularities.3.4. Topographical Characterization
3.5. X-Ray Computer Tomography
interface. interface (Figure 1b, Table 11), in Experiment 3, the lowest void percentage was recorded for specimen 3C, at 3.637%, which also explains the highest value obtained for σmax, at 36.23 MPa. The highest percentage of voids was obtained in sample 3B, at 4.83029%, which also explains the minimum value for σmax of 34.80 MPa and the tensile failure of the PLA/PHA Shinning Silver material.4. Conclusions
interface) were taken into account. Thus, the bending test results showed that the samples printed using the print parameters corresponding to Experiment 3 (T interface) exhibited the highest bending strength, with a value of 59.75 MPa, and the highest load of 0.13 kN. The mean energy absorbed during the Charpy test ranged from 0.18 to 0.29 J, which explained the brittle–semi-ductile behavior of the materials used.Author Contributions
Funding
Data Availability Statement
Conflicts of Interest
References
- Dey, A.; Roan Eagle, I.N.; Yodo, N. A Review on Filament Materials for Fused Filament Fabrication. J. Manuf. Mater. Process. 2021, 5, 69. [Google Scholar] [CrossRef] [Scilit]
- Fico, D.; Rizzo, D.; Casciaro, R.; Esposito Corcione, C. A Review of Polymer-Based Materials for Fused Filament Fabrication (FFF): Focus on Sustainability and Recycled Materials. Polymers 2022, 14, 465. [Google Scholar] [CrossRef] [Scilit] [PubMed]
- Mazurchevici, S.N.; Pricop, B.; Istrate, B.; Mazurchevici, A.D.; Carlescu, V.; Carausu, C.; Nedelcu, D. Technological Parameters Effects on Mechanical Properties of Biodegradable Materials Using FDM. Mater. Plast. 2020, 57, 215–227. [Google Scholar] [CrossRef] [Scilit]
- Catana, M.; Mazurchevici, S.N. Characterization of Bicomponent 3D Printing Technologies of Biodegradable Materials. Intl. J. Manuf. Econ. Manag. 2022, 2, 18–36. [Google Scholar] [CrossRef] [Scilit]
- Cojocaru, V.; Frunzaverde, D.; Miclosina, C.-O.; Marginean, G. The Influence of the Process Parameters on the Mechanical Properties of PLA Specimens Produced by Fused Filament Fabrication—A Review. Polymers 2022, 14, 886. [Google Scholar] [CrossRef] [Scilit] [PubMed]
- Samykano, M.; Kumaresan, R.; Kananathan, J.; Kadirgama, K.; Pandey, A.K. An Overview of Fused Filament Fabrication Technology and the Advancement in PLA-Biocomposites. Int. J. Adv. Manuf. Technol. 2024, 132, 27–62. [Google Scholar] [CrossRef] [Scilit]
- Sandanamsamy, L.; Harun, W.S.W.; Ishak, I.; Romlay, F.R.M.; Kadirgama, K.; Ramasamy, D.; Idris, S.R.A.; Tsumori, F. A Comprehensive Review on Fused Deposition Modelling of PLA. Prog. Addit. Manuf. 2023, 8, 775–799. [Google Scholar] [CrossRef] [Scilit] [PubMed]
- Nazir, A.; Gokcekaya, O.; Billah, K.M.M.; Ertugrul, O.; Jiang, J.; Sun, J.; Hussain, S. Multi-Material Additive Manufacturing: A Systematic Review of Design, Properties, Applications, Challenges, and 3D Printing of Materials and Cellular Metamaterials. Mater. Des. 2023, 226, 111661. [Google Scholar] [CrossRef] [Scilit]
- Wang, Z.; Wang, L.; Tang, F.; Chen, J. Multi-Material Additive Manufacturing via Fused Deposition Modeling 3D Printing: A Systematic Review on the Material Feeding Mechanism. Proc. Inst. Mech. Eng. Part E J. Process Mech. Eng. 2024, 239, 3865–3880. [Google Scholar] [CrossRef] [Scilit]
- Mazurchevici, A.D.; Popa, R.I.; Carausu, C.; Mazurchevici, S.N.; Nedelcu, D. Influence of Layer Thickness, Infill Rate and Orientation on Thermal and Structural Loading of FDM Parts. In Advances in Manufacturing Processes; Dave, H.K., Nedelcu, D., Eds.; Lecture Notes in Mechanical Engineering; Springer: Singapore, 2021; pp. 263–282. [Google Scholar] [CrossRef] [Scilit]
- Verma, A.; Kapil, A.; Klobčar, D.; Sharma, A. A Review on Multiplicity in Multi-Material Additive Manufacturing: Process, Capability, Scale, and Structure. Materials 2023, 16, 5246. [Google Scholar] [CrossRef] [Scilit] [PubMed]
- Nipu, S.M.A.; Tang, T.; Joralmon, D.; Liu, T.; Li, R.; Yoo, M.; Li, X. Advances and perspectives in multi-material additive manufacturing of heterogeneous metal–polymer components. npj Adv. Manuf. 2025, 2, 31. [Google Scholar] [CrossRef] [Scilit]
- Fakhr Ghasemi, A.; Pinto Duarte, J. A Systematic Review of Innovative Advances in Multi-Material Additive Manufacturing: Implications for Architecture and Construction. Materials 2025, 18, 1820. [Google Scholar] [CrossRef] [Scilit] [PubMed]
- Ribeiro, M.; Sousa Carneiro, O.; Ferreira da Silva, A. Interface geometries in 3D multi-material prints by fused filament fabrication. Rapid Prototyp. J. 2019, 25, 38–46. [Google Scholar] [CrossRef] [Scilit]
- Altuntaş, U.; Çöker, D.; Yavaş, D. Creating Tougher Interfaces via Suture Morphology in 3D-Printed Multi-Material Polymer Composites by Fused Filament Fabrication. Addit. Manuf. 2023, 61, 103359. [Google Scholar] [CrossRef] [Scilit]
- Catana, M.; Mazurchevici, S.N.; Carausu, C.; Mîndru, T.D.; Nedelcu, D. Bicomponent Additive Manufacturing of Polymers—A Review. Int. J. Mod. Manuf. Technol. 2024, 16, 13–31. [Google Scholar] [CrossRef] [Scilit]
- Mazurchevici, S.N.; Catana, M. Ways to Reduce Common Imperfections in 3D Printing. Int. J. Mod. Manuf. Technol. 2024, 4, 43–50. [Google Scholar] [CrossRef] [Scilit]
- Kluczyński, J.; Śnieżek, L.; Kravcov, A.; Grzelak, K.; Svoboda, P.; Szachogłuchowicz, I.; Franek, O.; Morozov, N.; Torzewski, J.; Kubeček, P. The Examination of Restrained Joints Created in the Process of Multi-Material FFF Additive Manufacturing Technology. Materials 2020, 13, 903. [Google Scholar] [CrossRef] [Scilit] [PubMed]
- Yu, X.; Griffis, J.; Manogharan, G.; Panesar, A. Multi-material additive manufacturing: A computational design perspective. Virtual Phys. Prototyp. 2025, 20, e2546671. [Google Scholar] [CrossRef] [Scilit]
- Hussain, M.; Khan, S.M.; Shafiq, M.; Abbas, N. A review on PLA-based biodegradable materials for biomedical applications. Giant 2024, 18, 100261. [Google Scholar] [CrossRef] [Scilit]
- Mustafa, I.; Kwok, T.H. Interlacing Infills for Multi-Material Fused Filament Fabrication Using Layered Depth Material Images. Micromachines 2022, 13, 773. [Google Scholar] [CrossRef] [Scilit] [PubMed]
- Mazurchevici, A.D.; Carausu, C.; Popa, R.I.; Mazurchevici, S.N.; Nedelcu, D. Infill and Type Influence on Tensile Strength of PLA Biodegradable Material Manufactured by FDM. Int. J. Mod. Manuf. Technol. 2019, 11, 44–49. [Google Scholar]
- Feraru, M.; Mazurchevici, S.N.; Lohan, N.M.; Benchea, M.; Lupu, F.C.; Nedelcu, D. Tribological and Structural Properties of Copper-Coated 3D-Printed Parts from Biodegradable Polymers. Micromachines 2025, 16, 100. [Google Scholar] [CrossRef] [Scilit] [PubMed]
- Kurowiak, J.; Klekiel, T.; Będziński, R. Biodegradable Polymers in Biomedical Applications: A Review—Developments, Perspectives and Future Challenges. Int. J. Mol. Sci. 2023, 24, 16952. [Google Scholar] [CrossRef] [Scilit] [PubMed]
- Rajendran, D.S.; Venkataraman, S.; Jha, S.K.; Chakrabarty, D.; Kumar, V.V. A review on bio-based polymer polylactic acid potential on sustainable food packaging. Food Sci. Biotechnol. 2024, 33, 1759–1788. [Google Scholar] [CrossRef] [Scilit] [PubMed]
- Adekoya, G.J.; Ezika, A.C.; Adekoya, O.C.; Sadiku, E.R.; Hamam, Y.; Ray, S.S. Recent advancements in biomedical application of polylactic acid/graphene nanocomposites: An overview. BMEMat 2023, 1, e12042. [Google Scholar] [CrossRef] [Scilit]
- Zhou, Z. Application of Polylactic Acid in Clinical Medicine. Highl. Sci. Eng. Technol. 2024, 116, 1–8. [Google Scholar] [CrossRef] [Scilit]
- Olonisakin, K.; Mohanty, A.K.; Thimmanagari, M.; Misra, M. Recent advances in biodegradable polymer blends and their biocomposites: A comprehensive review. Green Chem. 2025, 27, 11656–11704. [Google Scholar] [CrossRef] [Scilit]
- Shunmugasundaram, M.; Ali Baig, A.M.; Ajay Kumar, M.A. A review of bio-degradable materials for fused deposition modeling machine. Mater. Today Proc. 2020, 27, 1596–1600. [Google Scholar] [CrossRef] [Scilit]
- Faidallah, R.F.; Hanon, M.M.; Szakál, Z.; Oldal, I. Biodegradable Materials Used in FDM 3D Printing Technology: A Critical Review. J. Mod. Mech. Eng. Technol. 2022, 9, 90–105. [Google Scholar] [CrossRef] [Scilit]
- Tao, Y.; Li, P.; Zhang, J.; Wang, S.; Shi, S.Q.; Kong, F. A review of fused filament fabrication of continuous natural fiber reinforced thermoplastic composites: Techniques and materials. Polym. Compos. 2023, 44, 8200–8222. [Google Scholar] [CrossRef] [Scilit]
- Mian, S.H.; bin Jumah, A.; Saleh, M.; Mohammed, J.A. Fabrication of PLA–Date Fiber Biocomposite via Extrusion Maker for 3D Printing and Its Characterization for Eco-Friendly and Sustainable Applications. Polymers 2025, 17, 2707. [Google Scholar] [CrossRef] [Scilit] [PubMed]
- Sivalingam, S.; Bhuvaneswari, V.; Rajeshkumar, L.; Balaji, D. Additive Manufacturing of Metal-Infilled Polylactic Acid-Based Sustainable Biocomposites—A Review of Methods, Properties and Applications Abetted with Patent Landscape Analysis. Polymers 2025, 17, 1565. [Google Scholar] [CrossRef] [Scilit] [PubMed]
- Șahin, İ.B.; Korkut, İ.; Urtekin, L.; Yavuzyegit, B. Recent Advances in Metal Particle Reinforced Polylactic Acid Biocomposites via Additive Manufacturing for Biomedical Applications. Arab. J. Sci. Eng. 2026, 51, 3649–3689. [Google Scholar] [CrossRef] [Scilit]
- Torabi, H.; McGreal, H.; Zarrin, H.; Behzadfar, E. Effects of Rheological Properties on 3D Printing of Poly(lactic acid) (PLA) and Poly(hydroxy alkenoate) (PHA) Hybrid Materials. ACS Appl. Polym. Mater. 2023, 5, 4034–4044. [Google Scholar] [CrossRef] [Scilit]
- Vidakis, N.; Petousis, M.; Mountakis, N.; Spyridaki, M.; Gkagkanatsiou, K.; Stratakis, E. Optimization of main process control parameters of PHA bio-polymer in material extrusion additive manufacturing: Experimental design and predictive models. Int. J. Adv. Manuf. Technol. 2025, 139, 1607–1623. [Google Scholar] [CrossRef] [Scilit]
- Amrita; Manoj, A.; Panda, R.C. Biodegradable Filament for Three-Dimensional Printing Process: A Review. Eng. Sci. 2022, 18, 11–19. [Google Scholar] [CrossRef] [Scilit]
- Nedelcu, D.; Mazurchevici, S.-N.; Popa, R.-I.; Lohan, N.-M.; Maldonado-Cortés, D.; Carausu, C. Tribological and Dynamical Mechanical Behavior of Prototyped PLA-Based Polymers. Materials 2020, 13, 3615. [Google Scholar] [CrossRef] [Scilit] [PubMed]
- Tan, J.L.; Wong, C.H. Review of Multi-Material Additive Manufacturing. In Proceedings of the 2nd International Conference on Progress in Additive Manufacturing (Pro-AM 2016), Singapore, 16–19 May 2016; pp. 294–299. Available online: https://dr.ntu.edu.sg/server/api/core/bitstreams/88c2d928-9543-452e-9101-d92654411135/content (accessed on 8 July 2026).
- Dairabayeva, D.; Perveen, A.; Talamona, D. Investigation on the Mechanical Performance of Mono-Material vs Multi-Material Interface Geometries Using Fused Filament Fabrication. Rapid Prototyp. J. 2023, 29, 40–52. [Google Scholar] [CrossRef] [Scilit]
- Altuntaș, U.; Coker, D.; Yavaș, D. Bioinspired Interfaces for Improved Interlaminar Shear Strength in 3D Printed Multi-material Polymer Composites. In Additive and Advanced Manufacturing, Inverse Problem Methodologies and Machine Learning and Data Science; Kramer, S.L., Retzlaff, E., Thakre, P., Hoefnagels, J., Rossi, M., Lattanzi, A., Hemez, F., Mirshekari, M., Downey, A., Eds.; Springer: Cham, Switzerland, 2024; pp. 63–68. [Google Scholar] [CrossRef] [Scilit]
- Sorimpuk, N.P.; Choong, W.H.; Chua, B.-L. Thermoforming Characteristics of PLA/TPU Multi-Material Specimens Fabricated with Fused Deposition Modelling under Different Temperatures. Polymers 2022, 14, 4304. [Google Scholar] [CrossRef] [Scilit] [PubMed]
- Brancewicz-Steinmetz, E.; Valverde Vergara, R.; Buzalski, V.H.; Sawicki, J. Study of the adhesion between TPU and PLA in multi-material 3D printing. J. Achiev. Mater. Manuf. Eng. 2022, 115, 49–56. [Google Scholar] [CrossRef] [Scilit]
- Parnian, P.; Shojaee, M.; Weeger, O.; D’Amore, A. Multiscale modelling and characterisation of fused filament fabricated neat and graphene nanoplatelet reinforced G-polymers. Prog. Addit. Manuf. 2025, 10, 2861–2876. [Google Scholar] [CrossRef] [Scilit]
- Richter, F.; Wu, D. Interfacial adhesion between dissimilar thermoplastics fabricated via material extrusion-based multi-material additive manufacturing. Mater. Des. 2025, 252, 113688. [Google Scholar] [CrossRef] [Scilit]
- Swetha, T.A.; Bora, V.; Sengottuvelan, A.; Ponnuchamy, N.; Muthusamy, K.; Arun, G. A review on biodegradable polylactic acid (PLA) production from fermentative food waste—Its applications and degradation. Int. J. Biol. Macromol. 2023, 234, 123703. [Google Scholar] [CrossRef] [Scilit] [PubMed]
- ISO 527-3; Tensile Properties of Films and Sheets. International Organization for Standardization: Geneva, Switzerland, 2019.
- ISO 179-1:2026; Plastics—Determination of Charpy Impact Properties. International Organization for Standardization: Ge-neva, Switzerland, 2026.
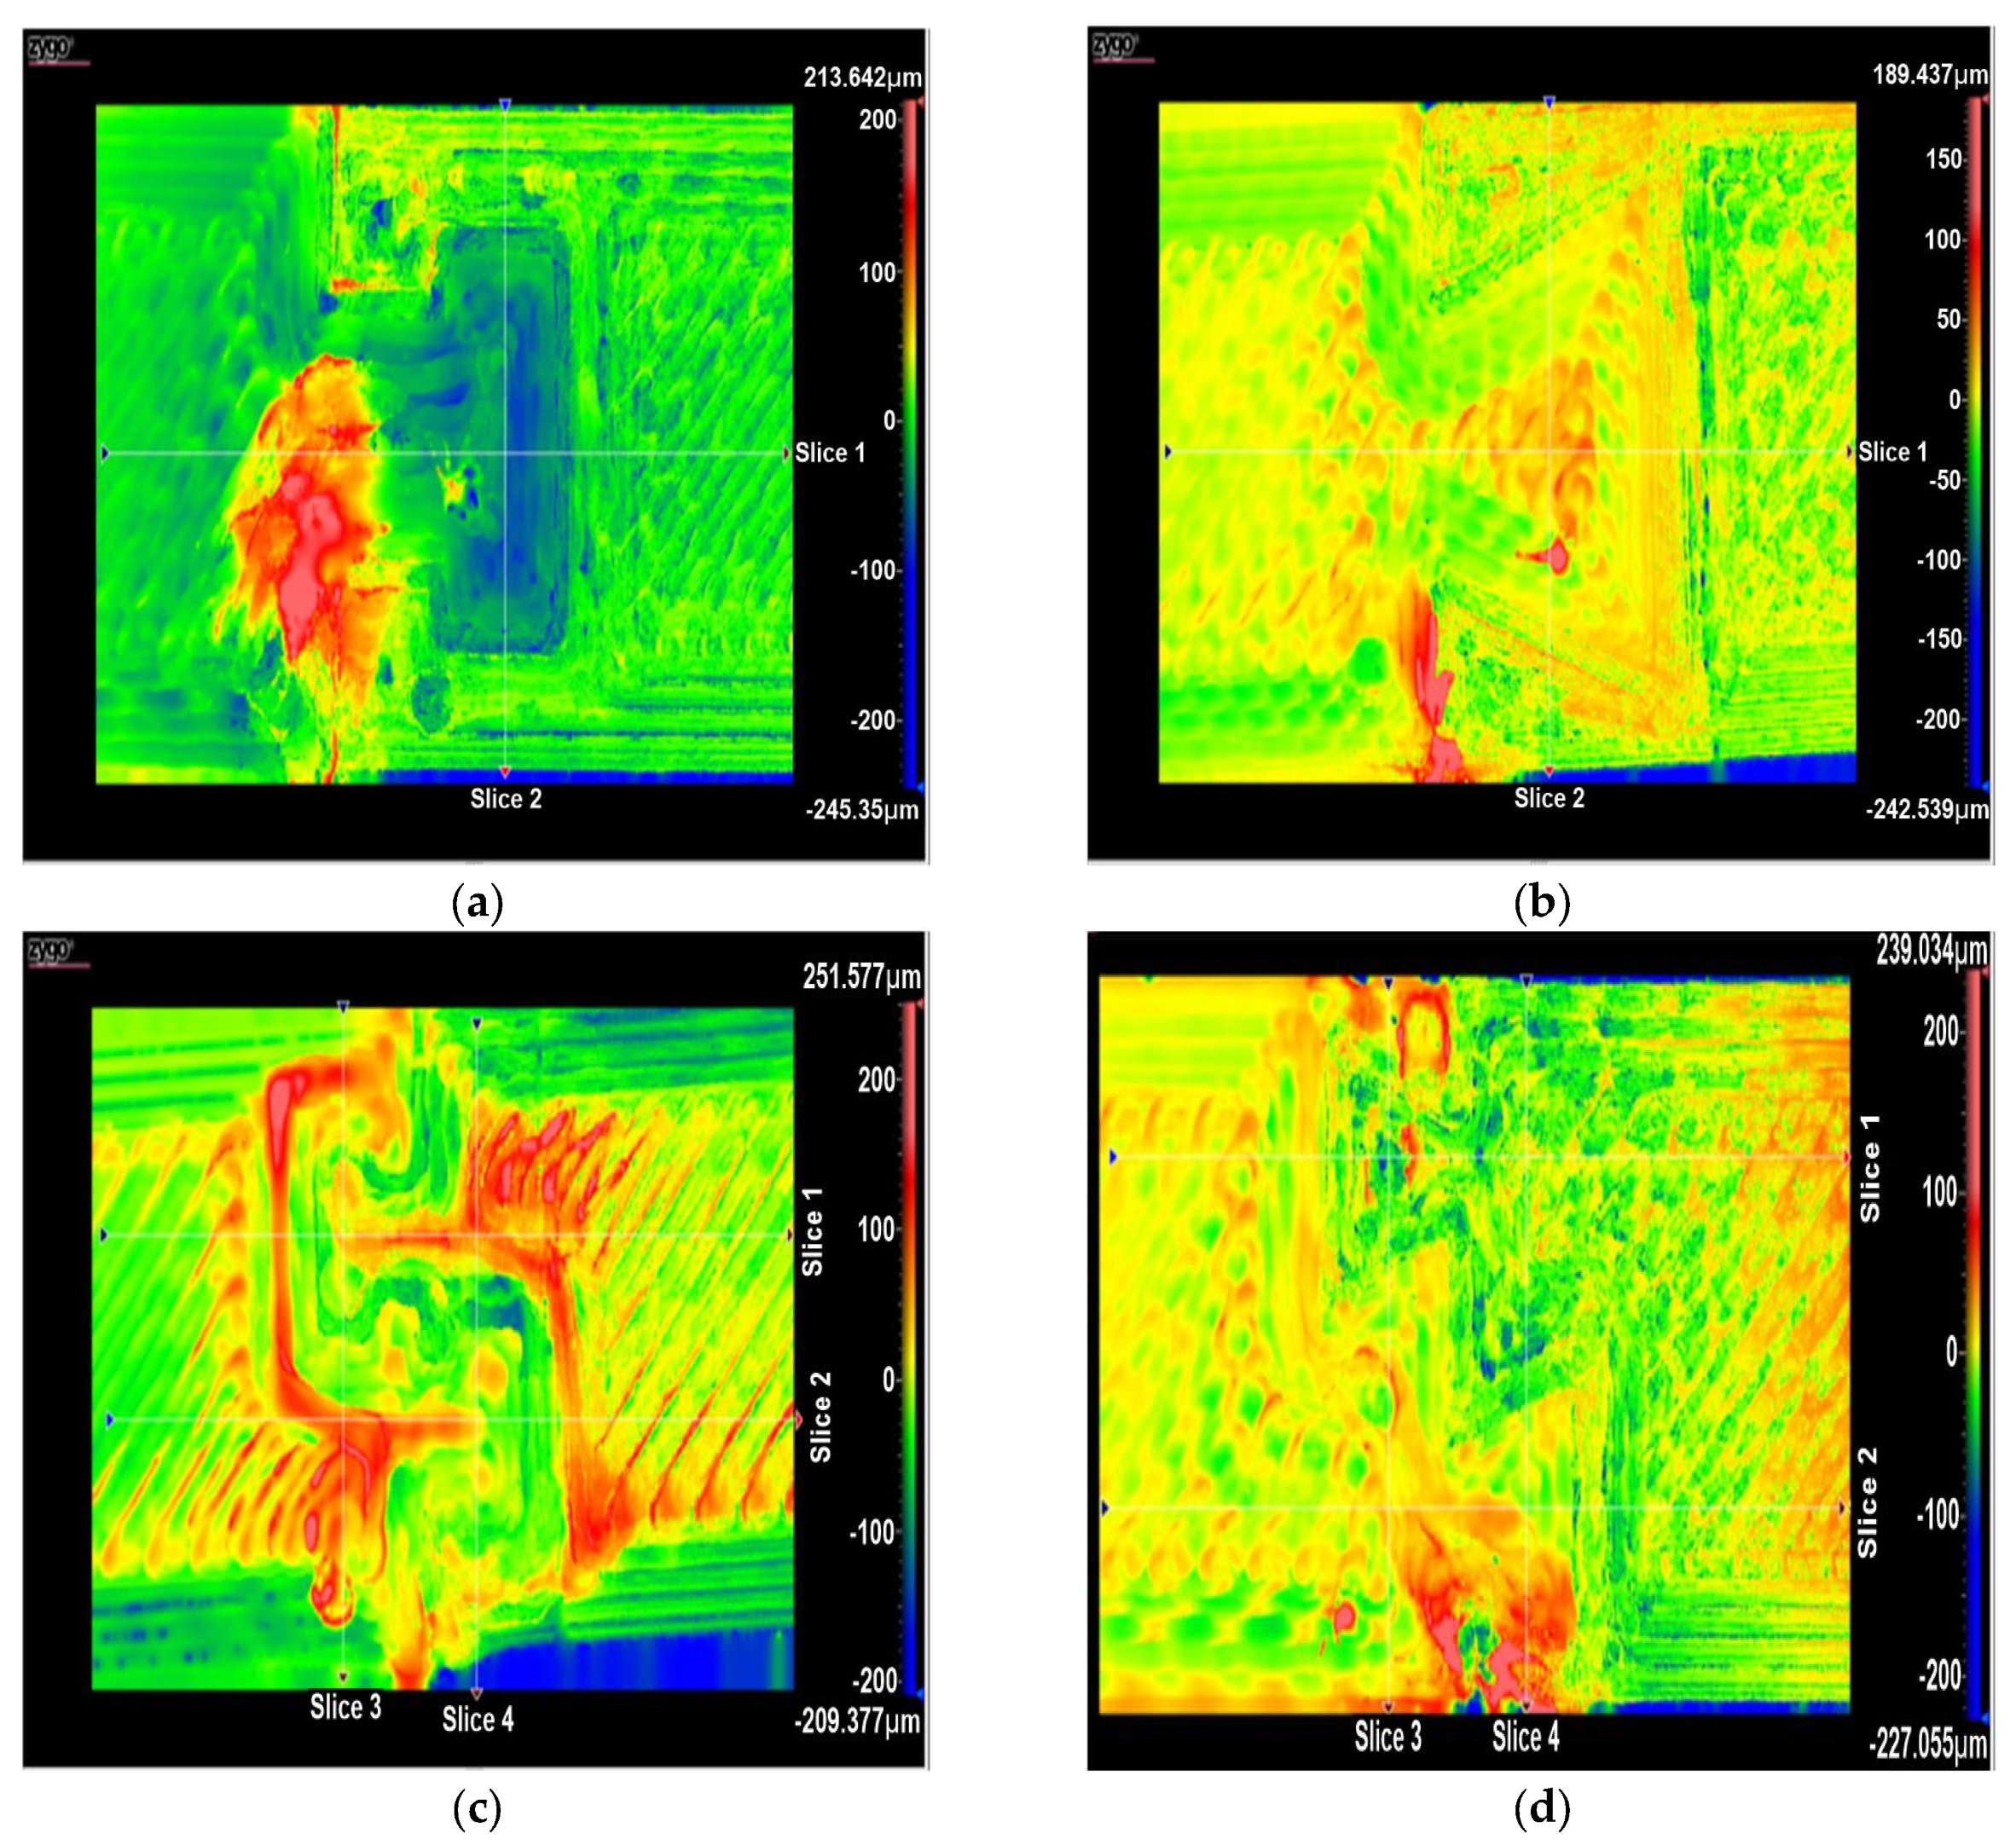
interface; slice 3, slice 4: (c) 2T interface, (d) 2 interface.
interface; slice 3, slice 4: (c) 2T interface, (d) 2 interface. ; (d) 2.
; (d) 2.
; (d) 2.

 interface samples: cross-sectional view of failure sample (A–C).
 interface samples: cross-sectional view of failure samples (A–C).
interface samples: cross-sectional view of failure samples (A–C).
interface samples: cross-sectional view of failure samples (A–C).

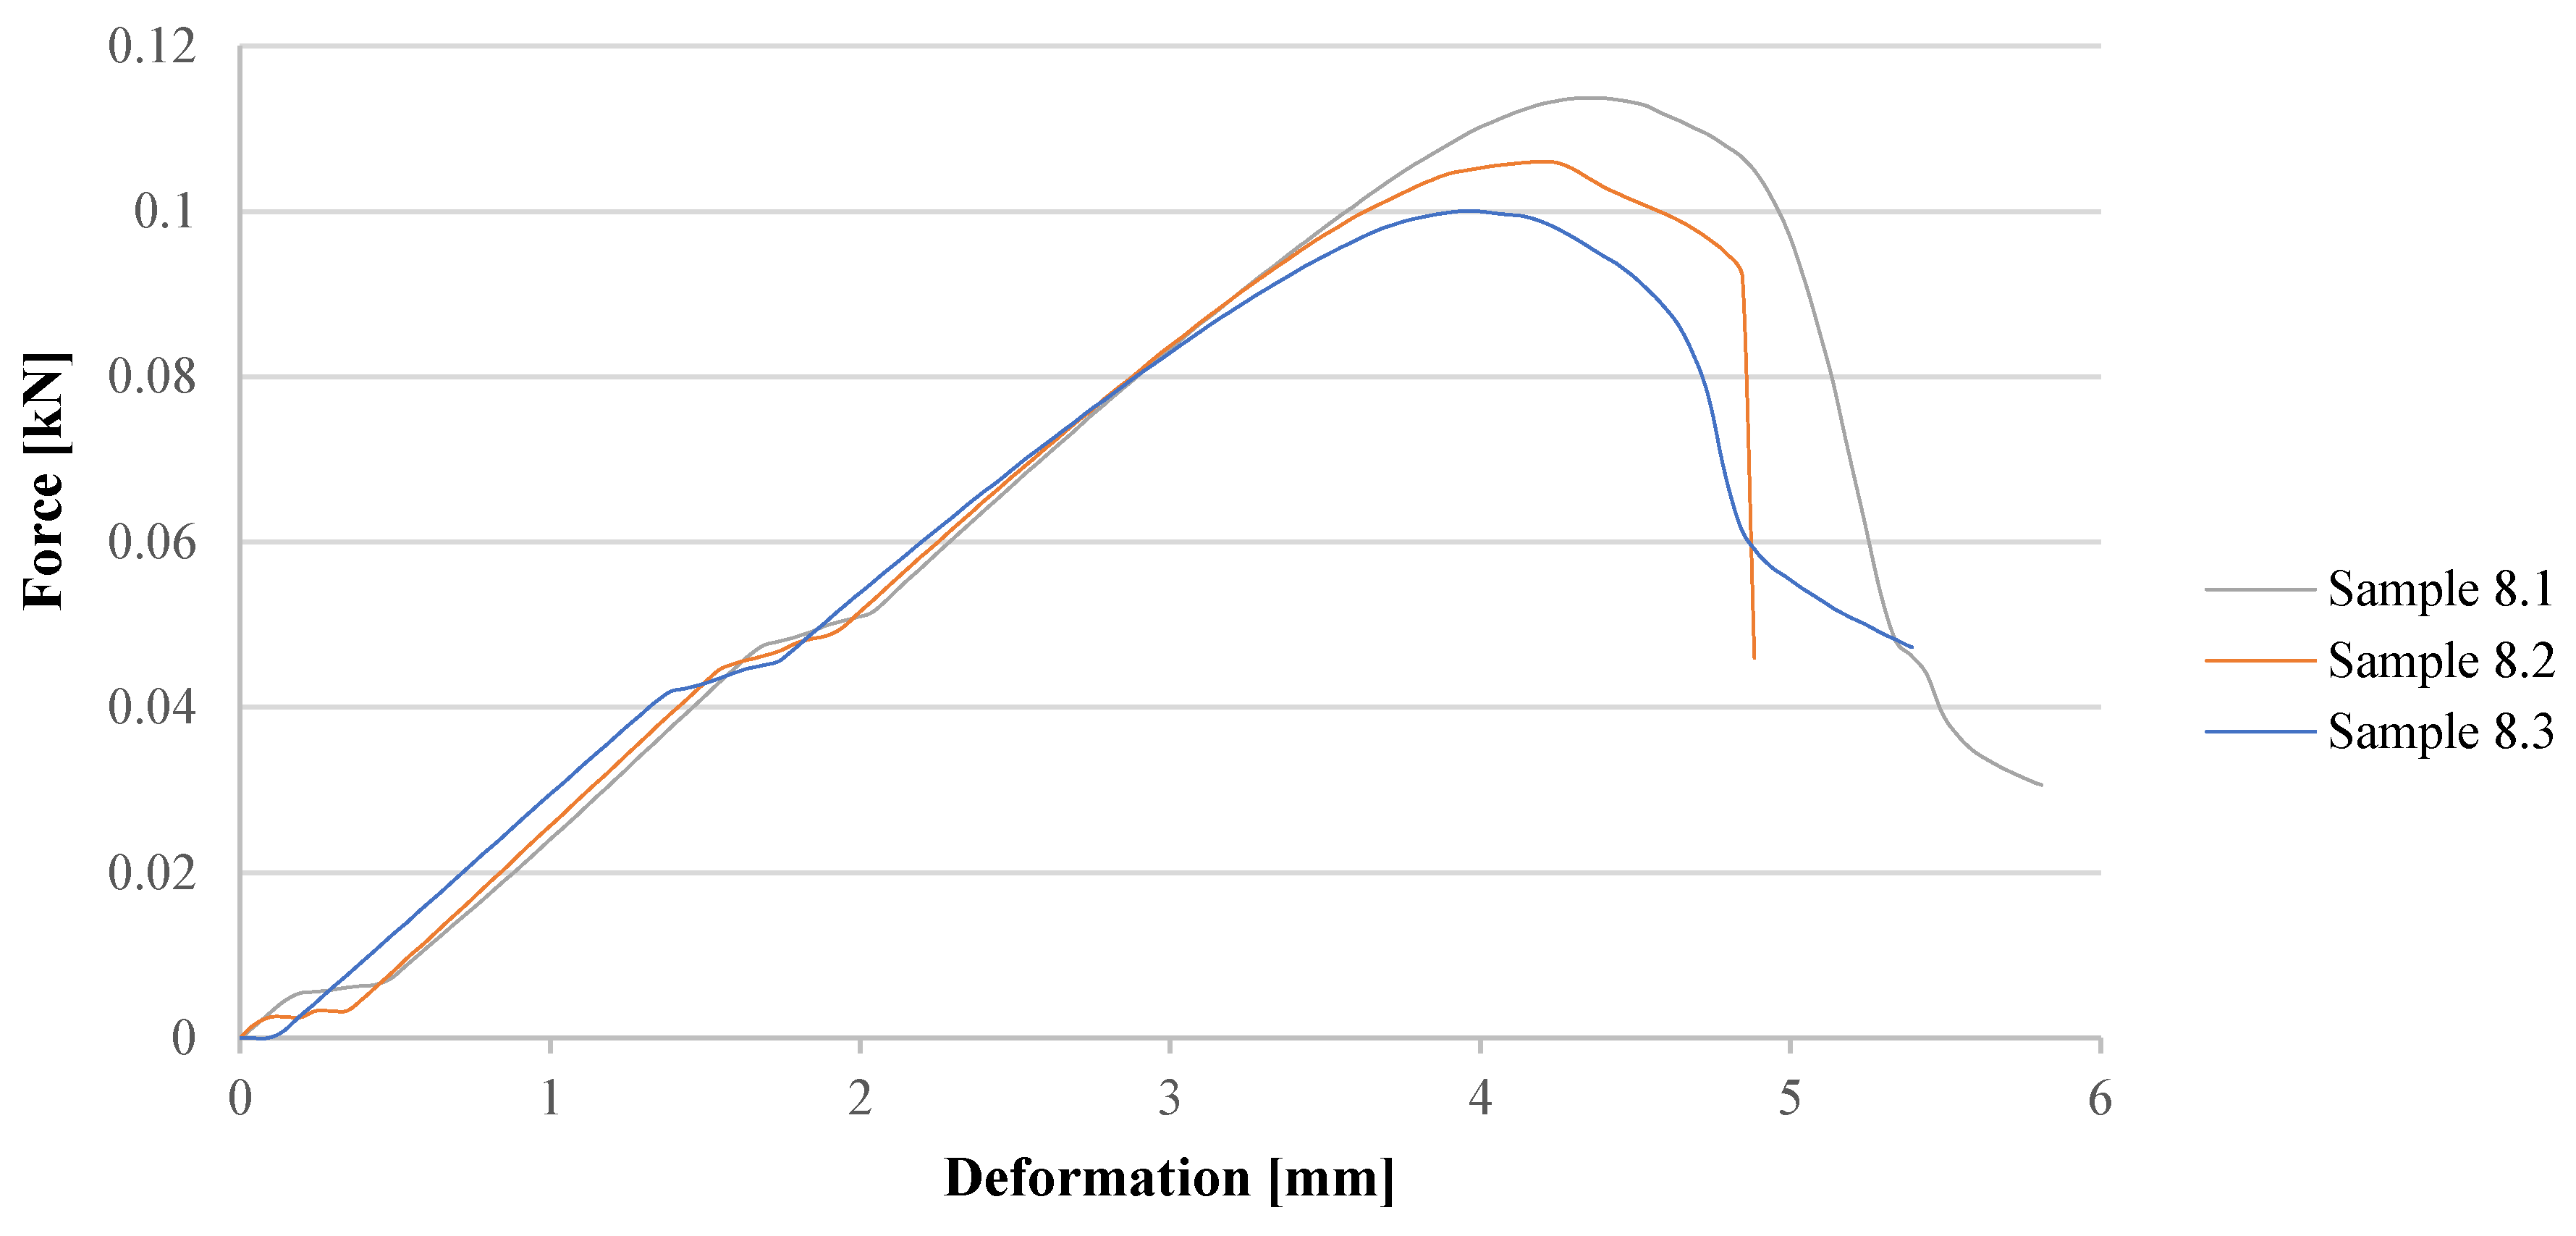

 interface.
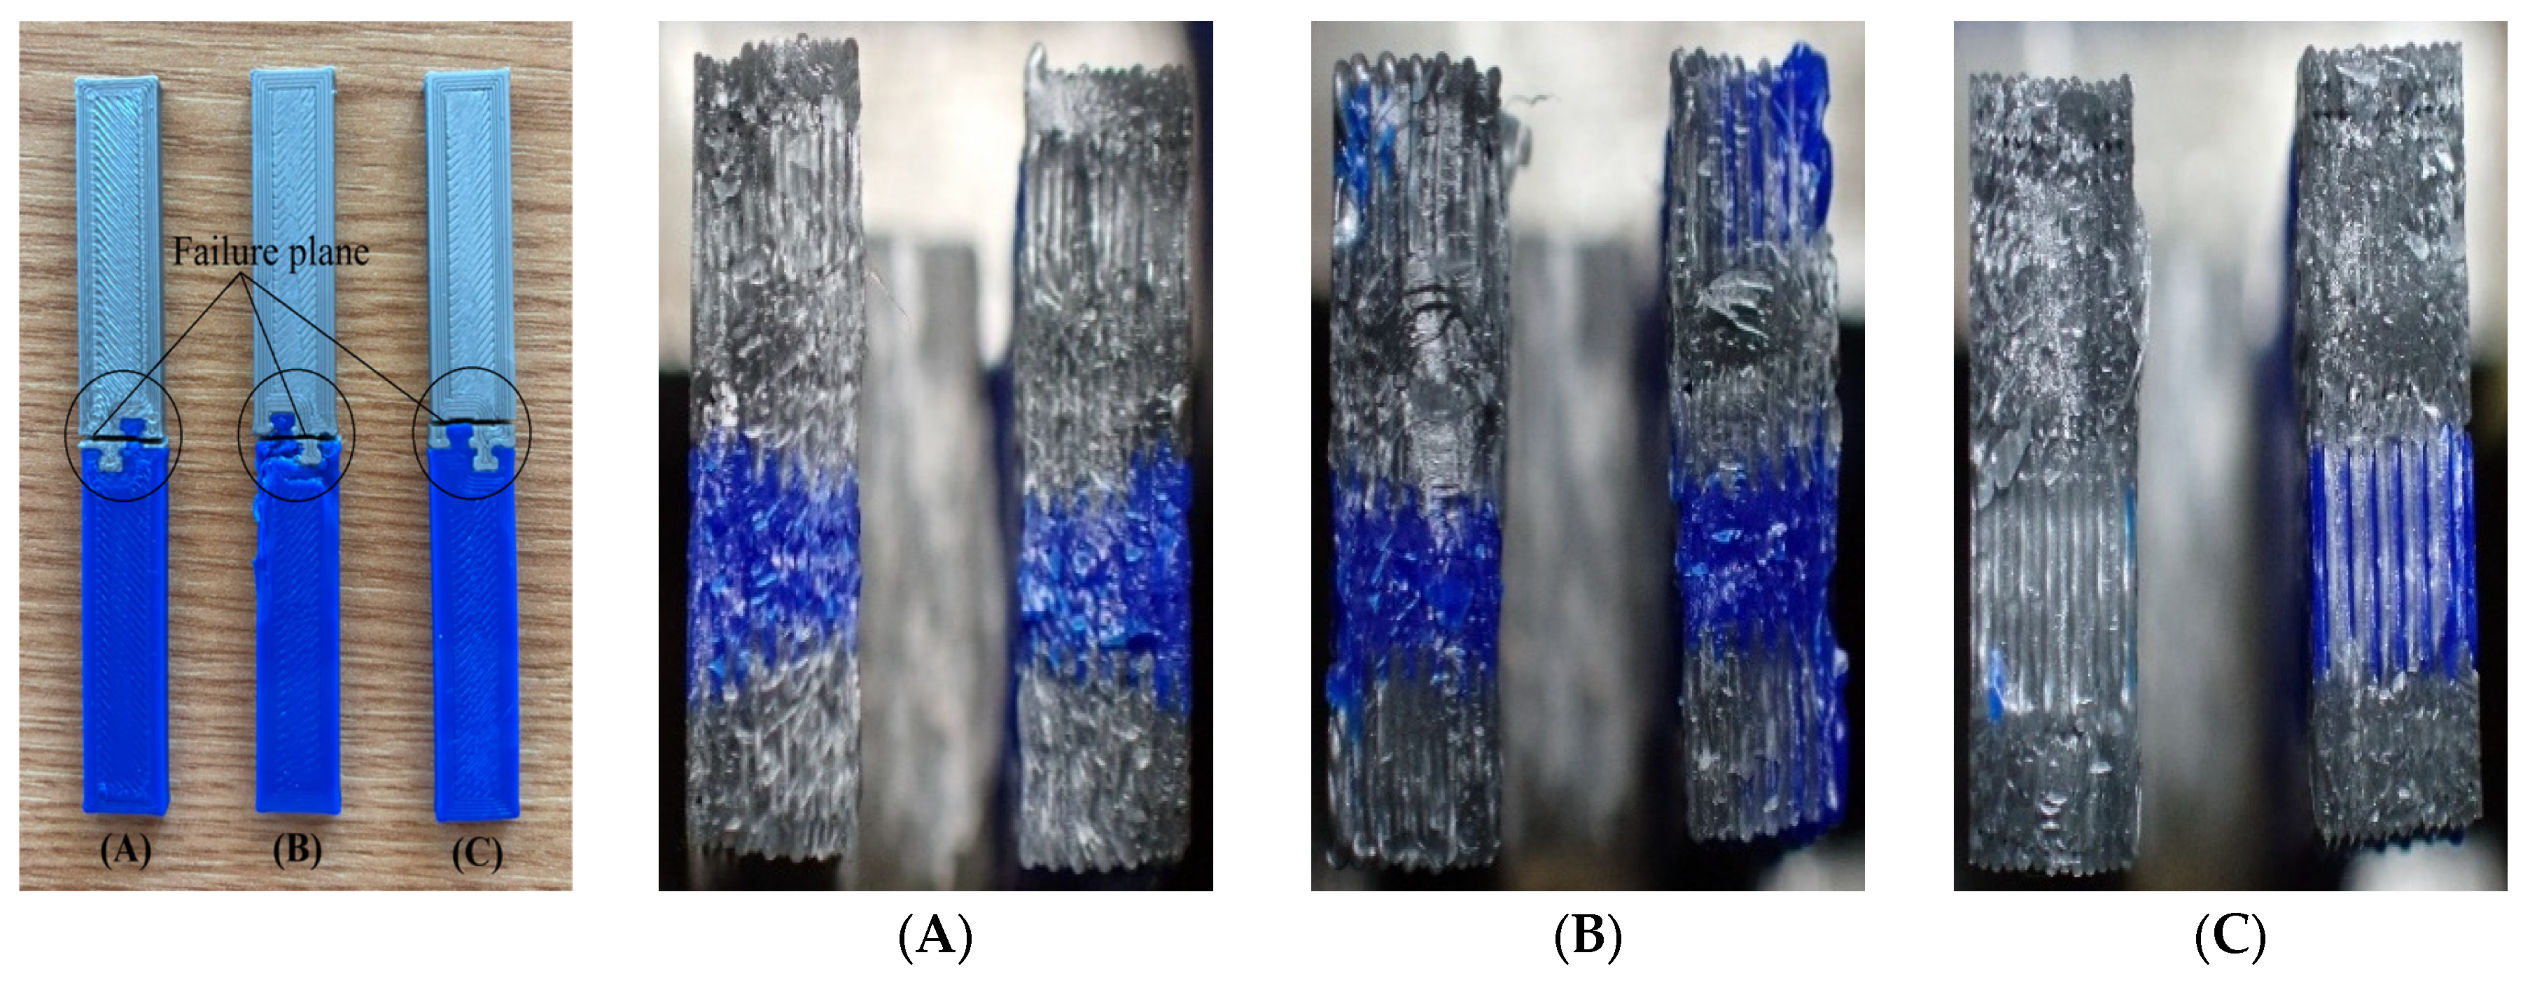
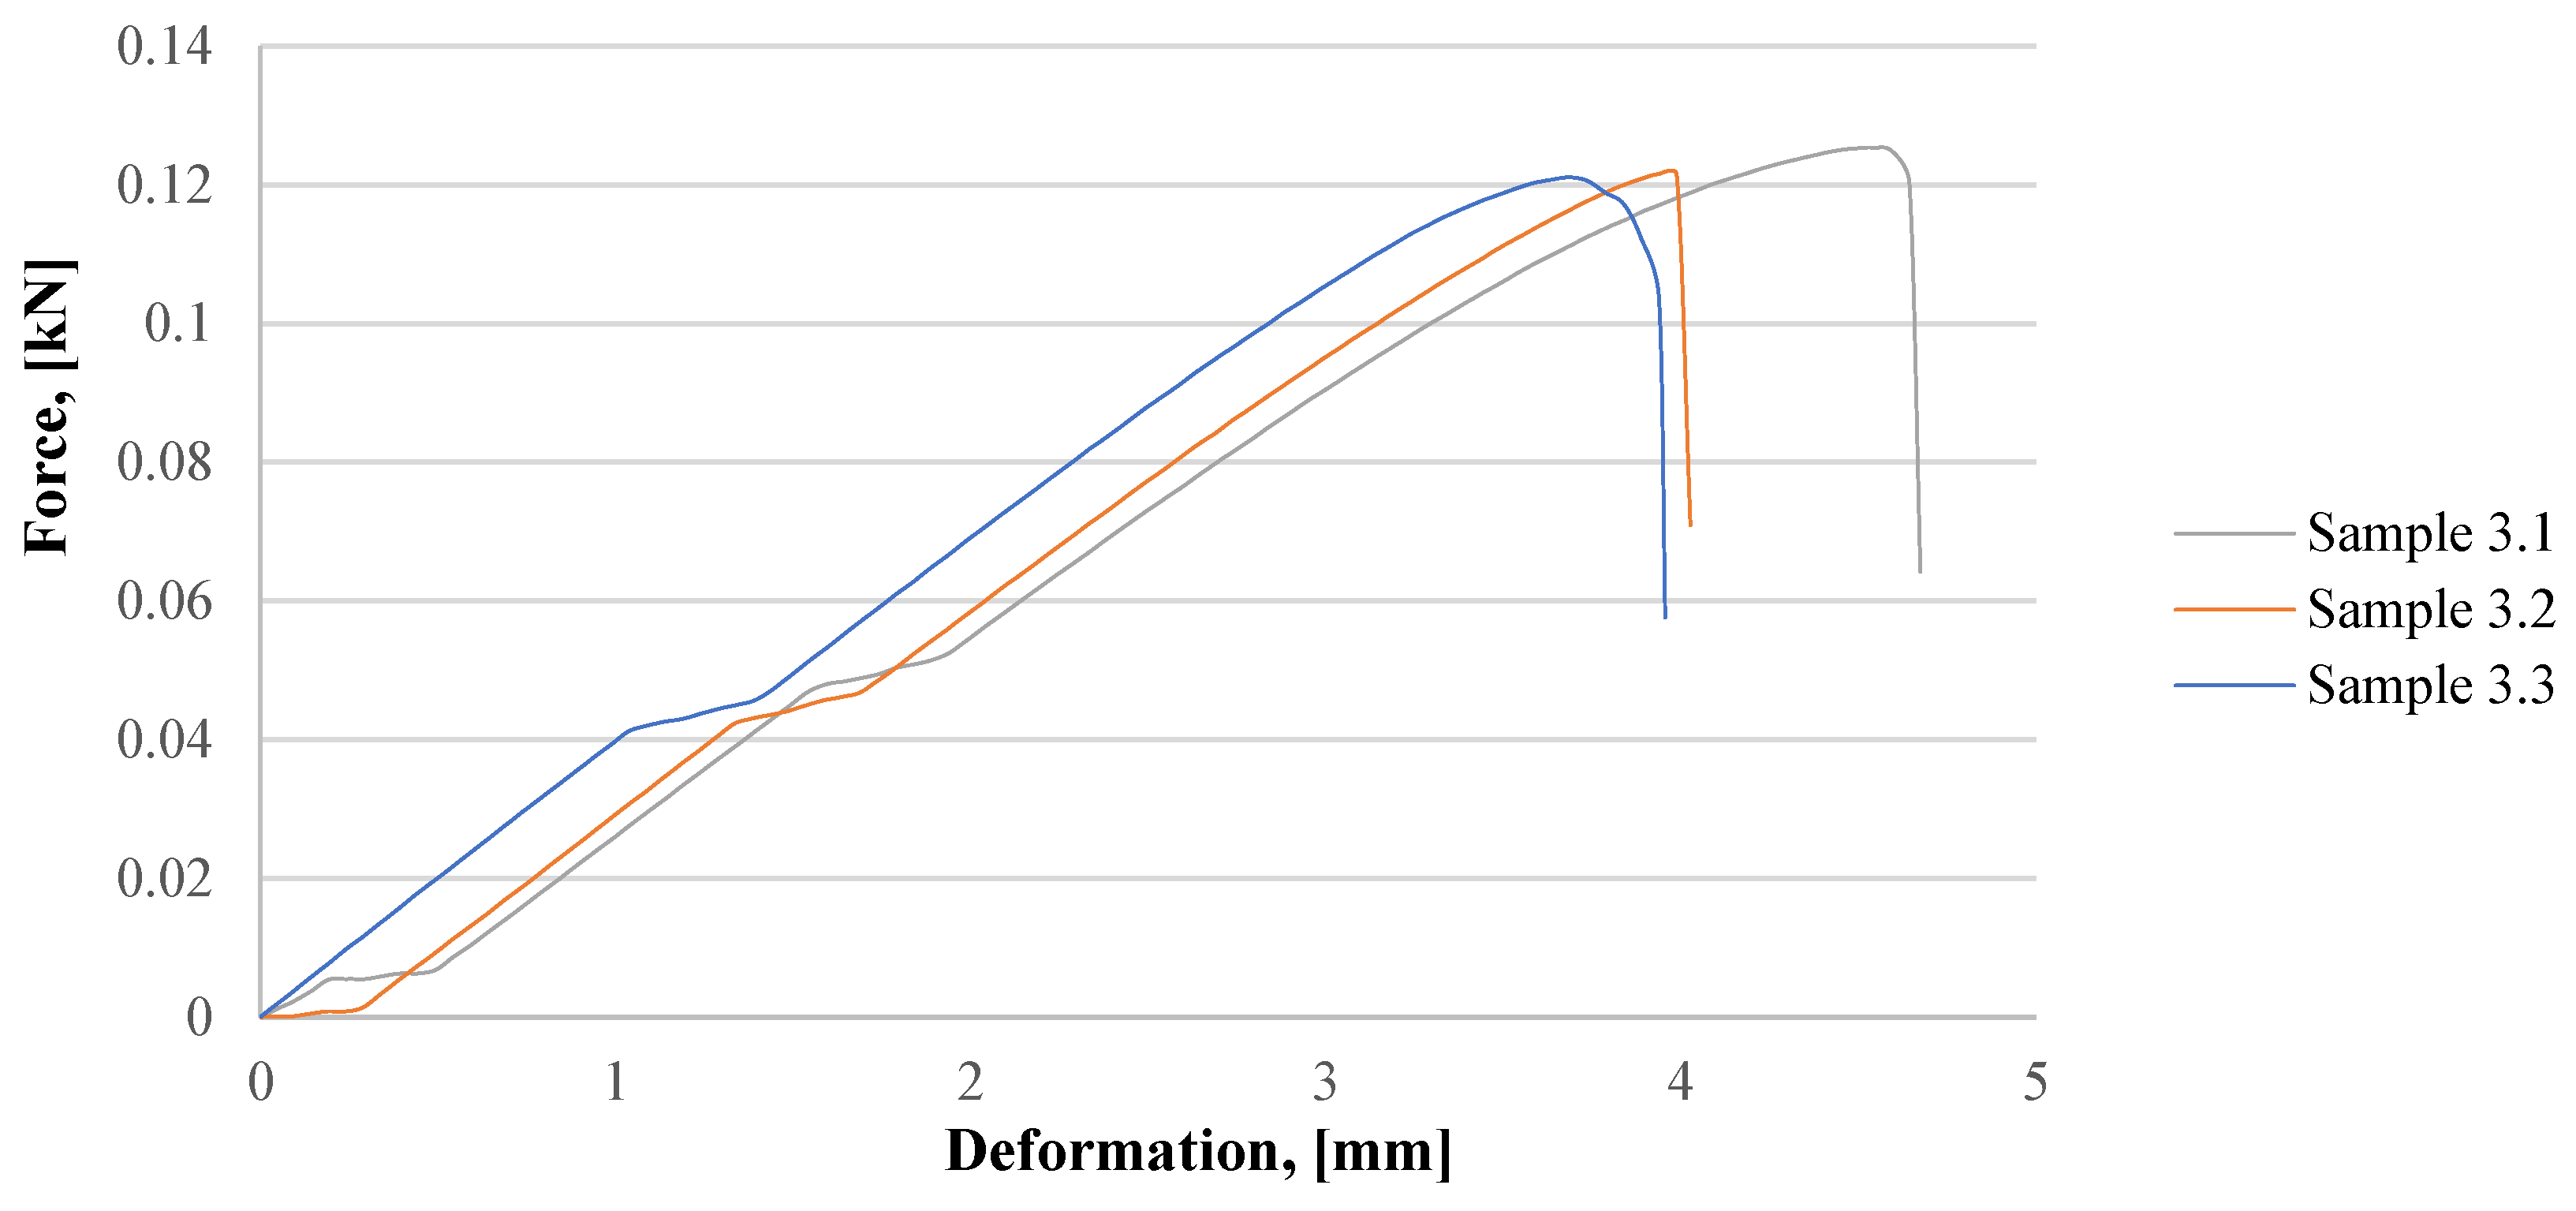 interface: (A) cross-sectional view of the fracture zone of sample 3.1; (B) cross-sectional view of the fracture zone of sample 3.2; (C) cross-sectional view of the fracture zone of sample 3.3.
interface: (A) cross-sectional view of the fracture zone of sample 3.1; (B) cross-sectional view of the fracture zone of sample 3.2; (C) cross-sectional view of the fracture zone of sample 3.3.
interface: (A) cross-sectional view of the fracture zone of sample 3.1; (B) cross-sectional view of the fracture zone of sample 3.2; (C) cross-sectional view of the fracture zone of sample 3.3. interface.
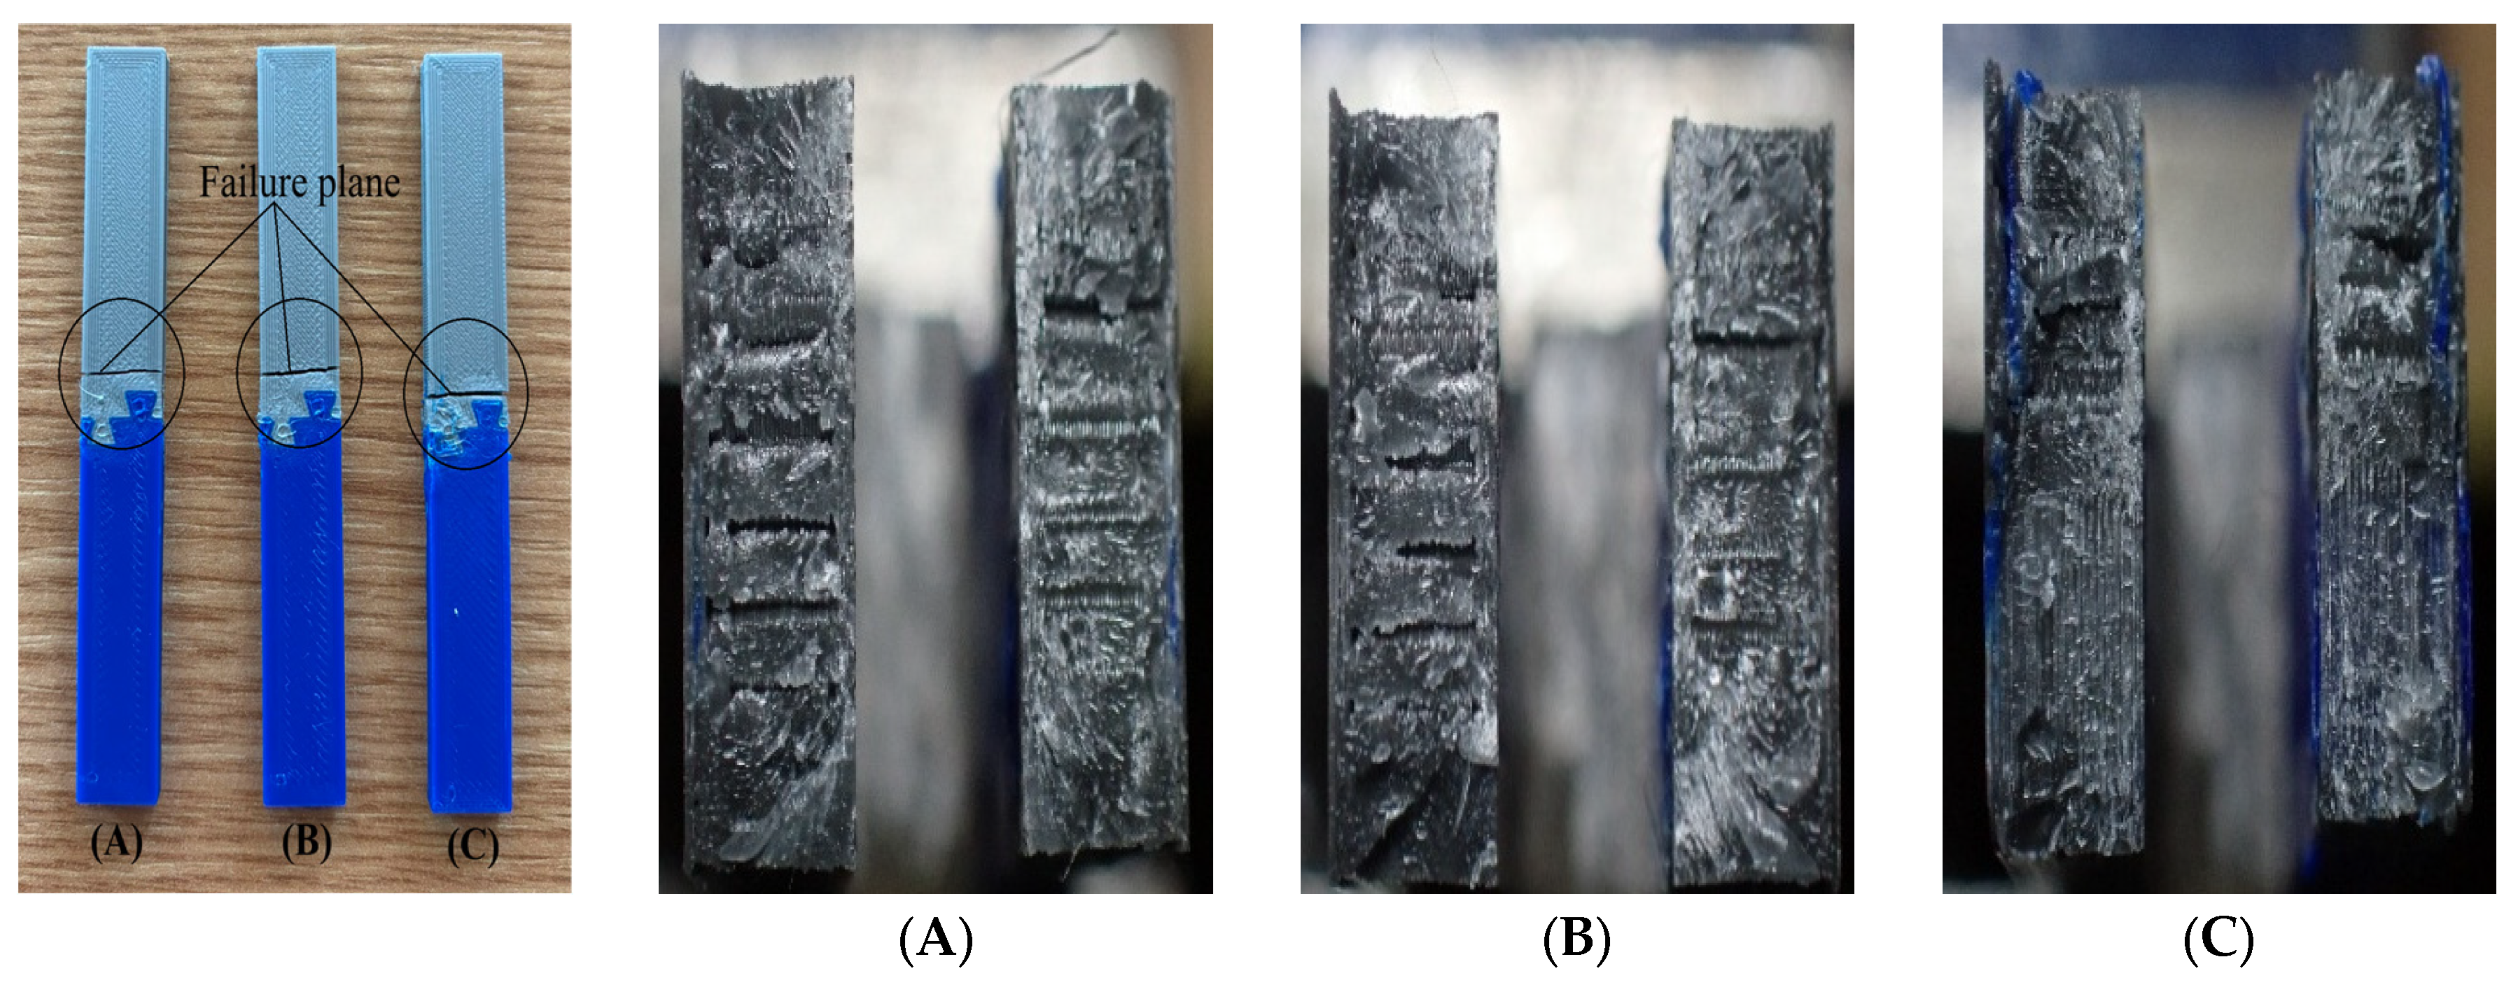
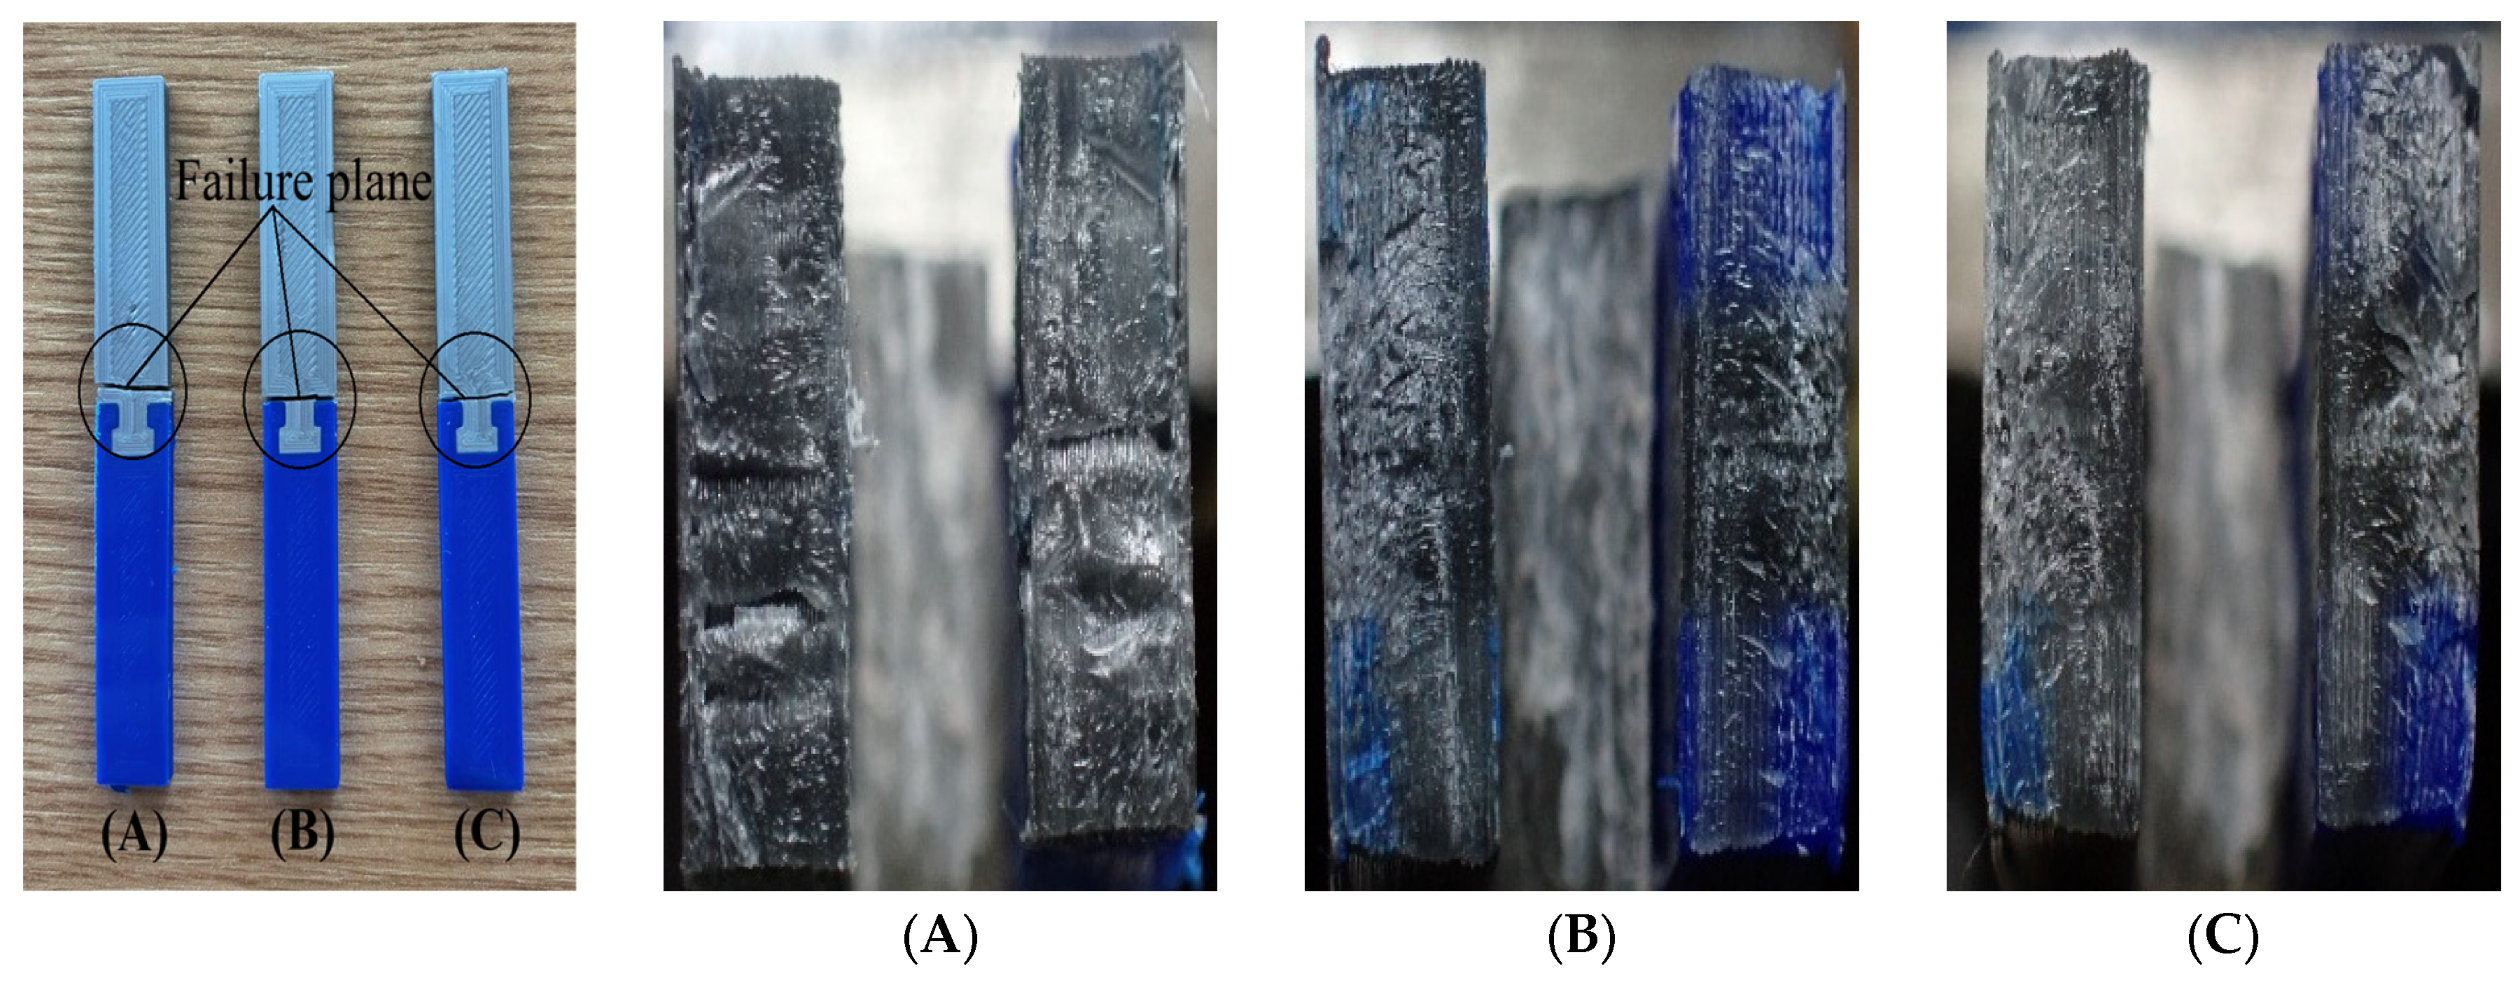
 interface: (A) cross-sectional view of the fracture zone of sample 4.1; (B) cross-sectional view of the fracture zone of sample 4.2; (C) cross-sectional view of the fracture zone of sample 4.3.
interface: (A) cross-sectional view of the fracture zone of sample 4.1; (B) cross-sectional view of the fracture zone of sample 4.2; (C) cross-sectional view of the fracture zone of sample 4.3.
interface: (A) cross-sectional view of the fracture zone of sample 4.1; (B) cross-sectional view of the fracture zone of sample 4.2; (C) cross-sectional view of the fracture zone of sample 4.3.

 interface: (A) cross-sectional view of the fracture zone of sample 3.1; (B) cross-sectional view of the fracture zone of sample 3.2; (C) cross-sectional view of the fracture zone of sample 3.3.
interface: (A) cross-sectional view of the fracture zone of sample 3.1; (B) cross-sectional view of the fracture zone of sample 3.2; (C) cross-sectional view of the fracture zone of sample 3.3.
interface: (A) cross-sectional view of the fracture zone of sample 3.1; (B) cross-sectional view of the fracture zone of sample 3.2; (C) cross-sectional view of the fracture zone of sample 3.3.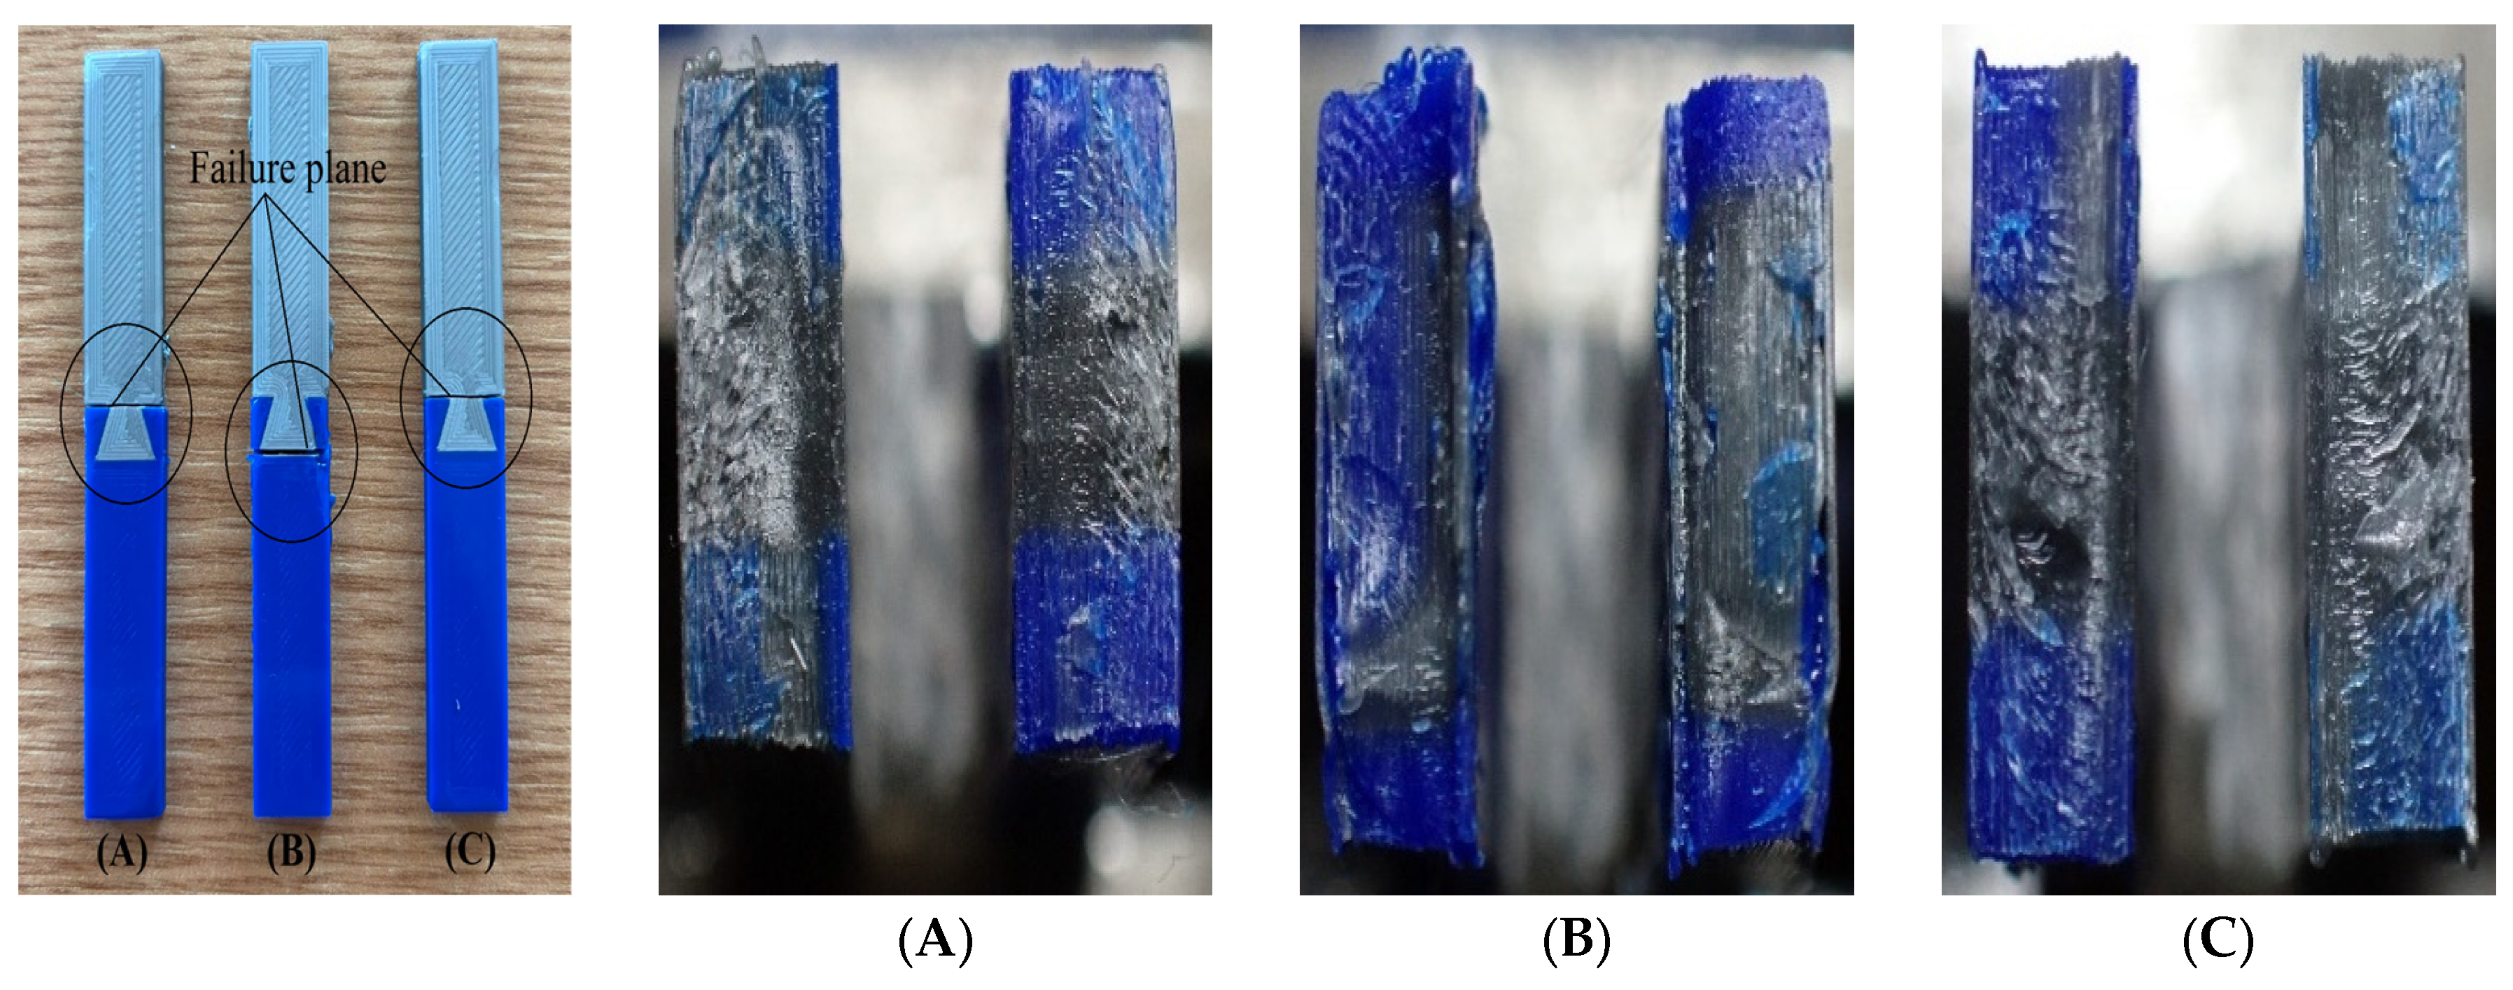 interface: (A) cross-sectional view of the fracture surface of sample 4.1; (B) cross-sectional view of the fracture surface of sample 4.2; (C) cross-sectional view of the fracture surface of sample 4.3.
interface: (A) cross-sectional view of the fracture surface of sample 4.1; (B) cross-sectional view of the fracture surface of sample 4.2; (C) cross-sectional view of the fracture surface of sample 4.3.
interface: (A) cross-sectional view of the fracture surface of sample 4.1; (B) cross-sectional view of the fracture surface of sample 4.2; (C) cross-sectional view of the fracture surface of sample 4.3.
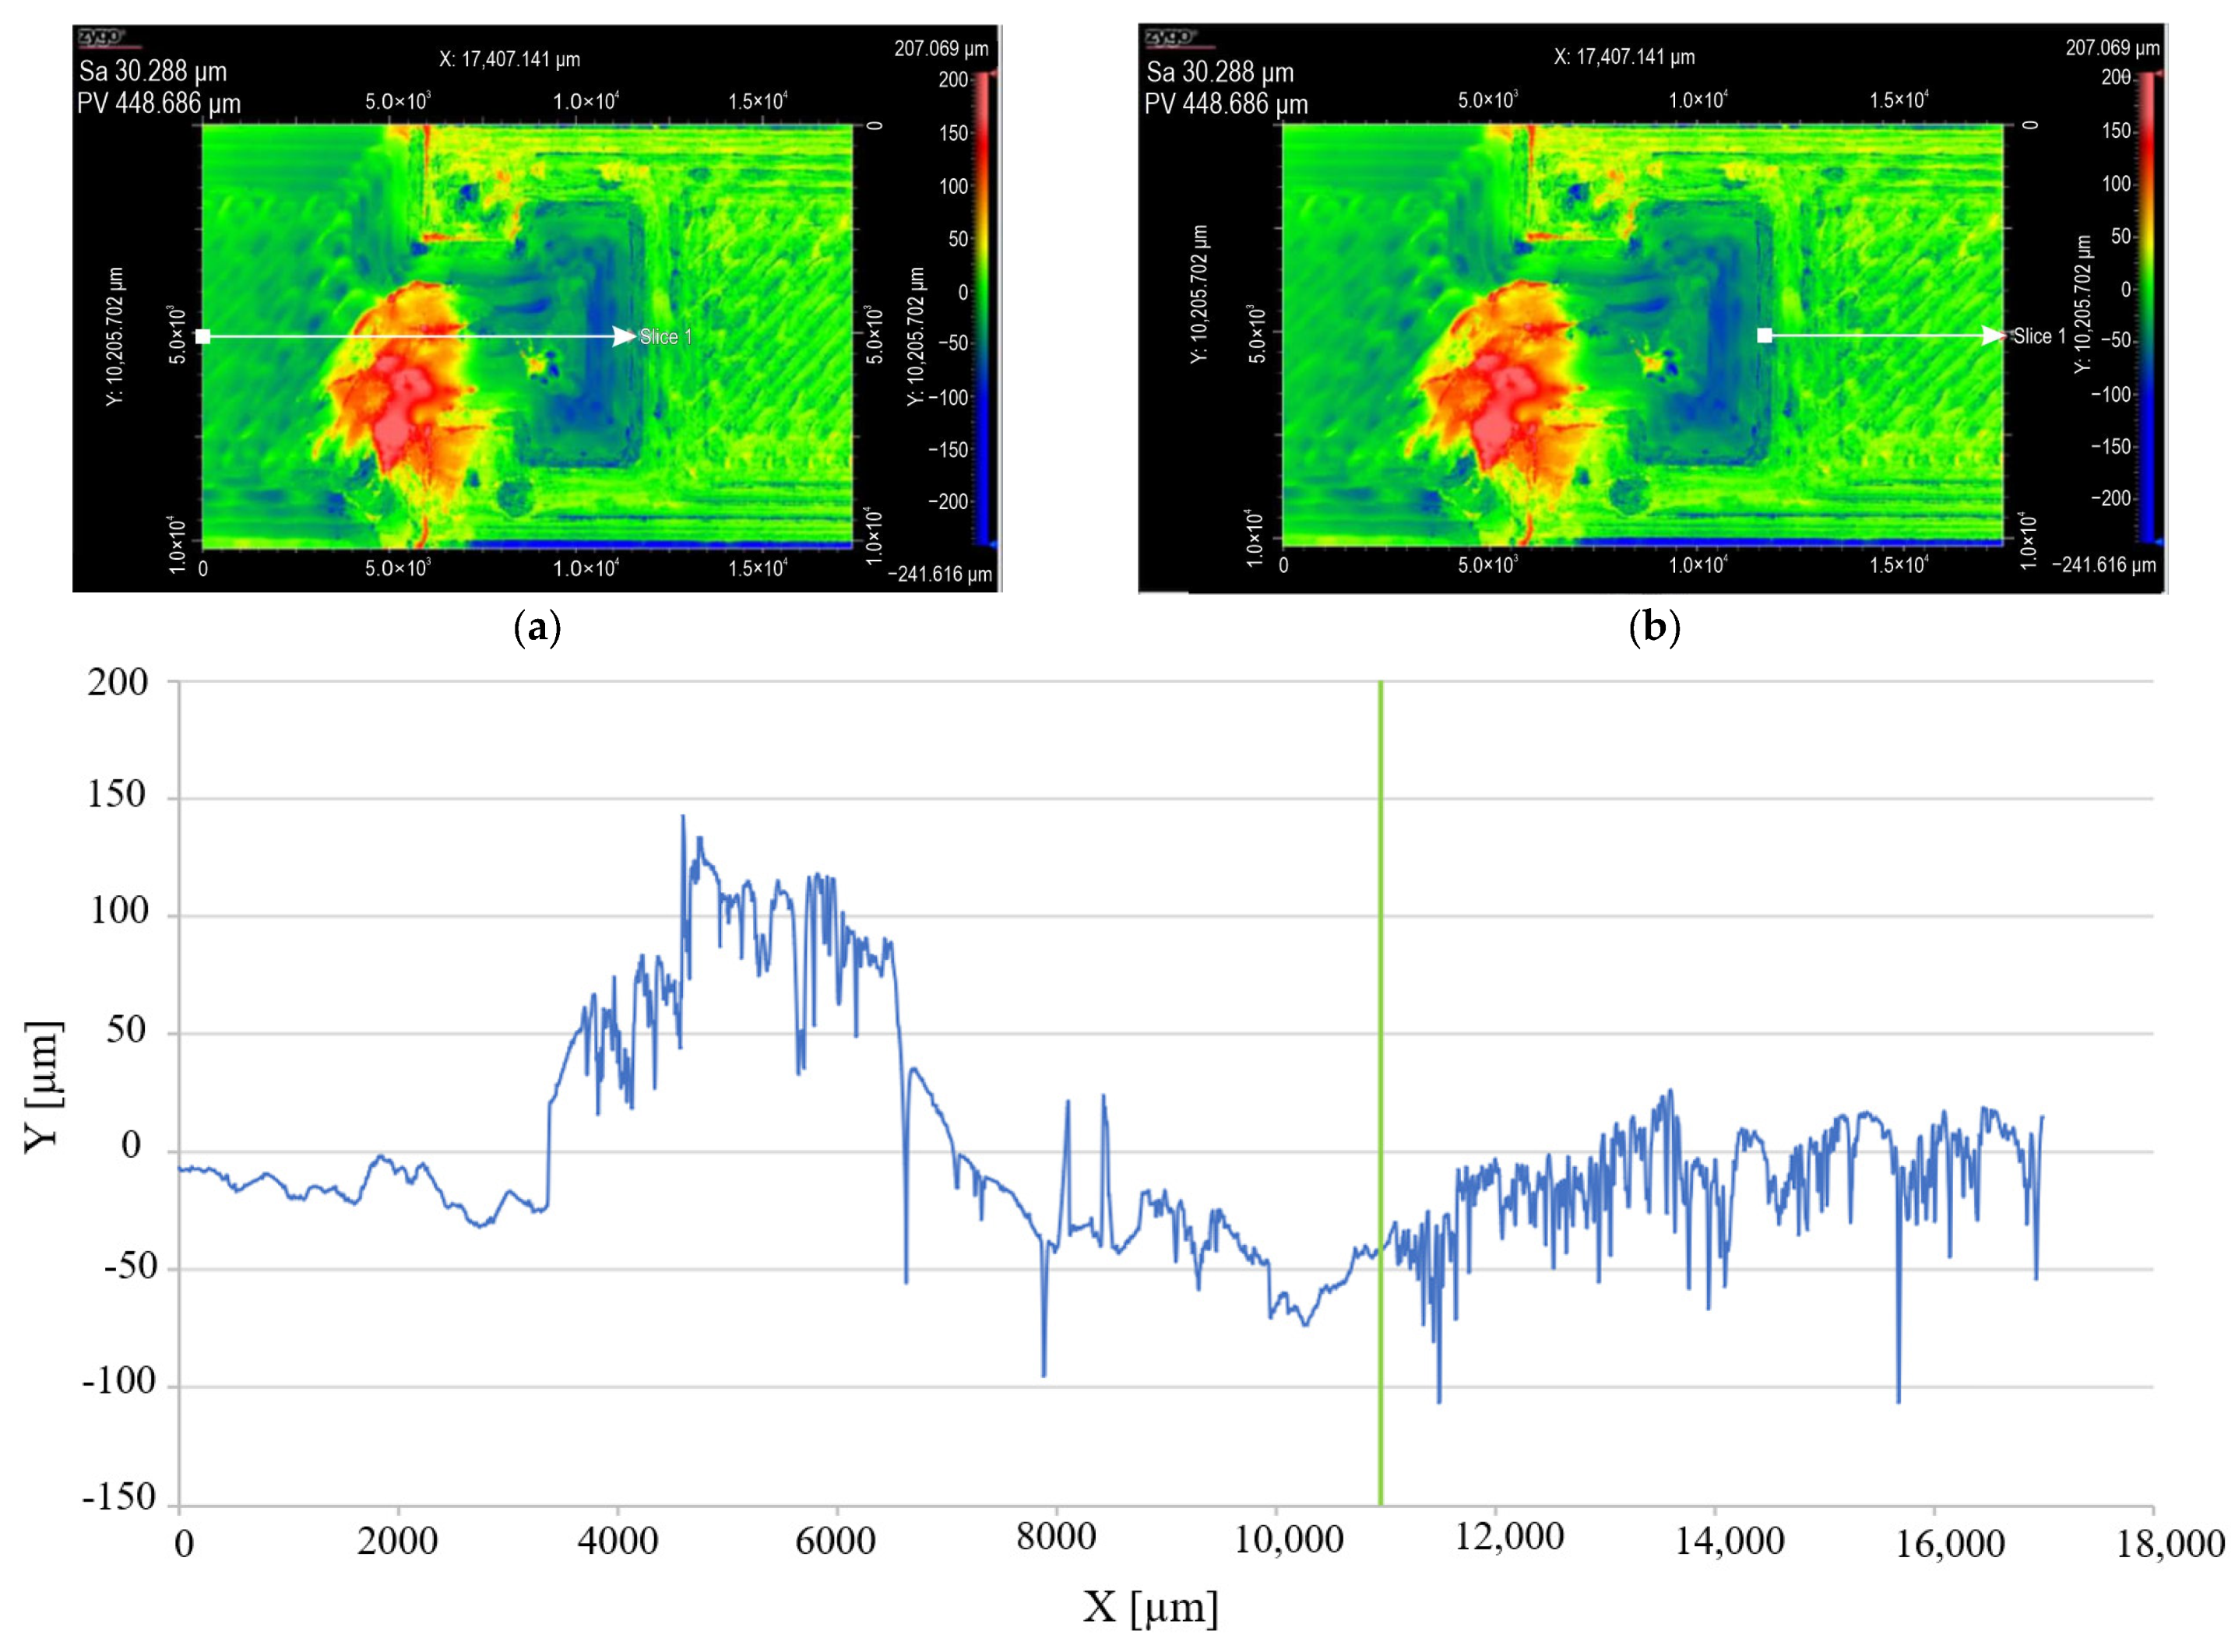
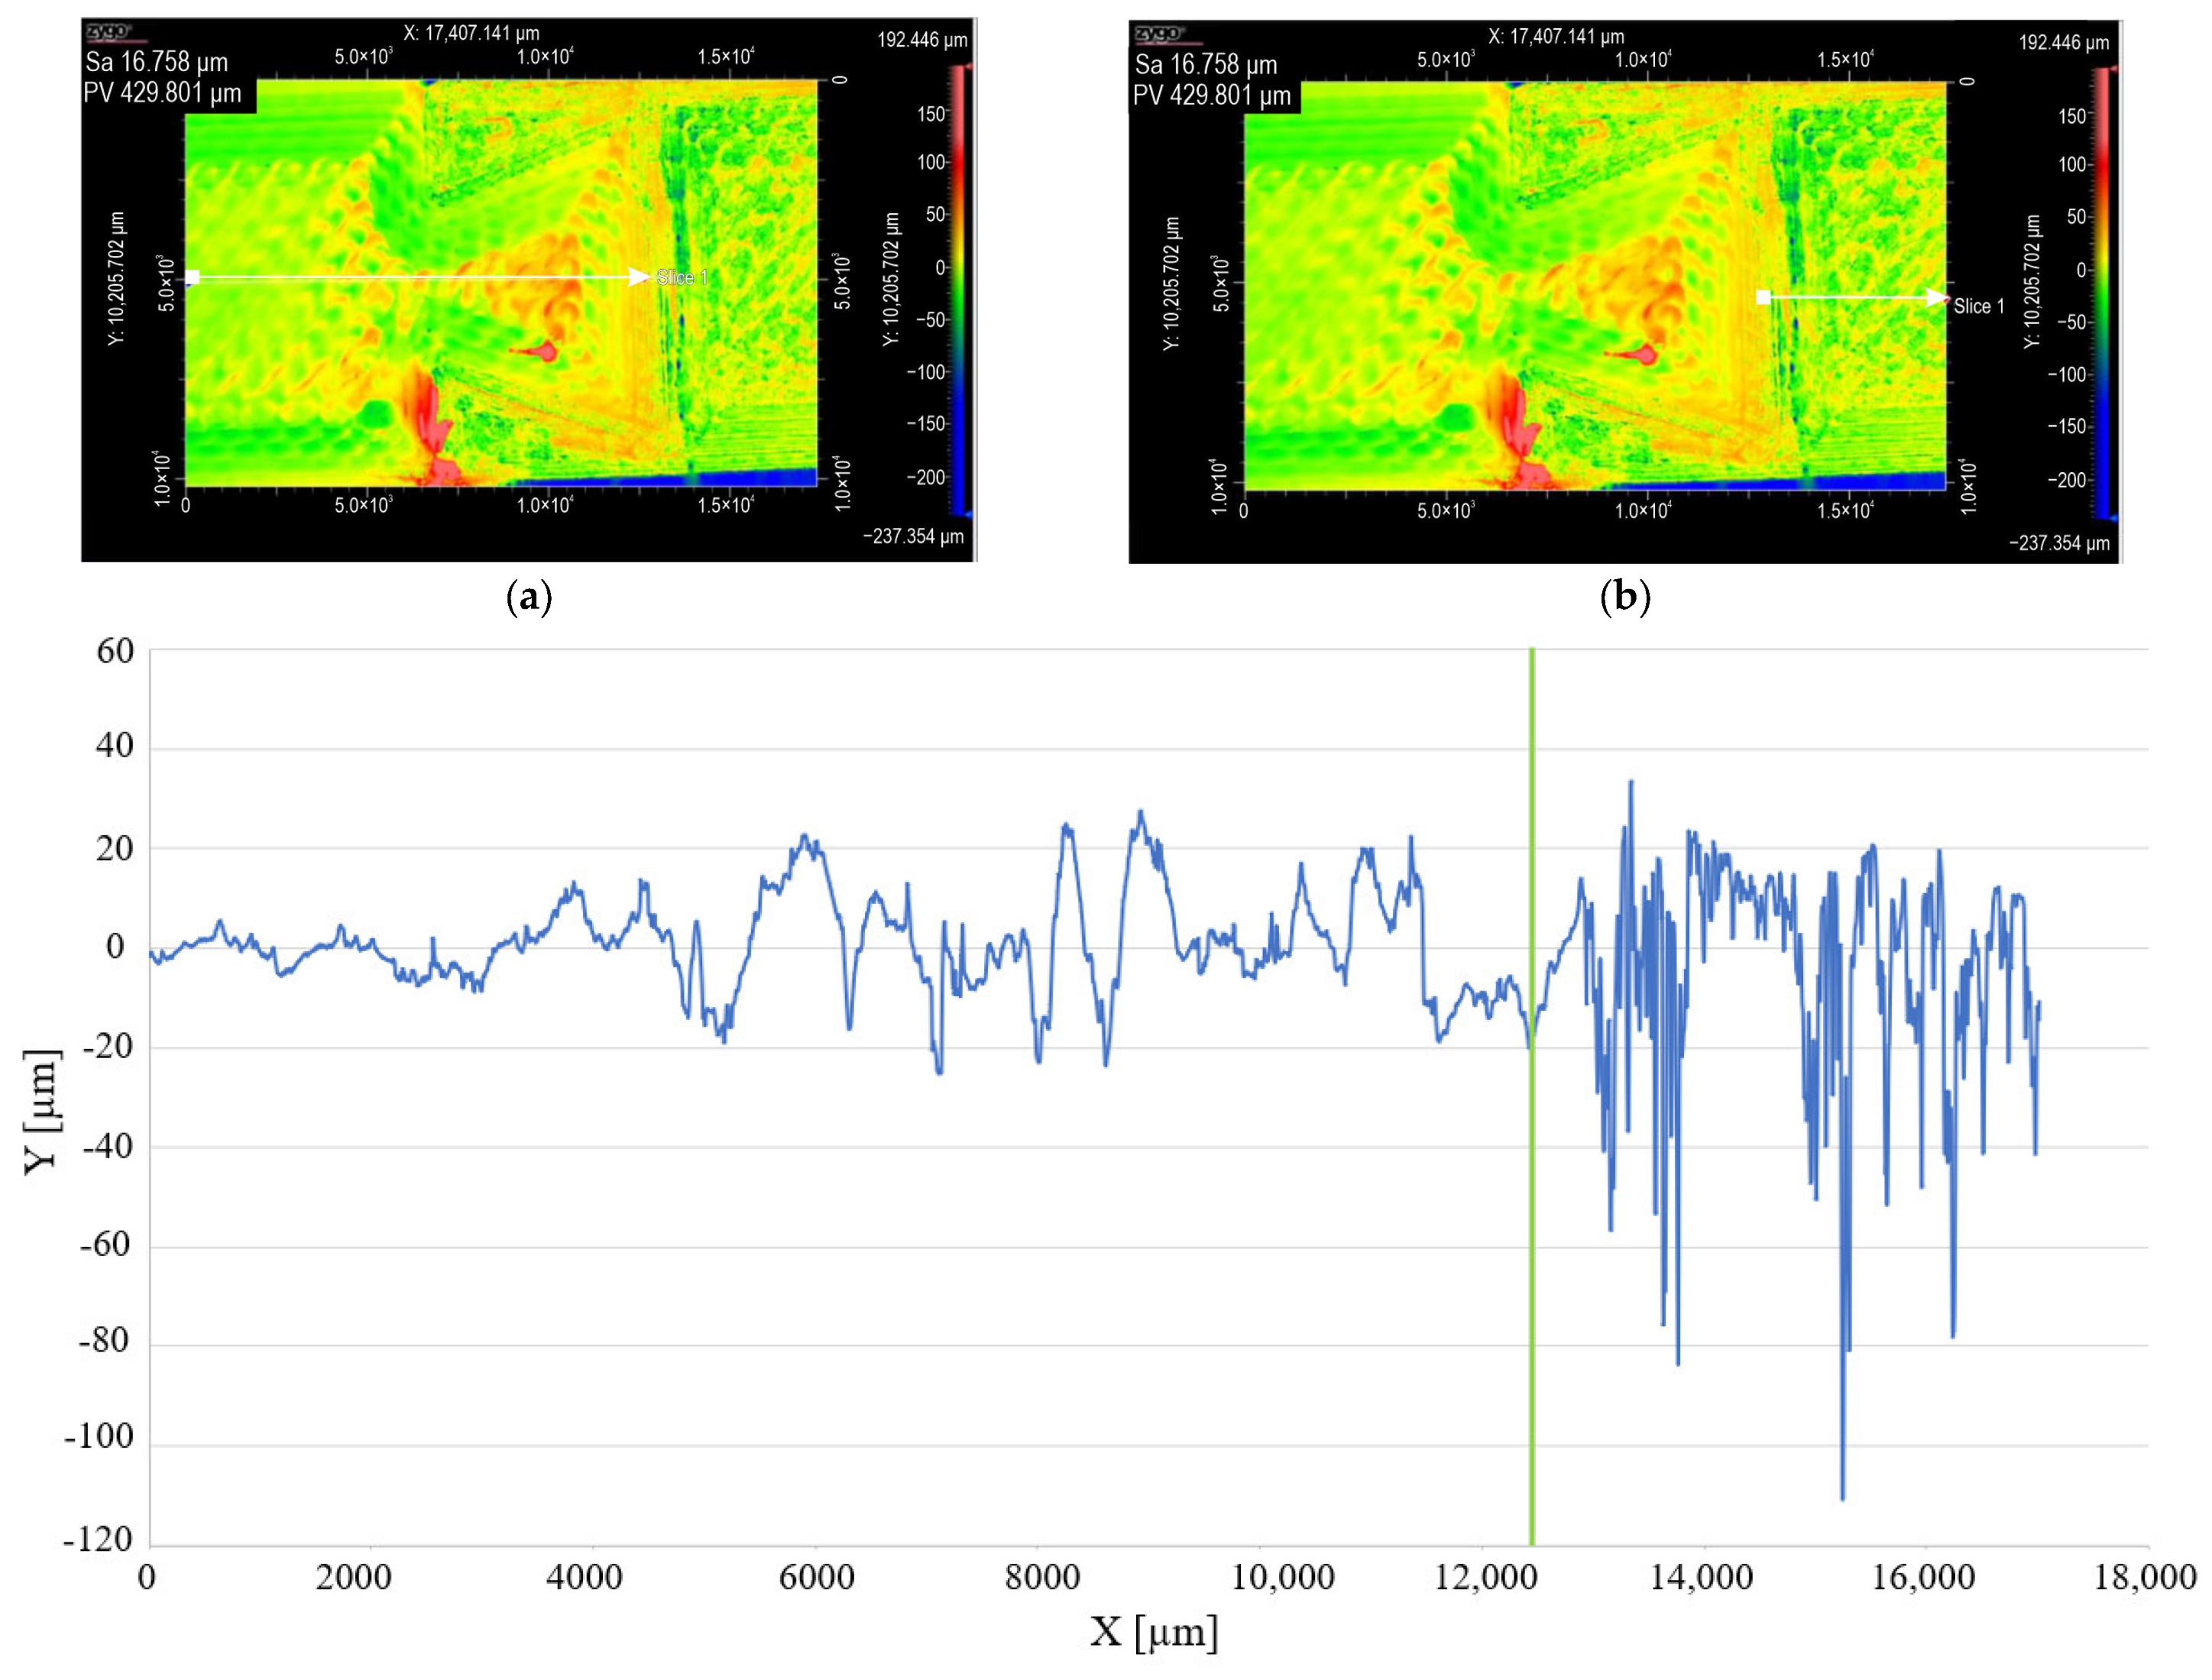
 interface): (a) UltraFuse PLA Blue; (b) PLA/PHA Shining Silver.
interface): (a) UltraFuse PLA Blue; (b) PLA/PHA Shining Silver.
interface): (a) UltraFuse PLA Blue; (b) PLA/PHA Shining Silver.
 interface.

| Parameter | Value |
|---|---|
| Printing speed (mm/s) | 60 (in case of outside layer) |
| Infill, pattern | 100% infill, grid |
| Nozzle diameter (mm) | 0.4 |
| Sample orientation | plane |
| Printing table temperature (°C) | 60 |
| Extruder temperature (°C) | 215 |
| Exp. No. | Input Parameters | ||
|---|---|---|---|
| Layer Thickness * [mm] | Shell Number ** | Interface Geometry *** | |
| 1. | −1 | −1 | −1 |
| 2. | −1 | −1 | +1 |
| 3. | −1 | +1 | −1 |
| 4. | −1 | +1 | +1 |
| 5. | +1 | −1 | −1 |
| 6. | +1 | −1 | +1 |
| 7. | +1 | +1 | −1 |
| 8. | +1 | +1 | +1 |
; +1 = 2 in the mirror, turned around.| T interface | 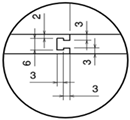 | 2T interface | 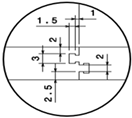 |
interface | 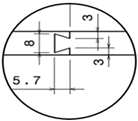 | 2 interface |  |
| Exp. No. | Layer Thickness [mm] | Shell Number | Interface Type | σmax [MPa] | εt [%] | E [MPa] |
|---|---|---|---|---|---|---|
| 3 | 0.1 | 4 | T | 32.67 ± 0.34 | 4.28 ± 0.36 | 1107.12 ± 86.14 |
| 8 | 0.3 | 4 | 2T | 33.50 ± 0.30 | 4.26 ± 0.63 | 1124.71 ± 29.88 |
| 3 | 0.1 | 4 | | 35.32 ± 0.79 | 4.47 ± 0.35 | 1173.77 ± 66.02 |
| 4 | 0.1 | 4 | 2 | 34.36 ± 0.27 | 4.29 ± 0.03 | 1163.68 ± 28.98 |
| Exp. No. | Sample | σmax [MPa] | εt [%] | σy [MPa] Offset 0.5% | εy [%] Offset 0.5% | E [MPa] |
|---|---|---|---|---|---|---|
| 1 | 1.1 | 28.43 | 4.76 | 17.74 | 2.25 | 1054.07 |
| 1.2 | 27.87 | 4.03 | 22.77 | 2.75 | 1013.07 | |
| 1.3 | 25.30 | 3.81 | 22.79 | 3.15 | 867.92 | |
| Mean | 27.20 | 4.20 | 21.10 | 2.72 | 978.35 | |
| SD | 1.67 | 0.50 | 2.91 | 0.45 | 97.81 | |
| 2 | 2.1 | 27.93 | 4.43 | 17.26 | 2.15 | 1074.14 |
| 2.2 | 28.20 | 3.99 | 21.16 | 2.45 | 1094.57 | |
| 2.3 | 28.37 | 4.3 | 23.75 | 2.85 | 999.16 | |
| Mean | 28.17 | 4.24 | 20.72 | 2.48 | 1055.96 | |
| SD | 0.22 | 0.23 | 3.27 | 0.35 | 50.24 | |
| 3 | 3.1 | 33.04 | 4.38 | 23.41 | 2.55 | 1156.04 |
| 3.2 | 32.36 | 3.88 | 25.69 | 2.75 | 1157.67 | |
| 3.3 | 32.60 | 4.59 | 26.59 | 3.15 | 1007.66 | |
| Mean | 32.67 | 4.28 | 25.23 | 2.82 | 1107.12 | |
| SD | 0.34 | 0.36 | 1.64 | 0.31 | 86.14 | |
| 4 | 4.1 | 31.00 | 4.21 | 22.55 | 2.50 | 1124.57 |
| 4.2 | 31.89 | 4.15 | 27.24 | 2.85 | 1161.78 | |
| 4.3 | 31.48 | 4.05 | 26.46 | 2.75 | 1176.01 | |
| Mean | 31.46 | 4.14 | 25.42 | 2.70 | 1154.12 | |
| SD | 0.45 | 0.08 | 2.51 | 0.18 | 26.56 | |
| 5 | 5.1 | 26.31 | 3.8 | 21.73 | 2.80 | 958.35 |
| 5.2 | 26.77 | 3.79 | 22.38 | 2.65 | 1025.97 | |
| 5.3 | 26.71 | 4.19 | 21.76 | 2.75 | 976.39 | |
| Mean | 26.60 | 3.93 | 21.96 | 2.73 | 986.90 | |
| SD | 0.25 | 0.23 | 0.37 | 0.08 | 35.01 | |
| 6 | 6.1 | 25.92 | 4.37 | 24.12 | 3.05 | 938.15 |
| 6.2 | 25.52 | 4.7 | 23.93 | 3.10 | 924.48 | |
| 6.3 | 25.48 | 5.21 | 21.91 | 2.75 | 989.49 | |
| Mean | 25.64 | 4.76 | 23.32 | 2.97 | 950.71 | |
| SD | 0.24 | 0.42 | 1.22 | 0.19 | 34.28 | |
| 7 | 7.1 | 28.77 | 3.07 | 27.26 | 2.85 | 1171.53 |
| 7.2 | 31.23 | 3.44 | 27.21 | 2.80 | 1187.75 | |
| 7.3 | 30.06 | 3.66 | 24.66 | 2.75 | 1090.52 | |
| Mean | 30.02 | 3.39 | 26.38 | 2.80 | 1149.93 | |
| SD | 1.23 | 0.30 | 1.49 | 0.05 | 52.09 | |
| 8 | 8.1 | 33.72 | 4.94 | 17.39 | 2.10 | 1093.49 |
| 8.2 | 33.62 | 4.14 | 26.56 | 2.85 | 1127.61 | |
| 8.3 | 33.15 | 3.69 | 29.63 | 3.05 | 1153.03 | |
| Mean | 33.50 | 4.26 | 24.53 | 2.67 | 1124.71 | |
| SD | 0.30 | 0.63 | 6.37 | 0.50 | 29.88 |
and 2 interfaces).| Exp. No. | Sample | σmax [MPa] | εt [%] | σy [MPa] Offset 0.5% | εy [%] Offset 0.5% | E [MPa] |
|---|---|---|---|---|---|---|
| 1 | 1.1 | 29.50 | 3.69 | 24.10 | 2.60 | 1139.22 |
| 1.2 | 28.80 | 4.00 | 22.44 | 2.65 | 1041.85 | |
| 1.3 | 28.66 | 3.76 | 22.54 | 2.55 | 1103.41 | |
| Mean | 28.99 | 3.82 | 23.03 | 2.60 | 1094.83 | |
| SD | 0.45 | 0.16 | 0.93 | 0.05 | 49.25 | |
| 2 | 2.1 | 28.86 | 4.21 | 25.27 | 2.95 | 1018.00 |
| 2.2 | 28.07 | 4.51 | 19.27 | 2.35 | 1053.00 | |
| 2.3 | 28.81 | 3.91 | 24.15 | 2.70 | 1095.42 | |
| Mean | 28.58 | 4.21 | 22.90 | 2.67 | 1055.47 | |
| SD | 0.44 | 0.30 | 3.19 | 0.30 | 38.77 | |
| 3 | 3.1 | 34.92 | 4.14 | 28.70 | 2.90 | 1199.07 |
| 3.2 | 34.80 | 4.83 | 19.42 | 2.25 | 1098.84 | |
| 3.3 | 36.23 | 4.44 | 28.36 | 2.80 | 1223.40 | |
| Mean | 35.32 | 4.47 | 25.49 | 2.65 | 1173.77 | |
| SD | 0.79 | 0.35 | 5.26 | 0.35 | 66.02 | |
| 4 | 4.1 | 34.07 | 4.27 | 26.35 | 2.70 | 1184.29 |
| 4.2 | 34.41 | 4.27 | 30.05 | 3.20 | 1130.54 | |
| 4.3 | 34.60 | 4.33 | 25.50 | 2.65 | 1176.21 | |
| Mean | 34.36 | 4.29 | 27.30 | 2.85 | 1163.68 | |
| SD | 0.27 | 0.03 | 2.42 | 0.30 | 28.98 | |
| 5 | 5.1 | 20.21 | 2.55 | 20.17 | 2.55 | 983.14 |
| 5.2 | 18.53 | 2.53 | 18.39 | 2.45 | 925.94 | |
| 5.3 | 18.50 | 2.29 | 17.71 | 2.26 | 985.29 | |
| Mean | 19.08 | 2.46 | 18.76 | 2.42 | 964.79 | |
| SD | 0.98 | 0.14 | 1.27 | 0.15 | 33.66 | |
| 6 | 6.1 | 26.43 | 4.81 | 21.22 | 2.75 | 944.26 |
| 6.2 | 27.36 | 5.48 | 18.27 | 2.45 | 940.55 | |
| 6.3 | 27.47 | 5.08 | 22.35 | 2.80 | 968.26 | |
| Mean | 27.09 | 5.12 | 20.61 | 2.67 | 951.02 | |
| SD | 0.57 | 0.34 | 2.11 | 0.19 | 15.04 | |
| 7 | 7.1 | 15.60 | 1.72 | 13.72 | 1.72 | 1114.19 |
| 7.2 | 14.54 | 1.42 | 10.09 | 1.42 | 1085.71 | |
| 7.3 | 15.56 | 1.71 | 12.99 | 1.71 | 1062.72 | |
| Mean | 15.23 | 1.62 | 12.27 | 1.62 | 1087.54 | |
| SD | 0.60 | 0.17 | 1.92 | 0.17 | 25.78 | |
| 8 | 8.1 | 23.29 | 2.35 | 21.55 | 2.35 | 1156.89 |
| 8.2 | 22.62 | 2.51 | 22.11 | 2.55 | 1097.75 | |
| 8.3 | 24.59 | 2.47 | 21.53 | 2.45 | 1088.20 | |
| Mean | 23.50 | 2.44 | 21.73 | 2.45 | 1114.28 | |
| SD | 1.00 | 0.08 | 0.33 | 0.10 | 37.21 |
| Samples with T and 2T Interfaces | Displacement at Break [mm] | Energy at Break [J] | Flexure Strain (Displacement) at Break [%] | Flexure Stress at Break [MPa] | Force at Break [kN] | Time at Break [s] | Flexure Displacement at Maximum Force [mm] | Flexure Strain (Displacement) at Maximum Force) [%] | Flexure Stress at Maximum Force [MPa] | Maximum Force [kN] | Young’s Modulus [MPa] | |
|---|---|---|---|---|---|---|---|---|---|---|---|---|
| Exp. 3 | 3.1 | 4.23 | 0.26 | 3.14 | 29.53 | 0.07 | 84.85 | 3.89 | 2.88 | 54.62 | 0.12 | 2305.87 |
| 3.2 | 4.27 | 0.21 | 3.17 | 6.79 | 0.01 | 85.65 | 3.64 | 2.70 | 39.21 | 0.09 | 2075.44 | |
| 3.3 | 4.61 | 0.33 | 3.42 | 31.02 | 0.07 | 92.32 | 4.19 | 3.11 | 59.75 | 0.13 | 2328.20 | |
| Mean | 4.37 | 0.27 | 3.24 | 22.45 | 0.05 | 87.61 | 3.91 | 2.90 | 51.19 | 0.11 | 2236.50 | |
| SD | 0.21 | 0.06 | 0.15 | 13.58 | 0.03 | 4.10 | 0.28 | 0.21 | 10.69 | 0.02 | 139.93 | |
| Exp. 8 | 8.1 | 5.81 | 0.37 | 4.31 | 13.85 | 0.03 | 116.43 | 4.34 | 3.22 | 51.52 | 0.11 | 2038.85 |
| 8.2 | 4.88 | 0.30 | 3.62 | 20.83 | 0.05 | 97.78 | 4.19 | 3.11 | 48.03 | 0.11 | 2008.53 | |
| 8.3 | 5.39 | 0.32 | 4.00 | 21.45 | 0.05 | 108.00 | 3.94 | 2.92 | 45.31 | 0.10 | 2041.10 | |
| Mean | 5.36 | 0.33 | 3.98 | 18.71 | 0.04 | 107.40 | 4.16 | 3.08 | 48.29 | 0.11 | 2029.49 | |
| SD | 0.47 | 0.04 | 0.35 | 4.22 | 0.01 | 9.34 | 0.20 | 0.15 | 3.11 | 0.01 | 18.19 | |
and 2).| Samples with and 2 Interfaces | Displacement at Break [mm] | Energy at Break [J] | Flexure Strain (Displacement) at Break [%] | Flexure Stress at Break [MPa] | Force at Break [kN] | Time at Break [s] | Flexure Displacement at Maximum Force [mm] | Flexure Strain (Displacement at Maximum Force) [%] | Flexure Stress at Maximum Force [MPa] | Maximum Force [kN] | Young’s Modulus [MPa] | |
|---|---|---|---|---|---|---|---|---|---|---|---|---|
| Exp. 3 | 3.1 | 4.67 | 0.31 | 3.47 | 29.08 | 0.06 | 93.58 | 4.54 | 3.37 | 56.82 | 0.13 | 2177.75 |
| 3.2 | 4.03 | 0.25 | 2.99 | 32.14 | 0.07 | 80.73 | 3.94 | 2.92 | 55.08 | 0.12 | 2402.02 | |
| 3.3 | 3.96 | 0.27 | 2.93 | 26.10 | 0.06 | 79.34 | 3.69 | 2.73 | 54.86 | 0.12 | 2452.57 | |
| Mean | 4.22 | 0.28 | 3.13 | 29.11 | 0.06 | 84.55 | 4.06 | 3.01 | 55.59 | 0.12 | 2344.11 | |
| SD | 0.39 | 0.03 | 0.30 | 3.02 | 0.01 | 7.85 | 0.44 | 0.33 | 1.07 | 0.01 | 146.28 | |
| Exp. 4 | 4.1 | 5.20 | 0.35 | 3.86 | 28.26 | 0.06 | 104.17 | 4.74 | 3.52 | 56.68 | 0.13 | 2107.88 |
| 4.2 | 3.81 | 0.25 | 2.83 | 24.22 | 0.05 | 76.40 | 3.59 | 2.66 | 53.91 | 0.12 | 2356.25 | |
| 4.3 | 4.93 | 0.32 | 3.66 | 17.49 | 0.04 | 98.92 | 4.19 | 3.11 | 57.09 | 0.13 | 2 391.32 | |
| Mean | 4.65 | 0.31 | 3.45 | 23.32 | 0.05 | 93.16 | 4.17 | 3.10 | 55.89 | 0.13 | 2285.15 | |
| SD | 0.74 | 0.05 | 0.55 | 5.44 | 0.01 | 14.75 | 0.58 | 0.43 | 1.73 | 0.01 | 154.52 | |
| Exp. No. | Sample | Interface Geometry | Energy [J] | Pendulum Rebound Angle [°] |
|---|---|---|---|---|
| 3 | 3.1 | T | 0.135 | 104.09 |
| 3.2 | 0.209 | 104.22 | ||
| 3.3 | 0.221 | 104.04 | ||
| Mean | 0.18 | |||
| SD | 0.04 | |||
| 8 | 8.1 | 2T | 0.244 | 103.68 |
| 8.2 | 0.180 | 104.67 | ||
| 8.3 | 0.151 | 105.12 | ||
| Mean | 0.19 | |||
| SD | 0.04 | |||
| 3 | 3.1 | | 0.197 | 104.4 |
| 3.2 | 0.215 | 104.13 | ||
| 3.3 | 0.203 | 104.31 | ||
| Mean | 0.20 | |||
| SD | 0.009 | |||
| 4 | 4.1 | 2 | 0.268 | 103.32 |
| 4.2 | 0.315 | 102.6 | ||
| 4.3 | 0.303 | 102.78 | ||
| Mean | 0.29 | |||
| SD | 0.02 |
| Sample No. | Porosity [%] | Indication Count | Total Indication Volume [mm3] | Material Volume [mm3] | ∑ Voxel | ∑ Volume [mm3] |
|---|---|---|---|---|---|---|
| 3A | 5.03301 | 12,227 | 80.36584 | 1516.40869 | 7,334,623 | 80.36584 |
| 3B | 5.64214 | 21,322 | 91.70368 | 1533.63171 | 8,508,165 | 91.70368 |
| 3C | 4.55798 | 14,739 | 71.64204 | 1500.15320 | 6,618,078 | 71.64204 |
| 8A | 5.90224 | 12,722 | 92.72211 | 1478.24170 | 8,701,816 | 92.72211 |
| 8B | 4.65271 | 12,275 | 70.27961 | 1440.23022 | 6,671,883 | 70.27961 |
| 8C | 5.68049 | 24,107 | 86.18713 | 1431.06189 | 8,622,736 | 86.18713 |
interface—centralization of XCT information.| Sample No. | Porosity [%] | Indication Count | Total Indication Volume [mm3] | Material Volume [mm3] | ∑ Voxel | ∑ Volume [mm3] |
|---|---|---|---|---|---|---|
| 3A | 4.48410 | 41,292 | 67.55898 | 1439.07568 | 6,127,165 | 67.55898 |
| 3B | 4.83029 | 12,271 | 75.24384 | 1482.50488 | 6,752,803 | 75.24384 |
| 3C | 3.63700 | 15,549 | 58.32329 | 1545.28699 | 5,288,997 | 58.32329 |
| 4A | 4.53029 | 23,015 | 71.44789 | 1505.66858 | 6,457,252 | 71.44789 |
| 4B | 4.74642 | 10,713 | 75.63515 | 1517.88599 | 6,781,273 | 75.63515 |
| 4C | 3.84026 | 8841 | 57.90508 | 1449.93762 | 5,212,911 | 57.90508 |
Disclaimer/Publisher’s Note: The statements, opinions and data contained in all publications are solely those of the individual author(s) and contributor(s) and not of MDPI and/or the editor(s). MDPI and/or the editor(s) disclaim responsibility for any injury to people or property resulting from any ideas, methods, instructions or products referred to in the content. |
© 2026 by the authors. Licensee MDPI, Basel, Switzerland. This article is an open access article distributed under the terms and conditions of the Creative Commons Attribution (CC BY) license.
Share and Cite
Catana, M.; Tampu, C.; Mazurchevici, S.-N.; Tzotzis, A.; Sitek, W.; Teodor, V.G.; Susac, F.; Tatarciuc, M.S.; Kyratsis, P.; Tiseanu, I.; et al. Interlocking Interfaces for Enhanced Mechanical Properties in Bi-Component 3D Printing of Biodegradable Materials. Micromachines 2026, 17, 937. https://doi.org/10.3390/mi17080937
Catana M, Tampu C, Mazurchevici S-N, Tzotzis A, Sitek W, Teodor VG, Susac F, Tatarciuc MS, Kyratsis P, Tiseanu I, et al. Interlocking Interfaces for Enhanced Mechanical Properties in Bi-Component 3D Printing of Biodegradable Materials. Micromachines. 2026; 17(8):937. https://doi.org/10.3390/mi17080937
Chicago/Turabian StyleCatana (Oancea), Maria, Catalin Tampu, Simona-Nicoleta Mazurchevici, Anastasios Tzotzis, Wojciech Sitek, Virgil Gabriel Teodor, Florin Susac, Monica Silvia Tatarciuc, Panagiotis Kyratsis, Ion Tiseanu, and et al. 2026. "Interlocking Interfaces for Enhanced Mechanical Properties in Bi-Component 3D Printing of Biodegradable Materials" Micromachines 17, no. 8: 937. https://doi.org/10.3390/mi17080937
APA StyleCatana, M., Tampu, C., Mazurchevici, S.-N., Tzotzis, A., Sitek, W., Teodor, V. G., Susac, F., Tatarciuc, M. S., Kyratsis, P., Tiseanu, I., Dobrea, C., Ke, Y., Păunoiu, V., & Nedelcu, D. (2026). Interlocking Interfaces for Enhanced Mechanical Properties in Bi-Component 3D Printing of Biodegradable Materials. Micromachines, 17(8), 937. https://doi.org/10.3390/mi17080937