Abstract
This paper presents a design method for a continuous tension detection sensor based on a cantilever beam structure and compensates for the temperature drift of a SAW sensor based on a neural network algorithm. Firstly, a novel cantilever beam roller structure is proposed to significantly enhance the sensitivity of the transmission of silk thread tension to a SAW tension sensor. Secondly, to improve the sensitivity of the SAW tension sensor, the COMSOL finite element method (FEM) is employed for simulation to determine the optimal IDT placement. An unbalanced split IDT design is utilized to suppress potential parasitic responses. Finally, the designed sensor is tested, and a GA-PSO-BP algorithm is employed to fit the test data for temperature compensation. The experimental results demonstrate that the temperature sensitivity coefficient of the data optimized by the GA-PSO-BP algorithm is reduced by an order of magnitude compared to the raw data, with reductions of
and compared to the BP neural network and the PSO-BP algorithm, respectively. The average output error of the optimized data is reduced by 5.748% compared to the sensor measurement data, and it is also lower than both the BP neural network and the PSO-BP algorithm. It provides new design ideas for the development of tension sensors.
1. Introduction
Silk, a historically significant and culturally valuable textile, is highly prized in clothing and decoration for its unique luster, softness, and breathability [1]. Tension control during silk production is critical for maintaining product quality. Each stage, from reeling to twisting to weaving, demands precise tension monitoring and adjustment. Insufficient tension can cause slackness and wrinkling, while excessive tension may lead to breakage, both of which negatively impact production efficiency and final product quality [2,3].
In recent years, the rapid development of Surface Acoustic Wave (SAW) sensor technology has offered new solutions for tension measurement in silk production. SAW sensors detect changes in physical quantities through acoustic wave propagation on the surface of piezoelectric materials. They feature high sensitivity, wireless operation, and strong anti-electromagnetic interference capability [4,5]. SAW tension sensors can convert strain signals into frequency changes for contactless tension measurement. This approach prevents damage to silk fibers from traditional contact sensors and enhances measurement accuracy and stability.
However, a key challenge in using SAW sensors for silk tension measurement is temperature compensation. The piezoelectric materials used in SAW sensors are sensitive to temperature changes, which can alter the output frequency of the sensor and thus affect measurement precision [6,7]. Temperature fluctuations in silk production workshops, caused by seasonal changes or equipment operation, necessitate effective temperature compensation strategies to ensure the accuracy and reliability of SAW tension sensors.
To address the issue of temperature compensation, Lu, Guo, and U. Youbi et al. [7,8,9] employed a hardware compensation scheme. Although this method can suppress temperature interference to some extent, it has limitations such as a narrow applicable range, high cost, and complex debugging requirements. In contrast, software compensation methods offer advantages such as low cost, high flexibility, reliability, and precision. Sun et al. [10] proposed a temperature compensation model for silicon piezoresistive pressure sensors based on a particle swarm optimization (PSO) algorithm in combination with a BP neural network. Feng et al. [11] proposed a PSO-LSSVM algorithm to compensate for temperature errors in SAW tension sensors.
To satisfy the tension control requirements of silk production, this study focuses on developing a cantilever beam roller SAW tension sensor. It also proposes using a GA-PSO-BP algorithm to compensate for the temperature, which induced errors in SAW tension sensors. By optimizing the sensor’s design and structure, the goal is to enhance the measurement accuracy and stability of silk tension. Moreover, by designing a proper temperature compensation strategy that considers real-world production temperature variations, the sensor can ensure measurement accuracy across different temperatures. Experimental results, compared with those of traditional BP neural networks and PSO-BP algorithms, show that the GA-PSO-BP algorithm offers superior prediction performance. This research not only enhances the tension detection accuracy of textile silk products but also provides a new design concept of cantilever beam structure for high-precision tension detection equipment.
The structure of this paper is as follows: after the introduction in Section 1, Section 2 covers the principles of cantilever beam roller SAW tension sensors and temperature compensation algorithms. Section 3 presents the design and simulation of the cantilever beam roller SAW tension sensor. In Section 4, the data measurement of the cantilever beam roller SAW tension sensor is completed, and analysis of temperature compensation is provided. The conclusion of this paper can be found in Section 5.
2. Principles of SAW Tension Sensor and GA-PSO-BP Algorithm
2.1. Principle of the Cantilever Beam Roller SAW Structure
The piezoelectric materials (e.g., quartz crystals, lithium niobate) of SAW sensors are subjected to mechanical stress, and they generate electric charges. Conversely, applying an electric field can cause mechanical deformation [12]. In SAW sensors, interdigital transducers (IDTs) are used to excite and detect SAWs. Upon receiving an electromagnetic signal, the IDT, leveraging the piezoelectric effect, converts electrical signals into acoustic surface waves, which then propagate along the surface of the piezoelectric material.
The schematic diagram of the cantilever beam roller SAW tension sensor structure proposed in this paper is shown in Figure 1a. The cantilever beam roller SAW tension sensor comprises three guide rollers: roller A, roller B, and roller C. The resultant tension FR of the yarn equals the yarn tension F. Roller A is fixed to the cantilever beam, and the tension induces deformation in the beam, transmitting the force to the SAW device. As shown in Figure 1b, the SAW device consists of a doubly supported piezoelectric substrate, an input IDT, and an output IDT. The SAW oscillator is formed by connecting the SAW device to an amplifier.

Figure 1.
(a) Suspended beam structural diagram. (b) Schematic diagram of SAW device structure.
When the yarn tension F applies on the piezoelectric substrate of the single-cantilever-beam SAW sensor through the guide rollers and rods, the geometry of the input and output IDTs (finger width and finger spacing) and the elastic modulus of the piezoelectric substrate are altered. These changes induce a variation in the output frequency of the SAW oscillator (Figure 2). In summary, the frequency shift of the SAW oscillator is linearly proportional to the yarn tension F, thereby enabling accurate yarn tension measurement [13].
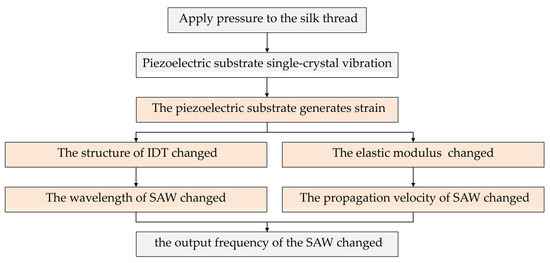
Figure 2.
SAW tension sensor working flow chart.
The output frequency of the SAW oscillator can be expressed by
where is the oscillator’s output frequency when the applied tension , and is the frequency shift induced when . This frequency shift is linearly related to the tension F:
in which α is a constant. Alternatively, the frequency shift can be written as
For the SAW oscillator, the center frequency and the elastic-stiffness constant of the piezoelectric substrate are known. Therefore, the frequency shift is determined solely by the strain in the piezoelectric material.
2.2. Principle of GA-PSO-BP Algorithm
2.2.1. BP Neural Network
A BP neural network is a multi-layer feedforward neural network that optimizes weights and thresholds through the backpropagation algorithm. Its structure includes an input layer, a hidden layer, and an output layer [14]. Leveraging this advantage, the BP neural network can address complex nonlinear issues such as temperature compensation for sensors, thereby enhancing the measurement accuracy and reliability of the sensors [15].
Forward propagation is the process by which input data are passed through each layer of the network and computed to produce an output. The forward-propagation formulas are as follows:
where the superscripts denote the layer index and the subscripts denote the neuron index.
The essence of backpropagation is to quantify the discrepancy between the network’s output and the ground-truth target, propagate this error backward, and adjust every parameter (weights and biases) so as to minimize the overall loss.
For the m-th hidden layer, the error can be calculated using the backpropagation formula:
For the output layer of the L-th layer, the error is
The gradient expressions of weights and biases are
Using gradient descent, the parameters are updated as
The relevant parameters are given in Table 1. The core of the BP neural network lies in performing forward propagation to calculate the output of the network, using the cost function to quantify the error, calculating the gradient through backpropagation, and then updating the weights and biases to minimize this error. Through repeated iterations, the network’s performance is progressively optimized. During the training of BP neural networks, the error surface frequently contains multiple local minima. When the network training process falls into these local minima, further weight adjustments barely reduce the error and may even cause it to stall. This prevents the network from reaching the global optimum, thereby undermining its generalization and performance. To address the BP neural network’s shortcomings of being trapped in local minima and having slow convergence, it is essential to develop optimization strategies. These strategies should enable the network to escape local minima, enhance overall performance, and significantly accelerate convergence.

Table 1.
Parameters in BP neural network.
2.2.2. PSO-BP Algorithm
At the end of the last century, J. Kennedy et al. [16] proposed the particle swarm optimization (PSO) algorithm, a meta-heuristic approach for solving optimization problems. Inspired by the modeling and simulation of bird-flocking behavior, PSO-based network optimization can expand the search scope and prevent BP neural networks from falling into local optima [17].
When analyzing the principles of the particle-swarm algorithm, the following basic assumptions are made: in a D dimensional space, there exists a collection of N particles. This collection exchanges and updates information through specific rules to achieve optimization. Dimension D is determined as
In this space, the position and velocity of the i-th particle are expressed as
To avoid a blind search in the space, and are limited by maximum position and maximum velocity . ranges within , and ranges within .
In each iteration, a neural network predicts the particle’s position to calculate fitness. Comparing fitness values updates each particle’s local optimum and the swarm’s global optimum. All particles search independently until the maximum iterations are reached, and the individual extremum is recorded:
During the particle-swarm operation, each particle interacts and shares information. The best global position found by all particles is called the global extremum :
By analyzing and , particles update their velocity and position as follows:
The relevant parameters are given in Table 2. With its unique velocity-guidance mechanism, PSO enhances search speed and demonstrates strong memory. Optimal particles record and share their position information. However, the PSO-BP algorithm may have low precision due to the lack of real-time dynamic velocity adjustment and sensitivity to parameter settings.

Table 2.
Parameters in PSO-BP algorithm.
2.2.3. GA-PSO-BP Algorithm
To enhance optimization, the GA-PSO integrated algorithm combines the genetic mechanism of genetic algorithms with the particle swarm algorithm.
Based on the PSO algorithm, each particle’s velocity and position are updated by considering the particle’s historical best position and the swarm’s best position, following the standard PSO update rules.
Drawing from the GA algorithm, some individuals are selected as parents, and new offspring are generated through crossover and mutation. An elite strategy is employed, selecting particles with the smallest fitness values from the global and historical optimal solutions as parents in the genetic offspring.
The offspring are merged with the current population, fitness values are recalculated, and particles with the smallest fitness values are chosen as the new generation. When the termination condition is met, the global optimal solution is outputted.
The GA-PSO algorithm integrates the global search of GA and the local search of PSO, effectively solving complex optimization problems while maintaining excellent search performance and convergence.
The training of a GA-PSO-BP neural network involves the following steps:
- (1)
- Initialization: Create a BP neural network. Initialize the population (for GA), where each individual represents the network’s weights and biases. Initialize the particle swarm (for PSO), with each particle also representing the weights and biases.
- (2)
- GA optimization: Generate new individuals by applying selection, crossover, and mutation operations to the network’s weights and biases. Evaluate each individual’s fitness using the network’s error or loss function.
- (3)
- PSO adjustment: Initialize or update the particle swarm’s positions based on the GA-processed population. Update each particle’s velocity and position using historical best positions (individual and global). Update the network’s weights and biases accordingly.
- (4)
- BP training: Train the BP neural network using the updated weights and biases, adjusting them through backpropagation based on the loss function.
- (5)
- Iteration check: Repeat steps (2)–(4) until a stopping condition is met, such as a maximum number of iterations or a minimum error threshold.
The result is a neural network with enhanced learning and generalization capabilities, less prone to local optima.
3. Design and Simulation of SAW Tension Sensor
3.1. Design of SAW Device
Single-electrode IDTs are shown in Figure 3a [18], which is very likely to cause a second-order effect, causing edge reflections and increasing the sidelobe levels of the SAW sensor. Excessive sidelobes in the frequency of single-electrode IDTs are shown in Figure 3b. To mitigate sidelobes, an unbalanced split design is proposed, as shown in Figure 3c.
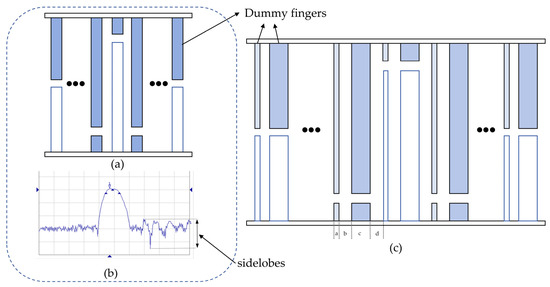
Figure 3.
(a) Single-electrode IDTs. (b) Diagram showing excessive sidelobes in the frequency of single-electrode IDTs. (c) Unbalanced split-electrode IDTs.
In Figure 3c, a and c represent the widths of the segmented electrodes, while b and d represent the electrode spacings. These parameters are related to the wavelength as follows:
To further suppress side lobes, the input IDT’s electrode overlap envelope is weighted according to the Hamming [19,20] function:
The output transducer adopts a uniform split design, as shown in Figure 3a. Given , the number of output IDT electrode pairs is chosen as .
The input and output IDTs can be defined as
The overall response is the sum of the input and output IDT responses:
The bandwidth is given by
With , the relationship between and is derived as
For a designed SAW tension sensor bandwidth of , the number of input IDT pairs is determined to be .
The parameters related to the formulas are shown in Table 3.

Table 3.
Relevant parameters to the formulas.
The design parameters of the SAW tension sensor based on the cantilever beam structure are shown in Table 4.

Table 4.
Design parameters of the SAW tension sensor.
3.2. FEM of SAW Device
To achieve enhanced sensitivity of the SAW tension sensor and accurately simulate the sensor’s behavior under complex conditions, this paper first conducts simulation analysis of the sensor. The finite element method (FEM) employed in this paper is an innovative approach to solving elastic–plastic problems. The fundamental concept of the FEM [21] involves discretizing a continuous geometry into finite elements, applying boundary conditions, and solving the equations to obtain numerical solutions, thereby transforming an infinite degree-of-freedom problem into a finite degree-of-freedom problem.
COMSOL Multiphysics 6.2 software is used to model a cantilever beam SAW tension sensor and determine the strain distribution in the piezoelectric substrate. In order to make the experimental results more accurate, the size of the grid cells was set to be “extremely fine” (1110 thousand domain units). ST-X quartz crystal is chosen as the piezoelectric material because it has superior strain performance compared to other crystals [22,23]. The materials and design parameters of the SAW tension sensor are summarized in Table 5.

Table 5.
The materials and design parameters of the SAW tension sensor.
After setting up the model parameters, meshing, and conastraints, a tensile force of F = 0.5 N is applied to the cantilever beam. The tensile force F = 0.5 N was selected as it represents the upper limit of typical silk thread tension during weaving processes (0.3–0.6 N) [1]. This value ensures validation of sensor performance under high-stress conditions while operating within the linear range of the sensor (0–1 N). The force F is transmitted to the cantilever beam through the cylindrical surface of the yarn guide roller A, with the contact surface being a line contact. The resulting deformation and stress distribution are shown in Figure 4a,c, where blue indicates the minimum strain and red the maximum strain regions. Figure 4b shows the displacement variation from 0 to 0.5 N at the center line of the base. This data was obtained through parameter scanning. Figure 4d shows corresponding stress changes in the substrate under the same force range.
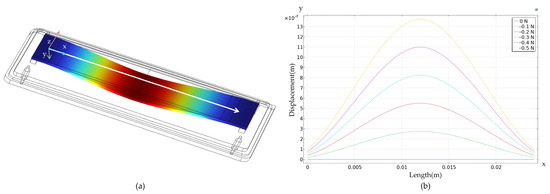
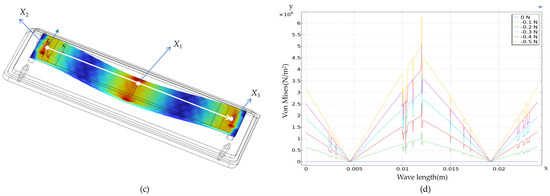
Figure 4.
(a) Displacement diagram of the SAW tension sensor (F = 0.5 N). (b) Displacement curve of the SAW tension sensor. (c) Strain diagram of the SAW tension sensor (F = 0.5 N). (d) Strain curve of the SAW tension sensor.
The FEM of the piezoelectric substrate shows that strain and displacement peak at the center of the piezoelectric plate, specifically at point X1 in Figure 4c. Due to the excessively high curvature, the IDTs may become asymmetric in shape [24]. Therefore, the input and output IDTs are placed at points X2 and X3, respectively. These points exhibit significant strain and minimal deformation.
As shown in Figure 5a, the appropriate size of the SAW transducer was designed, and the L-edit 16.3 software was used to draw the mask layout diagram of the SAW transducer. Figure 5b is the physical diagram of the SAW tension sensor.

Figure 5.
(a) Design of the piezoelectric substrate’s size. (b) SAW device fabricated on the ST-X quartz substrate.
4. Data Measurement and Processing
4.1. Data Measurement
Based on the characteristics of the cantilever beam roller SAW tension sensor and the feasibility of the simulation results, we designed and developed a measurement system to explore the relationship between input variables and output variables, as shown in Figure 6a. In Figure 6b, Keysight E5061A (Keysight Technologies, America) was used to measure the frequency response characteristics of the SAW sensor.
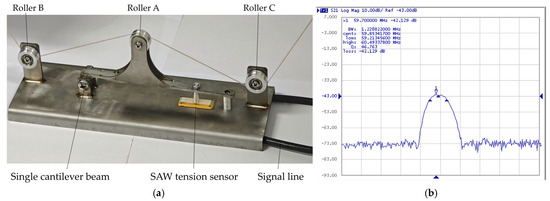
Figure 6.
(a) The construction diagram of the cantilever beam roller SAW yarn tension sensor measurement system. (b) Frequency response characteristics of the SAW sensor.
To characterize the sensor’s output under varying tensions, this paper applied tensions ranging from 0 to 1 N in 0.1 N increments and tested the SAW sensor at different temperatures to assess thermal effects. High-precision temperature sensors were utilized to set and stabilize the room temperature of the entire testing environment. Some test data for the SAW winding tension sensor at various temperatures are listed in Table 6.

Table 6.
Measurement data of the SAW tension sensor.
The temperature sensitivity coefficient is utilized to determine whether the temperature has any impact on the accuracy of the SAW sensor. The temperature sensitivity coefficient, , defined as
quantifies the temperature impact on the sensor’s accuracy. Here, is the full-range winding tension across temperatures, is the maximum temperature change, and is the frequency shift range. A larger indicates a greater thermal influence on the sensor’s precision. From the table data, this paper selected F = 1.0 N, , so
The results show that temperature variations significantly affect the SAW tension sensor, so temperature compensation is essential.
4.2. Data Processing
A GA-PSO-BP algorithm is proposed for data processing to mitigate the thermal impact on the SAW tension sensor and reduce measurement errors. By combining the global search of GA with the local search of PSO, it effectively addresses complex, high-dimensional, nonlinear optimization problems while ensuring excellent convergence and search performance. The implementation steps of the GA-PSO-BP algorithm are illustrated in Figure 7.
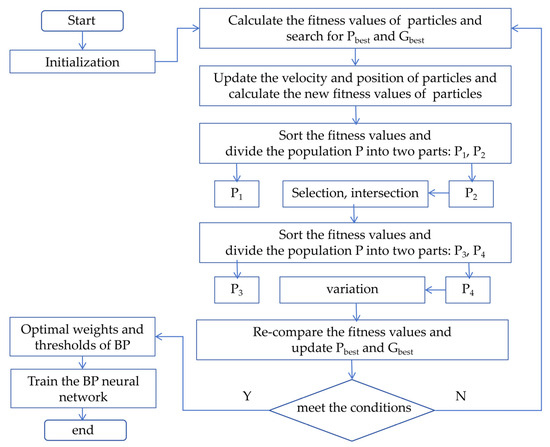
Figure 7.
The implementation steps of the GA-PSO-BP algorithm.
Table 7 shows the data after GA-PSO-BP algorithm temperature compensation. From the data in Table 7, the compensated temperature sensitivity coefficient was calculated. Taking the data at F = 1.0 N as an example, , and , so

Table 7.
The compensated data of the SAW tension sensor obtained by the GA-PSO-BP algorithm.
4.3. Data Comparison
To facilitate data comparison, this paper conducted a comparative analysis on the same dataset, comparing the traditional measurement values, BP neural network, PSO-BP algorithm, and GA-PSO-BP algorithm. All training and testing samples were collected from the SAW sensor’s measured frequency response data under different temperatures (20–40 °C) and different tension levels (0–1.0 N), as shown in Table 6. An 80–20% random split was used for training and testing sets, ensuring all algorithms were compared under identical data conditions.
The accuracy of the SAW tension sensor can be evaluated by the magnitude of the average error in the output, and the formula is as follows:
The smaller the value of x is, the less impact this temperature has on the SAW tension sensor, and it also indicates that the accuracy of the SAW tension sensor is higher. As shown in Table 8, the average error of the sensor measurement data is 6.834%, while the average error of the data optimized by the GA-PSO-BP algorithm is 1.086 or even better. And the average error of the GA-PSO-BP algorithm is significantly lower than that of the BP neural network and the PSO-BP algorithm. This difference can be better illustrated in Figure 8. As a result, the GA-PSO-BP algorithm for the temperature compensation of the SAW tension sensor is better.

Table 8.
The average error of sensor measurement data and three algorithms.
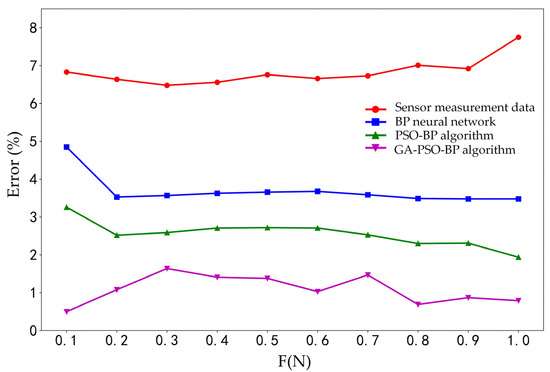
Figure 8.
Comparison of the average error of sensor measurement data and three algorithms.
As shown in Figure 9, the data optimized by the GA-PSO-BP algorithm significantly mitigated the temperature impact on the SAW tension sensor. The temperature sensitivity coefficient was also reduced by an order of magnitude compared to the original data, as indicated in the equation. Figure 10 presents a comparison of the temperature sensitivity coefficients after optimization using different algorithms.
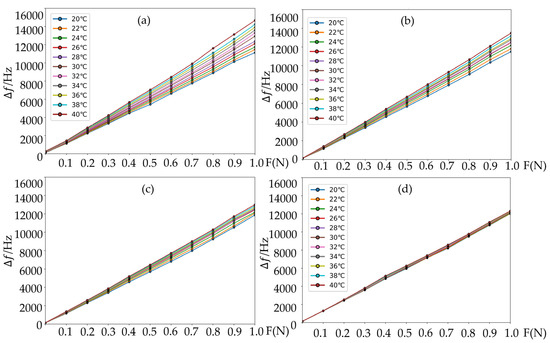
Figure 9.
Curve fitting of the temperature-compensated measurement data using different algorithms. (a) Original data; (b) BP neural network; (c) PSO-BP algorithm; (d) GA-PSO-BP algorithm.
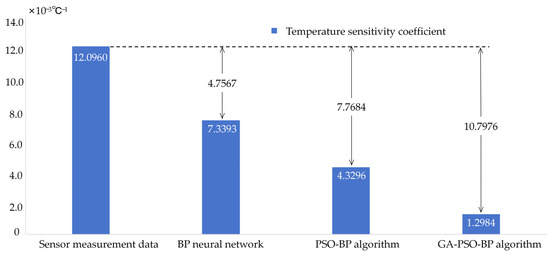
Figure 10.
Comparison of temperature sensitivity coefficients of different algorithms.
5. Conclusions
This paper presents a new continuous tension detection sensor design based on a cantilever beam roller SAW tension sensor to address the demand for silk thread tension control. By optimizing the sensor’s design and structure, the measurement accuracy and stability of silk tension are enhanced. Additionally, a software compensation method is employed to reduce the temperature error of the SAW tension sensor. The conclusions are as follows:
- (1)
- A novel cantilever beam roller SAW tension sensor is developed. The rollers are fixed on the cantilever beam, enabling the silk thread tension to directly act on the cantilever beam, thereby better conducting to the SAW sensor. This structure can significantly enhance the sensitivity of the transmission of silk thread tension to the SAW tension sensor.
- (2)
- A SAW device is created using quartz as the piezoelectric substrate, achieving a target bandwidth of 2.04% at a center frequency of 60 MHz. To suppress parasitic responses of SAW, the sensor design incorporates an unbalanced split-electrode IDT structure, along with appropriate input and output IDTs. To determine the optimal IDT placement, COMSOL-FEM is utilized for modeling and simulation. Based on the simulation results, the significant strain and minimal deformation positions are selected to place the IDTs.
- (3)
- To address the temperature impact on SAW tension sensors, this paper applied the GA-PSO-BP algorithm. This algorithm integrates the global search capability of genetic algorithms (GA) with the local optimization strength of particle swarm optimization (PSO). It effectively reduced the temperature sensitivity coefficient to , marking a significant improvement over the original data and other traditional algorithms. Specifically, compared to traditional BP networks and PSO-BP algorithms, the reductions achieved are and , respectively. The average output error of the optimized data is reduced by 5.748% compared to the sensor measurement data. The average output error of the optimized data is reduced by 5.748% compared to the sensor measurement data, and it is also lower than both the BP neural network and the PSO-BP algorithm.
Author Contributions
Conceptualization, Y.F.; Writing—original draft, B.Z. and Y.C.; Writing—review and editing, B.Z. and B.W.; Visualization, Y.C. and H.X.; Software analysis, H.Y. and X.Y.; Funding acquisition, B.W. and P.Y.; Project administration, Y.F. and P.Y. All authors have read and agreed to the published version of the manuscript.
Funding
This research was funded in part by the Zhejiang Provincial Natural Science Foundation of China under Grants LQ23F010005 and LBMHY25E060007 and by “The Professional Development Projects of Teachers” for Domestic Visiting Scholars of Colleges and Universities in 2022, China, under Grant FX2022075.
Data Availability Statement
The original contributions presented in this study are included in the article; further inquiries can be directed to the corresponding authors.
Acknowledgments
The authors gratefully acknowledge the support of Wenbo Liu for his measurements.
Conflicts of Interest
Author Yang Chen was employed by the company Hangzhou Zhundao Information Technology Co. The remaining authors declare that the research was conducted in the absence of any commercial or financial relationships that could be construed as a potential conflict of interest.
References
- Sun, D.; Liu, H. Development and Application of Technology for Low-Tension High-Density Shrink-Proof Finishing and Covalent Cross-Linking Crease Resistance Treatment of Silk. Jiangsu Silk 2015, 02, 37–39. [Google Scholar]
- Zheng, B.; Jiang, G.; Xia, F.; Zhang, A. Design of Dynamic Warp Tension Compensation System for Warp Knitting Based on Model Prediction. J. Text. Res. 2021, 42, 163–169. [Google Scholar]
- Ali, M.; Ahmed, R.; Amer, M. Yarn tension control technique for improving polyester soft winding process. Sci. Rep. 2021, 11, 1060. [Google Scholar] [CrossRef] [PubMed]
- Janczuk-Richter, M.; Dominik, M.; Roźniecka, E.; Koba, M.; Mikulic, P.; Bock, W.J.; Łoś, M.; Smietana, M.J.; Niedziółka-Jönsson, J. Long-period fiber grating sensorfor detection of viruses. Sens. Actuators B Chem. 2017, 250, 32–38. [Google Scholar] [CrossRef]
- Marques, C.A.F.; Peng, G.D.; Webb, D.J. Highly sensitive liquid level monitoringsystem utilizing polymer fiber bragg gratings. Opt. Express 2015, 23, 6058–6072. [Google Scholar] [CrossRef] [PubMed]
- Lu, W.; Lu, X.; Zhu, C.; Liu, Q.; Zhang, H. Solving three key problems of the SAW yarn tension sensor. IEEE Trans. Electron Devices 2012, 59, 2853–2855. [Google Scholar] [CrossRef]
- Lu, W.; Feng, Y.; Zhu, C.; Zhen, J. Temperature compensation of the SAW yarn tension sensor. Ultrasonics 2017, 76, 87–91. [Google Scholar] [CrossRef] [PubMed]
- Guo, X.; Yuan, C.; Zhu, B.; Ke, Y.; Li, H. Research on Temperature Compensation Method for Surface Acoustic Wave Strain Sensors. Piezoelectrics Acoustooptics 2016, 38, 744–746. [Google Scholar]
- Youbi, U.; Hage-Ali, S.; Zhang, Q.; Yang, Y.; Ba, D.; M’jahed, H.; Aubert, T.; Elmazria, O. High-Q Wireless SAW Sensors Based on AlN/Sapphire Bilayer Structure, Operating at 2.45 GHz Range for High-Temperature Applications. IEEE Sens. Lett. 2024, 8, 1–4. [Google Scholar] [CrossRef]
- Sun, Y.; Miao, F.; Tao, B. Application of PSO-Based BP Neural Network in Temperature Compensation for Pressure Sensors. J. Sens. Technol. 2014, 27, 342–346. [Google Scholar]
- Feng, Y.; Liu, W.; Yu, H.; Hu, K.; Sun, S.; Wang, B. Temperature Compensation of SAW Winding Tension Sensor Based on PSO-LSSVM Algorithm. Micromachines 2023, 14, 2093. [Google Scholar] [CrossRef] [PubMed]
- Pan, F. Surface Acoustic Wave Materials and Devices; Science Press: Beijing, China, 2012; pp. 24–27. [Google Scholar]
- Ding, Y.; Lu, W.; Zhang, Y. Study on the practical application of surface acoustic wave yarn tension sensor. IEEE Trans. Ind. Electron. 2014, 69, 13781–13790. [Google Scholar] [CrossRef]
- Li, Y.; Li, J.; Huang, J.; Zhou, H. Fitting analysis and research of measured data of SAW micro-pressure sensor based on BP neural network. Measurement 2020, 155, 107533. [Google Scholar] [CrossRef] [PubMed]
- Liang, H.; Chen, W.; Fu, Y.; Zhou, W.; Mo, L.; Jian, Y.; Wen, Q.; Liu, D.; He, J. Back Propagation Neural Network-Based Predictive Model for Magnetorheological–Chemical Polishing of Silicon Carbide. Micromachines 2025, 16, 271. [Google Scholar] [CrossRef] [PubMed]
- Kennedy, J.; Eberhart, R. Particle swarm optimization. In Proceedings of the IEEE International Conference on Neural Networks, Perth, Australia, 27 November–1 December 1995; Volume 4, pp. 1942–1948. [Google Scholar]
- Liu, X.; Jin, X.; Li, C.; Ma, Y.; Xu, D.; Guo, S. Comprehensive Performance-Oriented Multi-Objective Optimization of Hemispherical Resonator Structural Parameters. Micromachines 2025, 16, 287. [Google Scholar] [CrossRef] [PubMed]
- Lee, T.; Guyette, A.; Naglich, E.J.; Peroulis, D. Coupling-matrix-based SAW filter design. In Proceedings of the 2014 IEEE MTT-S International Microwave Symposium (IMS2014), Tampa, FL, USA, 1–6 June 2014; pp. 1–4. [Google Scholar]
- Morgan, D.P. Surface Acoustic Wave Filters, 2nd ed.; Elsevier: Amsterdam, The Netherlands, 2007; pp. 169–176. [Google Scholar]
- Campbell, C.K. Surface Acoustic Wave Devices and Their Signal Processing Applications; Elsevier: Amsterdam, The Netherlands, 1989; pp. 59–65. [Google Scholar]
- Taran, N.; Ionel, D.M.; Rallabandi, V.; Heins, G.; Patterson, D. An overview of methods and a new three-dimensional FEA and analytical hybrid technique for calculating AC winding losses in PM machines. IEEE Trans. Ind. Appl. 2021, 57, 352–362. [Google Scholar] [CrossRef]
- Wang, S.; Zhang, L.; Xie, L.; Huang, B.; Zhang, A.; Du, J.; Wu, R.; Wang, J.; Yong, Y.-K. Novel Quartz Crystal Cuts for SAW Substrates with Cubic Frequency-Temperature Relations. In Proceedings of the 2018 `IEEE International Ultrasonics Symposium (IUS), Kobe, Japan, 22–25 October 2018; pp. 1–4. [Google Scholar]
- Feng, Y.; Lu, Z.; Lu, W. Study of the Doubly Clamped Beam Yarn Tension Sensor Based on the Surface Acoustic Wave. IEEE Trans. Ind. Electron. 2019, 66, 3256–3264. [Google Scholar] [CrossRef]
- Qureshi, S.; Hanif, M.; Jeoti, V.; Stojanović, G.M.; Khan, M.T. Review of fabrication of SAW sensors on flexible substrates: Challenges and future. Results Eng. 2024, 22, 102323. [Google Scholar] [CrossRef]
Disclaimer/Publisher’s Note: The statements, opinions and data contained in all publications are solely those of the individual author(s) and contributor(s) and not of MDPI and/or the editor(s). MDPI and/or the editor(s) disclaim responsibility for any injury to people or property resulting from any ideas, methods, instructions or products referred to in the content. |
© 2025 by the authors. Licensee MDPI, Basel, Switzerland. This article is an open access article distributed under the terms and conditions of the Creative Commons Attribution (CC BY) license (https://creativecommons.org/licenses/by/4.0/).