3.1. Single Track
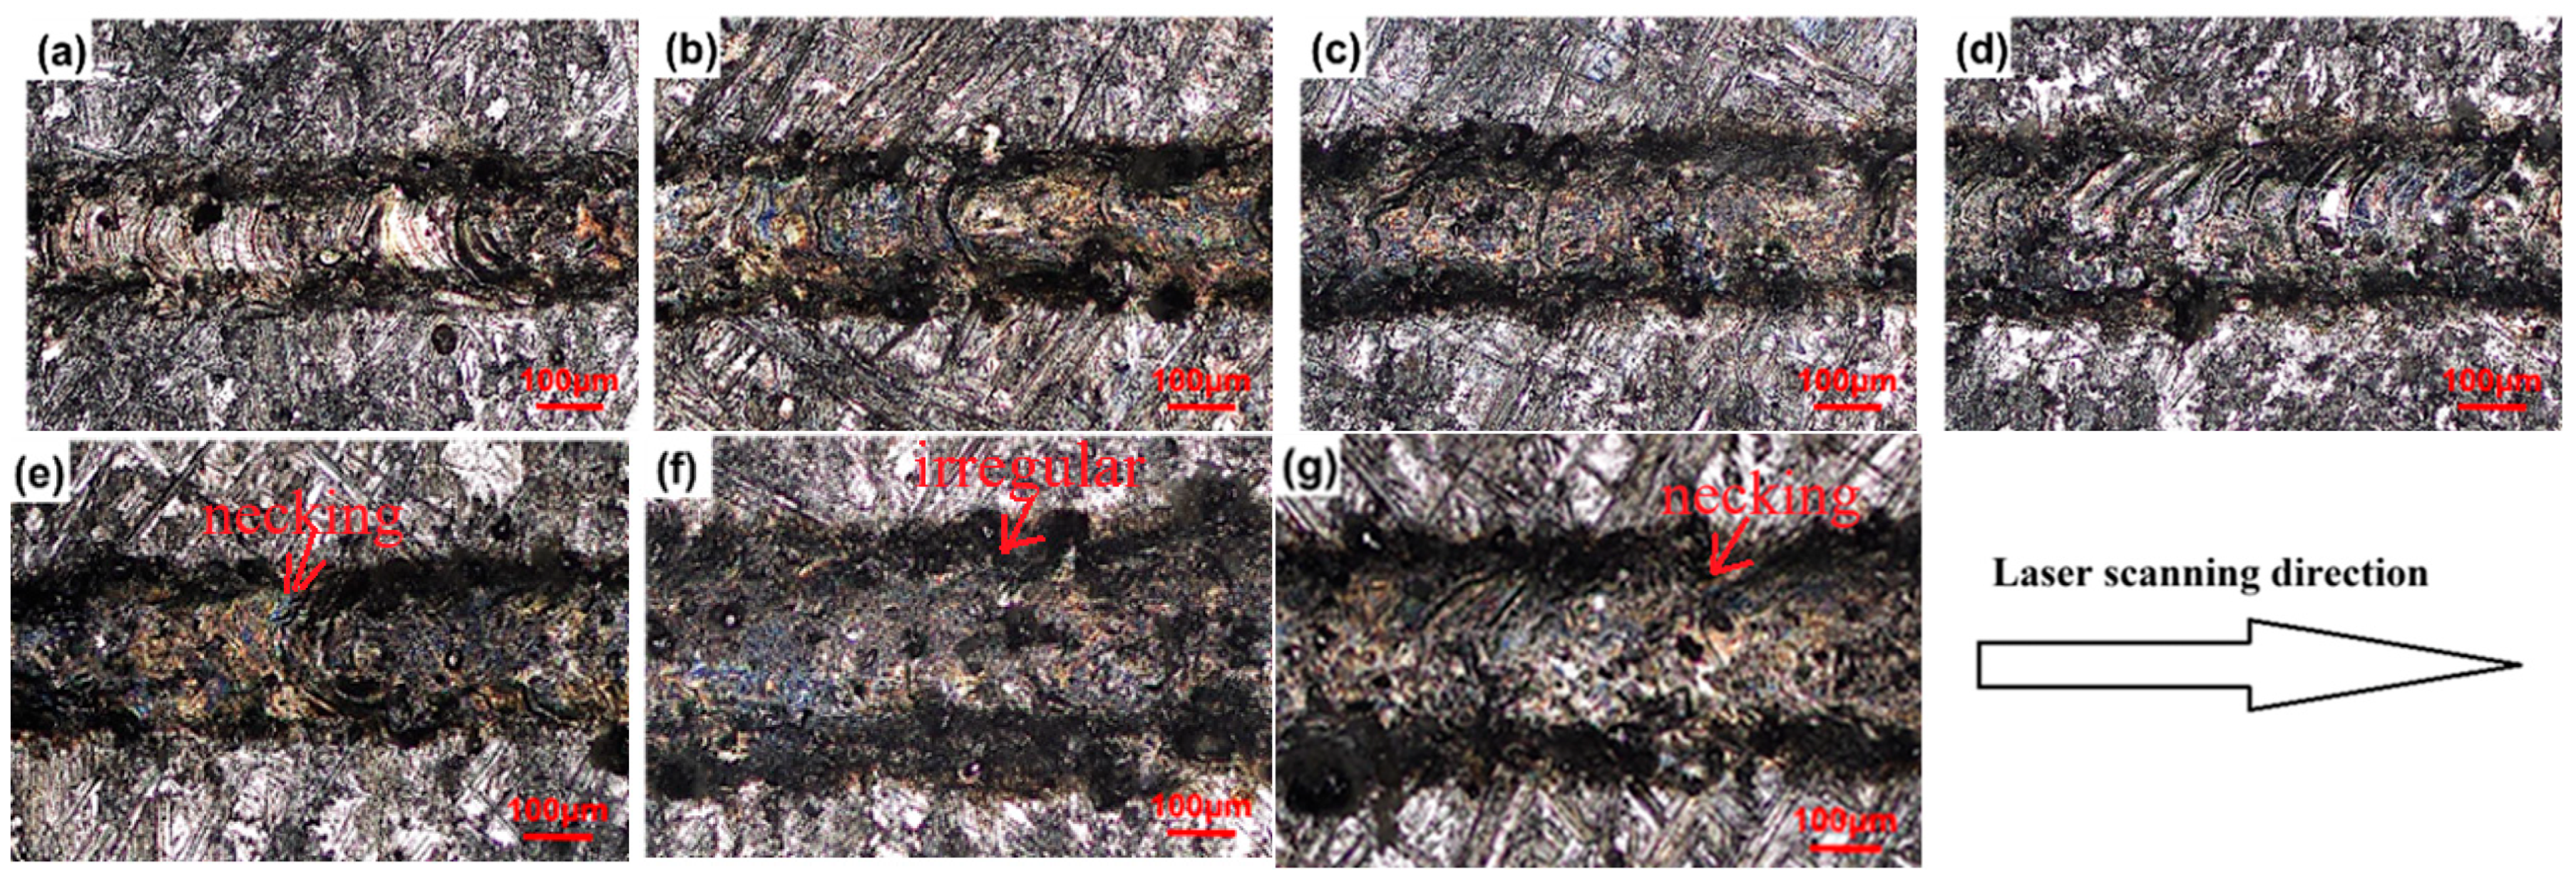
The surface morphologies of the LPBFed single tracks fabricated by different laser powers and a constant scanning speed of 300 mm/s are shown in
Figure 3. The surface morphologies of single tracks of LPBFed SiCp/AlSi10Mg composites fabricated at different scanning speeds and a constant laser power of 500 W are shown in
Figure 4. It can be seen from the figures that laser power and scanning speed both have significant influences on the surface morphology of the single track. When the laser power decreases or the scanning speed increases, the surface morphologies of the single tracks become distorted and irregular. Irregular and discontinuous tracks, e.g., neckings and droplets, appear when the scanning speed exceeds 1500 mm/s with laser power kept constant at 500 W, as shown in
Figure 4e,f and below 340 W when the scanning speed is 300 mm/s, as shown in
Figure 3a,b.
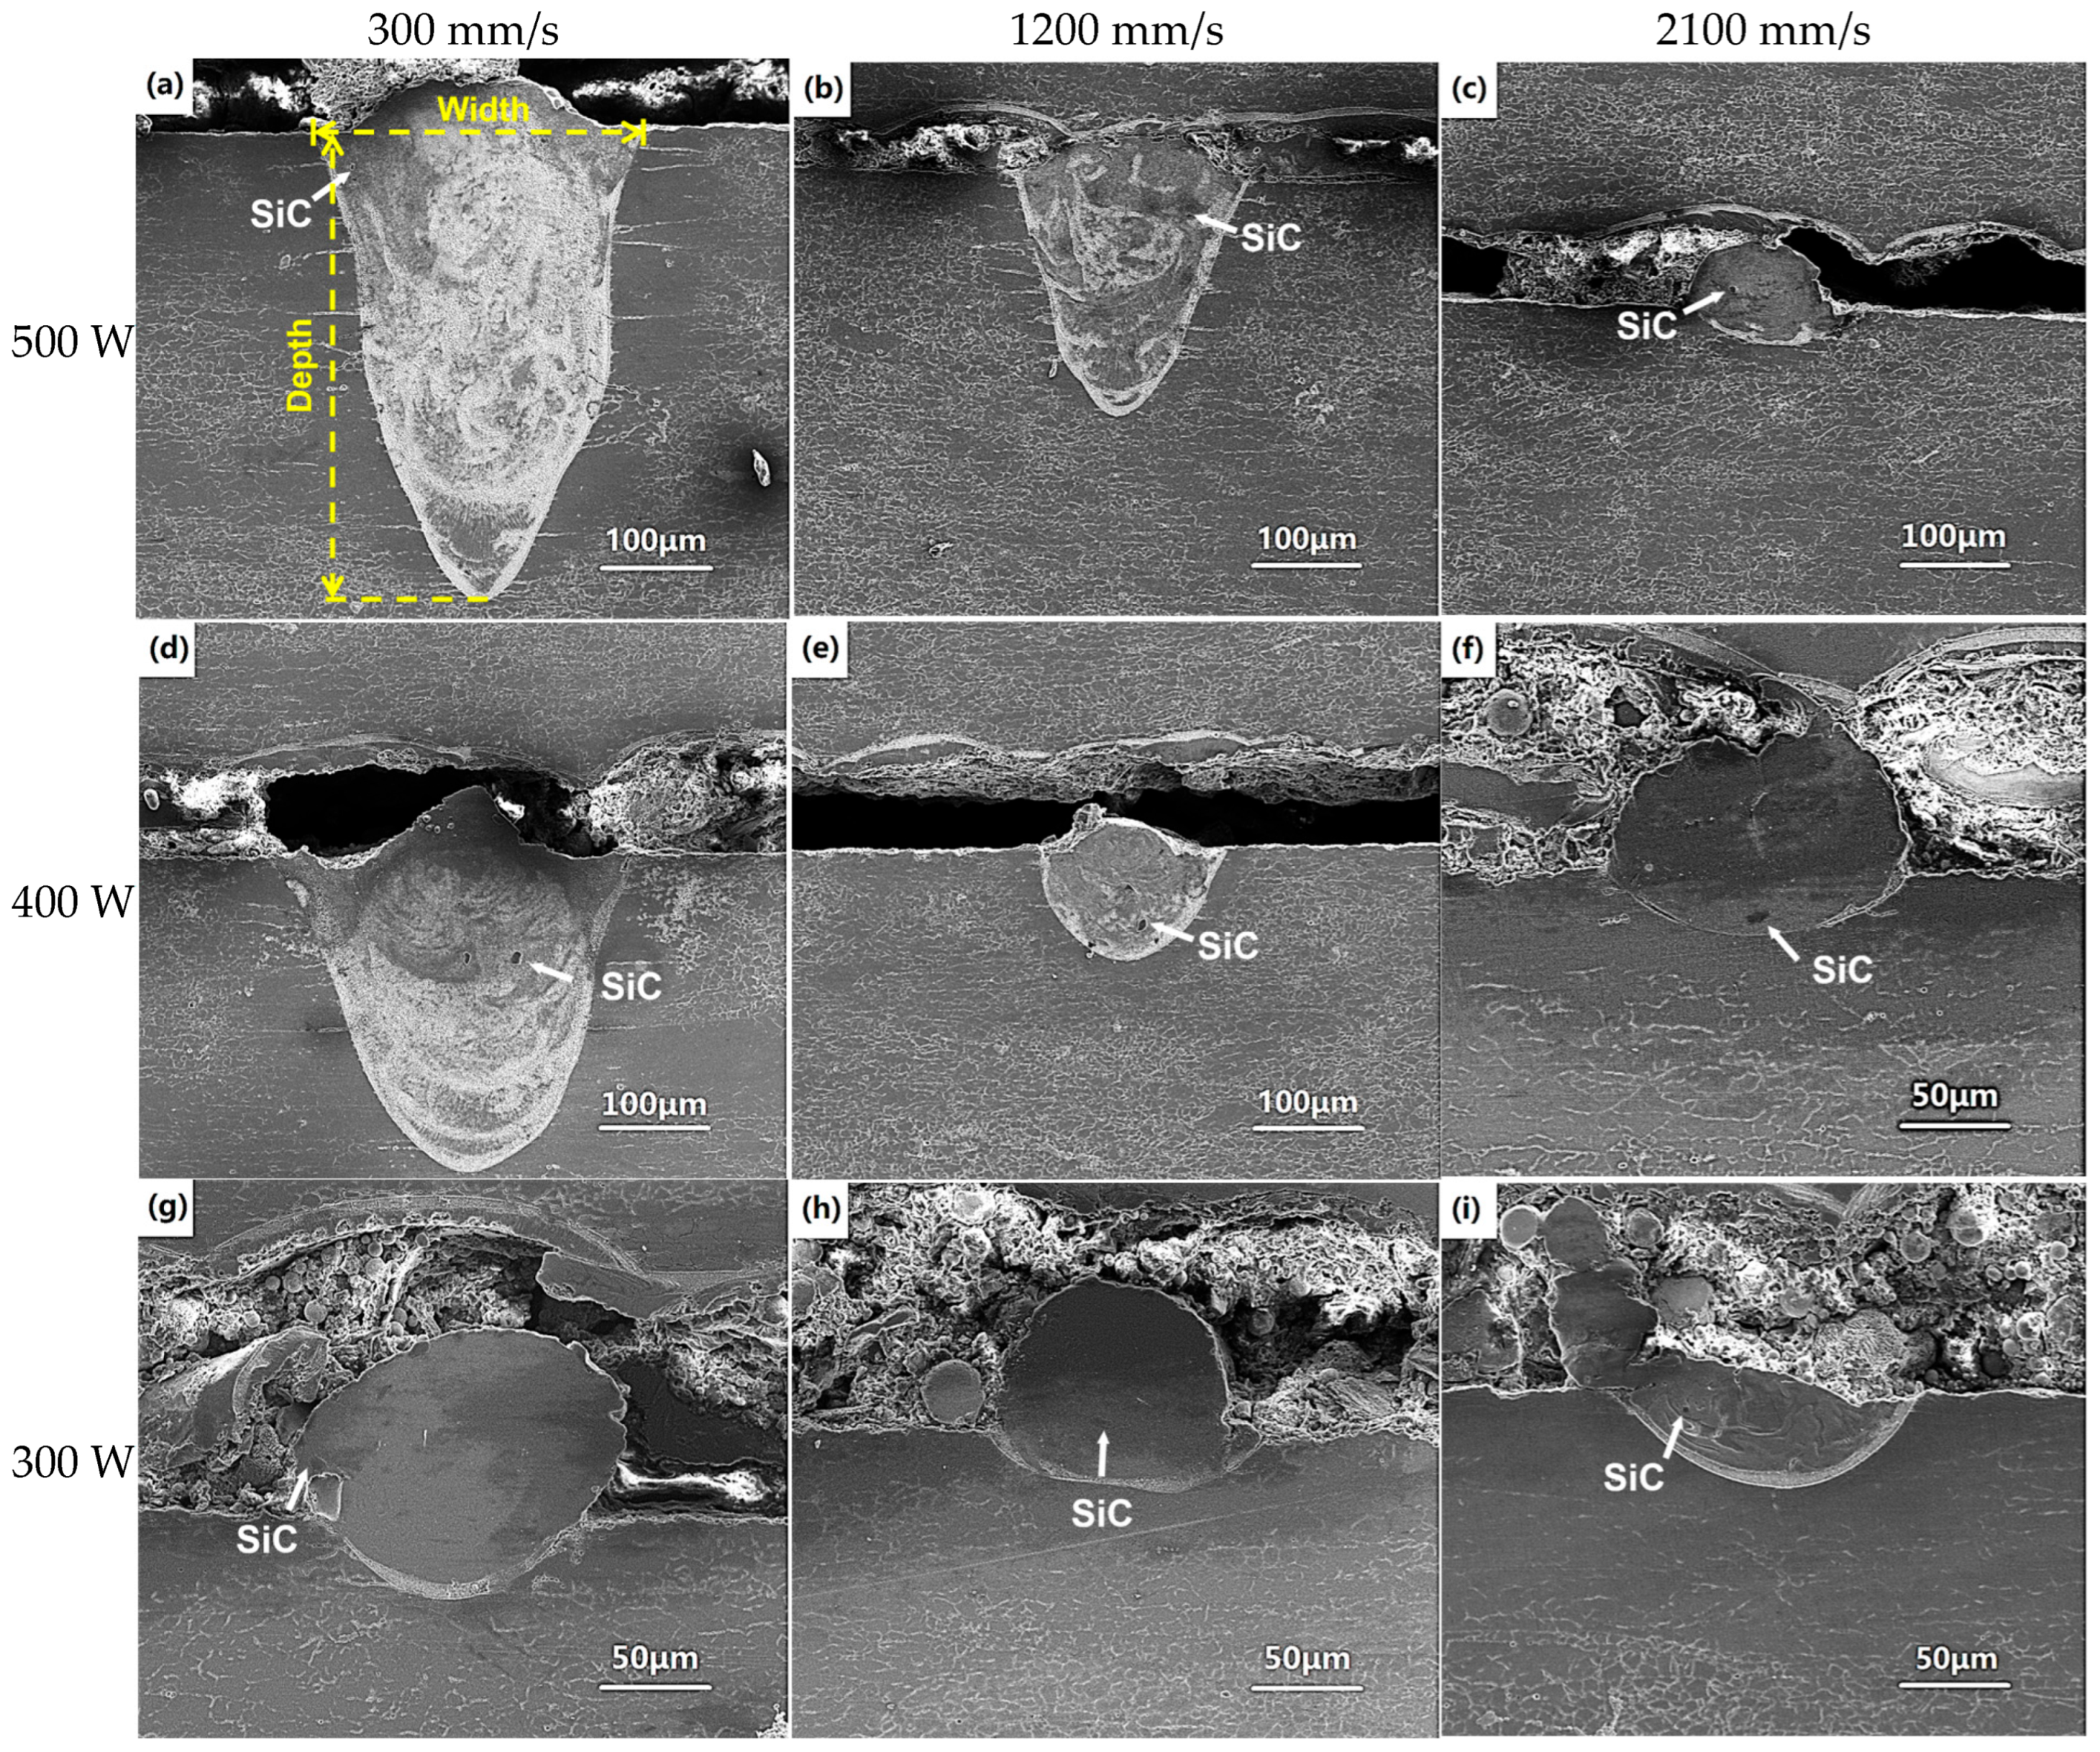
Figure 5 shows the typical molten pools of the single tracks when different laser powers and scanning speeds are utilized. The molten pool depths shown in
Figure 5a,b,d are very large when the scanning speed is below 1200 mm/s and the laser power is up to 400 W. These molten pool depths are much larger than the molten pool width; i.e., the molten pool is in keyhole mode [
17]. The mode of the molten pool is transformed from keyhole mode to conduction mode when the scanning speed exceeds 1200 mm/s. These molten pool depths are approximately equal to or smaller than the molten pool widths, indicating that no keyhole but only melting occurs under these processing parameters. The widths and depths of the single tracks decrease as the laser power decreases and scanning speed increases; i.e., the laser energy input reduces. From
Figure 5a–c, the molten pool depth decreases from 430 μm to 25 μm when the scanning speed increases from 300 mm/s to 2100 mm/s at a fixed laser power of 500 W. As the scanning speed fixes at 300 mm/s, the depth of the molten pool decreases from 430 μm to 40 μm, as the laser power decreases from 500 W to 300 W, as shown in
Figure 5a,d,g. From
Figure 5, it can also be found that the SiC content is very low; this is because only 15 wt.% SiC powder is blended in the matrix and dilution occurs during the LPBF process.
As the laser energy input decreases, the molten pool shape changes from a V-shape to a U-shape; i.e., keyhole mode transfers to conduction mode. During the LPBF process, the molten pool center has the maximum temperature because of the Gauss distribution of the laser energy. Furthermore, the molten pool is very small. The molten pool temperature gradient is very large, inducing the high surface tension gradient, resultant shear stress and convective movement in the molten pool, i.e., the Marangoni effect [
18]. The Marangoni effect induces a Marangoni flow, inducing the eddy currents in the molten pool, which drives the movement of SiC particles and leads to their uniform distribution in the matrix, especially under the high laser energy input.
The relationships between the width and depth of the single track and the processing parameters are summarized in
Figure 6. As seen in
Figure 6, the width and depth of the single track all decrease as the scanning speed increases at all laser powers. The width and depth of the single track are positively correlated with the molten pool volume and spreading. When the material is determined, the molten pool volume and spreading are determined by the laser energy input. If the laser energy input is large, the molten pool volume is large, the molten pool temperature is high and the molten pool lifetime is long. High temperatures lead to low viscosity of the liquid and large Marangoni flow, resulting in the molten pool spreading rapidly and sufficiently. Furthermore, the molten pool spread is also determined by the molten pool lifetime. The longer the molten pool lifetime is, the more sufficient the spreading is. Thus, a wide, deep, continuous and regular track is formed when the laser energy input is large enough [
19,
20]. Conversely, small laser energy input leads a small molten pool; as seen in
Figure 3,
Figure 4,
Figure 5 and
Figure 6, the temperature and lifetime of the molten pool are all low, the molten pool spreading is insufficient, resulting in the liquid phase becoming unstable and tending to break up or even forming balling. The single track splits into fragments to attain the equilibrium shape. Irregularities and discontinuities form. The morphology of the single track is deteriorated. Finally, an unstable and wrinkled surface consisting of a discontinuous length and apparent balling as well as necking is obtained when the scanning speed is 300 mm/s and the laser power is below 340 W, or when the scanning speed exceeds 1500 mm/s while laser power is kept constant at 500 W, as seen in
Figure 3a,b and
Figure 4e,f.
Hence, the laser power and scanning speed, e.g., the laser energy input, play an important role in determining the geometric topography and dimensions of the single tracks together.
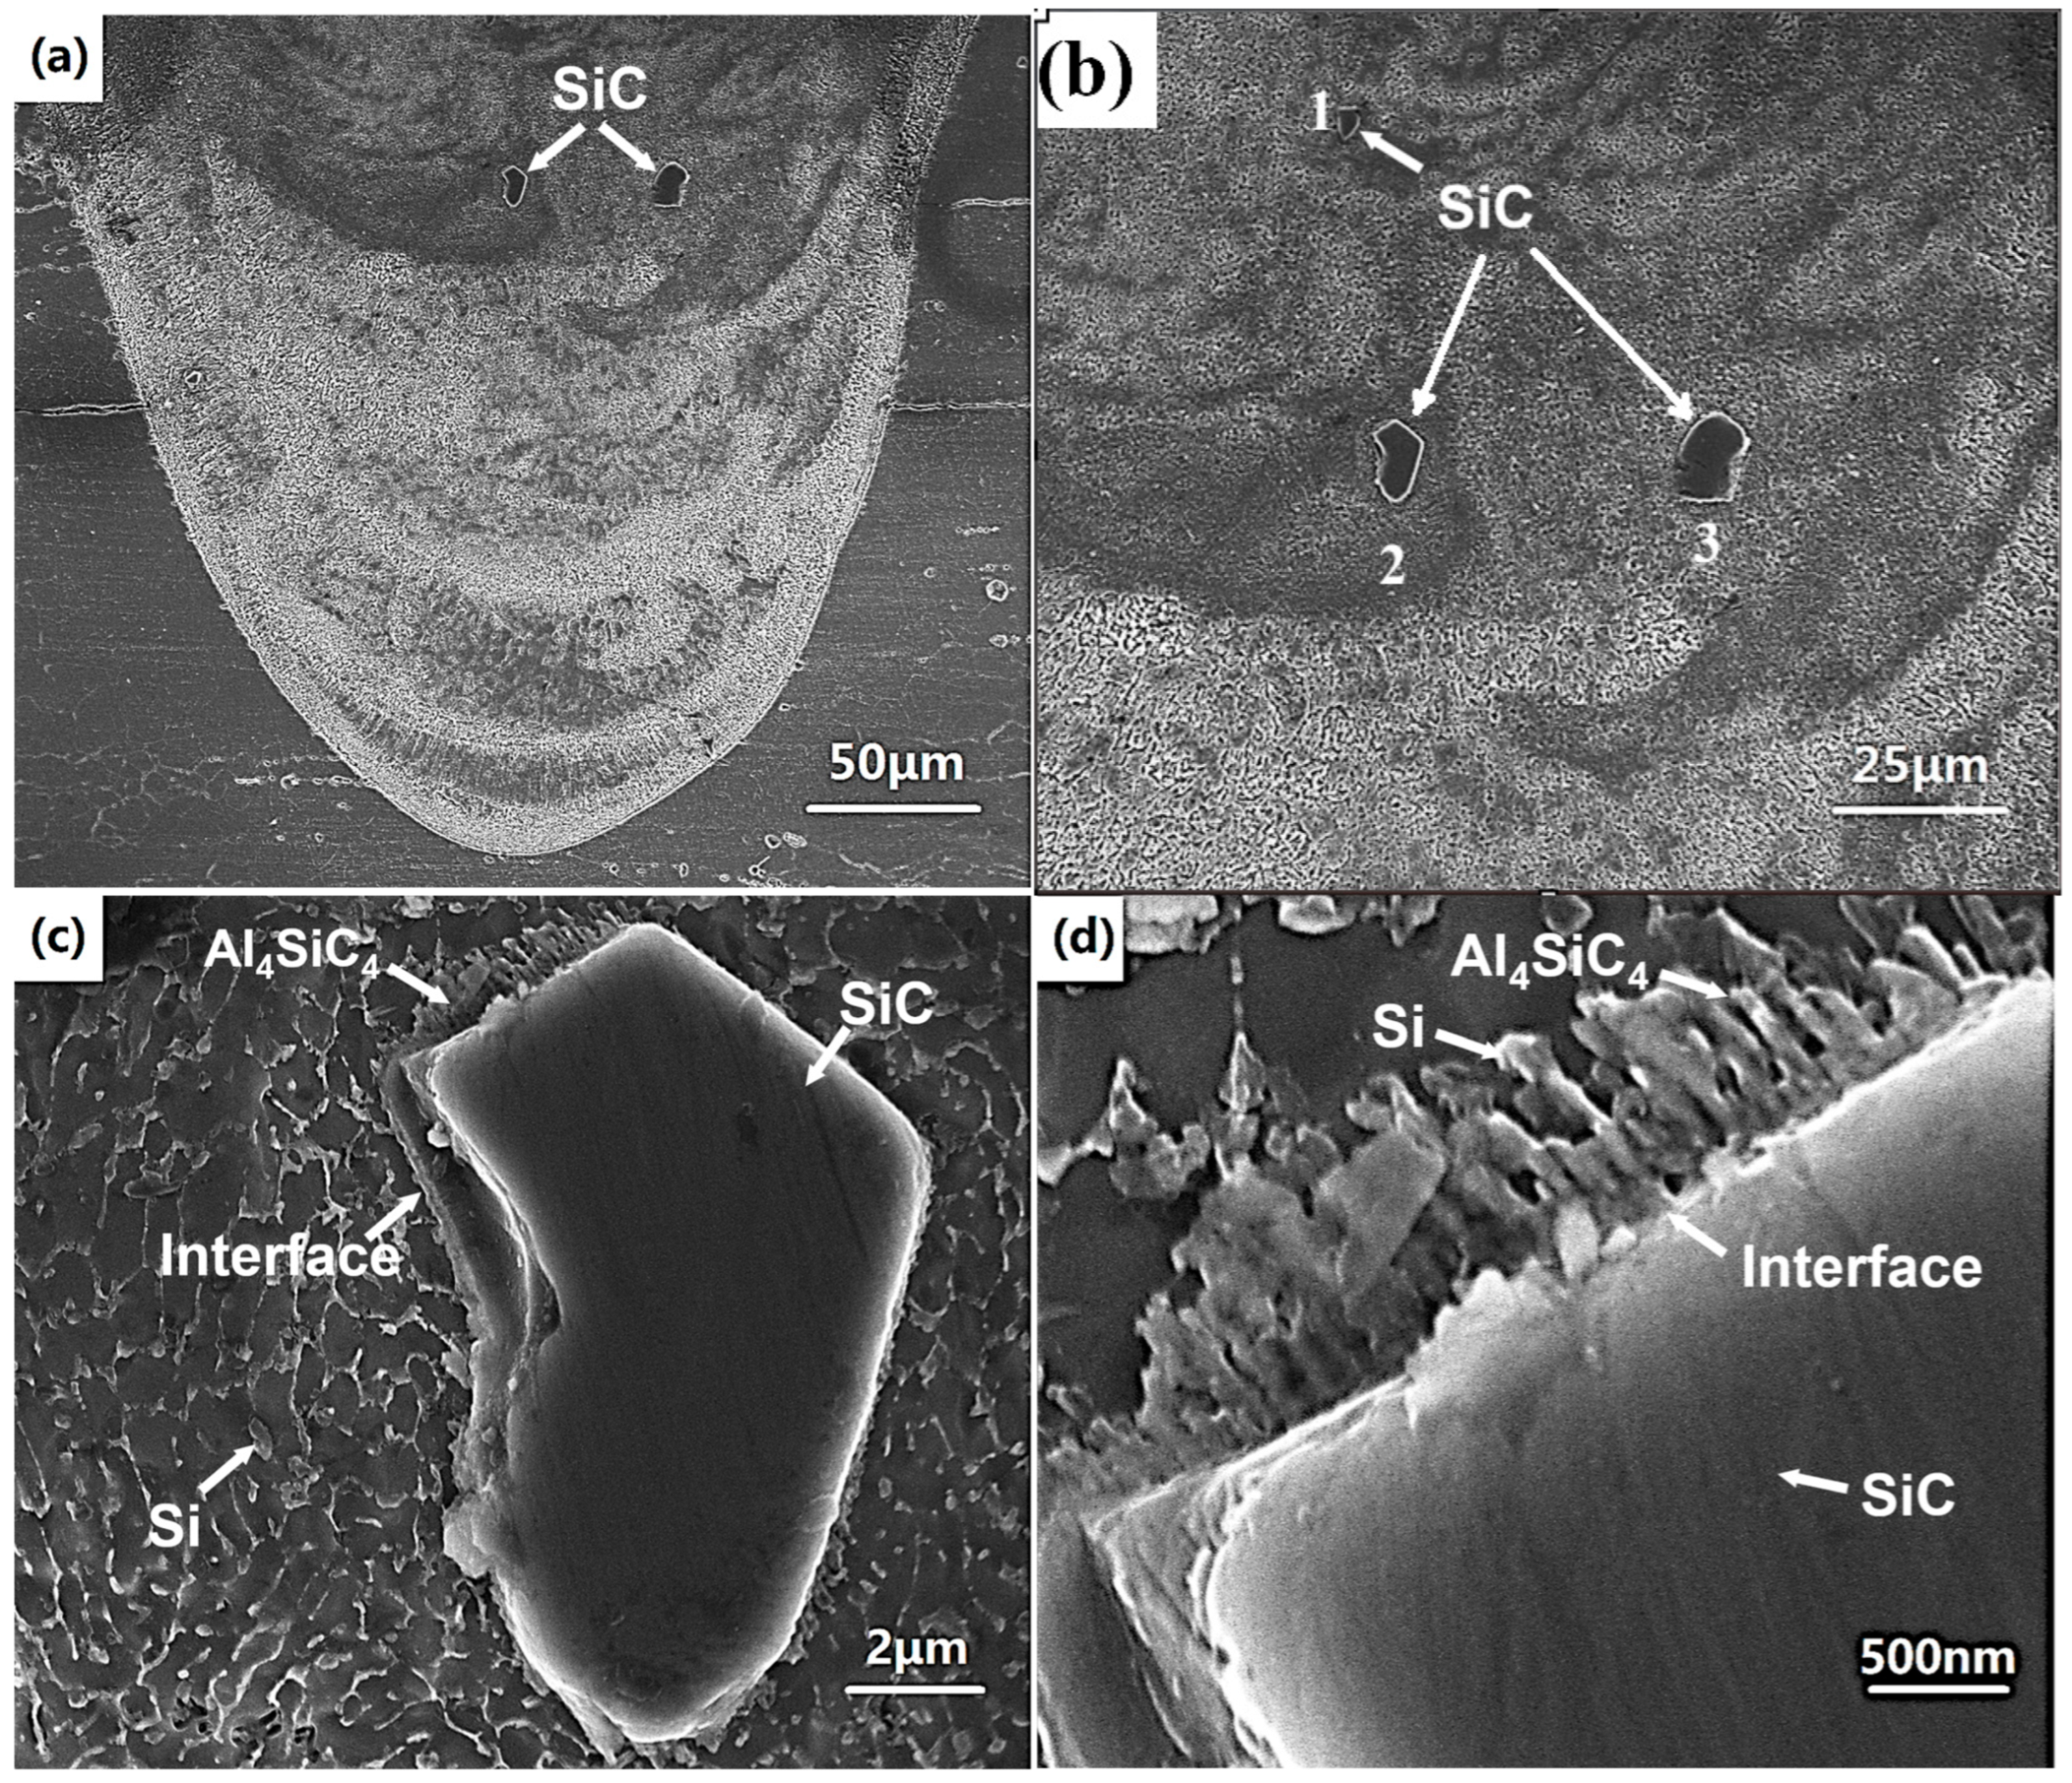
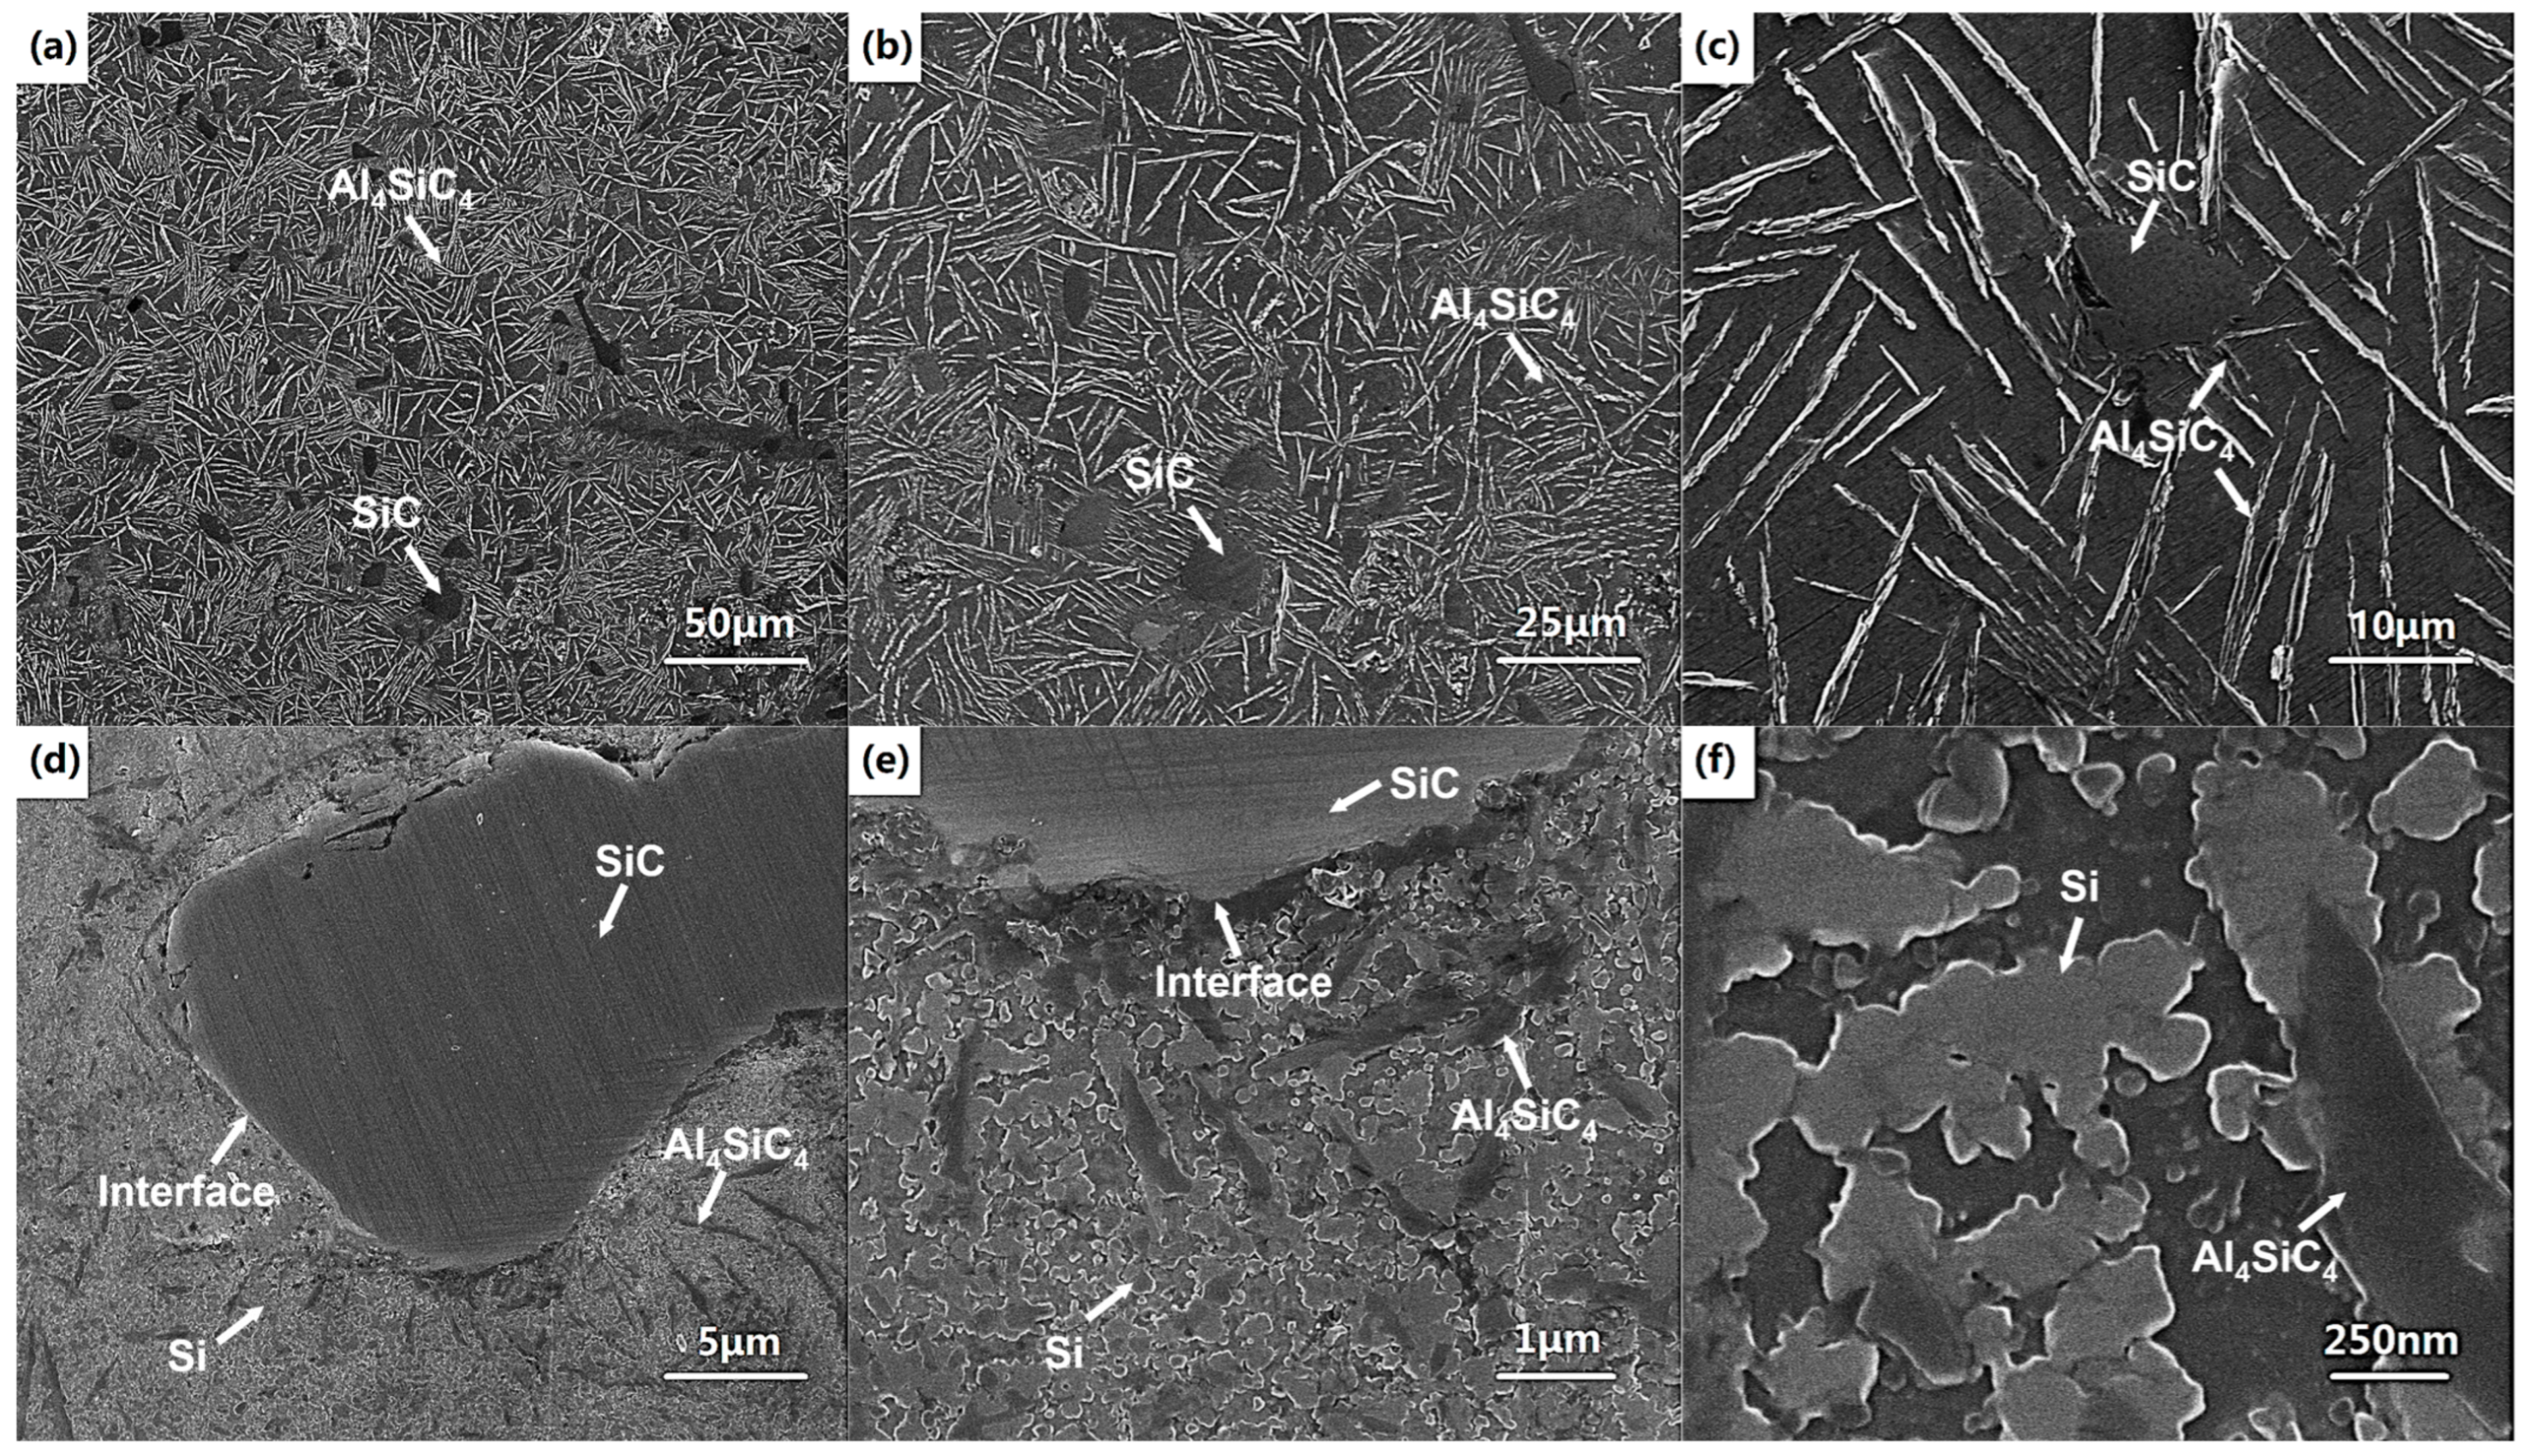
Figure 7 shows the microstructure of the molten pool of single track formed at a laser power of 400 W and scanning speed of 300 mm/s. From
Figure 7a–c, it can be found that SiC particles embed in the Al matrix and the matrix consists of fine equiaxed cell structures. Furthermore, Al
4SiC
4 and Si faceted platelets can be found near the interface of SiC particle and Al matrix. This indicates that an interfacial chemical reaction between SiC particle and aluminum liquid occurs during the process. When the temperature exceeds 1670 K, the chemical reaction (4) occurs:
Al
4SiC
4 initially forms as faceted platelet [
12]. Furthermore, some Si slices or particles form by reaction (4) near the interface, as seen in
Figure 7d. Meanwhile, similar to the LPBFed AlSi10Mg, the cellular microstructure can be found in the molten pool, and eutectic Si particles are located on the boundaries of the α-Al in the form of continuous segregations because of the extreme cooling rate, as seen in
Figure 7c. No pores or cracks can be found near the interface, indicating that well metallurgical bonding at the interface is achieved, as seen in
Figure 7c,d. At the bottom of the molten pool, unsteady flow can be observed, which is caused by the Marangoni flow, as shown in
Figure 7a.
3.2. Densification
Figure 8 depicts the curves of the densities of the LPBFed composites versus scanning speed under different laser powers. As the scanning speed increases, the density first increases and then decreases when the laser power is fixed at 500 W or 400 W; the density monodirectionally decreases when the laser power is fixed at 300 W. The highest density (
) is achieved when the laser power is 500 W and the scanning speed is 1200 mm/s, corresponding to 98.9% relative density
, which is higher than that in our previous work using 300 mesh SiC particles [
13]. When the laser power decreases, the density of the LPBFed composites decreases with fixed scanning speed.
Figure 9 displays the OM micrographs of the cross-section of the LPBFed composites samples fabricated by different laser powers and scanning speeds. The distribution of SiC particles and pores, as well as the pore morphologies of the LPBFed composites samples can be seen from
Figure 9. It can be seen that SiC particles distribute uniformly and different types of pores exist in the AlSi10Mg matrix.
The micrographs of LPBFed composites with a fixed laser power of 500 W and different scanning speeds of 300 mm/s, 1200 mm/s and 2100 mm/s are shown in
Figure 9a–c, respectively. When the scanning speed is large, e.g., 2100 mm/s, a lot of large pores with irregular shapes and about an average size of 100 μm can be found (
Figure 9c). Furthermore, unmelted AlSi10Mg powders can be observed in the matrix. Pores tend to aggregate and interconnect while unmelted powders cluster obviously, leading to the degradation of densification significantly. From
Figure 4g and
Figure 5c, the irregularity and discontinuity scanned track and shallow penetration depth imply that the AlSi10Mg powders cannot be completely melted during the LPBF process, inducing a number of the lack-of-fusion pores [
21], which remarkably reduce the density of the LPBFed composites sample. This kind of lack-of-fusion pores are generally of irregular shape and large sizes. When the scanning speed decreases to 1200 mm/s, as shown in
Figure 9b, the large irregular pores disappear but a few small pores still can be found. These processing parameters are optimal for the LPBFed composites and the highest density is achieved. However, when the scanning speed decreases to even 300 mm/s, irregular pores with an average size of about 30 μm and some spherical microvoids will be seen in the matrix, as seen in
Figure 9a. Furthermore, the number of SiC particles is significantly reduced. This is because some SiC particles decompose due to the high laser energy input. When SiC particles decompose, the liquid is pushed away and the decomposition products impede the molten pool flow, which induces pores. These pores are mostly associated with SiC particles and are located at the interface of SiC particles and matrix. This kind of pores are generally in irregular shape [
22]. Furthermore, the irregular pores may also be caused by the keyhole collapses during LPBF processing with high laser energy input. The small spherical microvoids may be caused by the shielding gas entrapped in the molten pool because of the extremely high laser energy input and rapid solidification of the molten pool.
Figure 9b,d,e shows micrographs of LPBFed composites samples using different laser powers and 1200 mm/s scanning speed. A small number of pores exist at a high laser power of 500 W (
Figure 9b), indicating a relatively high density. If the laser power decreases, e.g., 400 W, a few observable irregular pores and microvoids will be present in the matrix, as shown in
Figure 9d. Many irregular pores and some partially melted powders can be found when the laser power is 300 W (
Figure 9e); i.e., the density decreases. From
Figure 3a and
Figure 5h, the scanned track appears unstable and wrinkled, and the molten pool is very small, which results in non-uniform layer thickness and lack-of-fusion defects. Hence, the pores are large in size, irregular in shape, and are randomly distributed, decreasing the density of the LPBFed composites.
The conclusion can be drawn that the relative density of LPBFed composites significantly depends on the laser energy input. The Marangoni driving force is a primary driving force for the densification of LPBFed composites samples, which is caused by the surface tension gradient. Since the content of oxygen is extremely low during the LPBF process and the temperature of the molten pool center is the highest, the surface tension of the liquid metal located in the molten pool center is the lowest, while the surface tension of the liquid metal located at the molten pool boundary is the highest. This induces the liquid metal to flow from center to boundary, resulting in molten pool spreading and densification occurs. The Marangoni coefficient
Ma can represent the magnitude of the Marangoni force, which is [
20]:
where
is the differential of surface tension with respect to temperature.
is the molten pool width.
is the difference between the temperature of the molten pool center and the molten pool boundary.
is the thermal diffusivity, and
is the dynamic viscosity of the molten pool, which can be calculated by Equation (6) [
23]:
where
is the atomic mass.
is the Boltzmann constant, and
is the surface tension of the molten pool, which is associated with the temperature.
Furthermore, the molten pool lifetime
is also important for the densification of LPBF. Since
determines the molten pool spreading time, which can be calculated according to Equation (7).
where
is scanning speed.
With the laser power increasing or the scanning speed decreasing, e.g., the laser energy input increasing, the molten pool temperature and lifetime increase. As the molten pool temperature increases, the Marangoni coefficient (
Ma) increases, enhancing the movement and flowability of the liquid–solid system due to the Marangoni effect [
22]. This facilitates not only the formation of stable and continuous single tracks but also promotes the flow of molten metal into pores [
24], and the density of LPBFed composites increases. Furthermore, the stable and continuous track also brings a stable process, thereby improving the density of LPBFed composites. The molten pool lifetime increases, leading to sufficient spreading of the molten pool; therefore, a dense LPBFed sample is achieved. Nevertheless, the viscosity of the LPBFed composites increases greatly with the addition of SiC particles. The increased viscosity of the liquid melt results in low fluidity according to the kinetics theory. Therefore, the fully densified samples have not been obtained due to the insufficient fluidity of liquid melt. As a consequence, the optimal processing parameters for achieving the highest density LPBFed composites sample are a laser power of 500 W and a scanning speed of 1200 mm/s, with a scanning spacing of 0.12 mm and a layer thickness of 0.04 mm.
3.4. Mechanical Properties
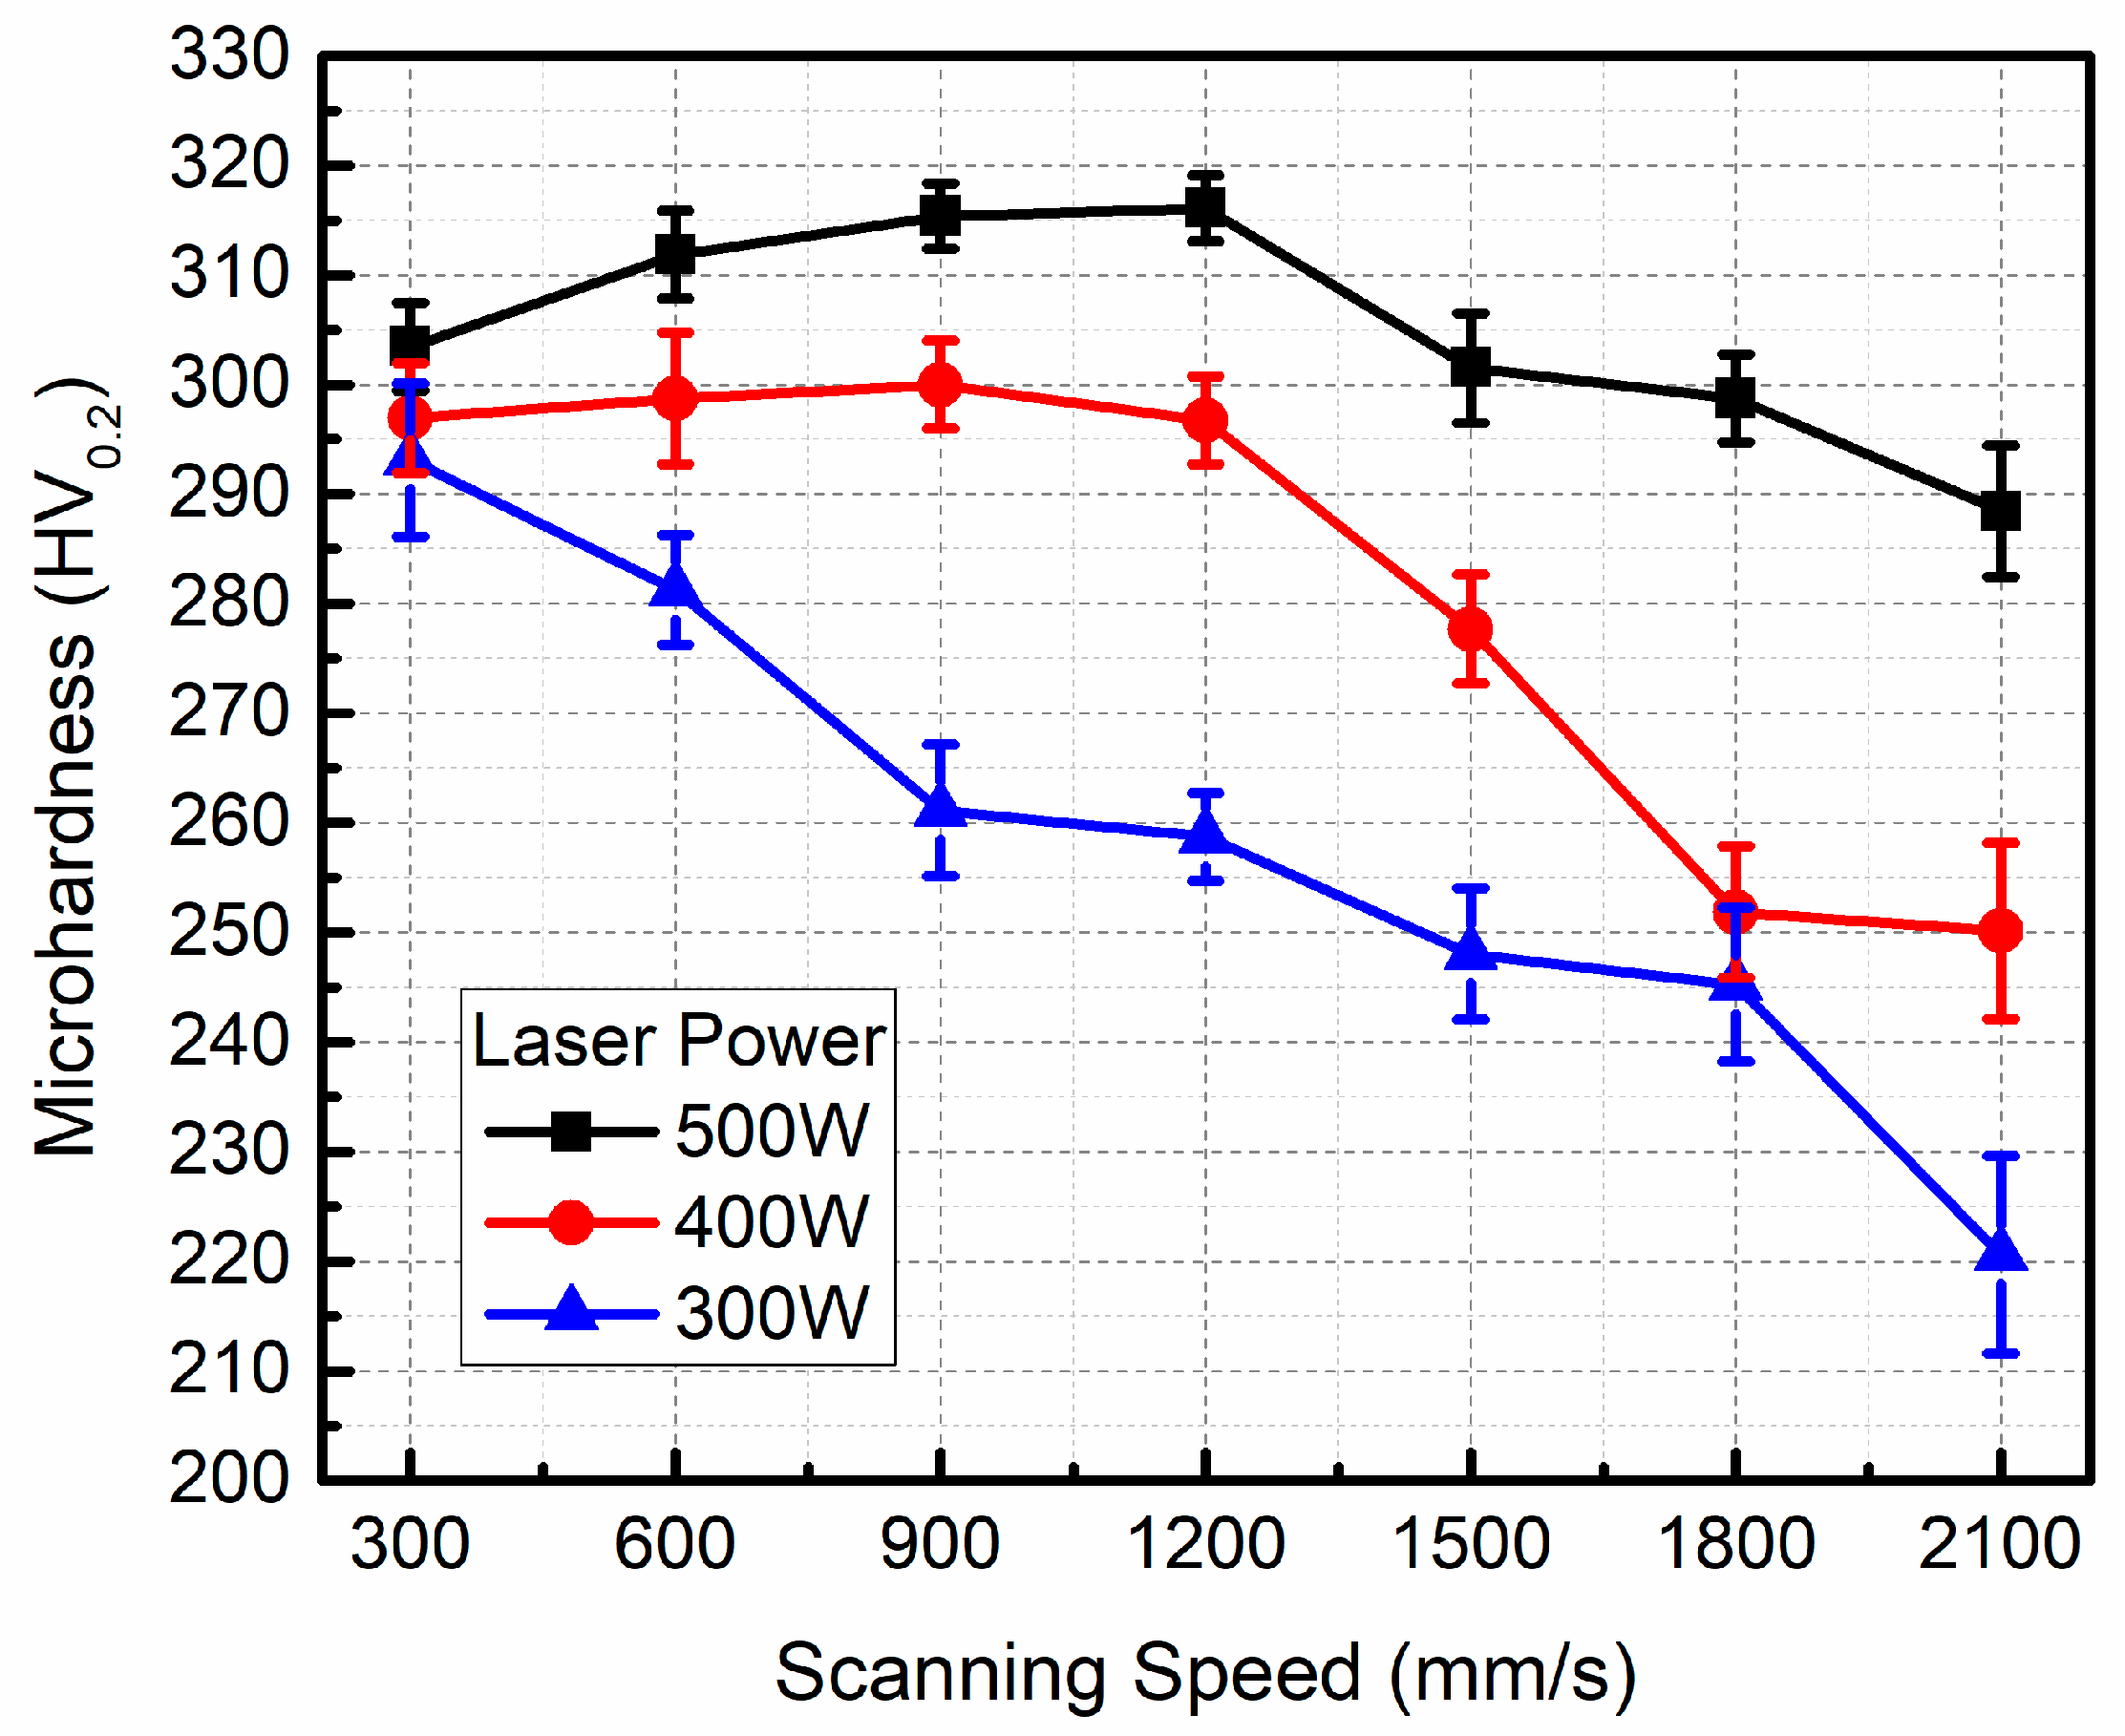
The curves of microhardness versus the scanning speed under different laser powers are shown in
Figure 12. The microhardness first increases and then decreases as the scanning speed increases at a constant laser power of 500 W or 400 W. The microhardness decreases with the increase in the scanning speed at a constant laser power of 300 W. The maximum microhardness can reach up to 316.1 HV
0.2 when the optimal processing parameters are used, i.e., 500 W laser power and 1200 mm/s scanning speed. As the laser power decreases from 500 to 300 W, the microhardness decreases obviously. By comparing
Figure 8 with
Figure 12, it is obvious that the correlation between the microhardness and density is very close: the higher the density, the higher the microhardness. This is because high density means low porosity, which contributes to the microhardness. As shown in
Figure 9, when the laser energy input is small, the defects in LPBFed composites are mainly large irregular lack-of-fusion pores, leading to a rapid decrease in densification and microhardness. When the laser energy input is too high, there are some small irregular pores and spherical pores in the LPBFed composites sample, and densification and microhardness all decrease lightly. Therefore, lack-of-fusion pores have a significant effect on the microhardness.
Compared with the maximum microhardness (147HV
0.2) of LPBFed AlSi10Mg [
25], the microhardness of LPBFed composites is much higher, indicating that adding SiC particles can dramatically improve the microhardness. This is because the strengthening effect of SiC particles on AlSi10Mg.
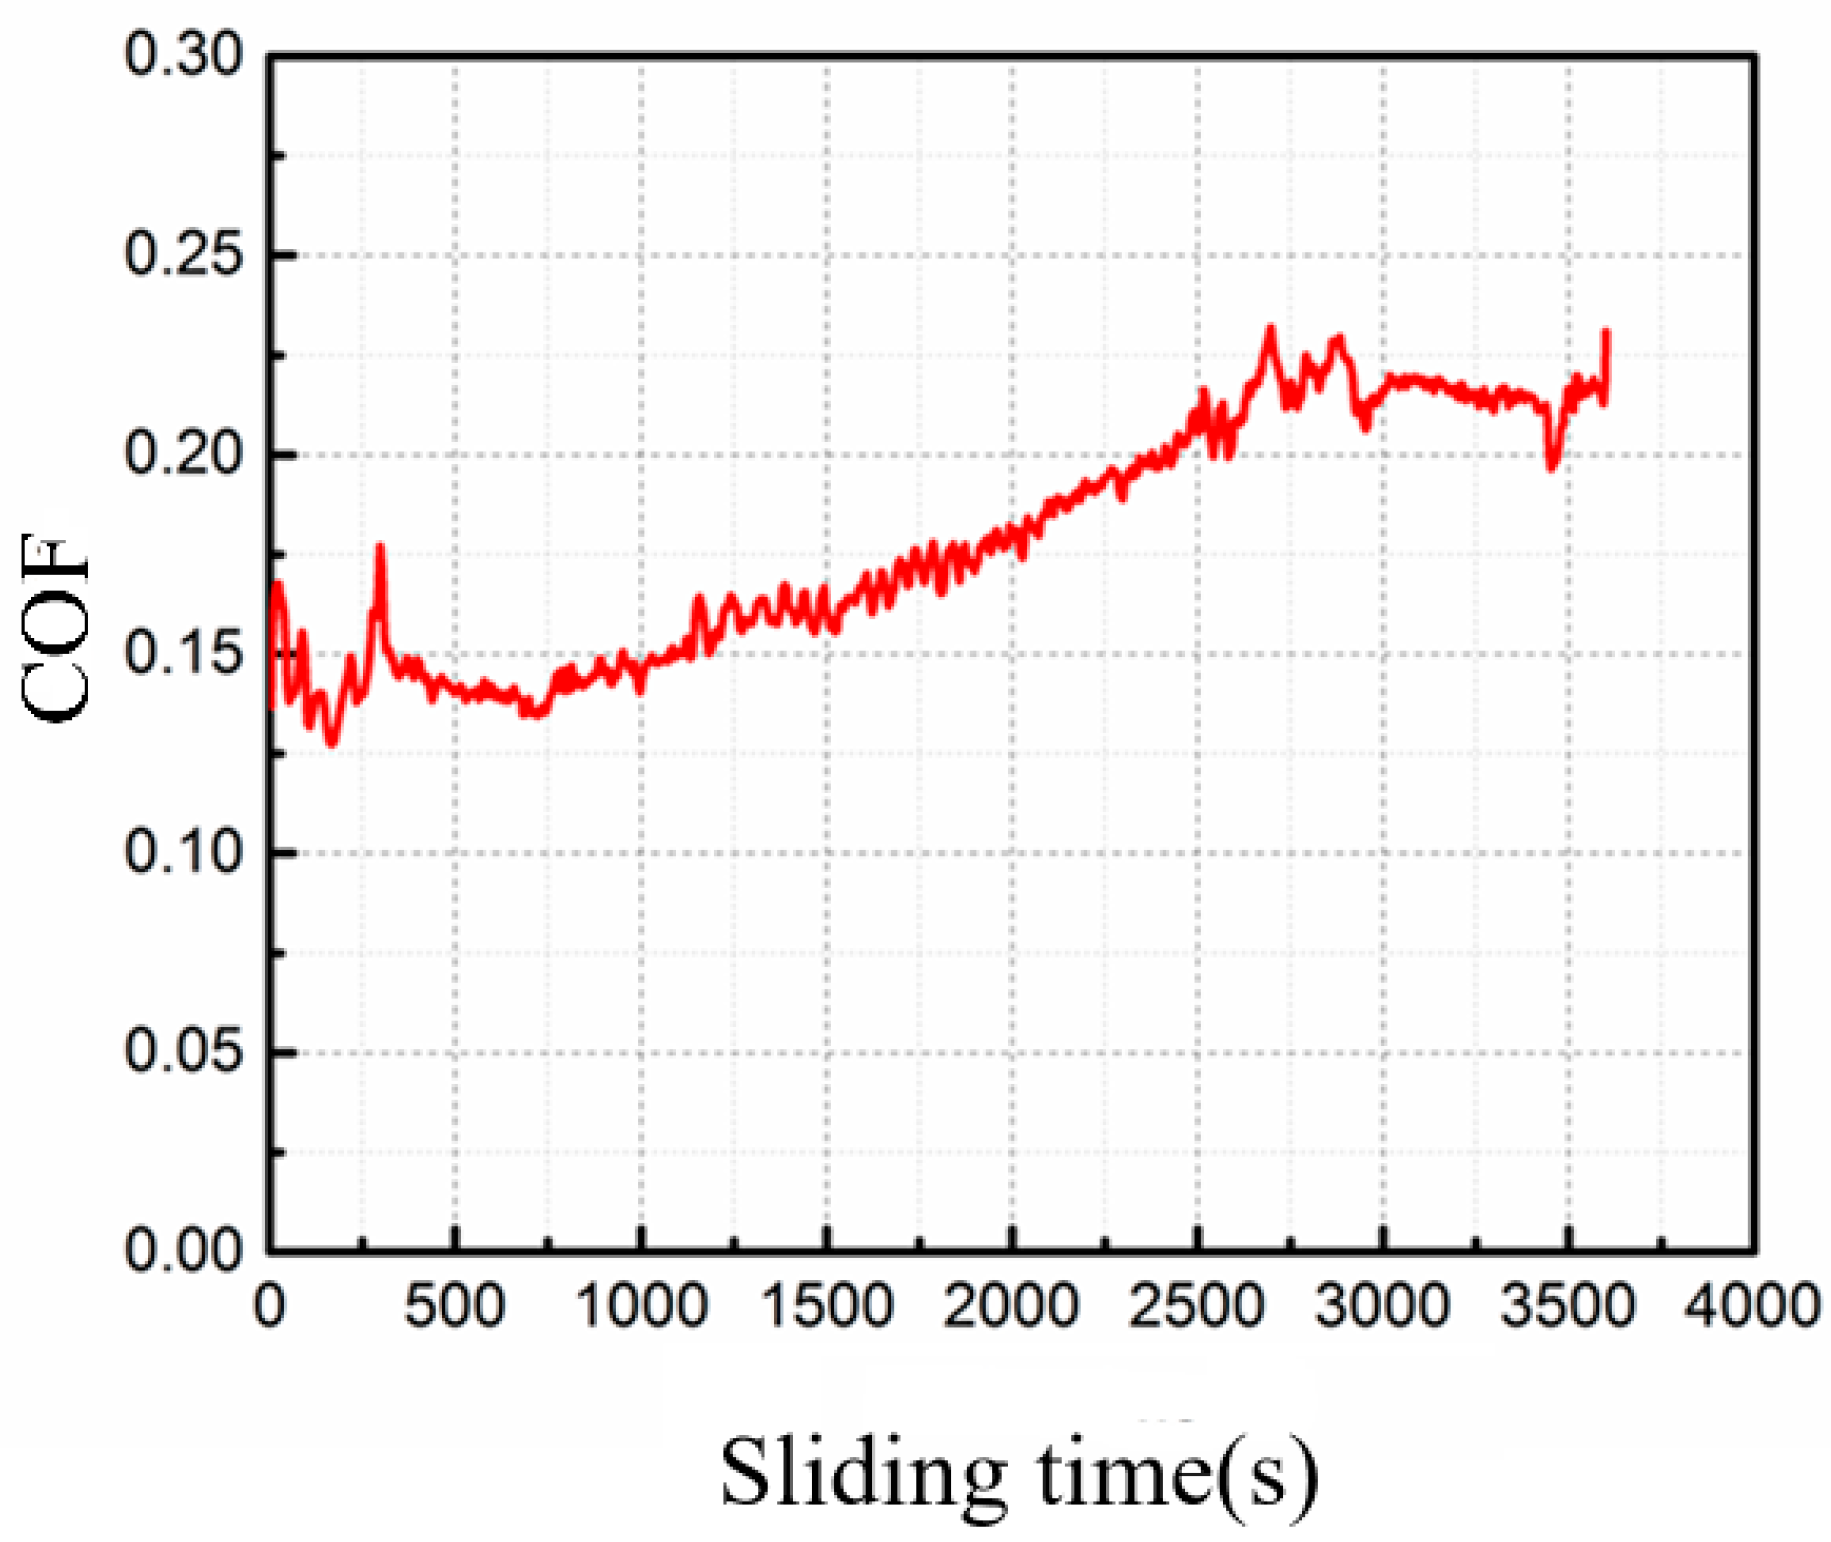
Figure 13 shows the coefficient of friction (COF) curve of the LPBFed composites sample fabricated by optimal processing parameters with increasing sliding time. It was found that the COF tends to rise slightly as the sliding time increases. The mean COF is 0.178. As the sliding time increases, the COF fluctuates. In the dry sliding process, a transition from mild wear to severe wear occurs. As the sliding time increases, the temperature of the sliding surface rises, leading to the matrix softening and heavy deformation. Meanwhile, the increase in COF is due to the damage of the surface layer. These induce the high COF and the wear loss of the composites. The resultant wear rate of the sample at the end of the test is 2.02 × 10
−4 mm
3/(N·m).
Based on Archard’s wear theory [
26], the wear loss of the sample is closely related to the microhardness. Improving microhardness can enhance the wear resistance. As shown in
Figure 12, the microhardness of the sample increases significantly when SiC particles are added to AlSi10Mg matrix. Therefore, wear and seizure resistance are improved. Generally, the reinforcement particles can protect the soft matrix against the deformation during sliding friction by the mechanism of resisting press-in and cutting of the sliding ceramic ball on the worn surface of the samples. Moreover, the SiC particles also enhance the thermal stability and load-bearing capacity, further improving the protection effect.
The worn surfaces of the LPBFed composites sample are observed by SEM. As seen in
Figure 14, the surface is characterized by scratch formation, exfoliation, and damaged regions along the sliding direction. It also shows the Al
4SiC
4 and the SiC particle potholes in
Figure 14e,f; however, the grooves are unclear. Moreover, there is some wear debris with a granular shape on the worn surface.
Since the LPBFed composites sample has high strength, during the friction process, a strain-hardened tribolayer is formed on the worn surface as the severe plastic deformation occurs [
27]. The strain-hardened tribolayer prevents the composites matrix from directly contacting the sliding ceramic ball in the initial period of friction. At this load condition, the grooves formed on the worn surface are quite shallow and narrow, indicating that adhesive wear cannot occur and the transition of the mild wear to severe wear delays. As the reciprocating motion develops, the strain-hardened tribolayer breaks up and gradually flakes off. Finally, the exfoliation forms along the friction tracks, as shown in
Figure 14a,d. The SiC particles can impede the propagation of the matrix cracks, which lead to the delamination of tribolayer on the worn surface. As the cracks and exfoliation grow, delamination is removed away from the surface.
Figure 14b,c clearly show the delamination wear mechanism. Moreover, some potholes can be observed due to the SiC particles pulling out, as in
Figure 14e,f. The SiC particles are dislodged from the worn surface due to the propagation of the fatigue cracks. Similar observations of fatigue cracks were also reported by Tang et al. [
28].
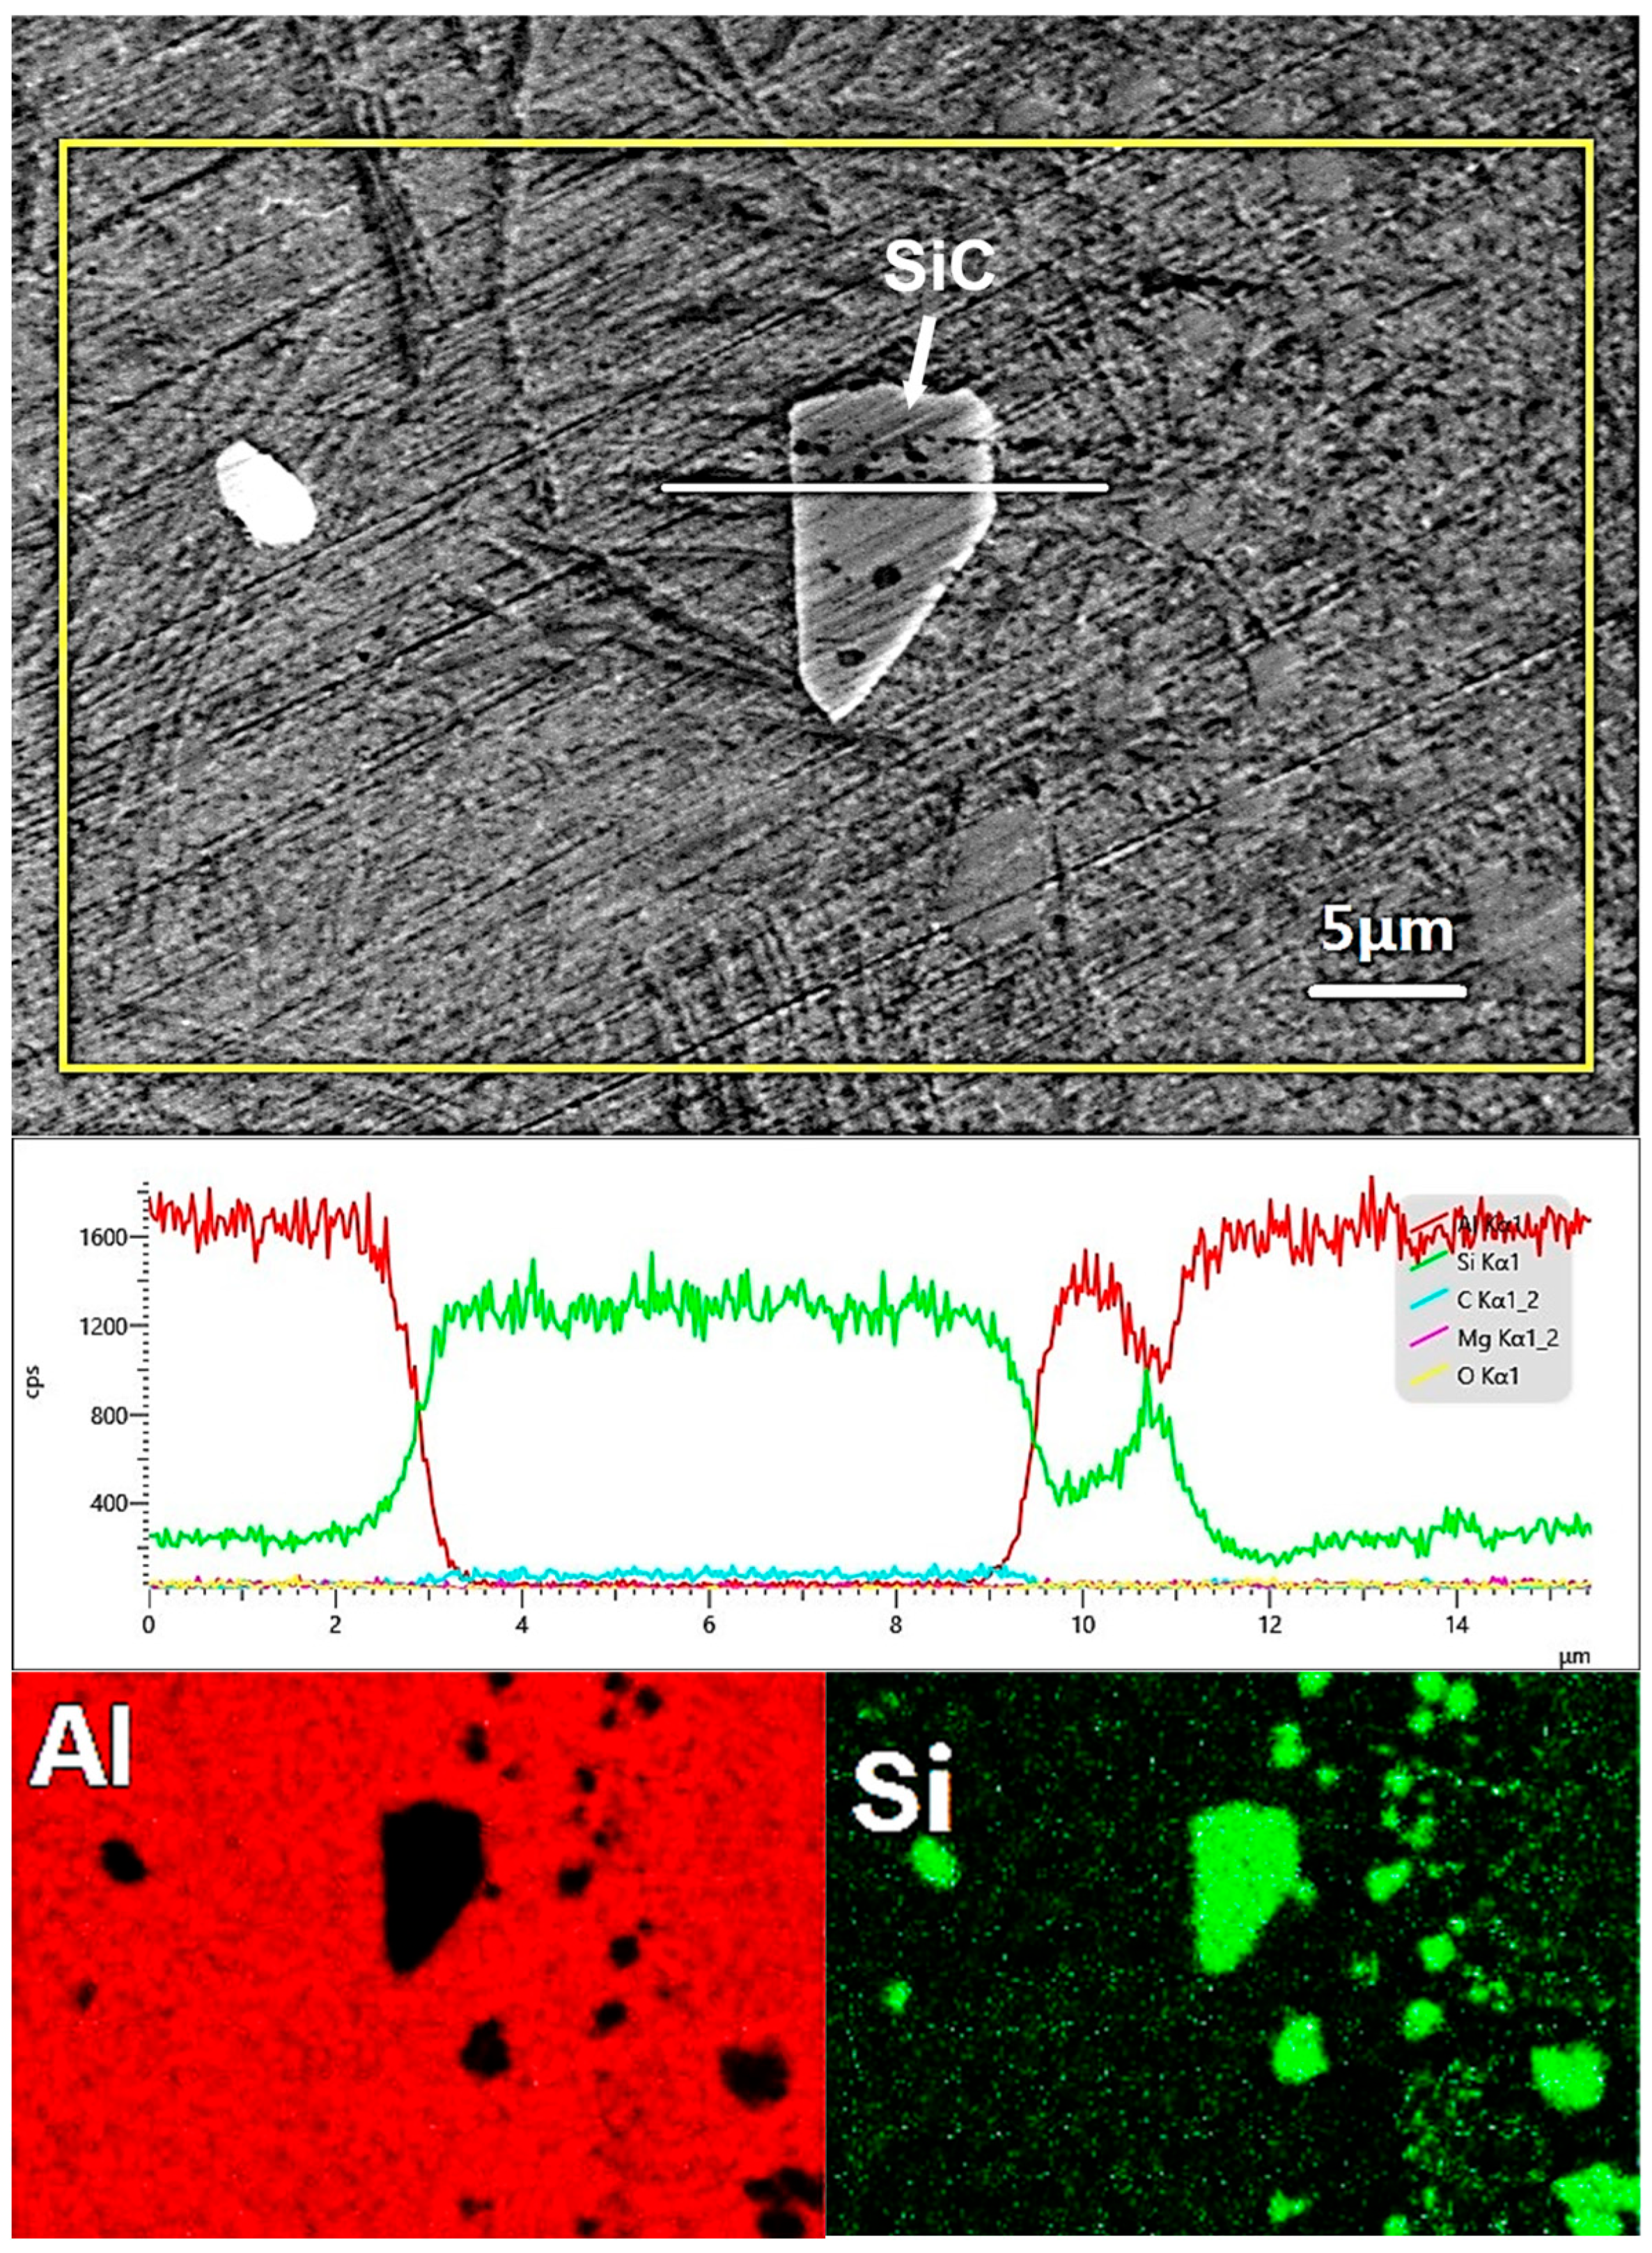
As the SiC particles are added into the matrix, the particles are well binded with the aluminum matrix during the LPBF process from
Figure 10. The SiC particles act as second-body abrasives against the counterface, and the loose debris made from the SiC particles and the Al
4SiC
4 phases act as third-body abrasives to both the matrix and reinforcement surfaces. It can be identified that the wear scratches on the worn surface are formed due to the abrasive action of SiC particles and wear debris. In conclusion, the main wear mechanisms of the LPBFed SiCp/AlSi10Mg composites are changed to delamination and abrasive wear.
Figure 15 shows the representative compressive stress–strain curve of the LPBFed SiCp/AlSi10Mg composites at room temperature. The yield strength (
) and maximum compressive strength (
) of the composites are 566.6 MPa and 764.1 MPa, respectively. The plastic strain is not found, instead of a brittle manner. The addition of SiC particles significantly affects the mechanical behavior of the matrix alloy. Generally, the yield strength of the composites is determined by that of the matrix. Compared with the monolithic material without reinforcement particles, the stress yield is greater for the LPBFed composites. The main reason is that dislocation strengthening, fine-grained strengthening, and other mechanisms are introduced into the matrix with the addition of SiC particles. Meanwhile, the applied load is not evenly distributed between the SiC particles and the matrix due to the difference in stiffness. Hence, SiC particles bear more applied load transferring from the matrix, leading to the fracture of the matrix delays.
Figure 16 reveals the fracture morphology of the LPBFed composites after the compressive test. The fracture surfaces appear flat and smooth with very few dimples from
Figure 16a. This indicates that the fracture is a typical brittle fracture. The cracked SiC particles which are, generally, in a smooth, flattened shape, can be found from the fracture facets, which are different from the Al matrix, as shown in
Figure 16b. The SiC particles are bonded to the matrix tightly. The good interfacial bonding is due to the excellent wettability and the interfacial chemical reaction at the high temperature during the process. It can be seen from
Figure 16b,d that the products of the interfacial chemical reaction, e.g., Al
4SiC
4, distribute near the SiC particles and in the matrix.
The cracked SiC particle can be clearly observed, as seen in
Figure 16b. The surface of the SiC fracture is very smooth, with no Al matrix adhering, suggesting that the SiC particle fractured. During the compressive test, SiC particles beared the load and then broken, which have a significant effect on the ultimate compressive strength of the LPBFed composites. The initial cracks are generated at the SiC particles and then propagate into the matrix, resulting in the final fracture of the composites. Therefore, the cracking of SiC particles as a typical brittle fracture is another failure initiation mechanism in LPBFed SiCp/AlSi10Mg composites.
From
Figure 9b, it can be found that a few microvoids and irregular pores exist in the microstructure. These pores have a detrimental effect on the compressive properties of the LPBFed composites. Finally, as the load increases, these pores result in the nucleation of microcracks, which promotes premature failure. It is believed that the fracture occurs either at the pores or by SiC particle cracking, rather than interface debonding.


