1. Introduction
In order to achieve the strategic goal of “carbon peak, carbon neutral”, the decarbonization of transportation in the automotive industry is imperative, and with the development of cleaner automotive energy and electrification of power, the carbon emissions of the automotive industry are gradually declining [
1,
2,
3,
4]. Electric vehicle sales were around 17 million units in 2024, with China accounting for around 45% of global sales, while Europe and the US reached 25% and 11%, respectively [
5]. At the same time, we should pay attention to new energy vehicles bringing thermal runaway and other potential safety problems. If the working temperature of the new energy battery box is too high, it may lead to serious thermal runaway and other related safety issues. If the charging or working temperature is too low, it may lead to serious traffic accidents such as the sudden breakdown of new energy vehicles [
6,
7,
8]. In order to protect the personal safety of new energy vehicle users and enhance the reliability of the new energy battery box and increase its service life, it is crucial to design a system that can monitor the temperature of the new energy battery box in a comprehensive and real-time manner and issue a fault warning to the user side [
9,
10]. A temperature monitoring and fault warning system combining thin-film sensors and integrated circuits was developed. Thin-film sensors have the advantage of being able to exhibit high sensitivity with fast response [
11,
12,
13]. Integrated circuits have the advantage of modularity and integration [
14,
15,
16]. Therefore, the developed system has the advantages of lightweight and miniaturization applicable to a ternary lithium battery box and can be efficient real-time monitoring and early warning. Sun et al. [
17] used a thermochromic hydrogel consisting of SDS and the polymer NIPAM-co-AM for temperature warning when Gel-8 wt%-NaCl reversibly changed from transparent to opaque color to protect crops, but the method had a low transparency of only 39.10% and thus low accuracy. Zhu et al. [
18] designed a flexible folded RGOS that thermally expands, causing it to come into contact with electrodes when a fire occurs, which generates an electric current and hence an early warning response. However, this method has a slow response time, requiring a response time of 0.5 s. Teng et al. [
19] designed a generalized warning model for internal and external temperatures, using a highly sensitive and responsive type K thermocouple to measure the temperature, but the method starts the warning from the time of electrolyte evaporation and the model is an ideal model; thus, the accuracy is low. Li Xiaoxi et al. [
20] designed a temperature and humidity monitoring management platform to monitor the temperature of the environmental test chamber, and the platform can alarm on site and remotely when the temperature exceeds the set maximum value. However, the method requires 0.1 s to respond. Cen et al. [
21] designed an in-vehicle temperature warning system using Openmv and STM32 technology. This system performs temperature warning and cooling simultaneously to better ensure the safety of car users. However, the accuracy of this system is low, at only 85.43%. Zhijie Wang et al. [
22] used EH technology for temperature warning of high-voltage switchgear, and the method works properly with high fault tolerance when different faults occur. However, the method takes too long to warn, at 4.45 s. In view of these limitations of existing temperature monitoring and warning systems, our study aims to develop a more efficient, accurate, safe, and reliable new energy battery box temperature monitoring and warning system for improving the safety of new energy vehicles.
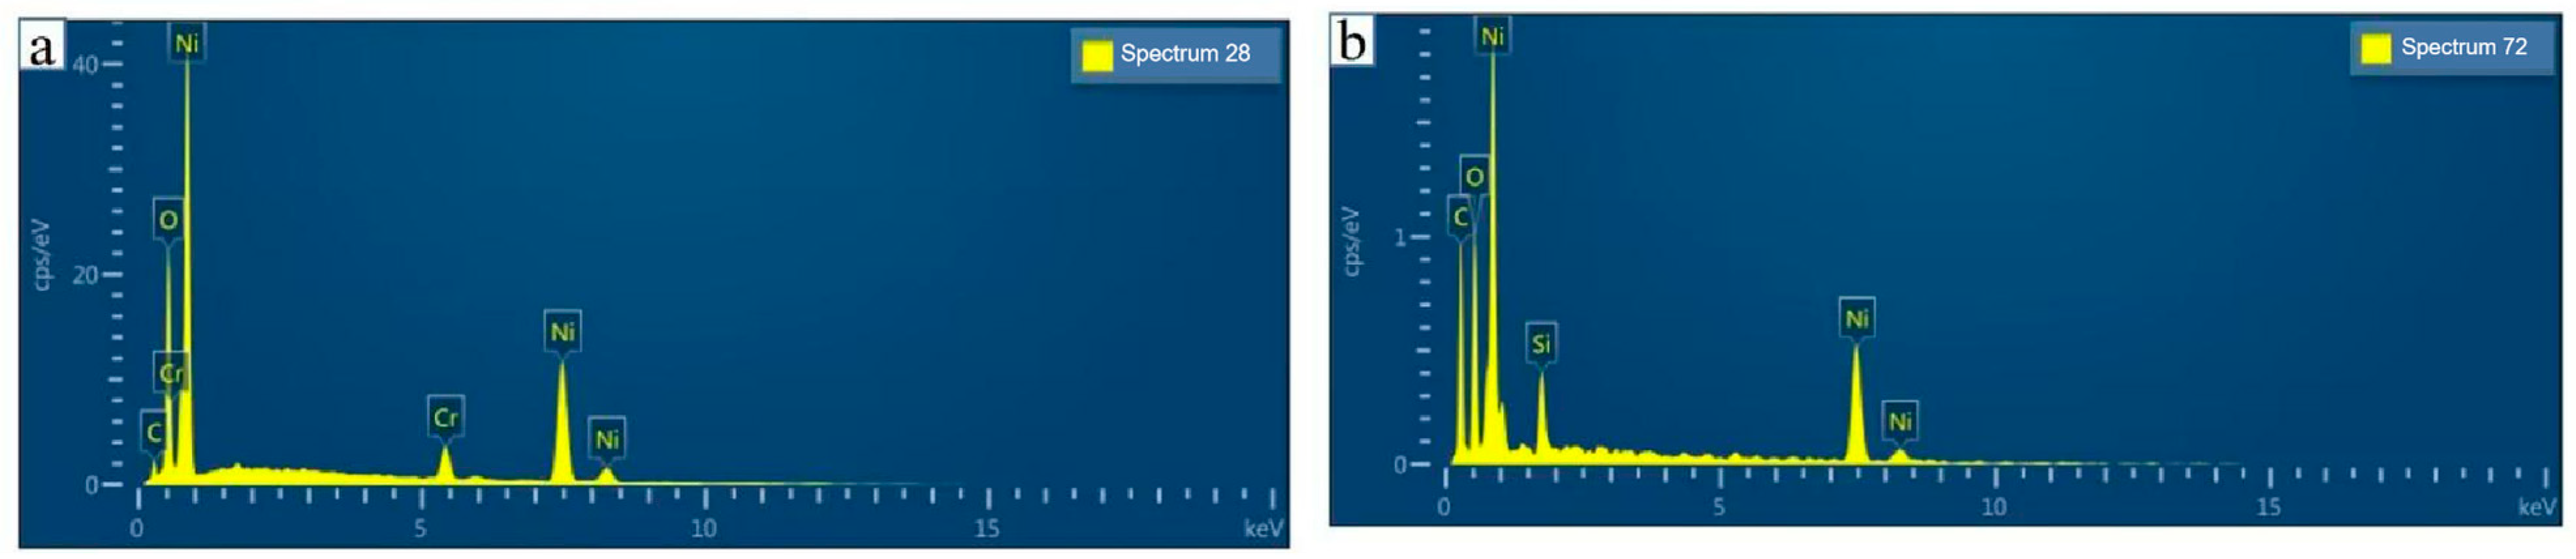
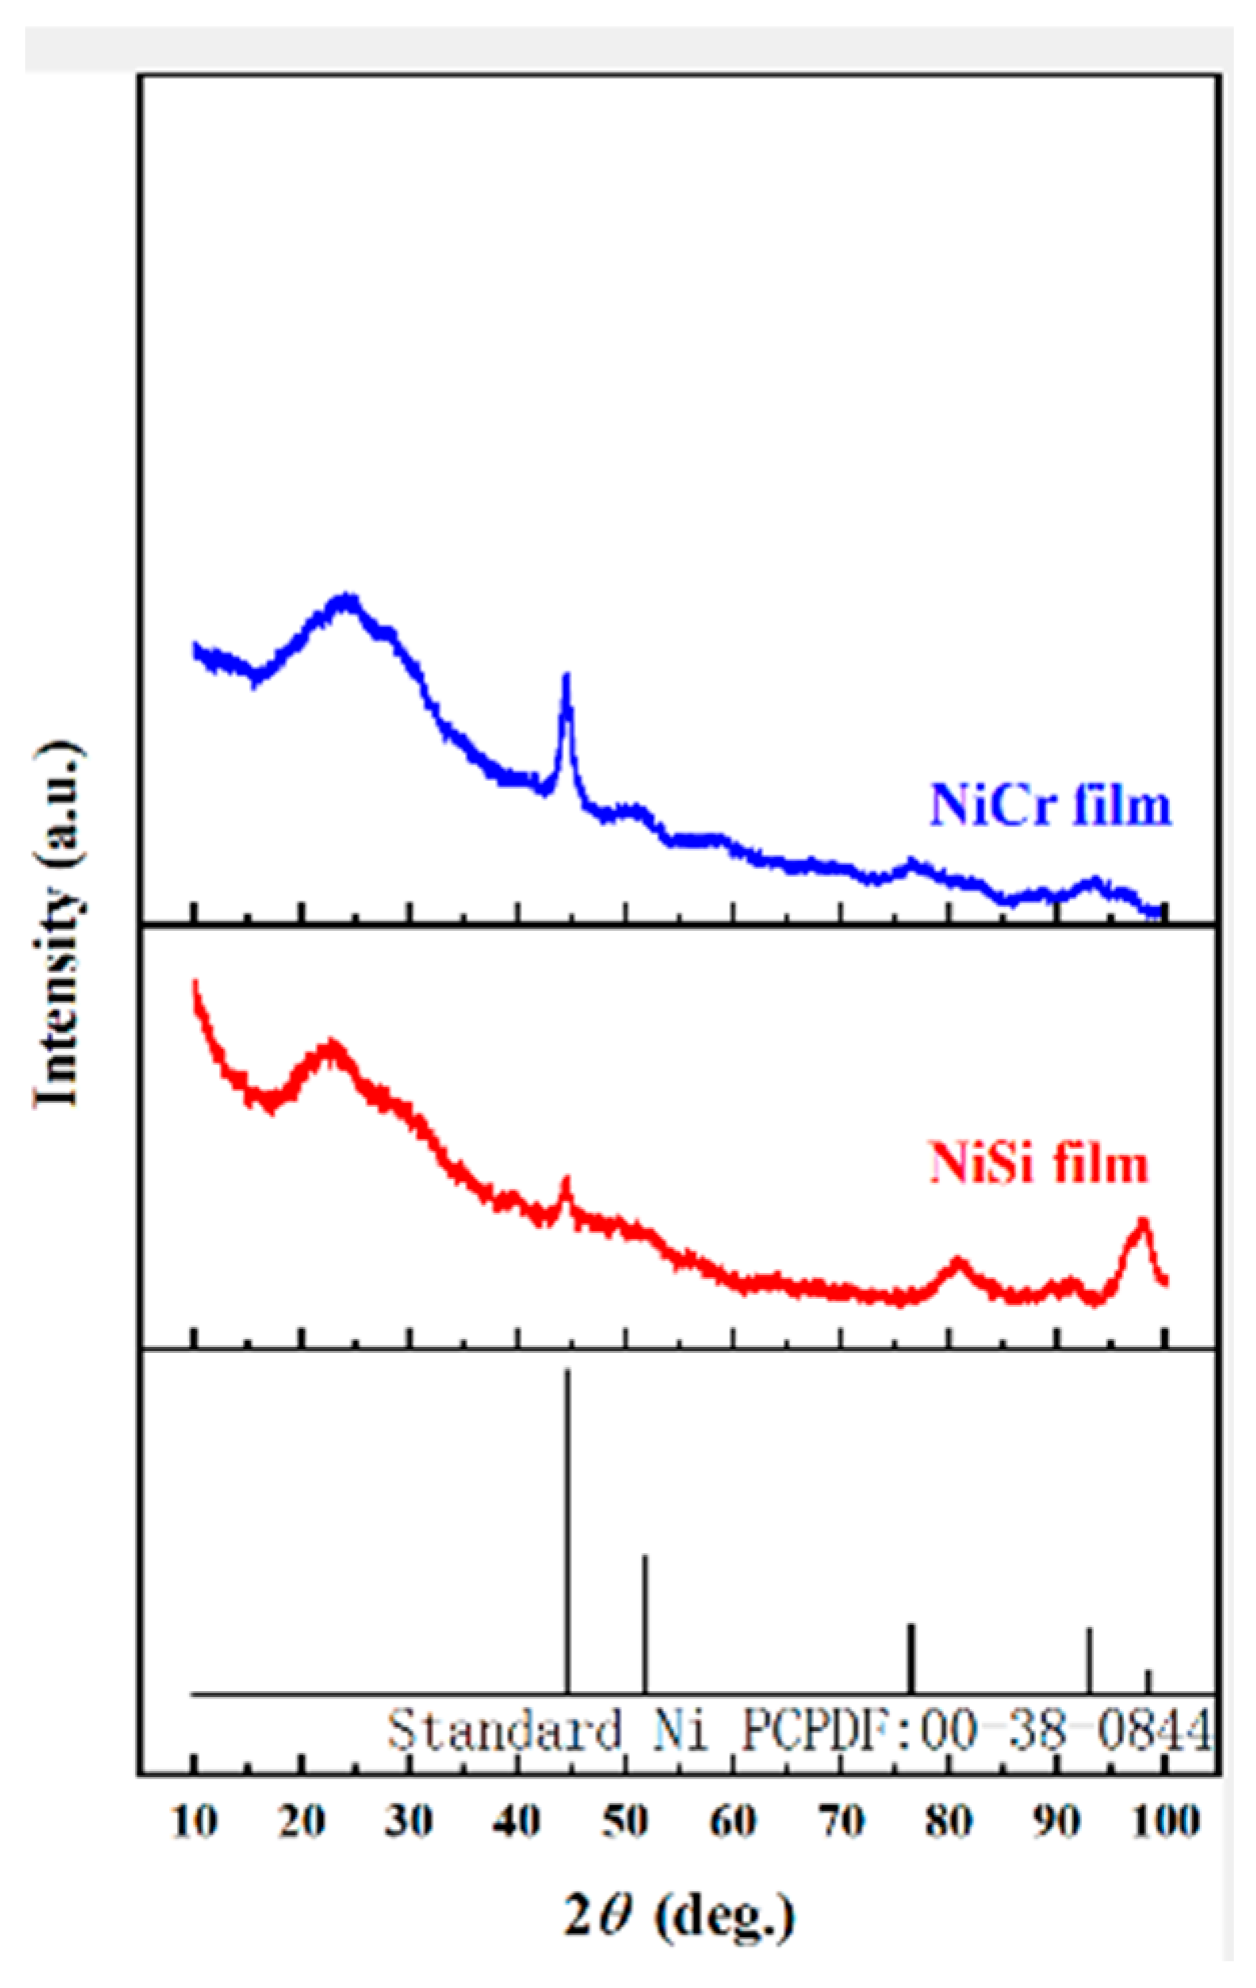
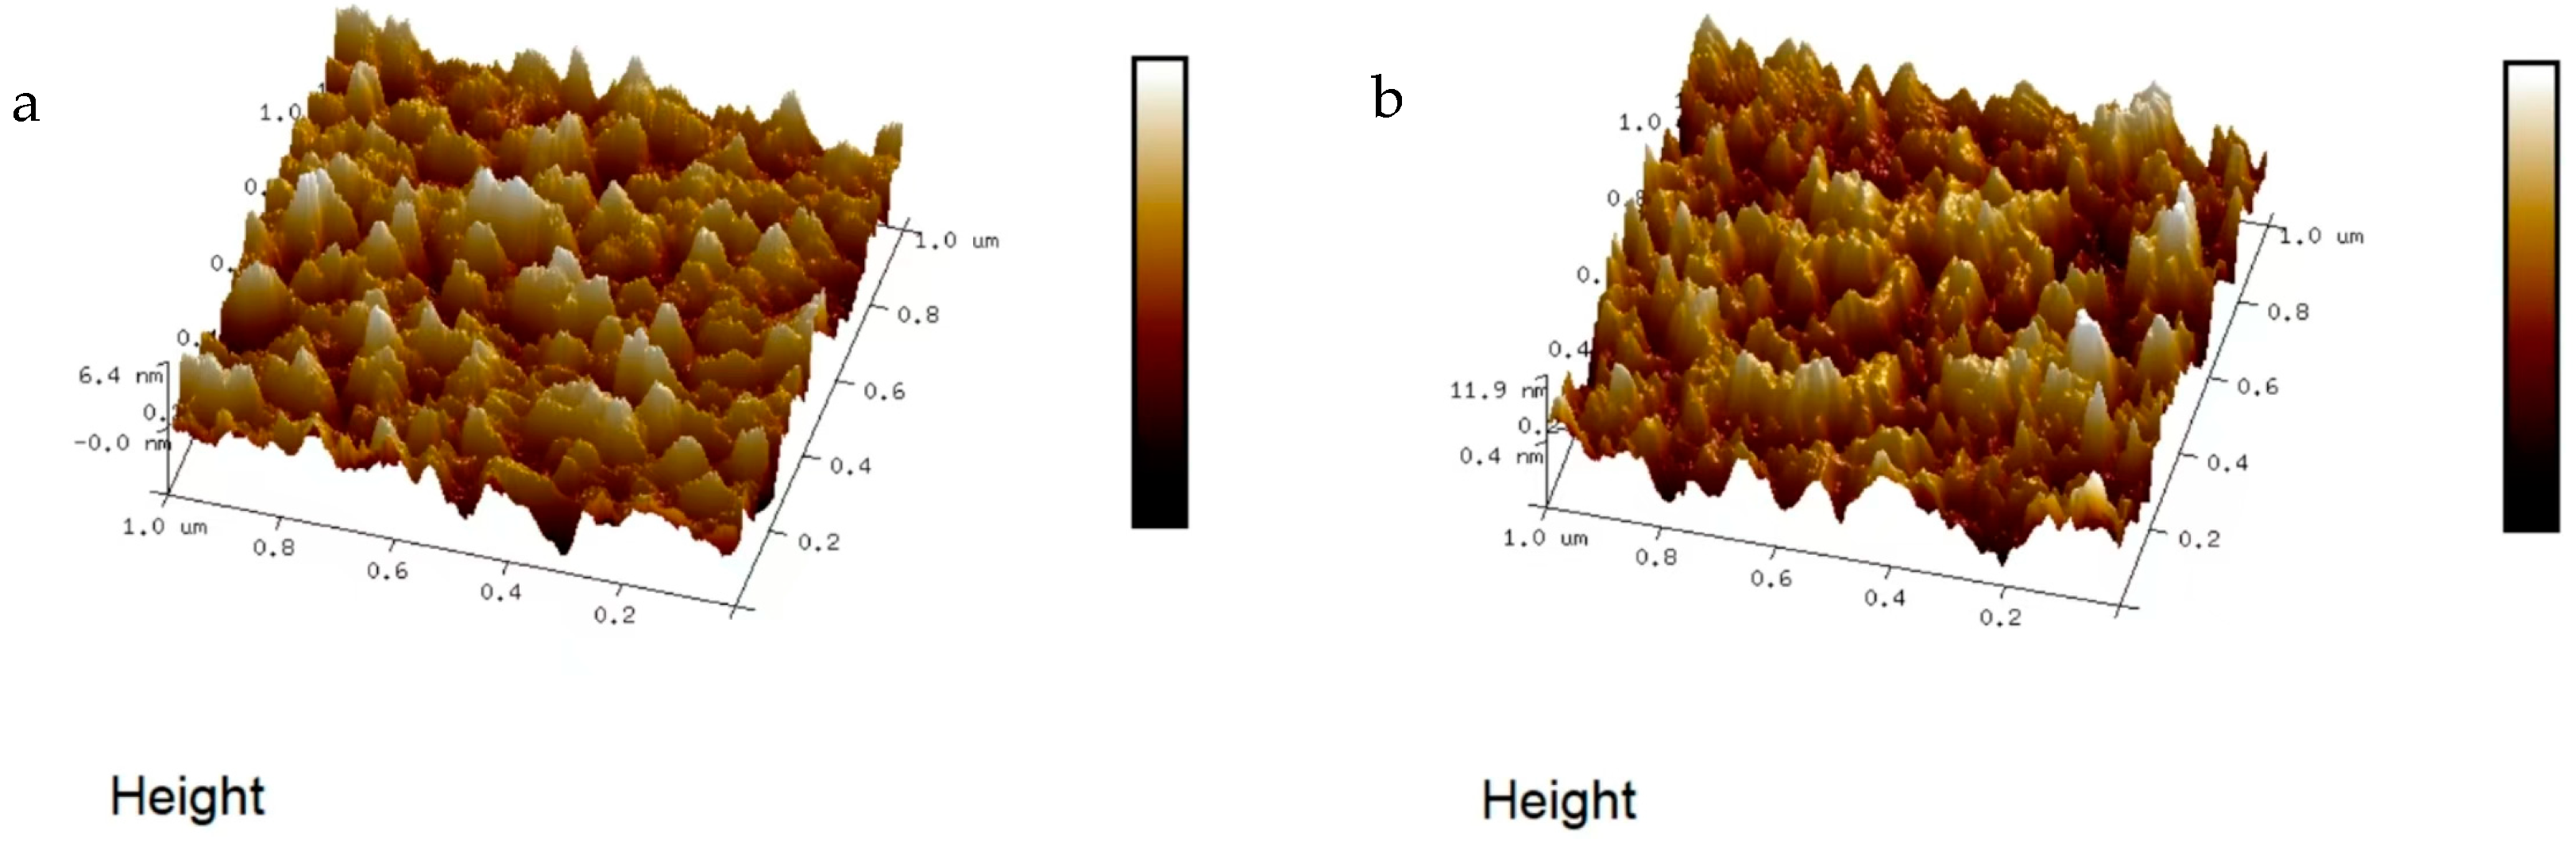
Existing temperature monitoring and warning systems face limitations in response speed, accuracy, and real-time representation of actual temperatures, often relying on deviations from setpoints rather than direct measurements. To address these challenges, this study proposes a novel, efficient, and reliable temperature monitoring and fault warning system for new energy vehicle battery boxes. By integrating sensor, amplifier, data acquisition, microprocessor (utilizing the KPCA nonlinear dimensionality reduction algorithm), communication, and alarm modules, the system enables real-time monitoring of temperature, voltage, and humidity. Key innovations include static calibration and material characterization of NiCr/NiSi thin-film thermocouples, which demonstrated high reproducibility and structural uniformity (3.2–5.75 nm roughness). Experimental validation confirmed the system’s accuracy in dynamically triggering multi-level warnings (e.g., temperature rise, voltage drop thresholds) and its capability to enhance the safety performance of ternary lithium battery cases. This approach mitigates uncertainties in conventional techniques and provides a robust solution for real-time battery safety management.
6. Data Analysis
Table 1 provides data on the change in sensitivity of thin-film thermocouples at different ambient humidities.
Table 1 focuses on the effect of ambient humidity on the sensitivity of thin-film thermocouples. From the data trend, the sensitivity of the thin-film thermocouple shows an increasing trend in the humidity interval from 20% RH to 60% RH, gradually increasing from 40.5 μV/°C at 20% RH until it reaches a peak value of 41.3 μV/°C at 60% RH. This may be due to the fact that the moderately increased humidity optimizes the electron conduction paths within the thin-film material to some extent, or changes the crystal structure of the material, resulting in an increase in the thermoelectric conversion efficiency. When the humidity exceeds 60% RH, the sensitivity begins to decrease, falling to 40.6 μV/°C at 90% RH, which is close to the level at 20% RH. This may be due to the fact that too much moisture forms an interference layer on the surface or inside the film, which prevents the proper transfer of electrons and thus affects the thermoelectric effect. This pattern of change is extremely critical for accurate temperature monitoring of the system in different humidity environments. When using the system in high-humidity southern regions or humid industrial environments, for example, it is necessary to calibrate compensation for the effect of humidity on sensitivity to ensure accurate temperature measurements.
The relationship between the continuous operation time of the system and the deviation in temperature and voltage measurements can be seen in
Table 2. As the operating time increases from 24 to 120 h, the temperature measurement deviation steadily increases from ±0.2 °C to ±0.6 °C, the voltage measurement deviation increases from ±0.02 V to ±0.06 V, and the temperature measurement deviation increases ten times more than the voltage measurement deviation. This phenomenon of accumulation of deviations indicates that the performance of the components gradually changes over a long period of time during the operation of the system. The rapid growth in the temperature measurement deviation may be because the material on the surface of the thin-film thermocouple undergoes slow oxidation or corrosion after long-term use, resulting in a change in the thermoelectric properties; it may also be that the wires connecting the thermocouple to the measurement circuit, under the effect of prolonged thermal expansion and contraction, lead to the contact resistance changing. Whereas the relatively slow increase in the deviation in voltage measurements is perhaps due to the relatively high stability of the voltage regulators, amplifiers, and other components of the circuit, there is also an inevitable drift in performance after long periods of operation. This change in stability poses a serious challenge to the long-term reliability of the system. If measures are not taken in time, the system will gradually lose accuracy in monitoring the temperature and voltage of the battery tank as the measurement deviation continues to increase, which may ultimately lead to delayed or incorrect fault warnings and jeopardize the safe operation of the battery tank.
Table 3 presents the relationship between the tank charge/discharge multiplier and the rate of temperature rise. It can be clearly seen that there is a non-linear relationship between the two. When the charge/discharge multiplication rate is low, such as from 0.5 C to 1 C, the temperature increase rate increases from 0.5 °C/min to 1.2 °C/min, which is a more moderate increase, because when charging and discharging at a low multiplication rate, the chemical reaction rate inside the battery is relatively slow, and the heat generated can be more evenly distributed. However, as the charge/discharge multiplication rate is further increased from 1 C to 3 C, the increase in the temperature rise rate becomes steeper, reaching 5.5 °C/min at 3 C. This is because high-rate charging and discharging will cause the chemical reaction inside the battery to accelerate dramatically and the heat generated by the internal resistance of the battery will increase rapidly, and at the same time, it is difficult for the heat dissipation rate to keep up with the rate of heat production, resulting in a large amount of heat accumulation, which will lead to a rapid rise in temperature. This temperature variation characteristic has a profound effect on battery life and safety. Frequent use of batteries at high charge/discharge multipliers will accelerate the aging process of the battery and reduce the capacity and performance of the battery, and may also cause serious safety accidents such as thermal runaway. Therefore, in practical applications, it is necessary to reasonably control the charging and discharging multiplication rate according to the characteristics of the battery and the use scenarios, and at the same time, optimize the heat dissipation design of the battery to ensure that the battery operates within a safe temperature range.
In this study, the temperature monitoring and fault early warning system constructed for the ternary lithium battery case has a clear and detailed setting for its warning trigger conditions. When the initial temperature of the lithium battery case is in the range of 35–55 °C and the temperature rises to 42–65 °C after 10 min, and at the same time, the initial voltage is in the range of 400–425 V and the voltage drops to 398–375 V after 10 min, the system will trigger the first-level warning. This is a relatively mild abnormality, indicating that the battery box in the current operating conditions, despite having a certain degree of temperature increase and voltage drop, is still in a relatively controllable range.
The triggering conditions of the second-level warning are an initial temperature of 60–80 °C and the temperature rising to 72–95 °C after 10 min, and an initial voltage of 430–450 V and the voltage decreasing to 370–350 V after 10 min. Compared with the first-level warning, the second-level warning corresponds to a higher level of initial temperature and voltage, and the changes in the temperature and voltage after 10 min are more significant, which means that the operating condition of the battery box is starting to deviate from the normal range and requires more attention. The triggering conditions for a Level 3 warning are more stringent: when the initial temperature of the lithium battery case is 85–110 °C and the temperature further climbs to 102–138 °C after 10 min, and the initial voltage is 455–480 V and the voltage drops to 345–320 V after 10 min, the system will issue a Level 3 warning. At this time, the temperature and voltage changes in the battery box have become more obvious, which may have some impact on the performance and safety of the battery, and appropriate measures may need to be taken to intervene in a timely manner. The most severe Level 4 warning is triggered by an initial temperature of 115–125 °C and a temperature of 145–160 °C after 10 min, and an initial voltage of 485–495 V and a voltage as low as 315–305 V after 10 min. The initial temperature and voltage corresponding to a Level 4 alert are at the highest level, and the temperature and voltage changes after 10 min are extremely large, indicating that the battery box may be in a more dangerous operating condition and that urgent measures must be taken immediately to avoid potential safety risks.
From the logic of setting the warning level, the initial voltage and initial temperature of the fourth-level warning are the highest, while the initial voltage and initial temperature of the first-level warning are the lowest, and the relevant parameters of the second-level warning and the third-level warning are in increasing order. This setting is in line with the actual operation of the battery box risk level, based on different levels of abnormality to issue the appropriate level of warning in a timely manner, in order to provide a strong basis for subsequent maintenance and decision-making.
In terms of temperature change, the temperature after 10 min of a Level 1 warning only increases by 7–10 °C from the initial temperature, while the temperature after 10 min of a Level 4 warning increases by as much as 30–35 °C from the initial temperature, and the temperature after 10 min of Level 2 and Level 3 warnings increases in the order of increase from the initial temperature. This clearly reflects the fact that as the warning level increases, the rate of temperature rise inside the battery box gradually accelerates and the risk of thermal runaway of the battery increases.
In terms of voltage variation, the voltage shows a gradual decrease after 10 min as the initial voltage and initial temperature increase. This suggests that there is a difference in the rate of release of electrical energy from batteries in different initial states, and that this difference is closely related to temperature changes.
In order to deeply investigate the temperature and voltage trends of Li-ion ternary batteries, 20 samples covering four warning levels were carefully selected in this study, including six first-level warning samples, five second-level warning samples, six third-level warning samples, and three fourth-level warning samples. A careful analysis of these samples revealed that the temperature trend of all the samples shows a clear upward trend, while the voltage trend invariably shows a downward trend. In addition, the temperature after 10 min is higher than the initial temperature and the voltage after 10 min is lower than the initial voltage at different warning levels. These results further verify the rationality of the system’s early warning trigger condition setting and also provide an important reference basis for the subsequent real-time monitoring and fault diagnosis of the battery box operation status. Through the in-depth mining and analysis of these sample data, we can better understand the pattern of change in battery performance under different working conditions and provide strong support for optimizing the battery management system and improving the safety and reliability of the battery.
In this study, 15 samples were included, and the experimental data are detailed in
Table 4. Based on
Table 5, it can be seen that conditions 1–4 in
Table 4 can trigger a Level 1 warning. In this case, the rate of temperature rise is low, ranging from 0.02–0.03 °C/s; the rate of voltage drop is also low, ranging from 0.01–0.05 V/s; the warning response time is the shortest, in the range of 0.05–0.08 s; and the warning accuracy is the highest, reaching 99.2–98.2%. The working conditions corresponding to the first level of warning are relatively safe conditions, and the accuracy of this warning can effectively prevent the occurrence of dangerous situations. Conditions 5–7 can trigger a secondary warning. At this time, the rate of temperature rise is at 0.04–0.08 °C/s; the rate of voltage drop is 0.03–0.09 V/s; the warning response time is prolonged compared to the first level of warning, ranging from 0.10–0.15 s; and the accuracy of the warning is high, at 97.5–96.5%. Conditions 8–10 can trigger a Level 3 warning. Under this condition, the temperature rise rate is faster, at 0.8–1.1 °C/s, and the voltage drop rate is also faster, at 0.09–0.15 V/s. The warning response time is further extended to 0.18–0.25 s, and the warning accuracy is relatively low, at 96.0–95.0%. Condition numbers 11–15 can trigger four levels of warning. Under this type of working condition, the temperature rise rate is the fastest, greater than 1.1 °C/s; the voltage drop rate is the largest, greater than 0.15 V/s; the warning response time is the longest, at 0.3–0.5 s; and the warning accuracy is the lowest, at 94.5–92.5%. The fourth level of warning corresponds to the slightest situation, although its warning accuracy can be as low as 92.5%. However, the monitoring and response to the fourth level of warning is still important to ensure the security and stability of the system.
In this study, several rounds of validation were carried out for the fault warning model of the ternary lithium battery case temperature monitoring and fault warning system. Starting with a sample size of 50, the number of samples was increased by 50 each time, for a total of 10 validations. Of the initial 50 samples verified, the number of fault samples was 10, the number of correctly warned faults amounted to 8, the number of false alarm samples was 2, and the number of missed alarms was also 2. As the number of samples increases, the number of fault samples, correctly warned fault samples, false alarm samples, and missed alarm samples all increase with fixed regularity, i.e., for every additional 50 samples, the number of fault samples increases by 10, the number of correctly warned fault samples increases by 8, the number of false alarm samples increases by 2, and the number of missed alarm samples also increases by 2. It is worth noting that despite the changing sample size, the warning accuracy, false alarm rate, and missed alarm rate remain constant at 80%, 4%, and 4%, respectively. Also, the failure rate is constant at 20%, independent of the sample size.
These results fully demonstrate the high stability of the fault warning model. On the one hand, stable warning accuracy means that the model can more reliably and accurately identify faulty samples from a large amount of data, and maintains good performance in data environments of different sizes. On the other hand, the lower false alarm and omission rates reflect the accuracy of the model and reduce the unnecessary false and omission cases, which is of great significance to guarantee the safe operation of the Li-ion ternary battery box. Overall, the system is more stable in terms of probabilistic performance and has a high quality of warning, which is suitable for fault warning scenarios of ternary lithium-ion batteries.
KPCA (kernel principal component analysis) is a nonlinear dimensionality reduction method that maps data to a high-dimensional feature space through kernel functions. Compared with traditional PCA (principal component analysis) and LDA (linear discriminant analysis), KPCA has a significant advantage in handling nonlinear data. It is capable of solving complex relationships that cannot be handled by linear methods such as PCA and LDA by introducing kernel tricks, and it especially excels in highly coupled nonlinear data such as battery temperature, voltage, and humidity.
In this experiment, we used 500 sets of ternary lithium battery temperature (
Table 6), voltage, and humidity monitoring data, covering four levels of warning scenarios, to evaluate the performance of different dimensionality reduction methods (KPCA, PCA, LDA) in feature extraction and classification. To validate the advantage of KPCA in handling nonlinear data, a Gaussian kernel function was used, defined as:
where
is the element of the kernel matrix,
is the Euclidean distance between data points, and N is a constant that controls the width of the kernel function. KPCA uses this Gaussian kernel to map the data into a higher-dimensional feature space, where nonlinear features of the data can be captured. This mapping makes the nonlinear relationships in the data (such as the complex relationship between temperature and voltage) linearly separable in the high-dimensional space, providing stronger performance for classification tasks.
In terms of the theoretical mechanism, KPCA’s core idea is based on a kernel trick, which maps data to a high-dimensional feature space via a nonlinear transformation. In this space, nonlinear features of the data can be effectively extracted using linear methods. Specifically, KPCA computes the kernel matrix
,
, where
is the nonlinear mapping function of the data, which avoids the explicit calculation of the high-dimensional feature space, thus reducing computational complexity. By solving the eigenvalue problem:
where K is the kernel matrix, α is the eigenvector, and λ is the eigenvalue, the need to explicitly compute the mapping of the high-dimensional eigenspace is avoided, and the use of the kernel trick improves the computational efficiency.
The following are the experimental data comparing KPCA with traditional PCA, LDA, and t-SNE in terms of feature extraction ability, nonlinear feature separation ability, and classification accuracy:
As shown in
Table 7, KPCA significantly outperforms traditional PCA and LDA in terms of feature extraction capability. The experimental data show that KPCA achieves 92% in terms of retained variance, compared to only 78% for traditional PCA and 65% for LDA. This difference mainly stems from the fact that KPCA is able to map data from the original space to a higher-dimensional feature space through Gaussian kernel mapping, which captures the nonlinear features in the data and thus better separates the complex relationships in the data. In contrast, PCA only extracts data features through linear projections, causing it to react poorly to nonlinear structures in the data and therefore retaining lower variance.
In terms of classification accuracy, KPCA also shows strong advantages. In an experiment with 500 sets of Li-ion ternary battery monitoring data, KPCA achieves a classification accuracy of 95.5%, compared to 89.2% for conventional PCA and 85.0% for LDA. This improved accuracy is especially evident when dealing with complex nonlinear data, such as the relationship between temperature, voltage, and humidity. The experimental results also show that KPCA improves the accuracy by 6.3% over PCA when dealing with complex conditions such as drastic temperature changes or high-magnification discharges, which verifies its effectiveness in practical applications.
In this study, a systematic comparison of KPCA, PCA, LDA, and a deep learning method (CNN) was conducted to evaluate their false alarm rates (FPRs), missed alarm rates (FNRs), and response times. The results reveal significant differences in the algorithms’ performance, particularly under extreme conditions. Sample size: 500 validation data sets (
Table 6), covering both normal and faulty states; extreme conditions: temperature > 150 °C, voltage drop > 0.24 V/s, humidity > 80% RH.
The following table presents the comparison of accuracy, false alarm rate (FPR), missed alarm rate (FNR), and response time for each algorithm.
As shown in
Table 8, KPCA shows a clear advantage in false alarm rate, with a 4% rate, which is 50% lower than that of PCA and 60% lower than that of LDA, and the response time is the fastest (0.05 s). This highlights KPCA’s efficiency and effectiveness in real-time battery monitoring applications. In comparison to deep learning methods (CNN), which achieve an accuracy of 85%, the performance trade-off lies in the computational requirements. While CNN slightly outperforms KPCA in accuracy, it demands high-cost hardware (e.g., GPU), making KPCA a more practical choice for embedded systems where hardware constraints are important.
The following sensitivity analysis was performed to evaluate the robustness of the algorithms under various disturbance conditions, such as changes in temperature, voltage, and humidity. The results show how the false alarm rate (FPR) changes when these parameters are disturbed.
As shown in
Table 9, KPCA exhibits minimal fluctuations in false alarm rates across different disturbance conditions (ranging from ±0% to ±3%), indicating that it is highly robust to extreme disturbances. PCA and LDA, on the other hand, show significantly larger fluctuations in their false alarm rates, particularly when disturbances like humidity and temperature changes are applied. This further emphasizes KPCA’s superior robustness compared to PCA and LDA.
The sensitivity analysis conducted in this study aims to evaluate the impact of threshold variations on system performance. The temperature and voltage thresholds were perturbed by ±10% from their original values for testing. Sample size: 500 validation samples (
Table 6), which include both normal and faulty states. Disturbance range: initial temperature and voltage values, as well as their rates of change, were adjusted by ±10% (
Table 1).
Sensitivity coefficient (S): This coefficient measures the change in accuracy per unit of threshold change and is calculated as:
This represents the rate of accuracy change per unit of threshold variation.
Stability range: The range of threshold variations within which the accuracy does not decrease by more than 5%. This provides insight into the system’s stability under varying conditions.
The effect of perturbing the temperature threshold by ±10% on the system’s performance was evaluated, with results as follows:
As shown in
Table 10, increasing the temperature threshold by 10% results in a 4% decrease in accuracy, while decreasing the temperature threshold by 10% improves accuracy by 4%. The sensitivity coefficient, |S| = 0.4, indicates a moderate sensitivity to temperature threshold variations. The perturbation of the voltage threshold was also analyzed. The results are shown in the table below.
As shown in
Table 11, voltage threshold variations have a smaller impact on accuracy compared to temperature, with the sensitivity coefficient |S| = 0.2. Increasing the voltage threshold slightly improves accuracy, while decreasing it by 10% reduces accuracy by 2%. However, reducing the voltage threshold too much can increase the false alarm rate.
Next, a combination of threshold perturbations (e.g., +10% temperature and −10% voltage) was analyzed. The results are summarized as follows.
As shown in
Table 12, the combination of perturbations has a synergistic effect, amplifying the impact on system performance. For example, the combination of +10% temperature and −10% voltage results in an 8% decrease in accuracy, with a significant increase in both the false alarm and missed alarm rates. This highlights the need to avoid extreme threshold shifts.
In order to minimize long-term errors, a periodic static calibration method was used in this study.
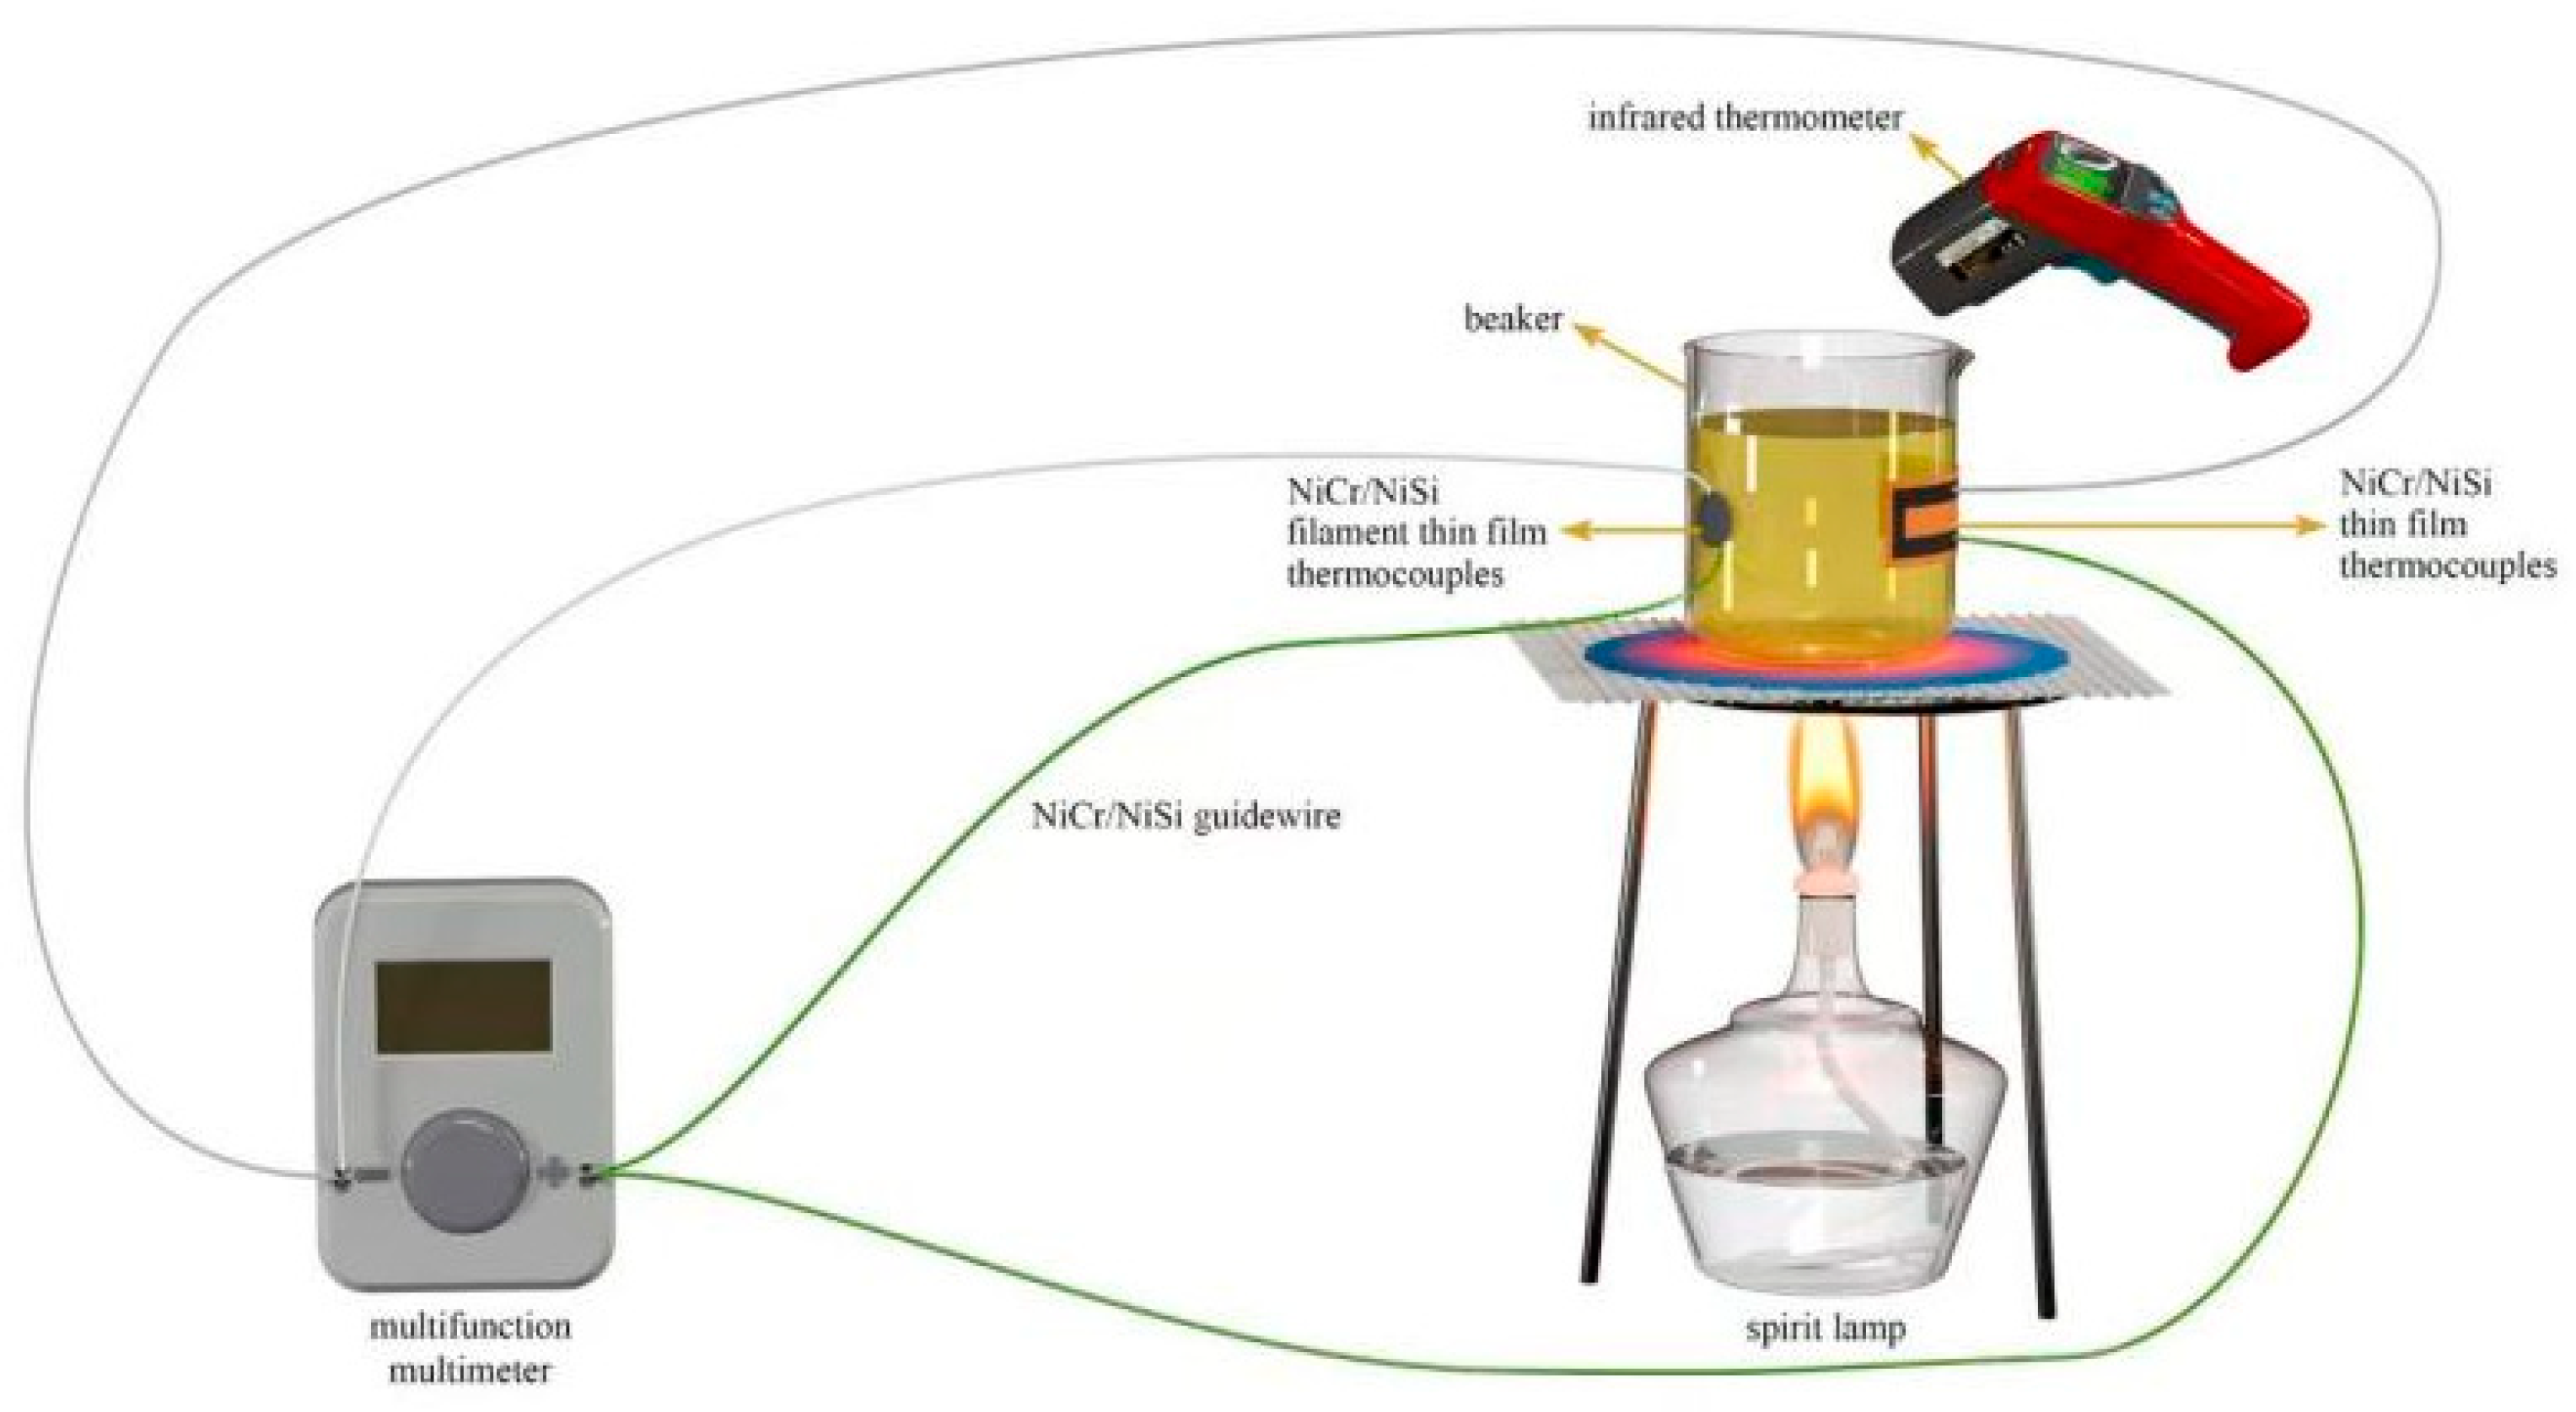
Method: In situ calibration of the thermocouple cold end (
Figure 7) was performed every 48 h by an infrared temperature gun (SW605A) to compensate for Seebeck coefficient drift (ΔS ≤ 0.5 μV/°C). Temperature deviation decreased from ±0.6 °C to ±0.3 °C at 120 h after calibration (
Table 13).
In this study, the performance of the proposed system, which combines KPCA with NiCr/NiSi thermocouples, is compared to several existing real-time battery monitoring solutions based on various metrics such as accuracy, FPR, missed alarm rate (FNR), and response time.
Table 14 summarizes the performance data.
As shown in
Table 14, the proposed system exhibits a significant improvement in false alarm rate (4%) and response time (0.05 s) compared to traditional PCA (8%) and LDA (10%) solutions. It also outperforms single-sensor-based systems (such as infrared thermography) in terms of multi-parameter fusion, as it integrates temperature, voltage, and humidity measurements. The system’s accuracy is 5% lower than that of the deep learning-based CNN solution (85%), due to the absence of the need for high-resolution infrared cameras, making it more suitable for embedded systems.
The system’s performance was also evaluated under extreme conditions to assess its robustness and ability to handle challenging real-world scenarios. These scenarios include high discharge rates, rapid temperature fluctuations, and extreme humidity. Below are the detailed results and analyses.
As shown in
Table 15, under high discharge rates (3 C), the system’s accuracy drops by 5.7% compared to 1 C discharge conditions, but it still performs better than traditional solutions, which report only 85% accuracy at 3 C. While the response time is longer in the 3 C condition (0.5 s), it is still within an acceptable range. The system’s temperature tracking deviation increases with higher discharge rates but remains within a reasonable margin of error.
As shown in
Table 16, in extreme scenarios with rapid temperature changes (ΔT > 10 °C/min), the system’s accuracy drops to 88%, but it is still superior to traditional systems, such as PCA-based approaches (which report a ±0.8 °C deviation in similar scenarios). The dynamic compensation algorithm, using Formulas (11)–(15), helps reduce the temperature deviation to ±0.4 °C during rapid temperature fluctuations. Additionally, the system’s response time is fast (0.3 s), significantly improving real-time performance.


