
A Modulation Method for Tunnel Magnetoresistance Current Sensors Noise Suppression


 and
and 
Abstract
1. Introduction
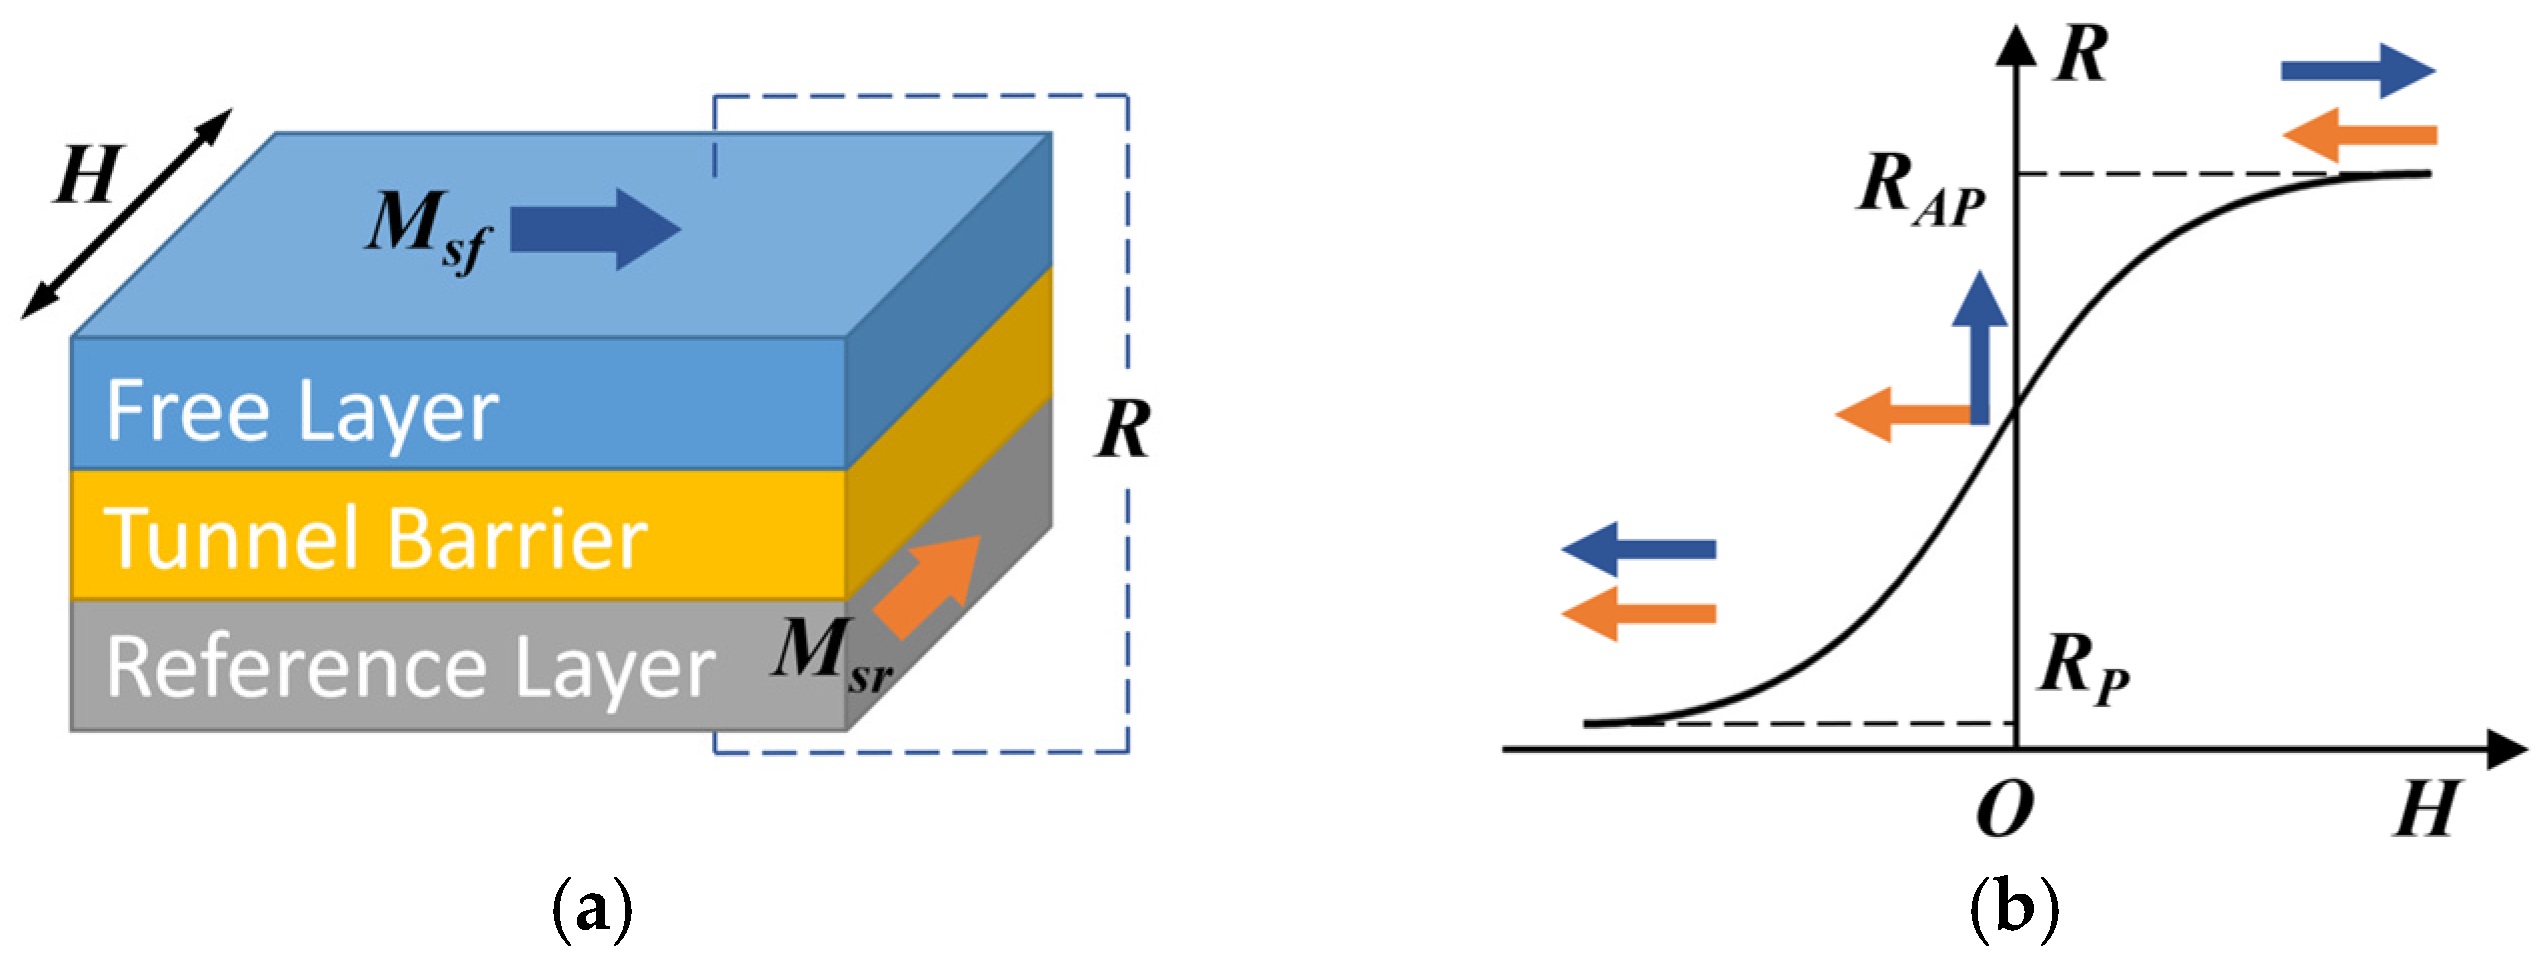
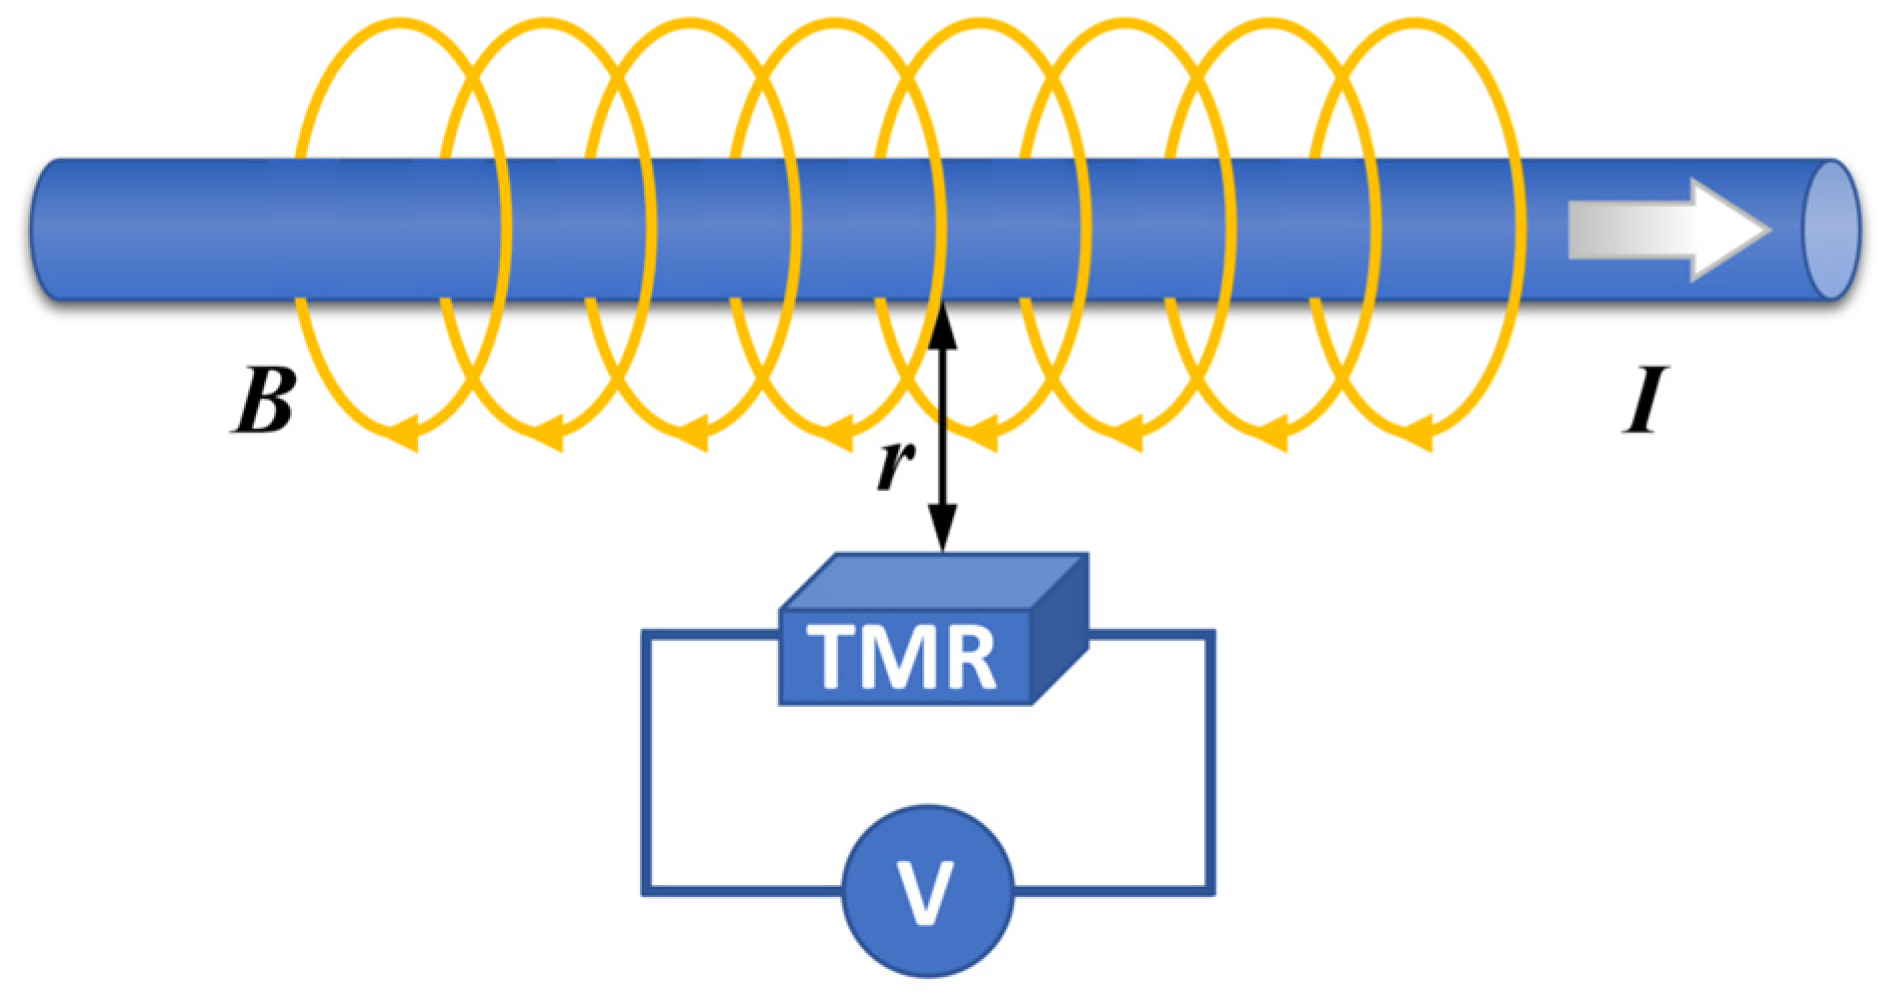
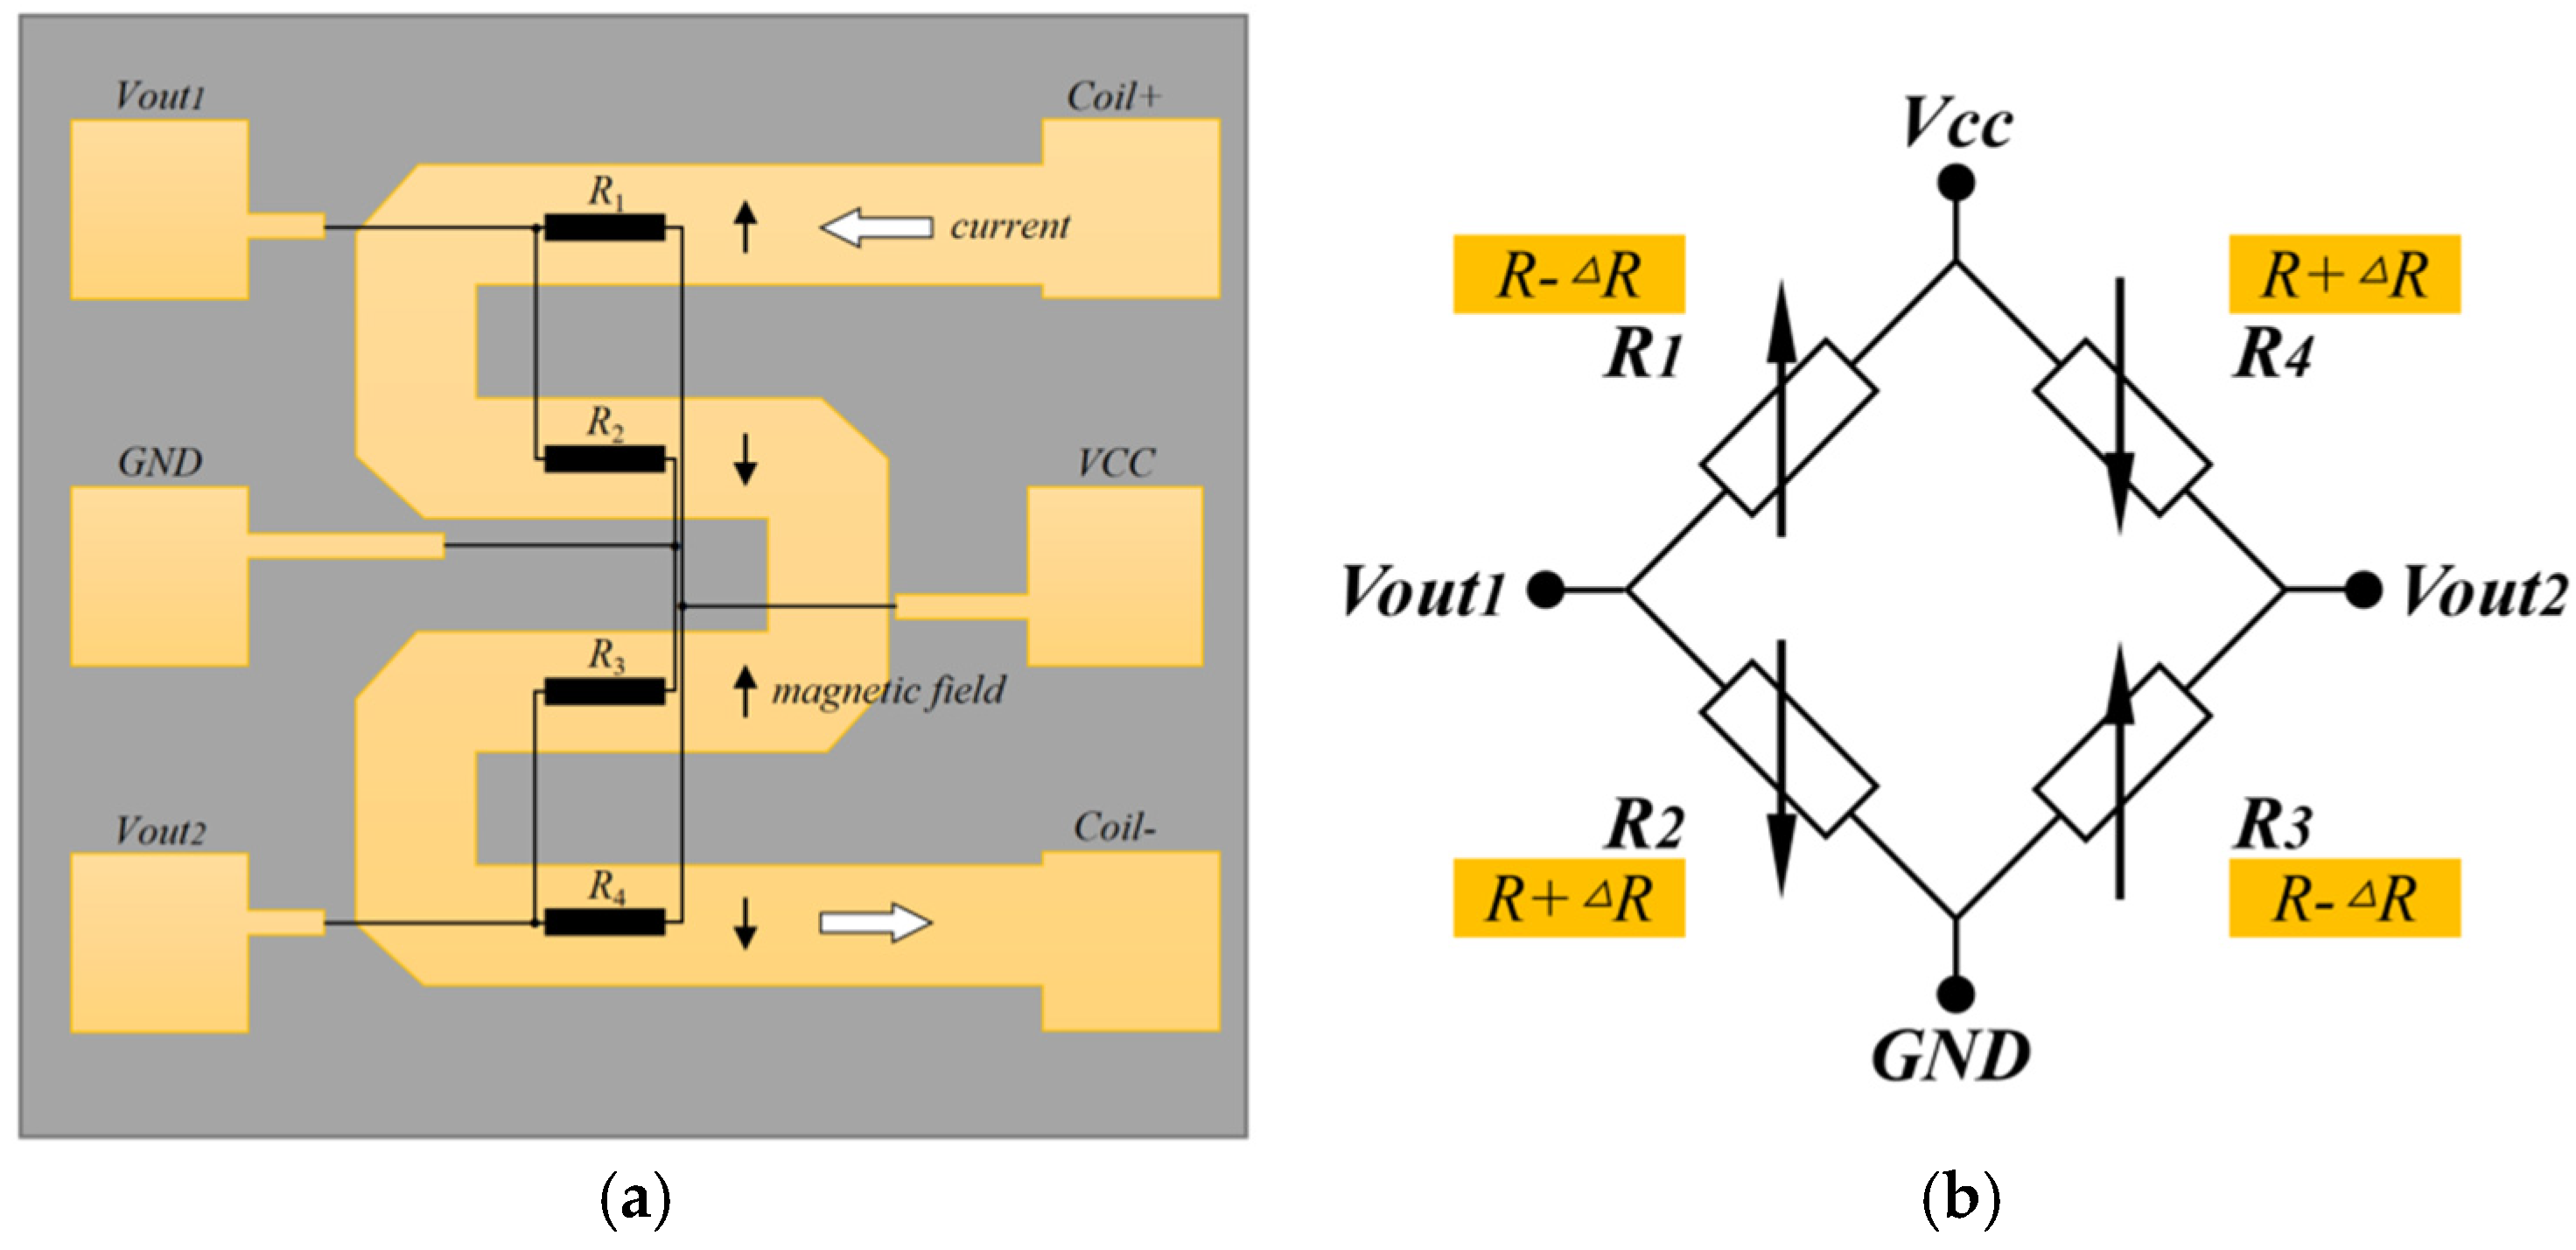
2. Principle
3. Simulation
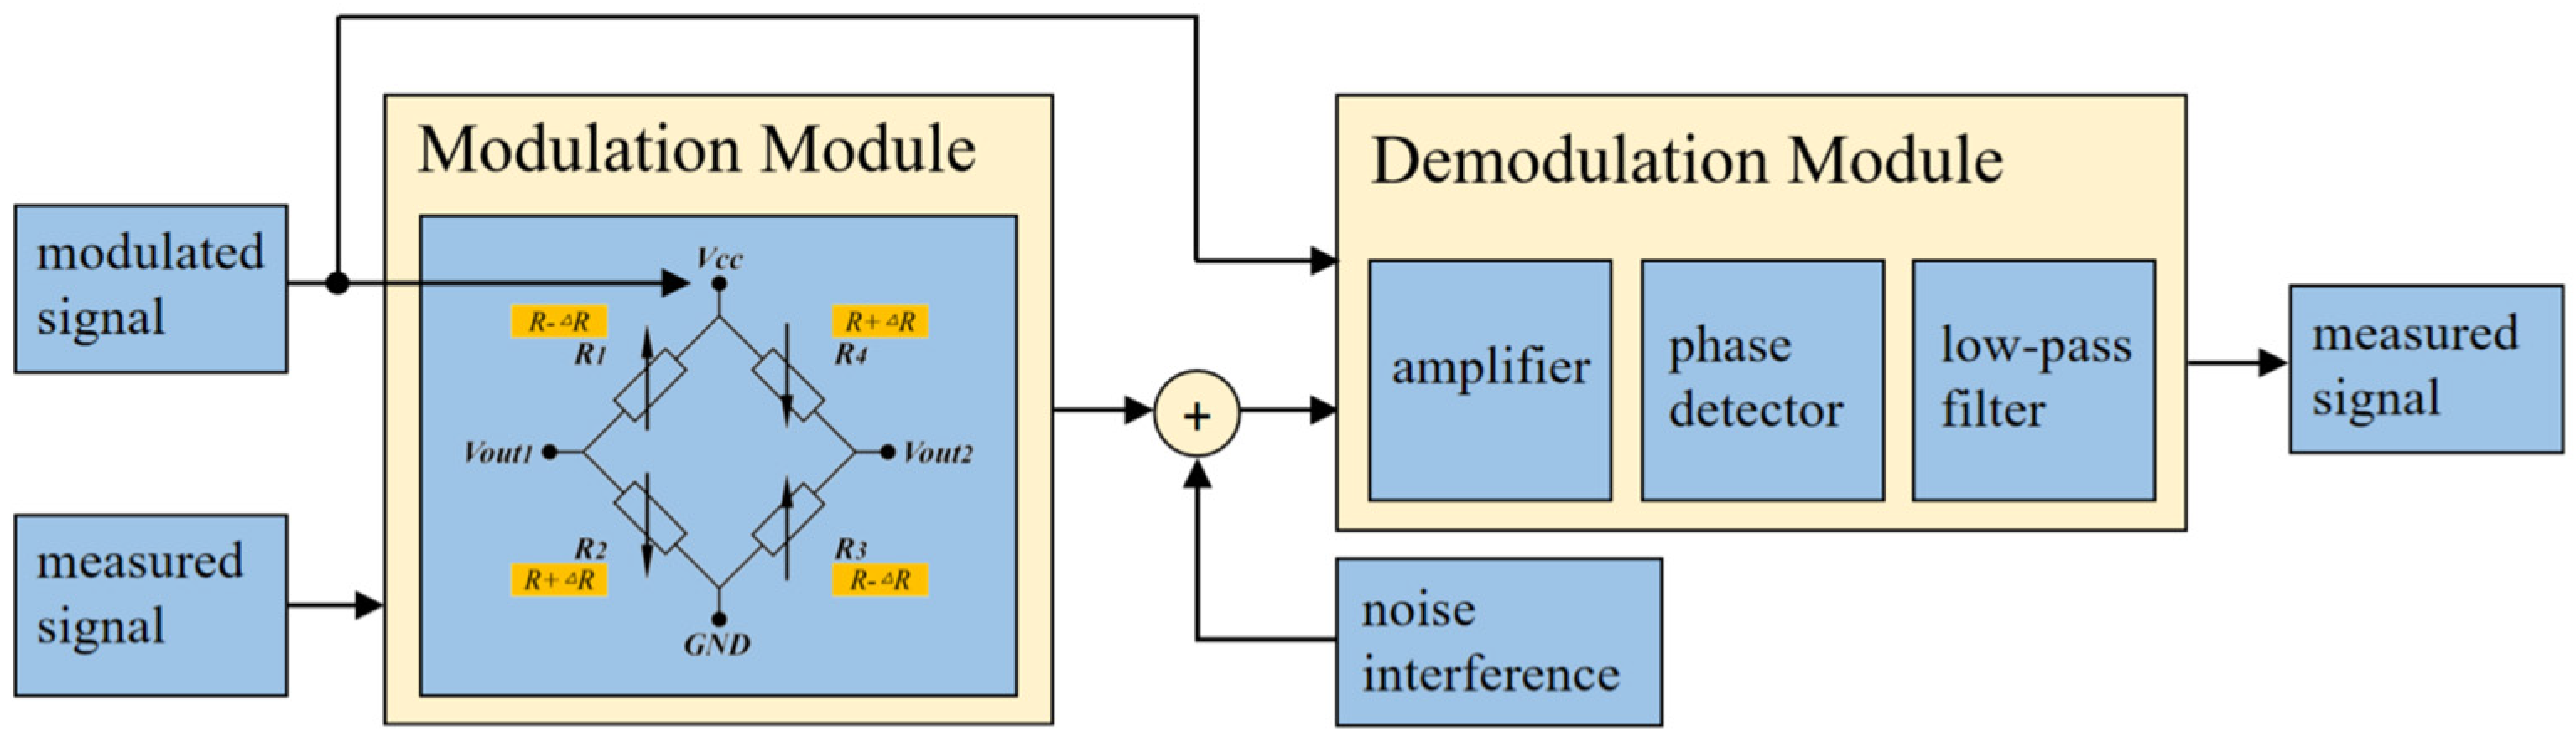
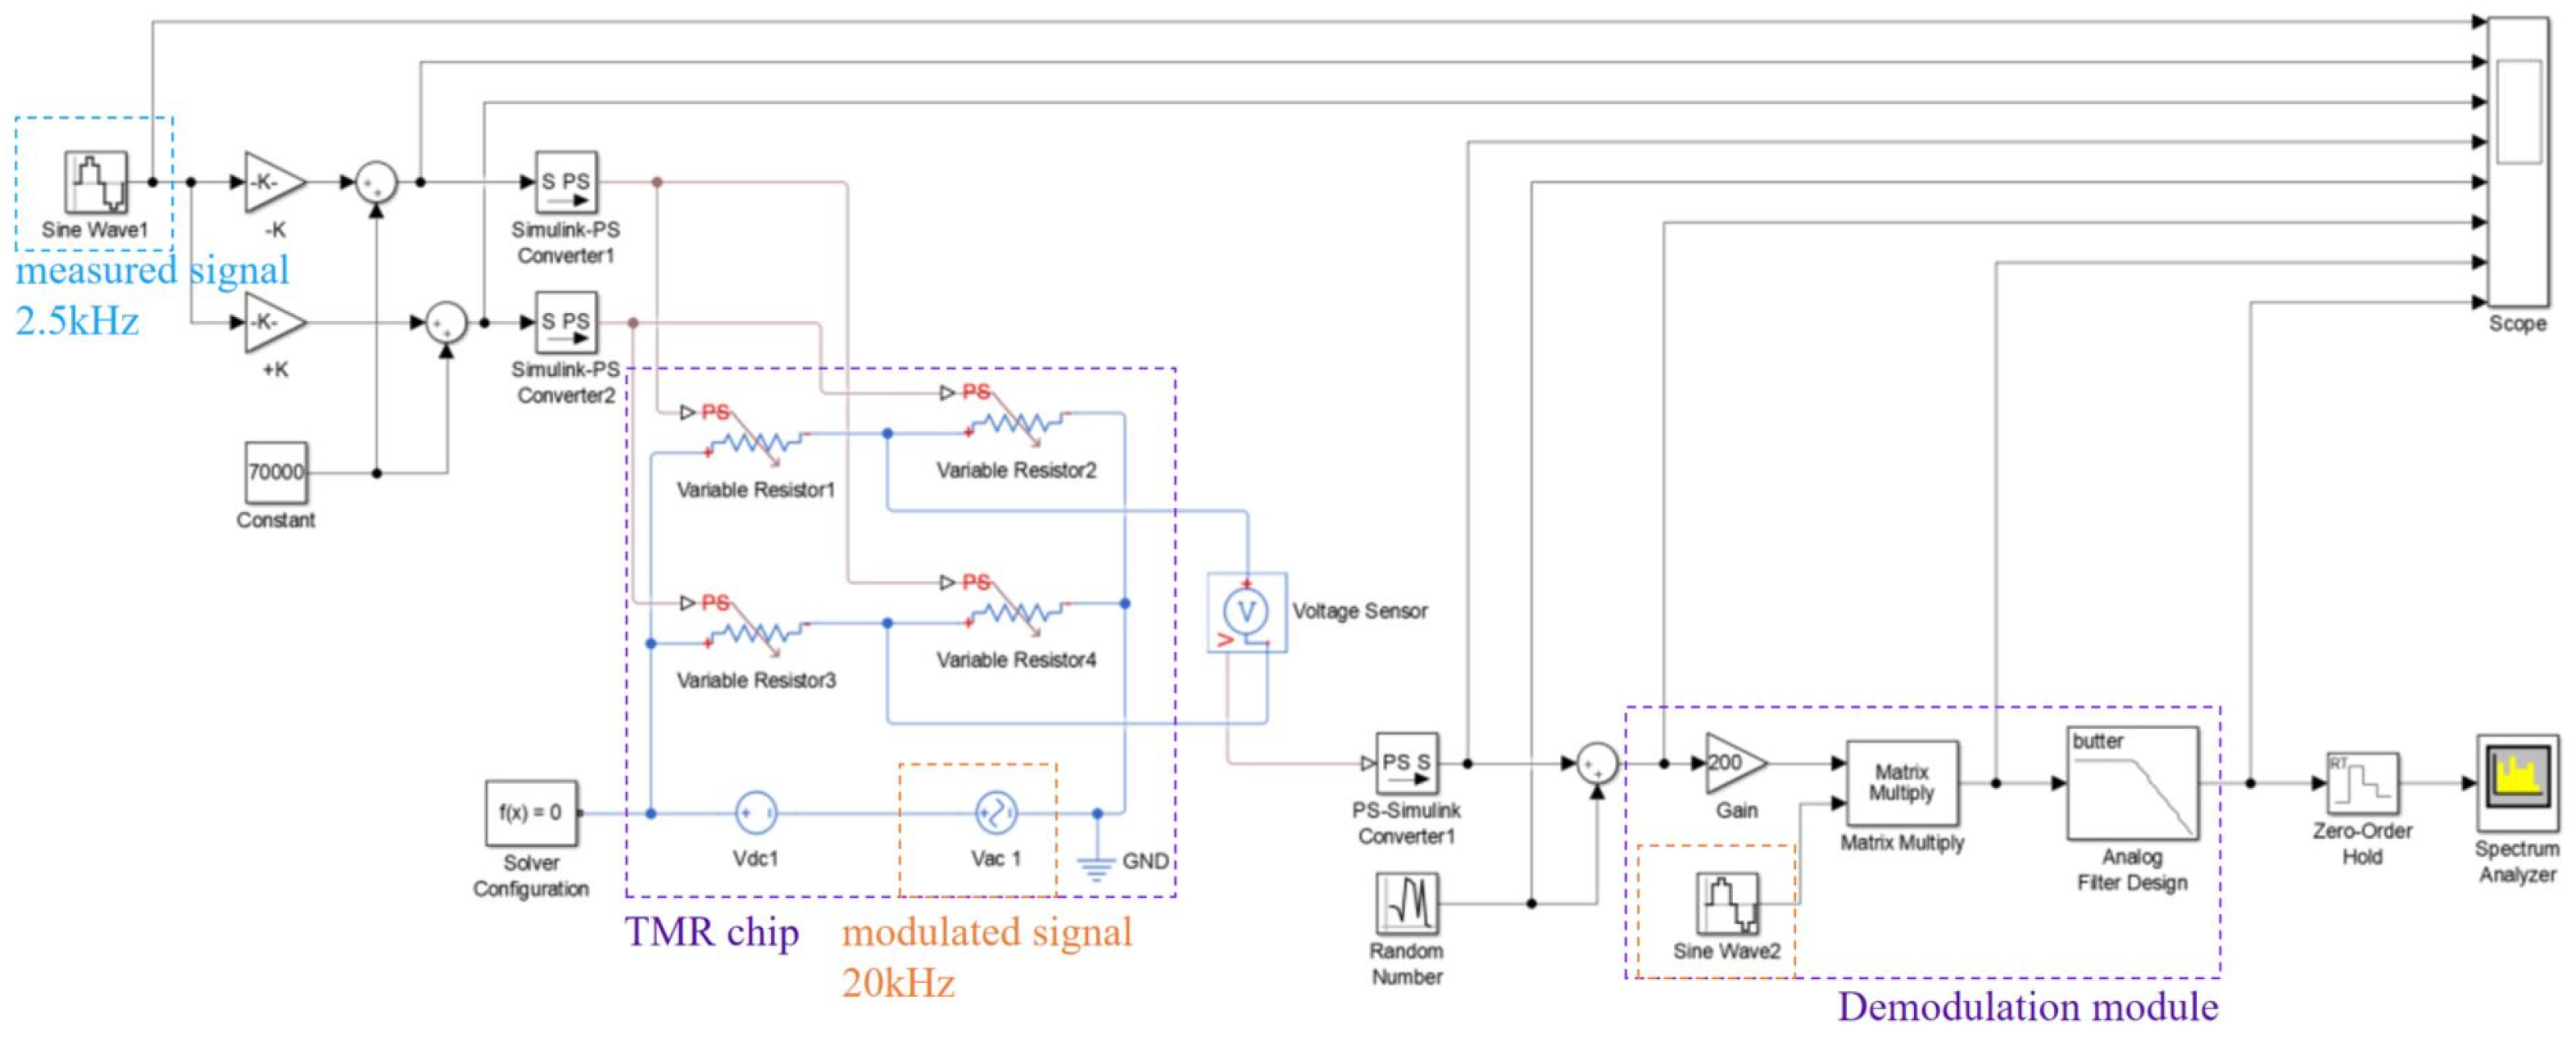
3.1. Analysis of TMR Current Sensor Modulating Test Method
3.2. Simulation of TMR Current Sensor Modulating Method
4. Experiment and Discussion
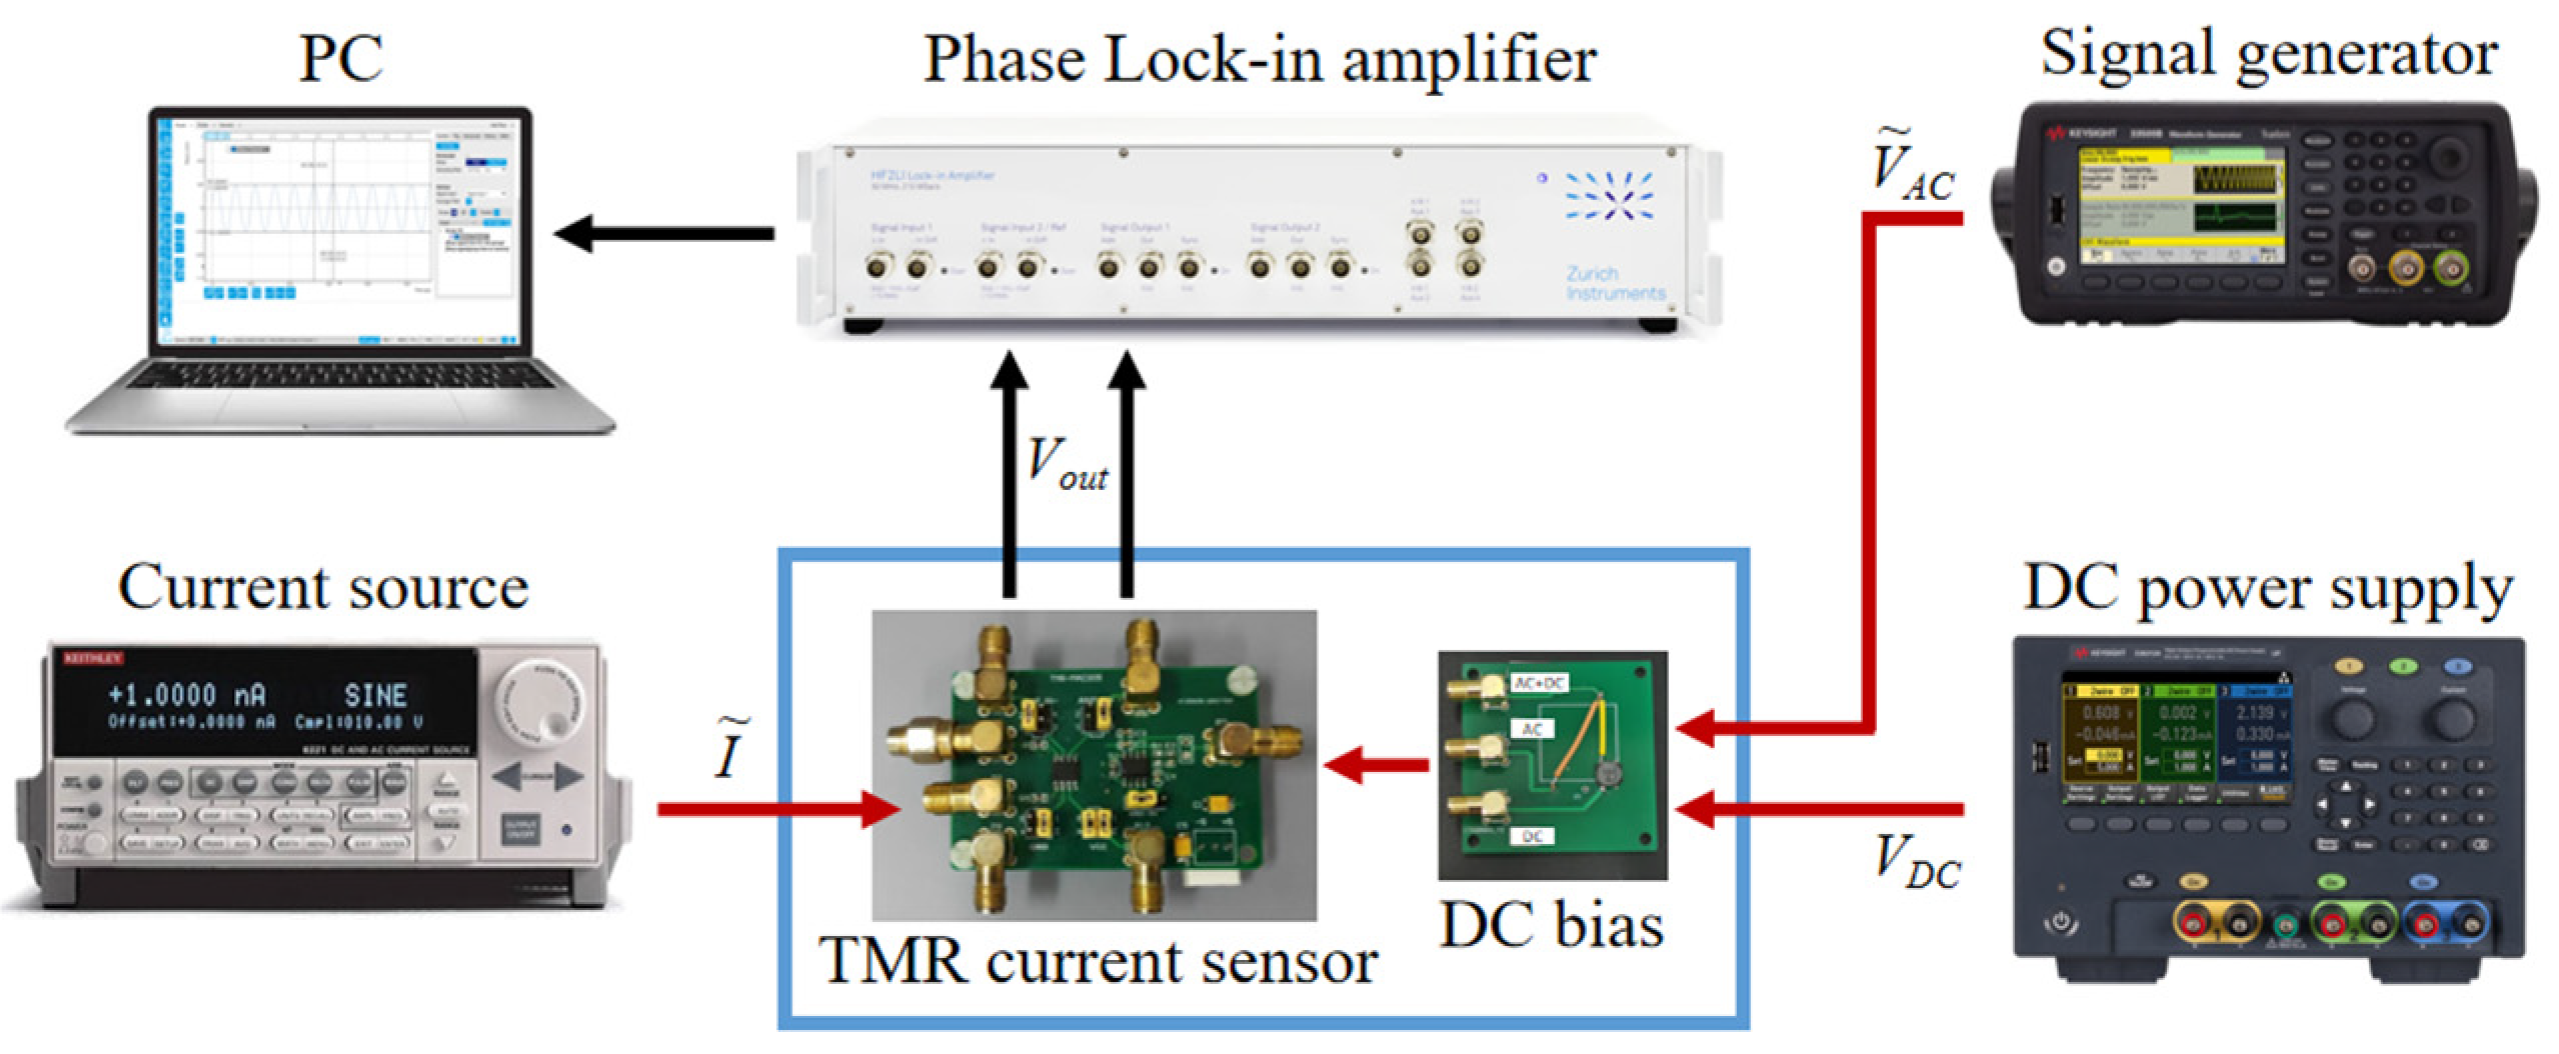
4.1. Testing System
4.2. Results
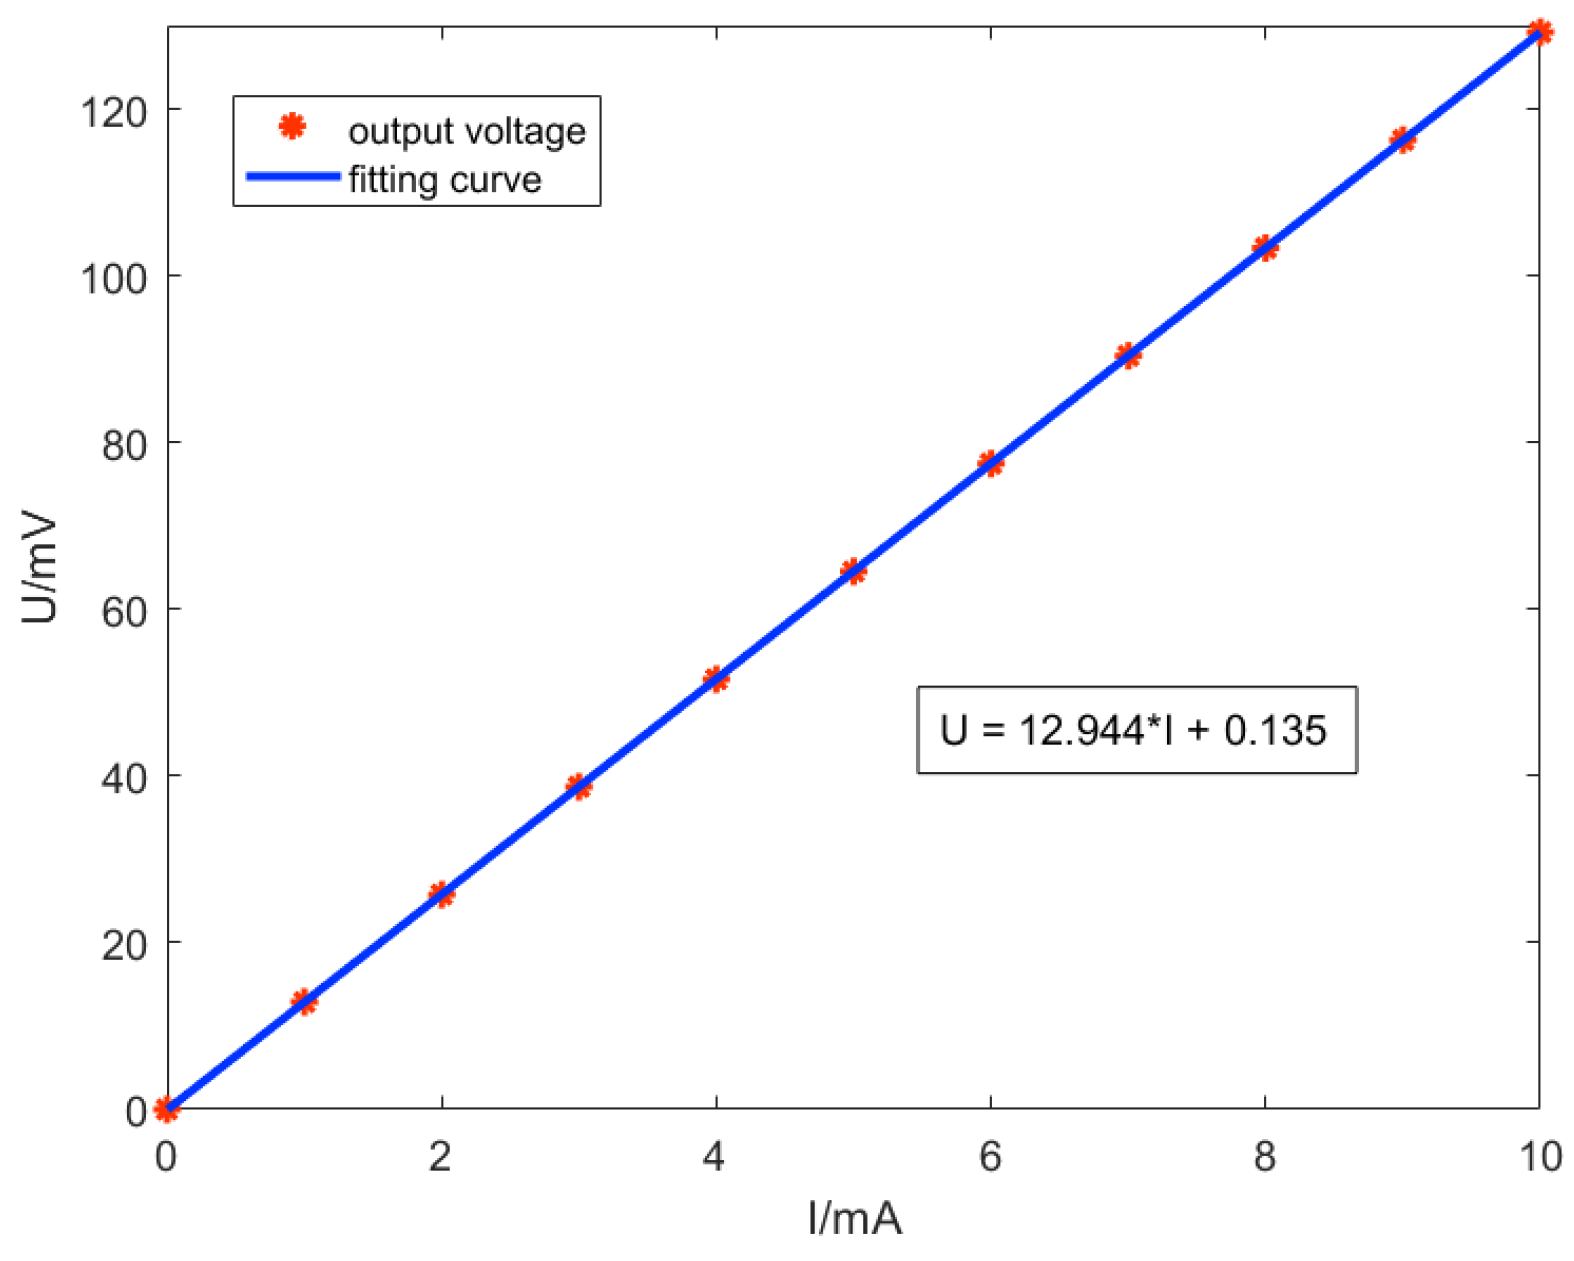
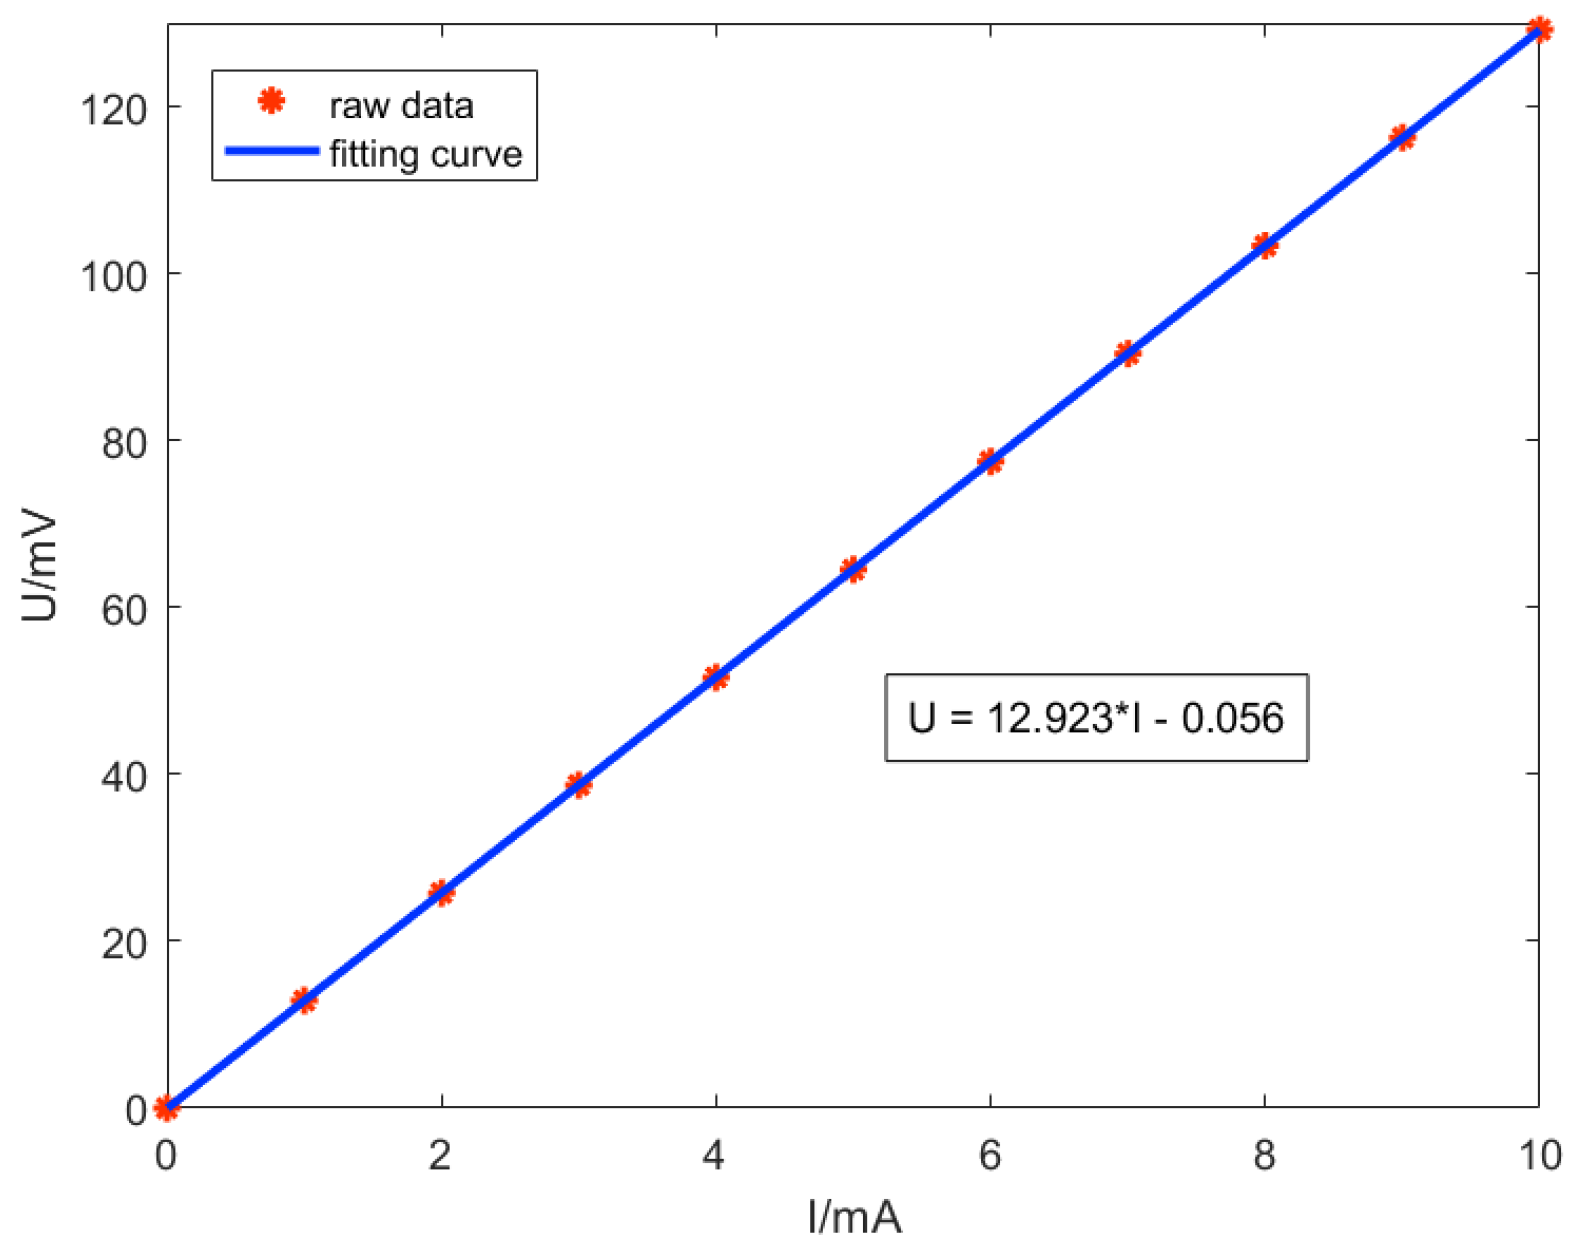
4.2.1. Sensitivity
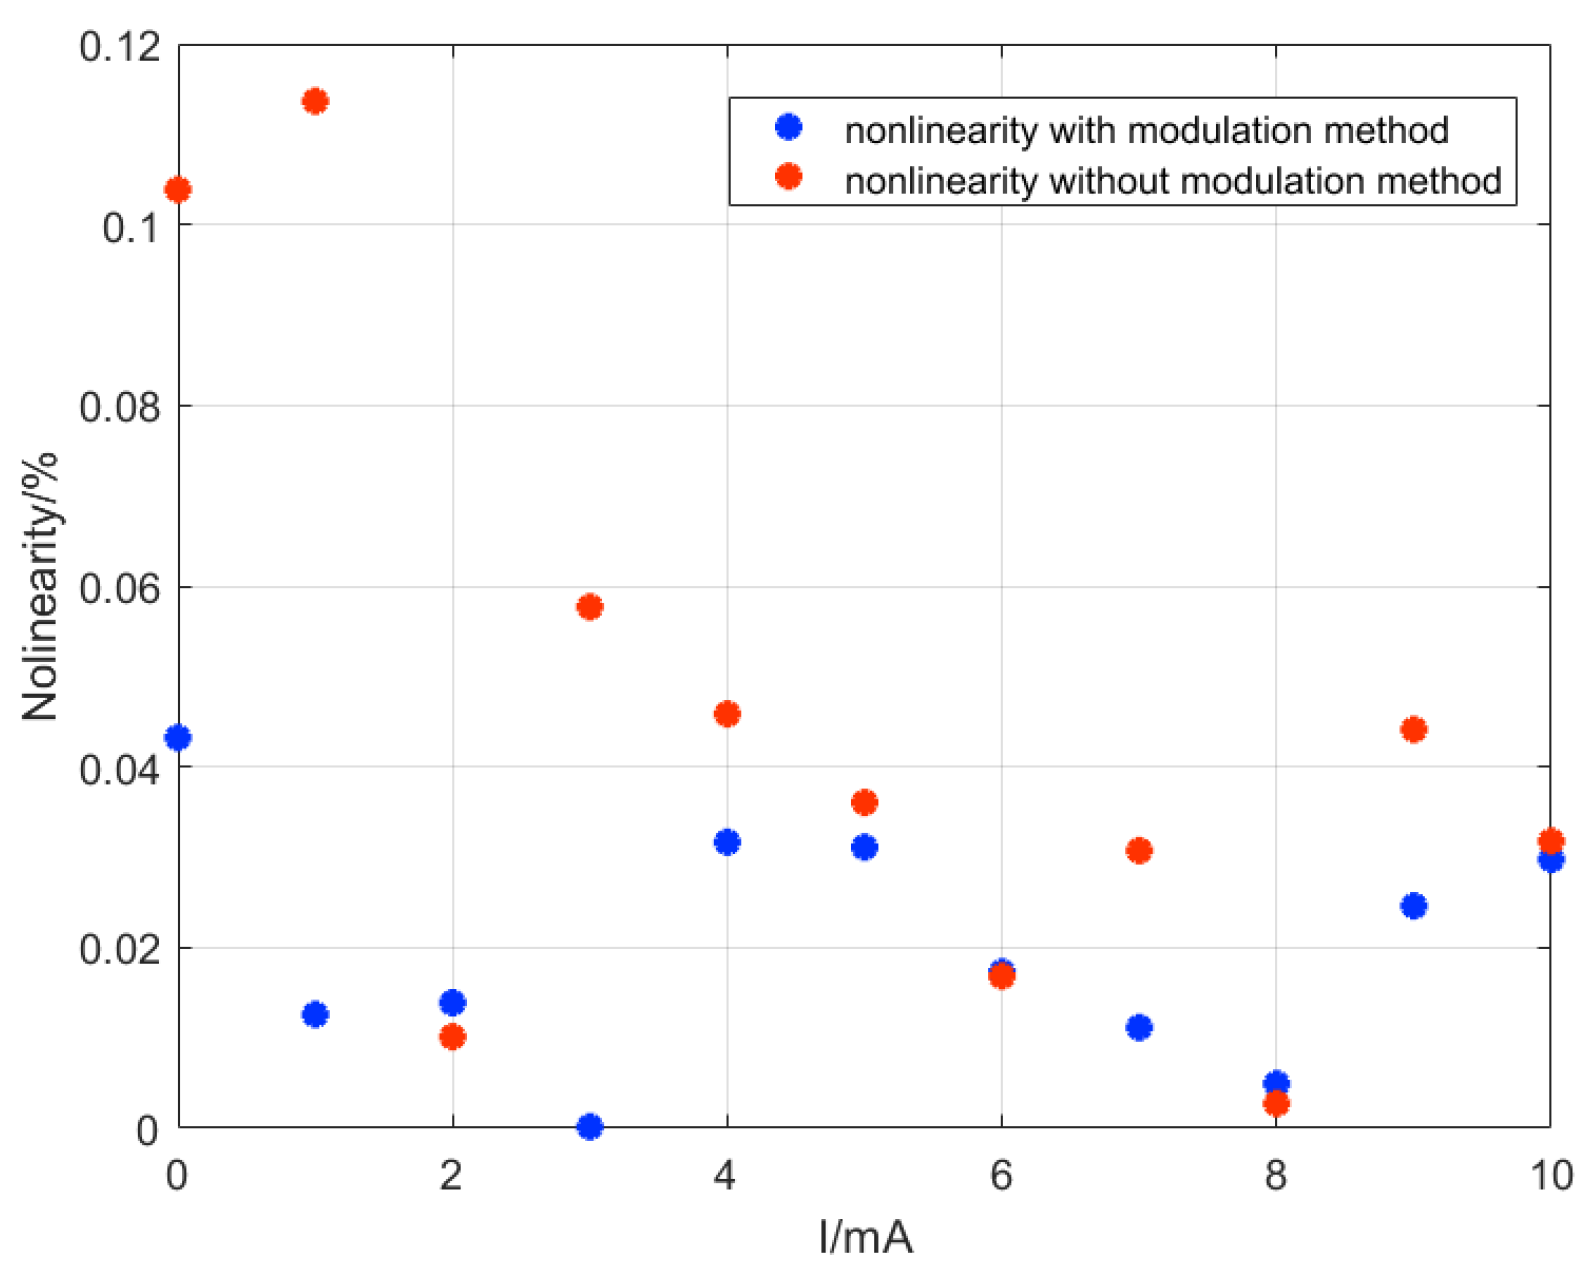
4.2.2. Nonlinearity
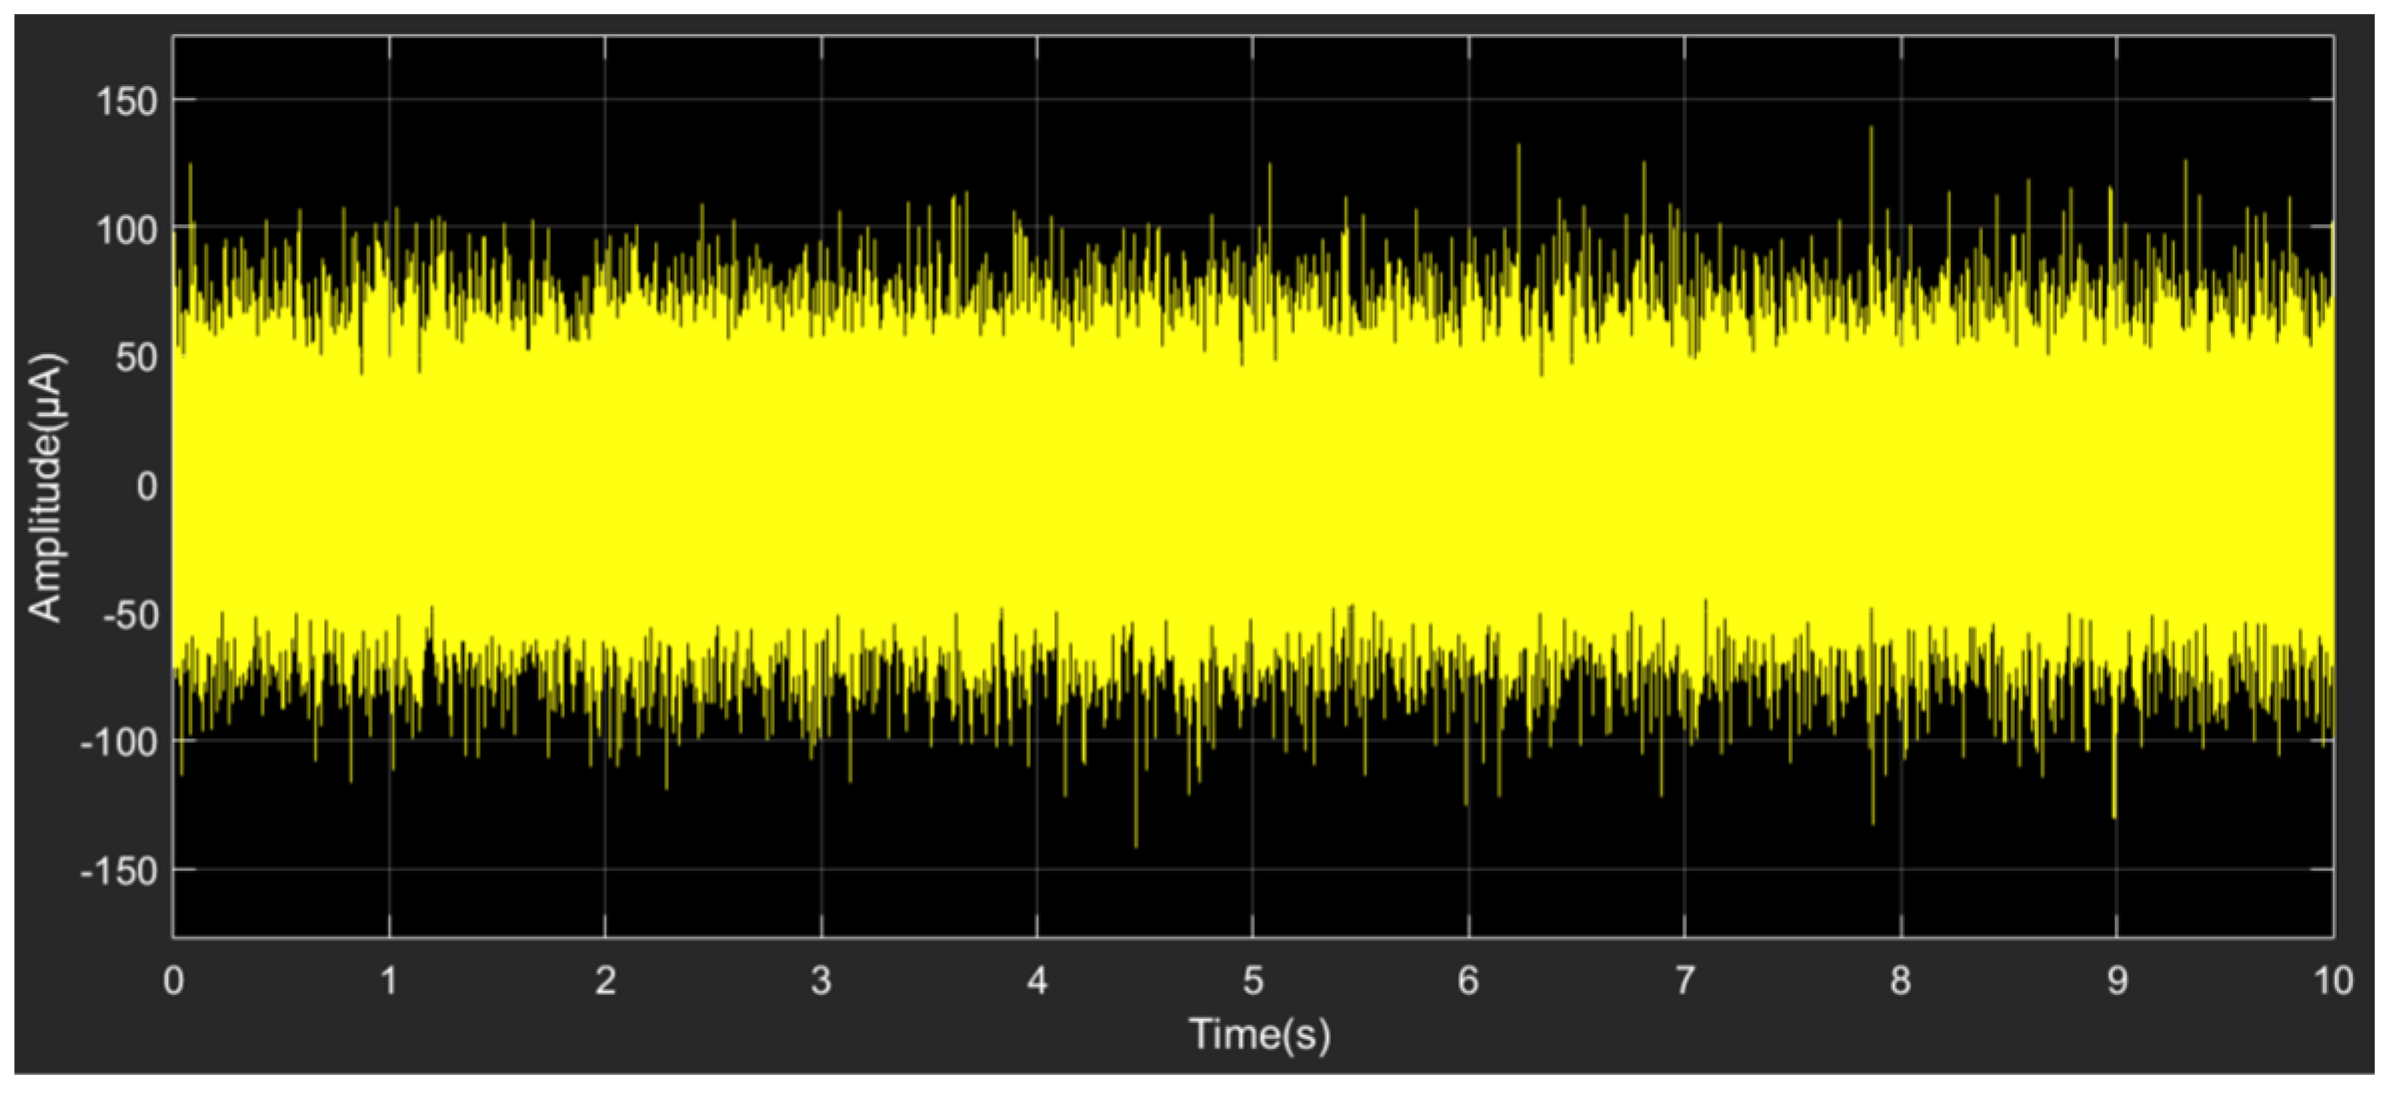
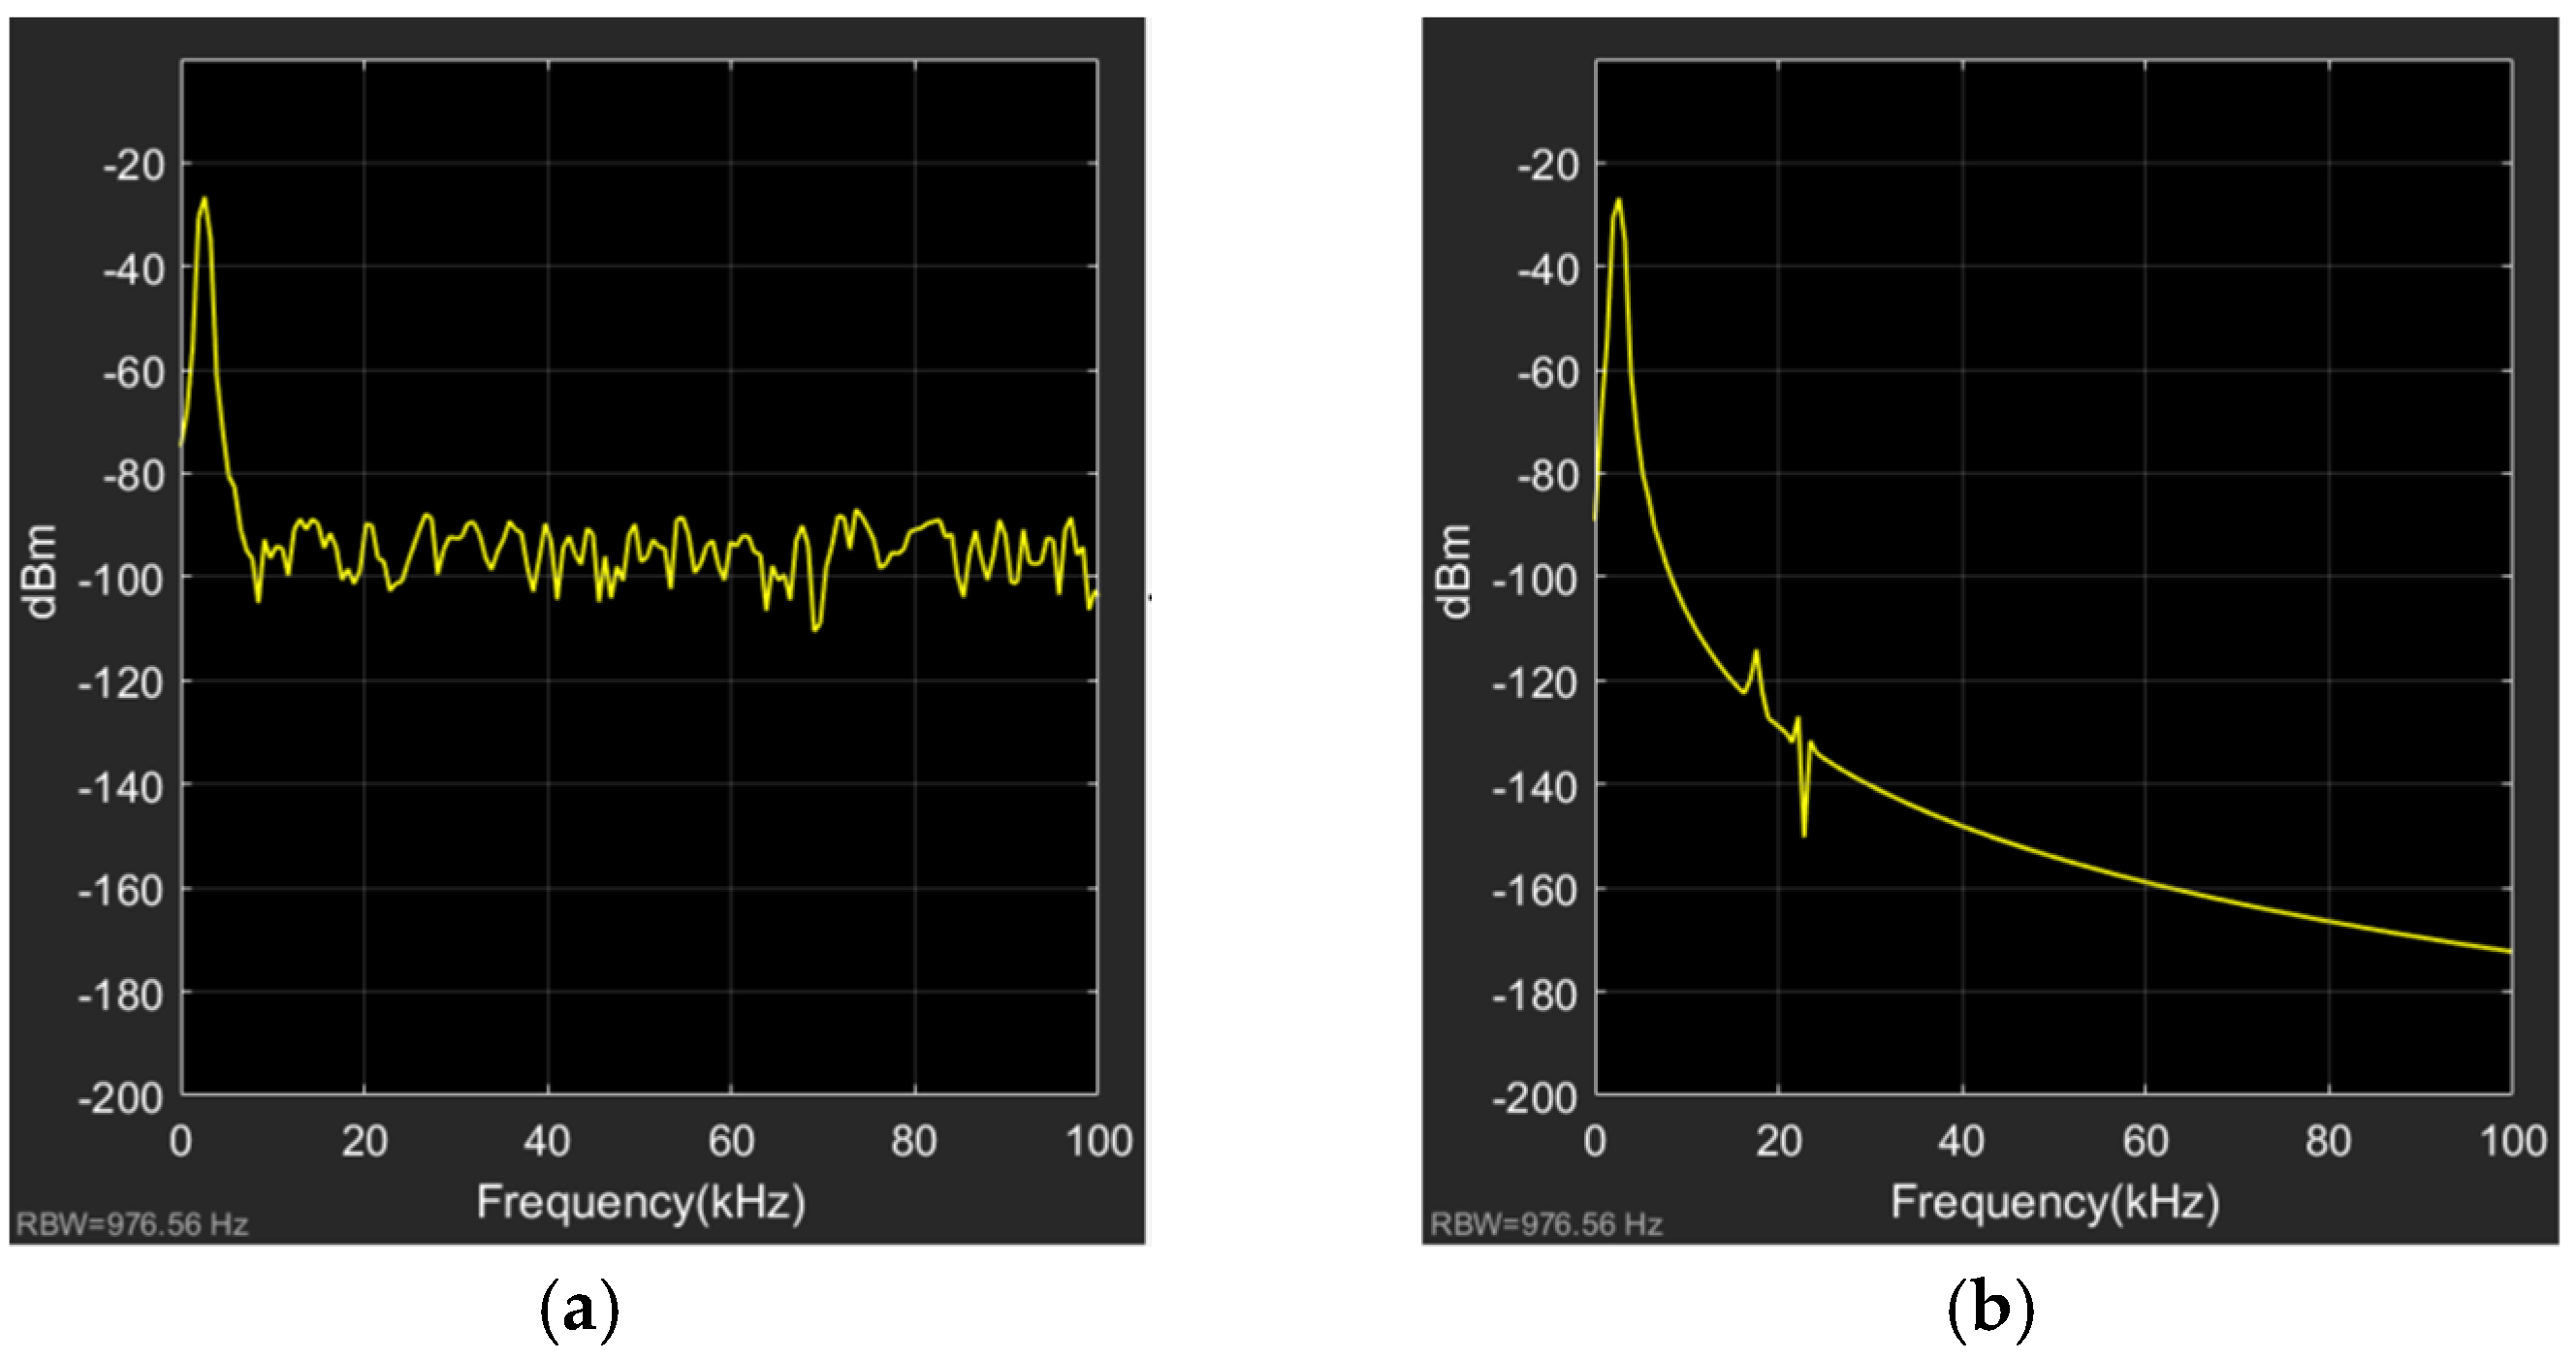
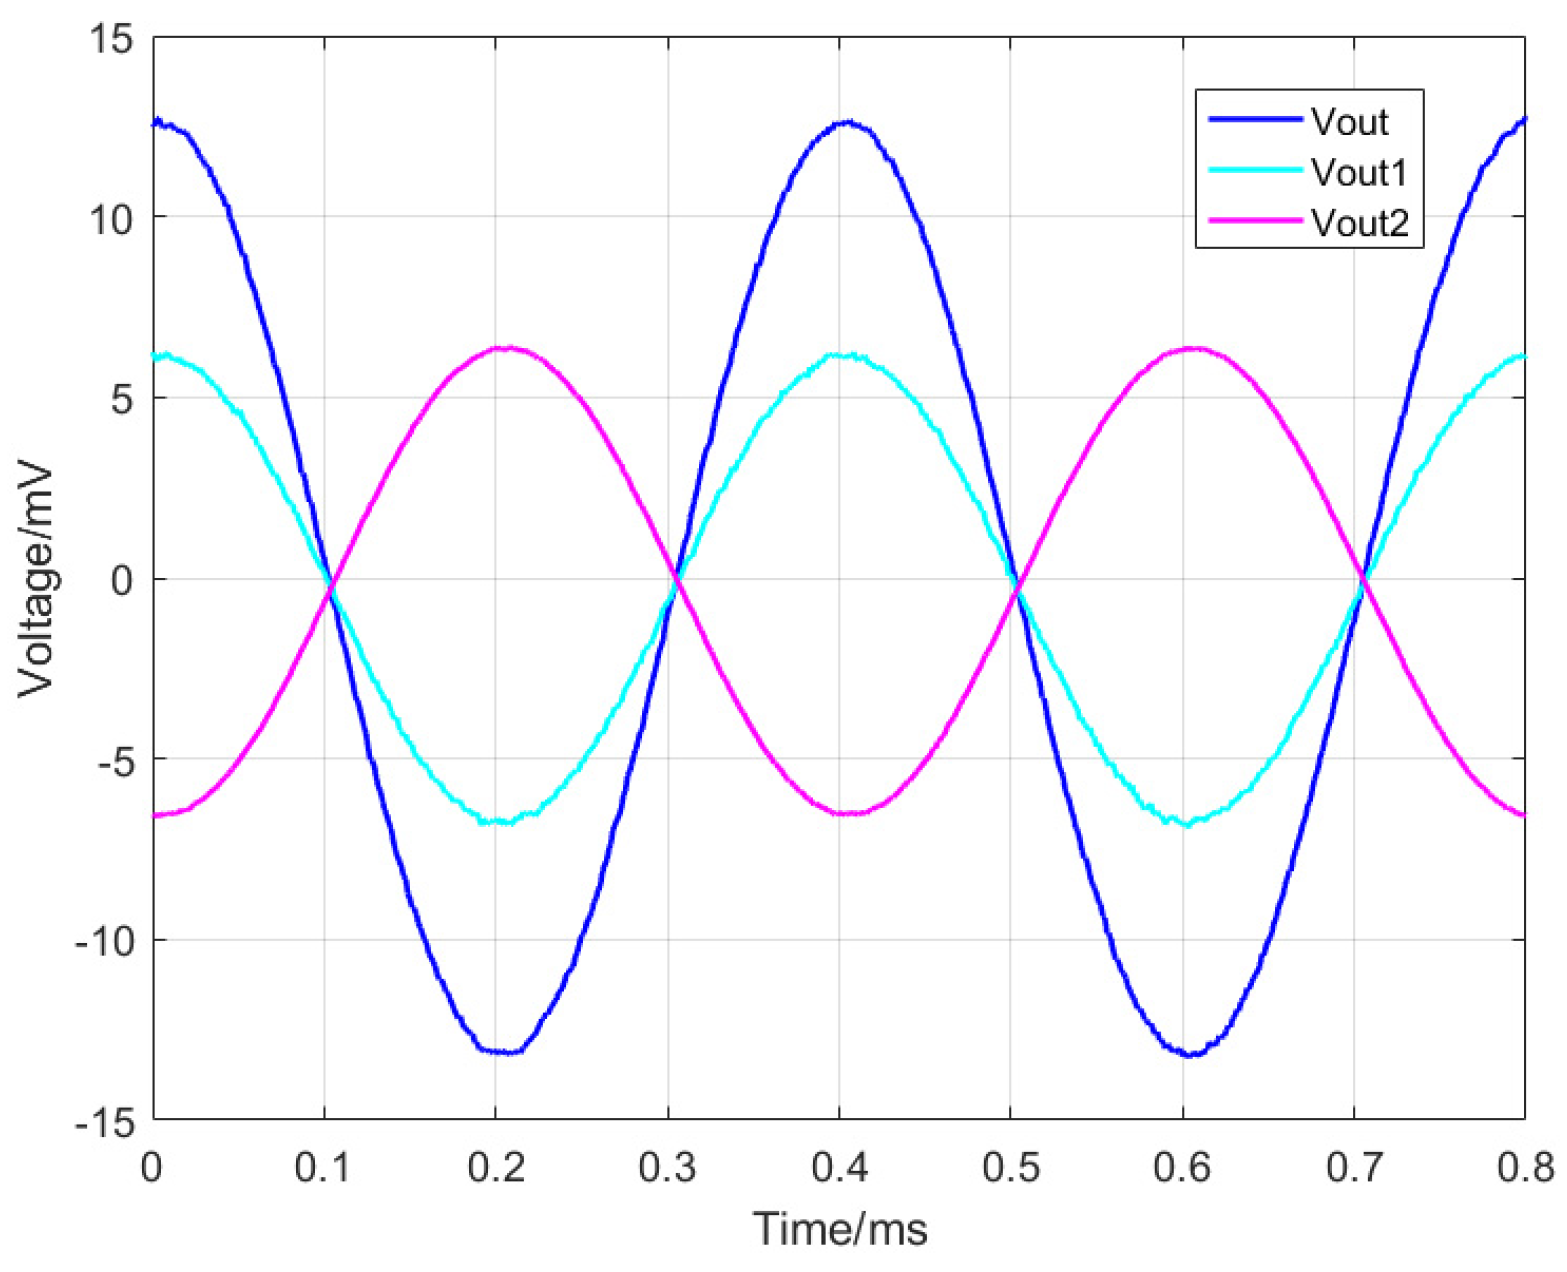
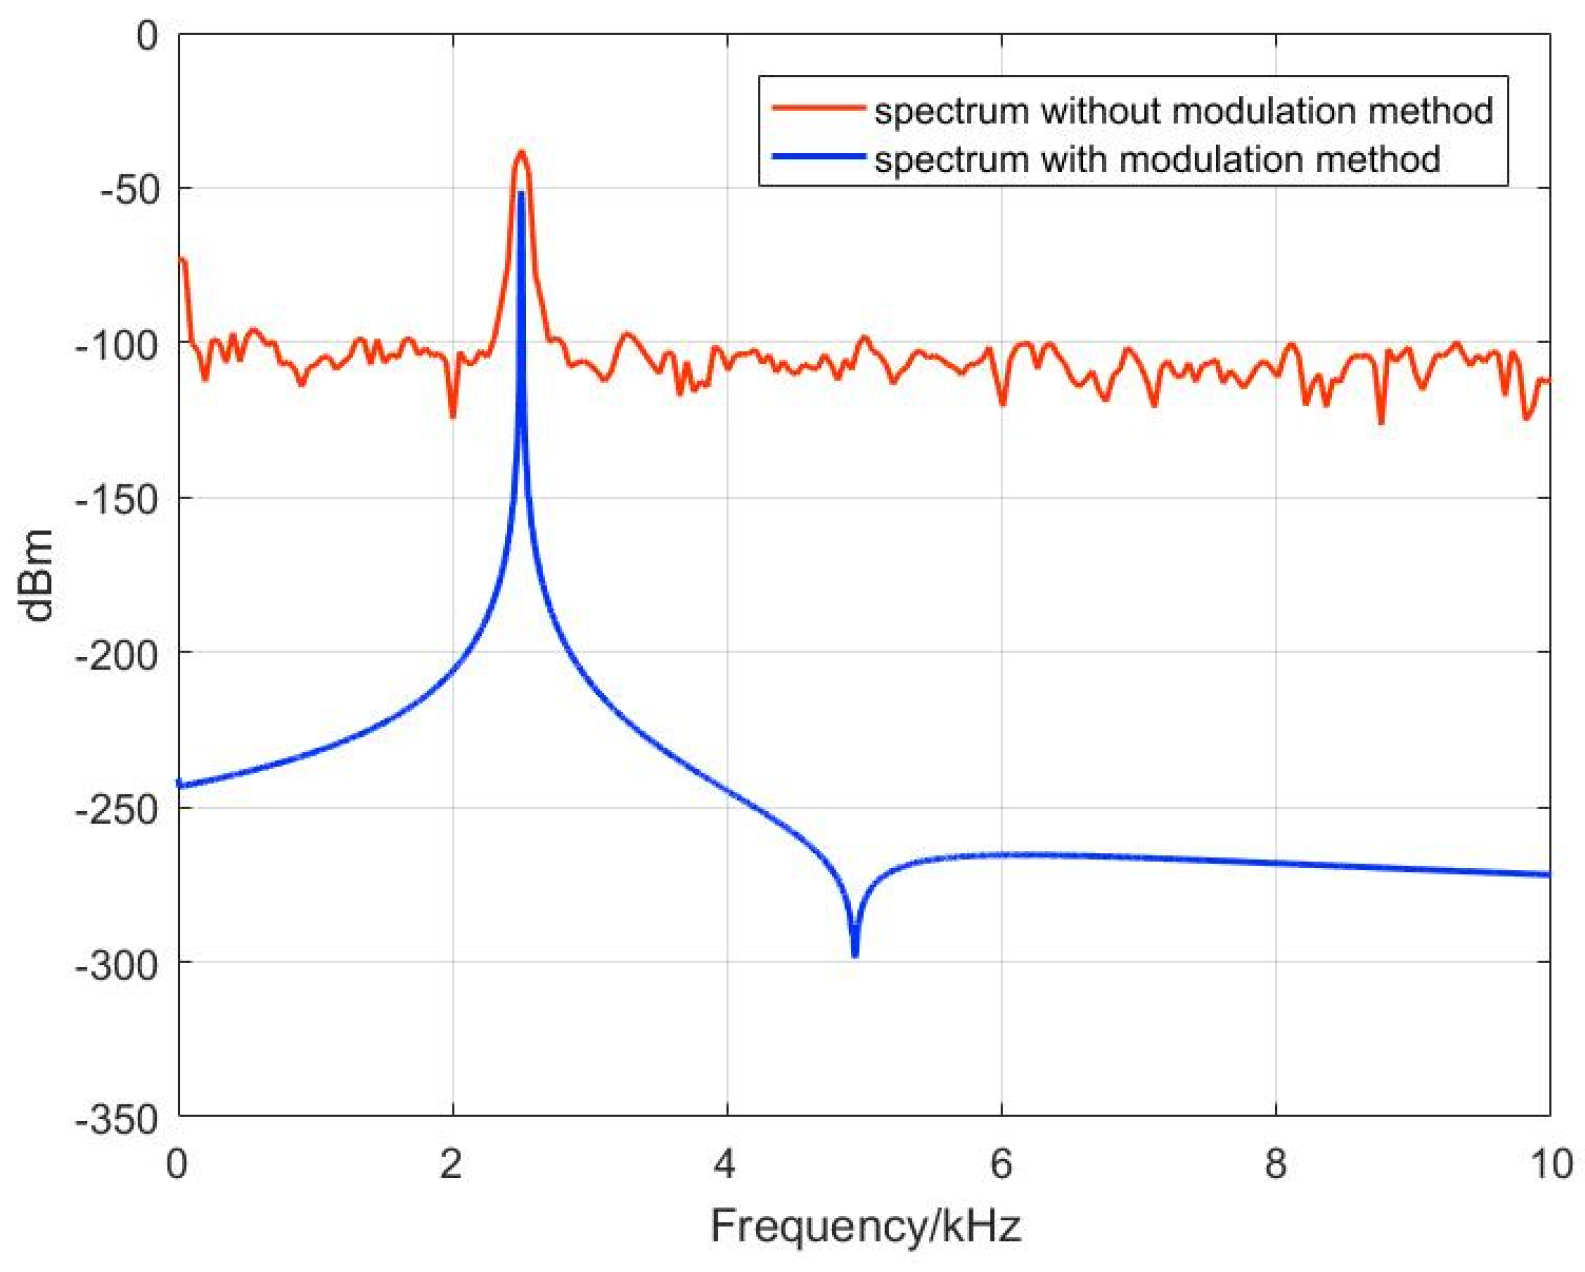
4.2.3. Spectrum
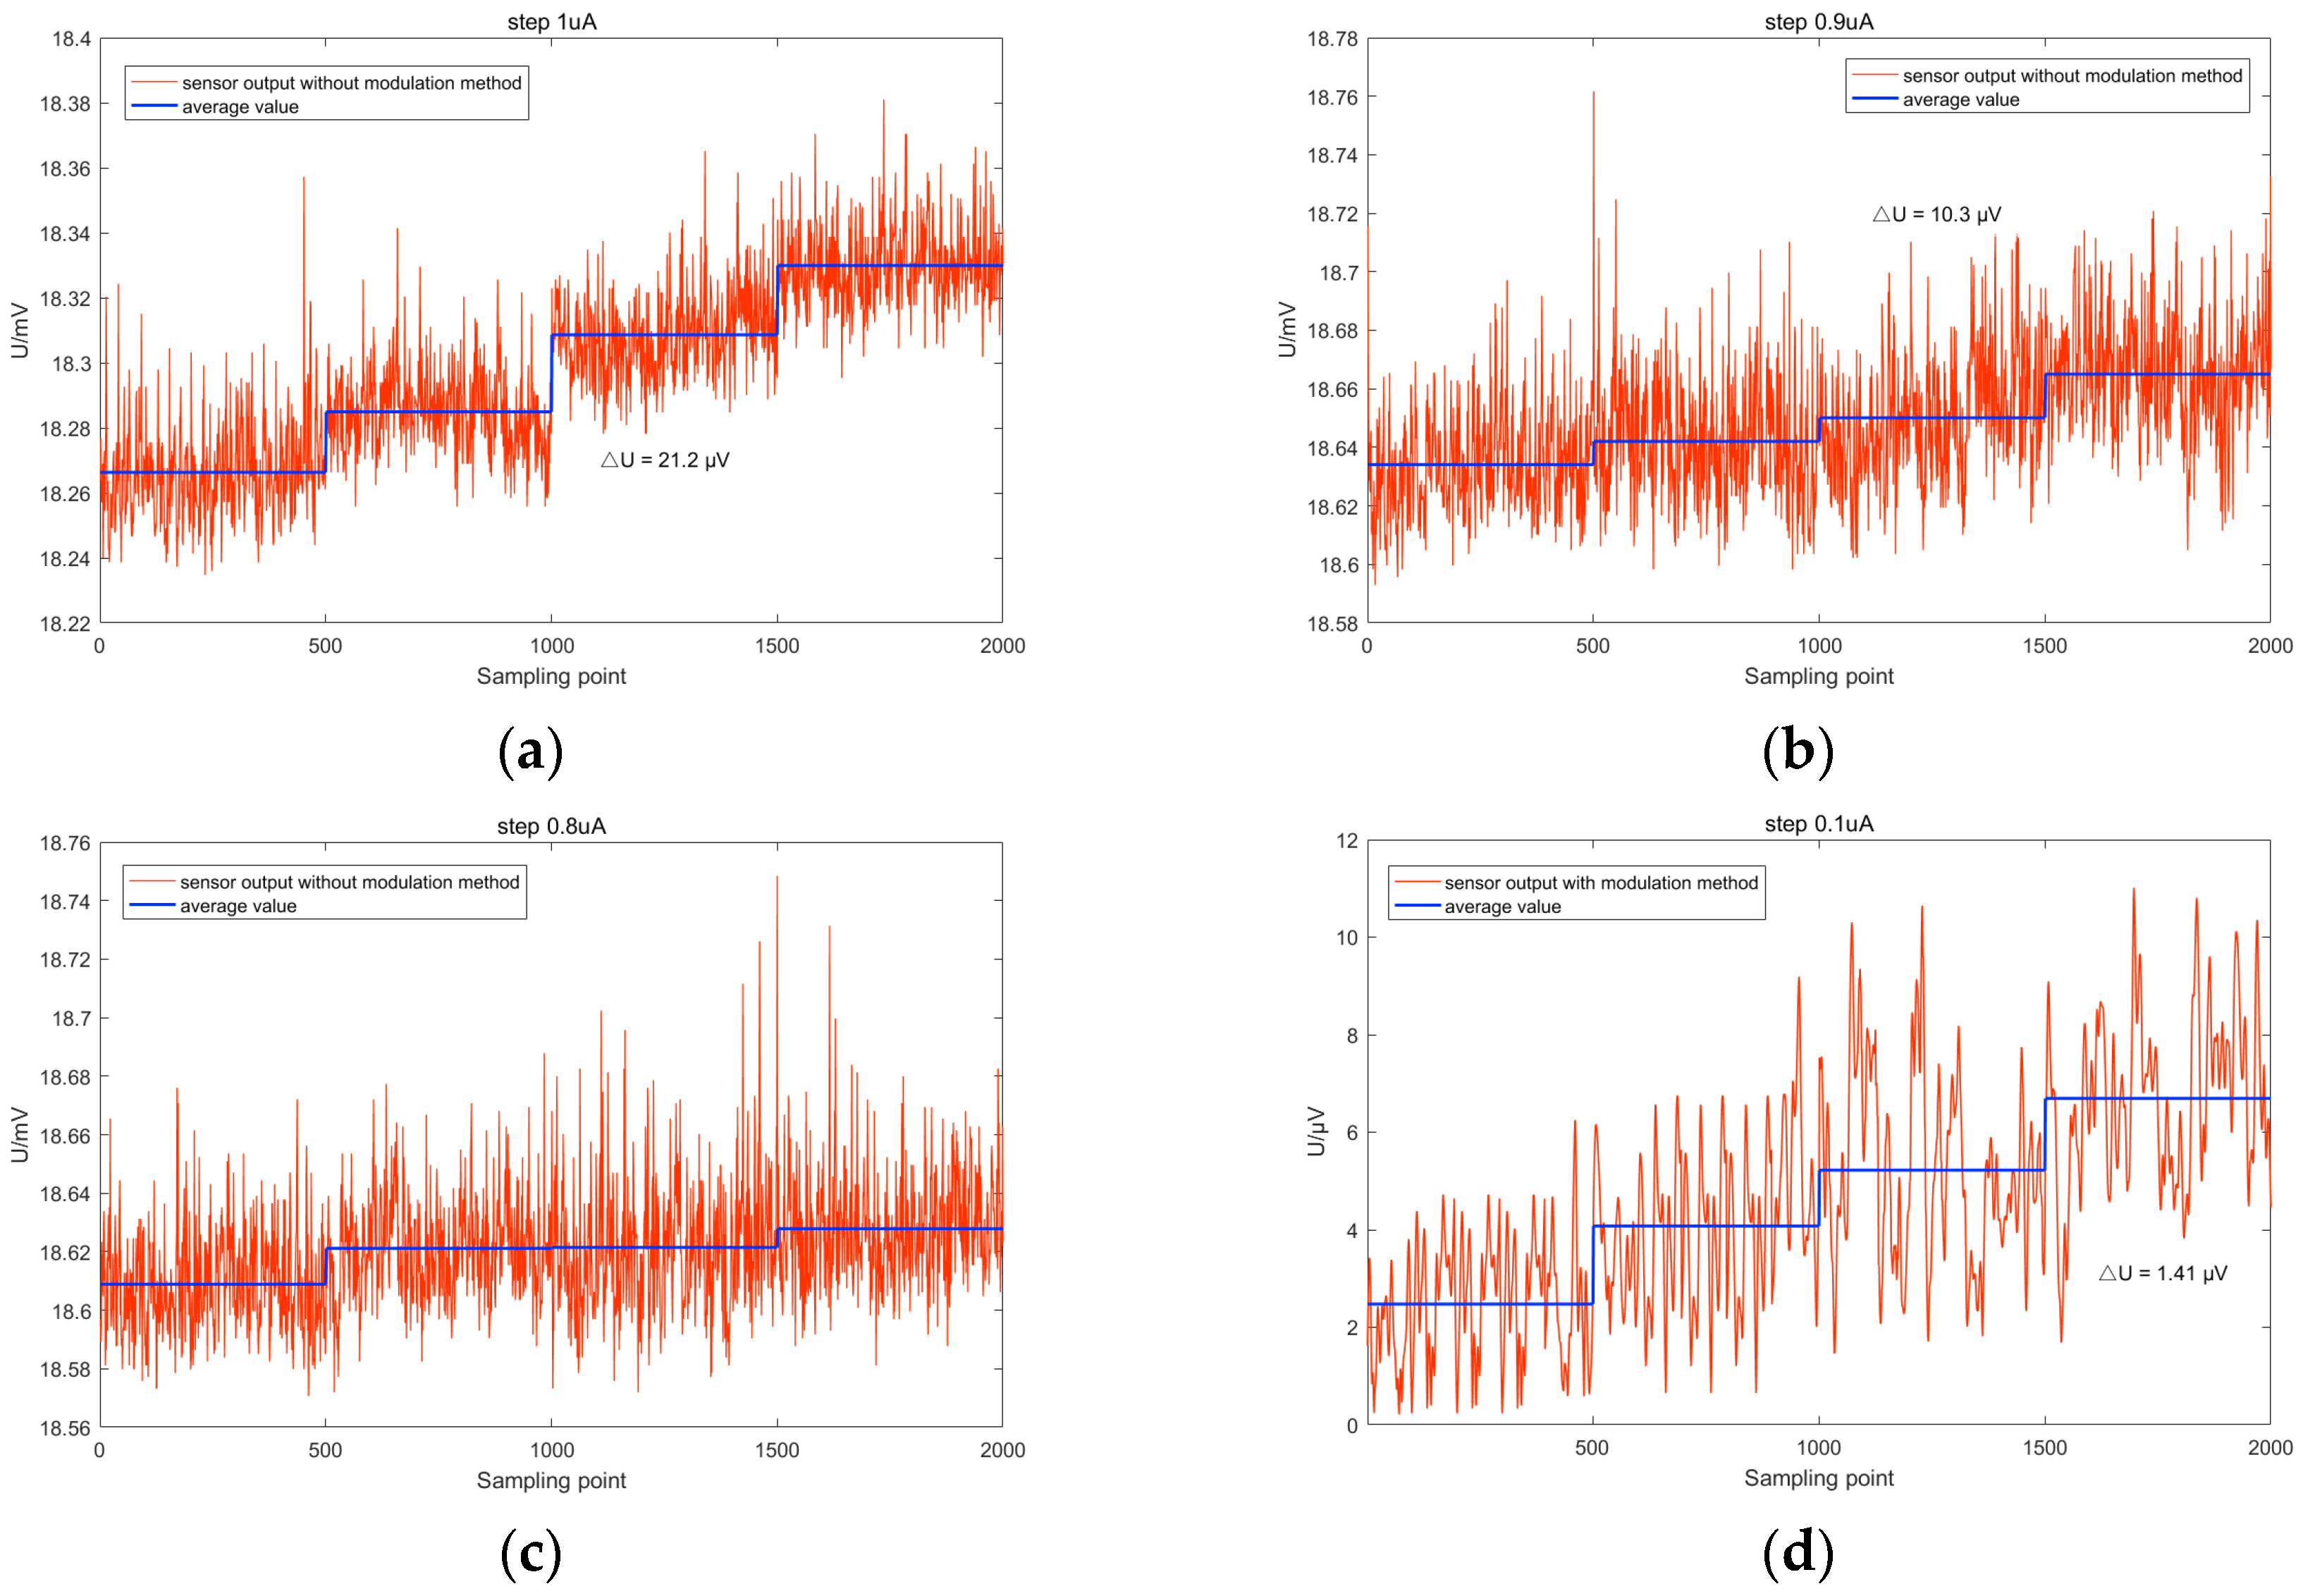
4.2.4. Resolution
5. Conclusions
Author Contributions
Funding
Data Availability Statement
Conflicts of Interest
References
- Dong, T.; Qu, T.; Qin, W.; Pan, Y.; Sheng, Y.; Hong, Z.; Xu, J. A 3.5 MHz-BW 128nTrms Resolution TMR readout using ping-pong auto-zeroing and SAR-assisted offset calibration for contactless current sensing. In Proceeding of IEEE 49th European Solid State Circuits Conference, Lisbon, Portugal, 11–14 September 2023. [Google Scholar]
- Lim, S.; Seok, C.; Kim, H.; Song, H.; Ko, H. A fully integrated electroencephalogram (EEG) analog front-end IC with capacitive input impedance boosting loop. In Proceedings of the IEEE 2014 Custom Integrated Circuits Conference, San Jose, CA, USA, 15–17 September 2014. [Google Scholar]
- Im, S.; Seok, C.; Kim, H.; Song, H.; Ko, H.; Cho, D.I.D. A versatile biopotential acquisition analog front end IC with effective DC offset and ripple rejection. In Proceedings of the 2014 International Symposium on Integrated Circuits (ISIC), Singapore, 10–12 December 2014. [Google Scholar]
- Han, M.; Kim, B.; Chen, Y.; Lee, H.; Park, S.H.; Cheong, E.; Hong, J.; Han, G.; Chae, Y. Bulk Switching Instrumentation Amplifier for a High-Impedance Source in Neural Signal Recording. IEEE Trans. Circuits Syst. II Express Briefs 2015, 62, 194–198. [Google Scholar] [CrossRef]
- Stan, M.N.; Creosteanu, L.; Brezeanu, G. High precision bidirectional chopper instrumentation amplifier with negative and positive input common mode range. In Proceedings of the 2014 10th Conference on Ph.D. Research in Microelectronics and Electronics (PRIME), Grenoble, France, 30 June–3 July 2014. [Google Scholar]
- Khatavkar, P.; Aniruddhan, S. 552 nW per channel 79 nV/rtHz ECG acquisition front-end with multi-frequency chopping. In Proceedings of the 2014 IEEE Biomedical Circuits and Systems Conference (BioCAS) Proceedings, Lausanne, Switzerland, 22–24 October 2014. [Google Scholar]
- Fan, Q.; Huijsing, J.H.; Makinwa, K.A.A. A 21 nV/√ Hz chopper-stabilized multi-path current-feedback instrumentation amplifier with 2 μV offset. IEEE J. Solid-State Circuits 2012, 47, 464–475. [Google Scholar]
- Kwon, Y.; Kim, H.; Kim, J.; Han, K.; You, D.; Heo, H.; Cho, D.I.D.; Ko, H. Fully differential chopper-stabilized multipath current-feedback instrumentation amplifier with R-2R DAC offset adjustment for resistive bridge sensors. Appl. Sci. 2020, 10, 63. [Google Scholar] [CrossRef]
- Xie, P.; Duan, Q.; Meng, Z.; Huang, S.; Ding, Y.; Han, L. A low-noise, low-power, and chopper-stabilized, current-feedback instrumentation amplifier for current sensing application. In Proceedings of the 2019 IEEE 4th International Conference on Integrated Circuits and Microsystems (ICICM), Beijing, China, 25–27 October 2019. [Google Scholar]
- Samiei, A.; Hashemi, H. A chopper stabilized, current feedback, neural recording amplifier. IEEE Solid-State Circuits Lett. 2019, 2, 17–20. [Google Scholar] [CrossRef] [PubMed]
- Yoo, M.; Kwon, Y.; Kim, H.; Choi, G.; Nam, K.; Ko, H. Low-noise resistive bridge sensor analog front-end using chopper-stabilized multipath current feedback instrumentation amplifier and automatic offset cancellation loop. IEEE Access 2022, 10, 12385–12394. [Google Scholar] [CrossRef]
- Li, X.; Yin, L.; Chen, W.; Liu, X.; Fu, Q. Study of a three-axis digital tunneling resistance-type magnetic sensor. IEICE Electron. Express 2016, 13, 20160319. [Google Scholar] [CrossRef][Green Version]
- Li, X.; Yin, L.; Chen, W.; Gao, Z.; Liu, X. A high-resolution tunneling magneto-resistance sensor interface circuit. Mod. Phys. Lett. B 2017, 31, 1750030. [Google Scholar] [CrossRef]
- Liu, Z.; Chen, J.; Zou, X. Magnetic flux synchronous motion modulation for improving the low-frequency magnetic field detection limit of magnetoresistive sensor using MEMS resonators. IEEE Trans. Magn. 2022, 58, 1–5. [Google Scholar] [CrossRef]
- Liu, Z.; Chen, J.; Yang, W.; Zheng, T.; Jiao, Q.; Zou, X. Dynamic behaviours of double-ended tuning fork based comb-driven microelectromechanical resonators for modulating magnetic flux synchronously. J. Micromech. Microeng. 2022, 32, 014003. [Google Scholar] [CrossRef]


Disclaimer/Publisher’s Note: The statements, opinions and data contained in all publications are solely those of the individual author(s) and contributor(s) and not of MDPI and/or the editor(s). MDPI and/or the editor(s) disclaim responsibility for any injury to people or property resulting from any ideas, methods, instructions or products referred to in the content. |
© 2024 by the authors. Licensee MDPI, Basel, Switzerland. This article is an open access article distributed under the terms and conditions of the Creative Commons Attribution (CC BY) license (https://creativecommons.org/licenses/by/4.0/).
Share and Cite
Wang, S.; Huang, H.; Yang, Y.; Chen, Y.; Fu, Z.; Jin, Z.; Shi, Z.; Xiong, X.; Zou, X.; Chen, J. A Modulation Method for Tunnel Magnetoresistance Current Sensors Noise Suppression. Micromachines 2024, 15, 360. https://doi.org/10.3390/mi15030360
Wang S, Huang H, Yang Y, Chen Y, Fu Z, Jin Z, Shi Z, Xiong X, Zou X, Chen J. A Modulation Method for Tunnel Magnetoresistance Current Sensors Noise Suppression. Micromachines. 2024; 15(3):360. https://doi.org/10.3390/mi15030360
Chicago/Turabian StyleWang, Shuaipeng, Haichao Huang, Ying Yang, Yanning Chen, Zhen Fu, Zhenhu Jin, Zhenyu Shi, Xingyin Xiong, Xudong Zou, and Jiamin Chen. 2024. "A Modulation Method for Tunnel Magnetoresistance Current Sensors Noise Suppression" Micromachines 15, no. 3: 360. https://doi.org/10.3390/mi15030360
APA StyleWang, S., Huang, H., Yang, Y., Chen, Y., Fu, Z., Jin, Z., Shi, Z., Xiong, X., Zou, X., & Chen, J. (2024). A Modulation Method for Tunnel Magnetoresistance Current Sensors Noise Suppression. Micromachines, 15(3), 360. https://doi.org/10.3390/mi15030360