
Laser-Produced Cavitation Bubble Behavior in Newtonian and Non-Newtonian Liquid Inside a Rigid Cylinder: Numerical Study of Liquid Disc Microjet Impact Using OpenFOAM

Abstract
1. Introduction
2. Theoretical Model
2.1. Bubble Model and Physical Assumptions
2.2. Characteristics of the Cavitation Bubble
2.3. Governing Equations
2.4. Equations of State
2.4.1. Liquid Phase Equation of State
2.4.2. Gas Phase Equation of State
3. Numerical Model
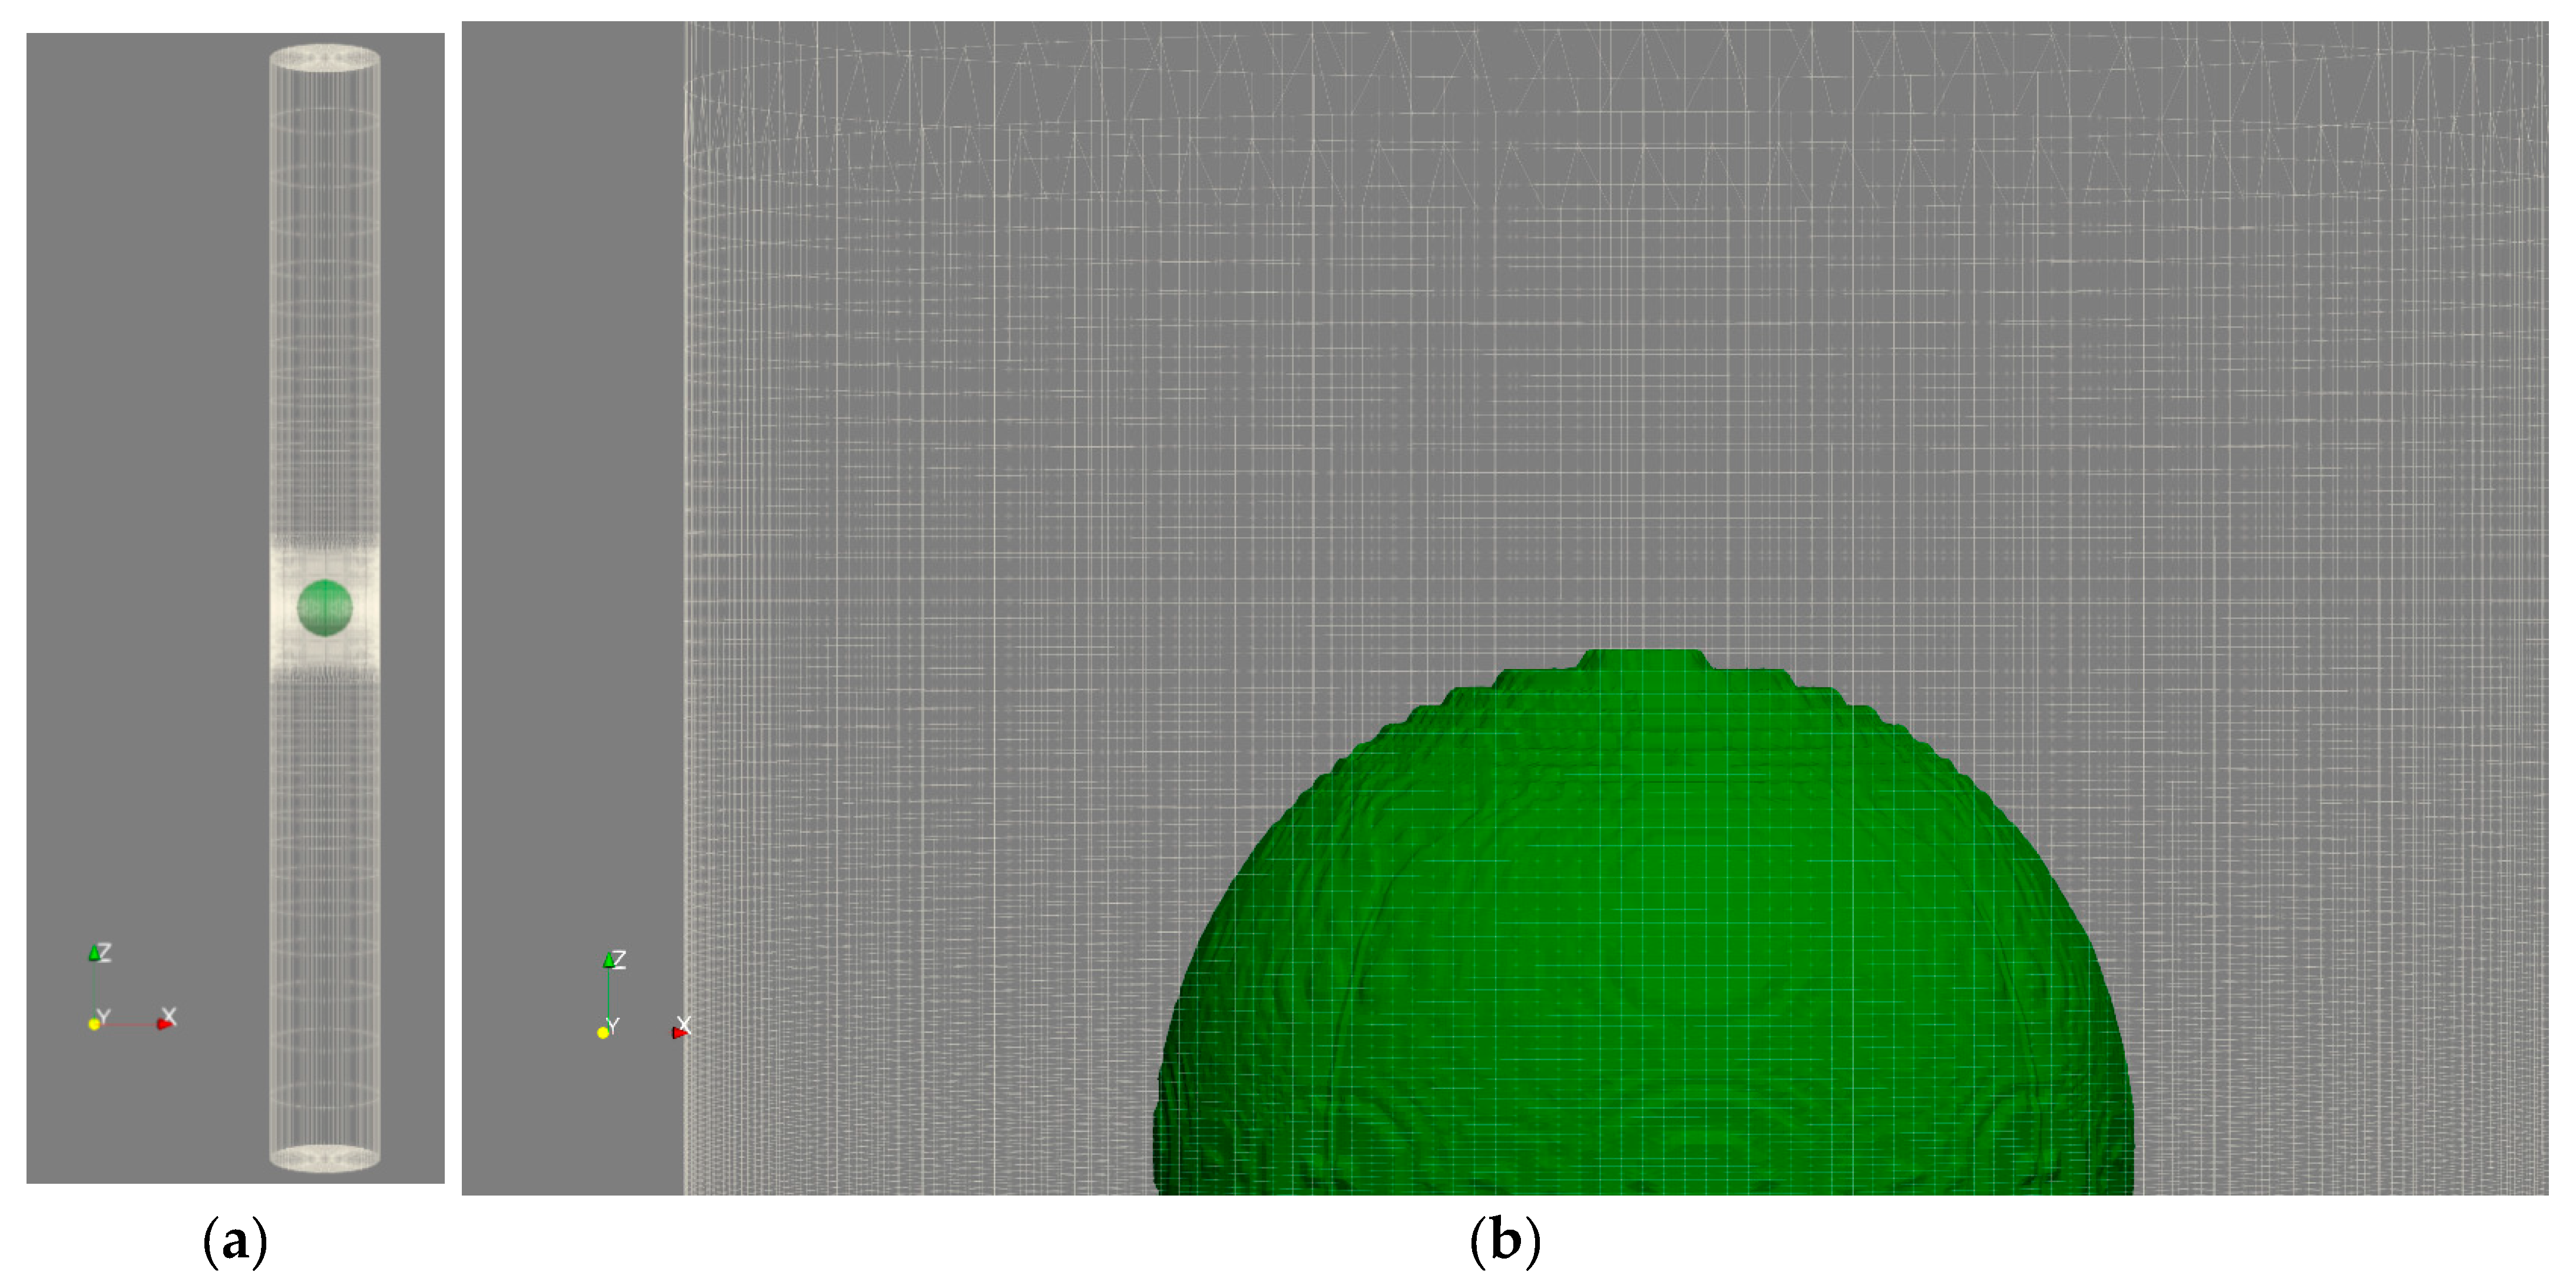
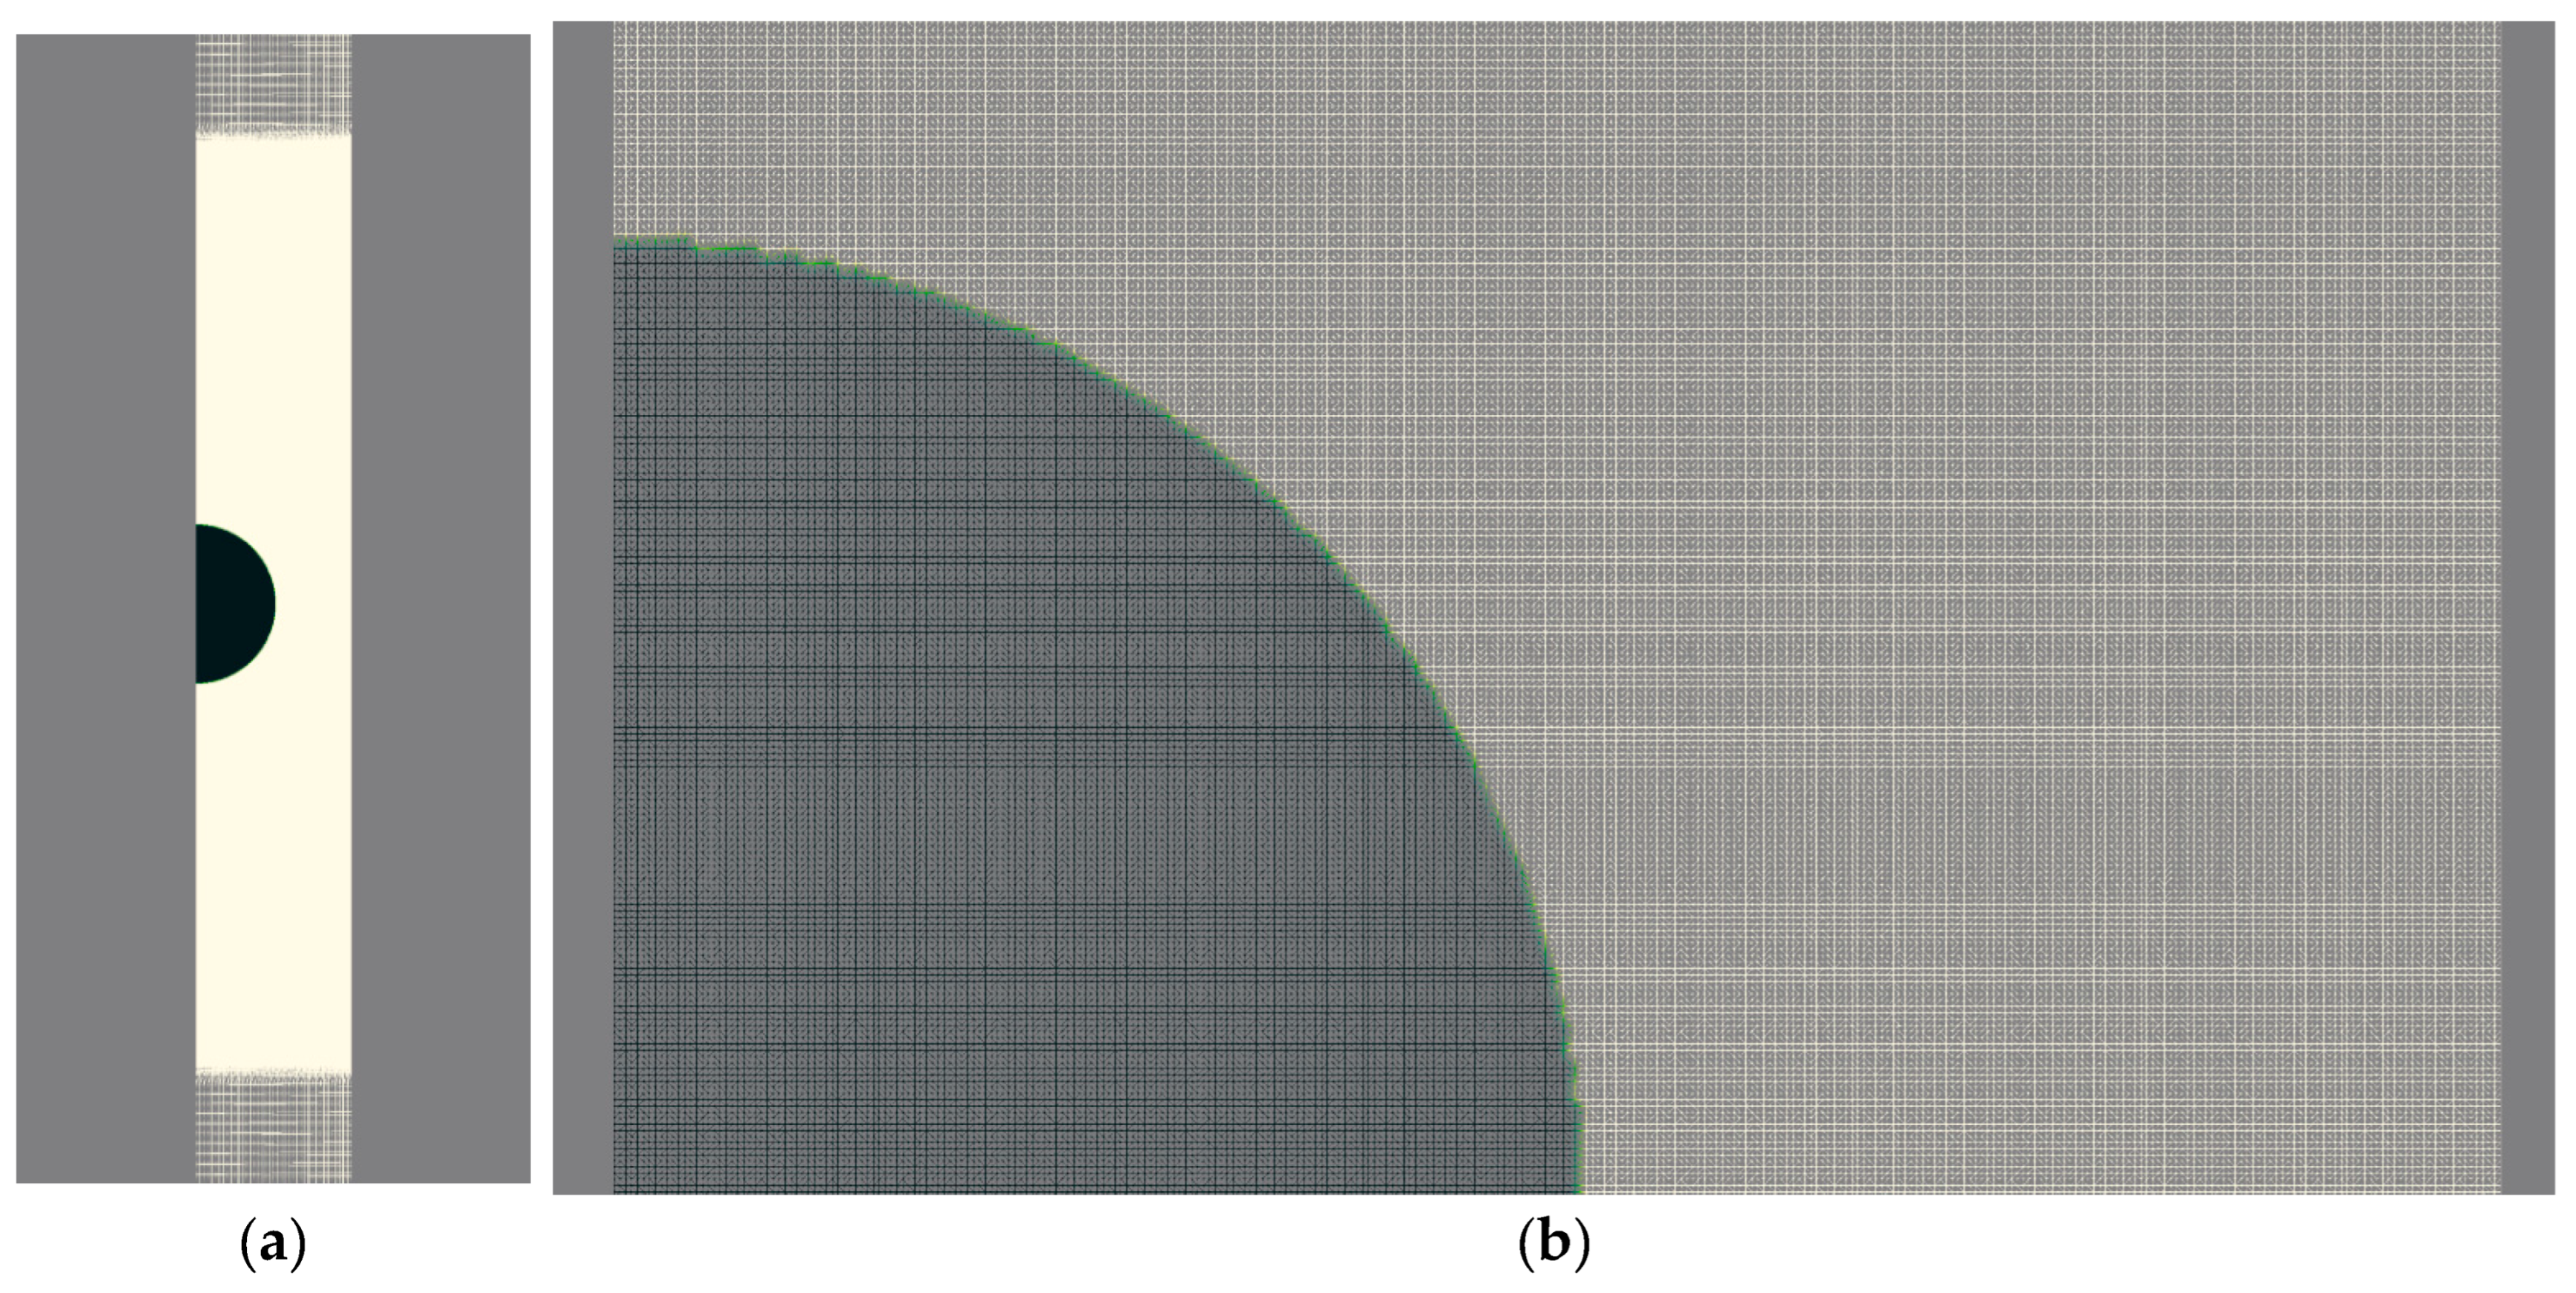
3.1. Mesh Gridding
3.2. Initial Conditions
4. Results and Discussion
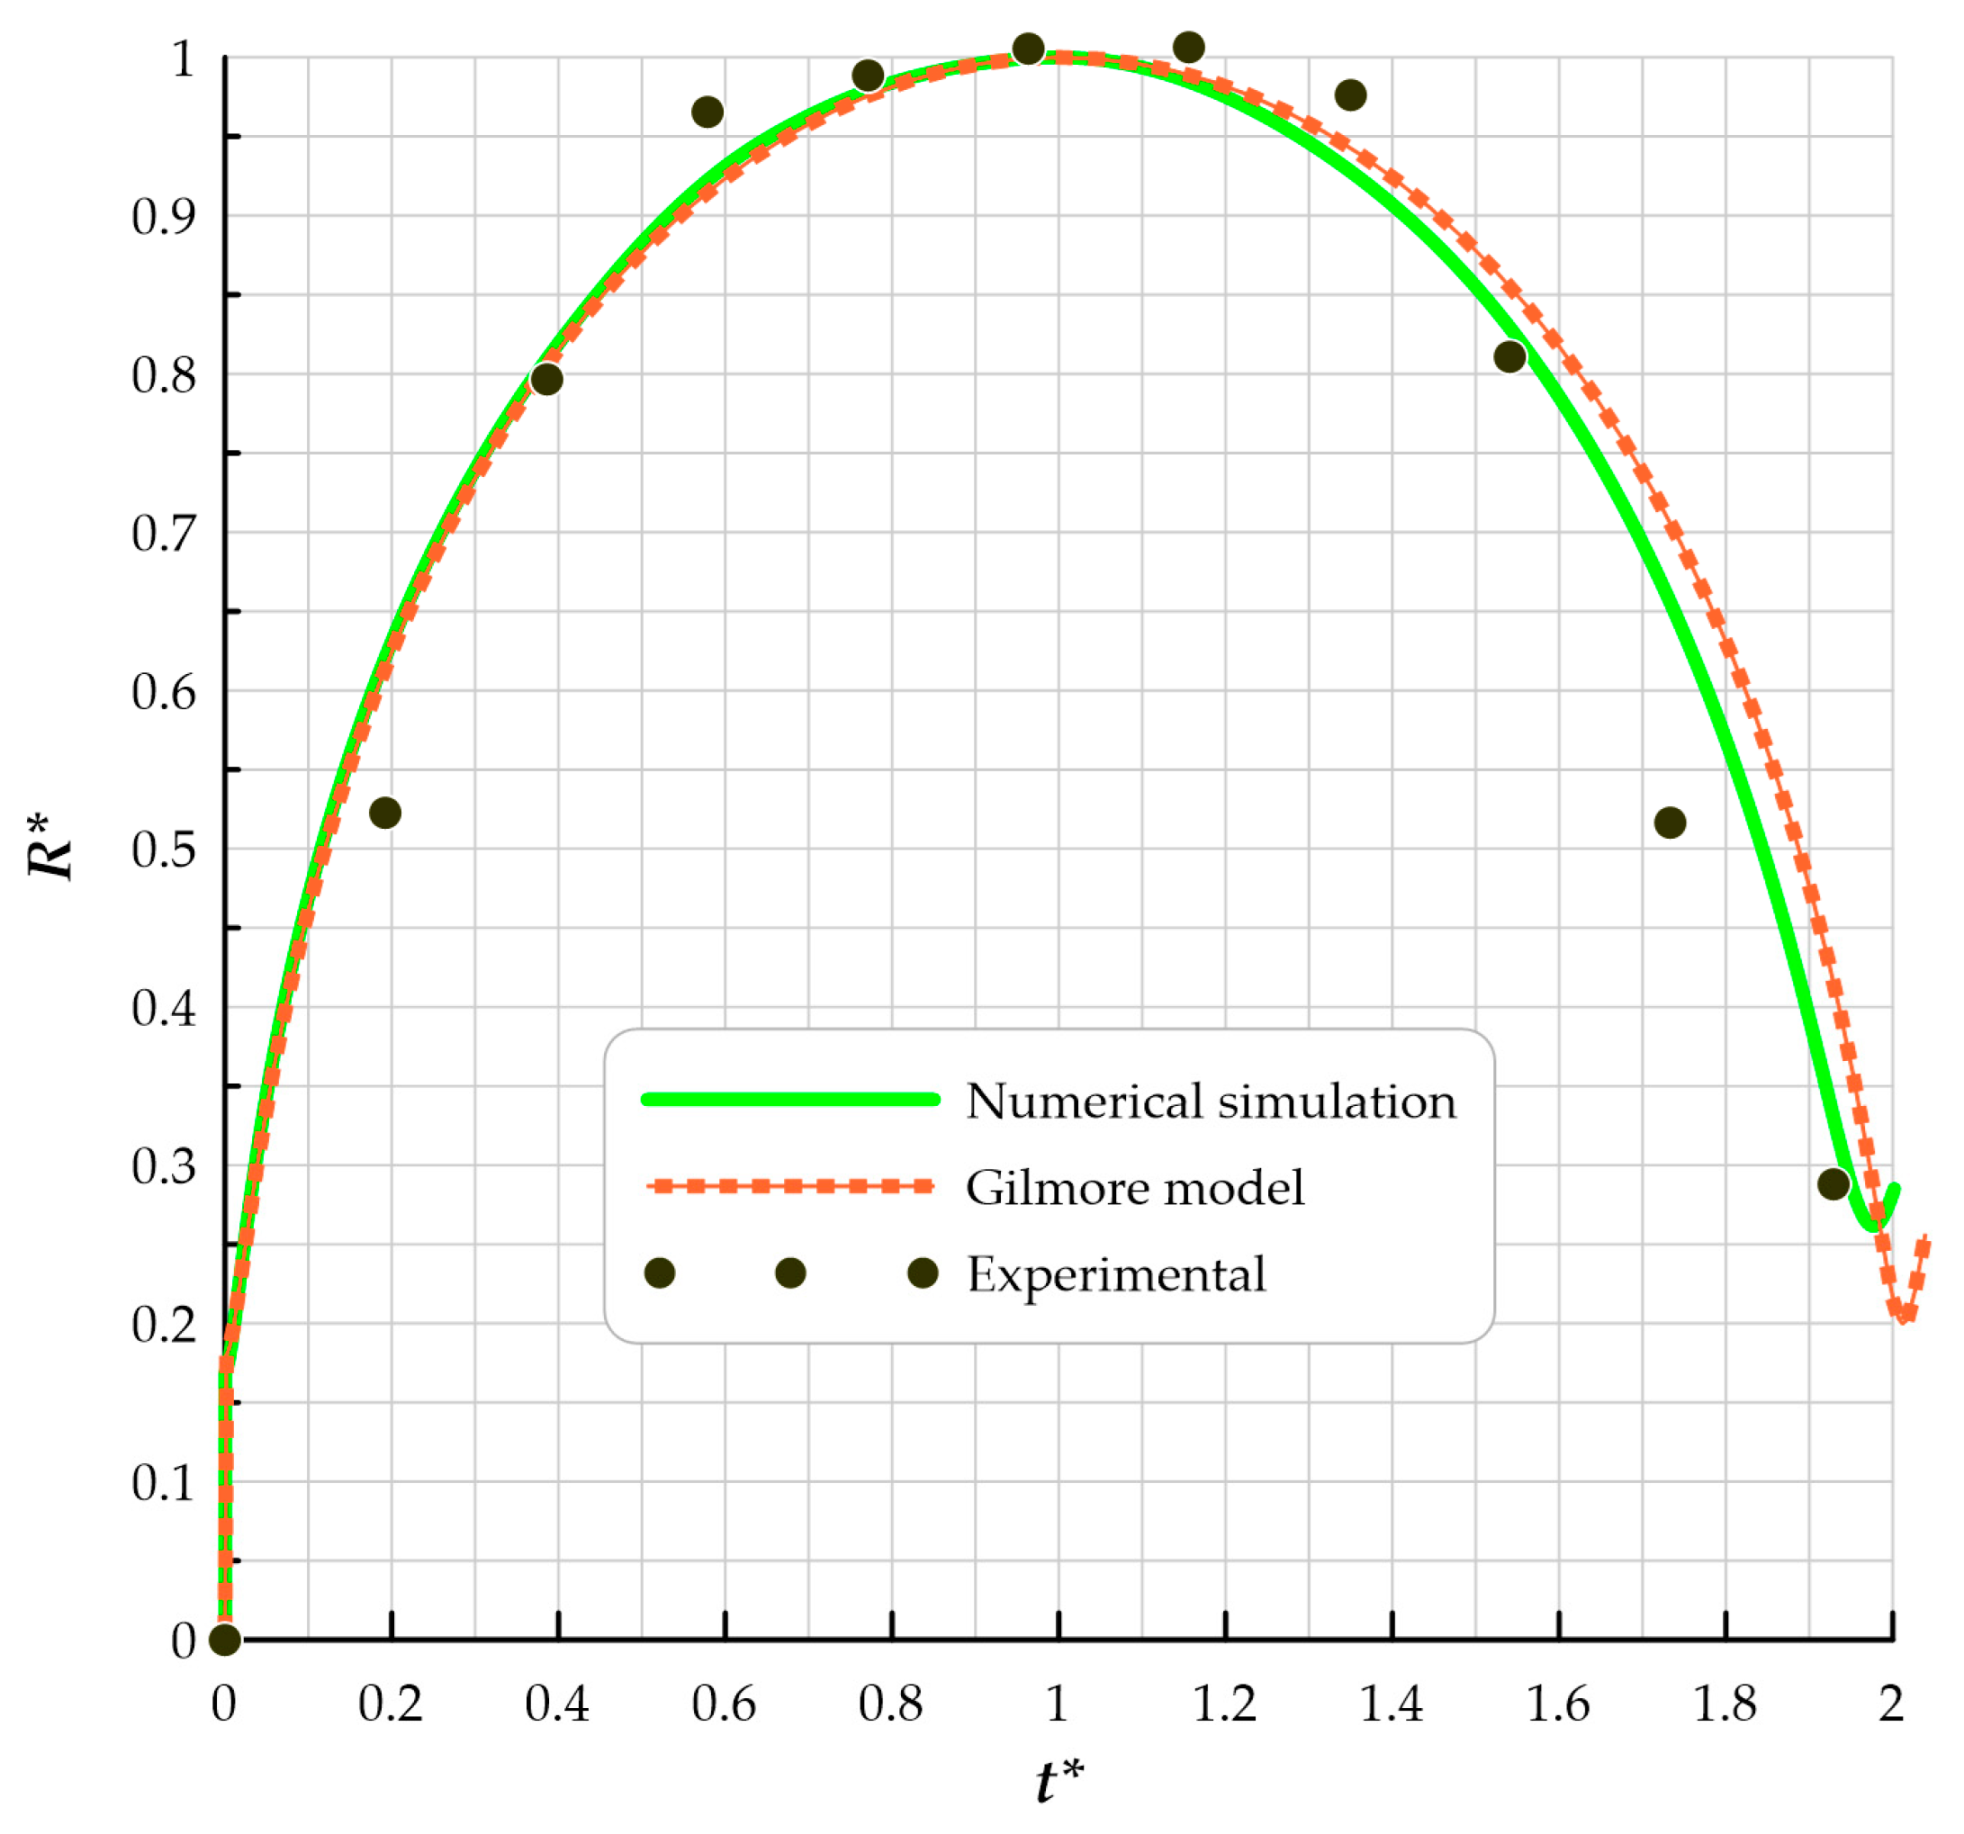
4.1. Experimental and Analytic Validation of Numerical Code
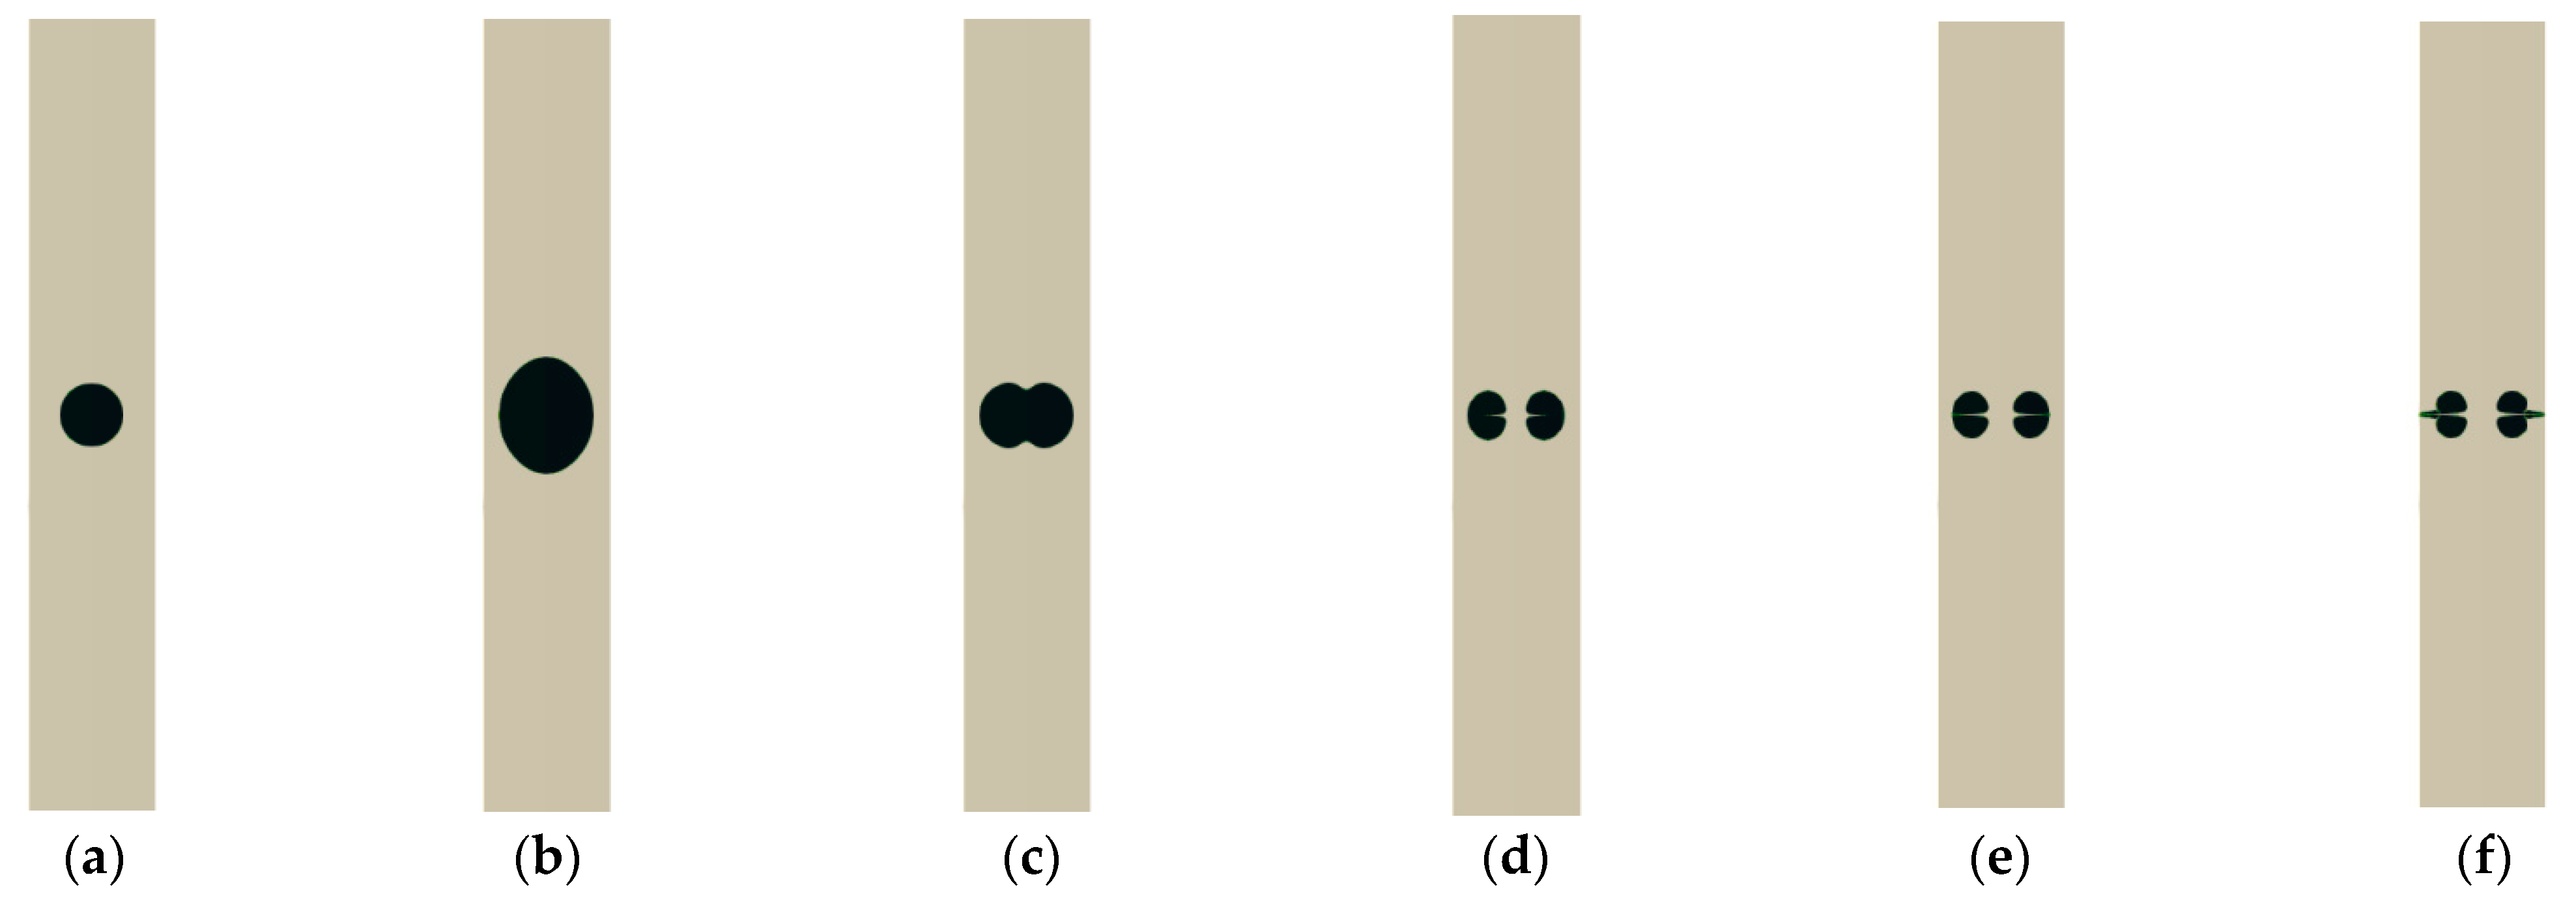
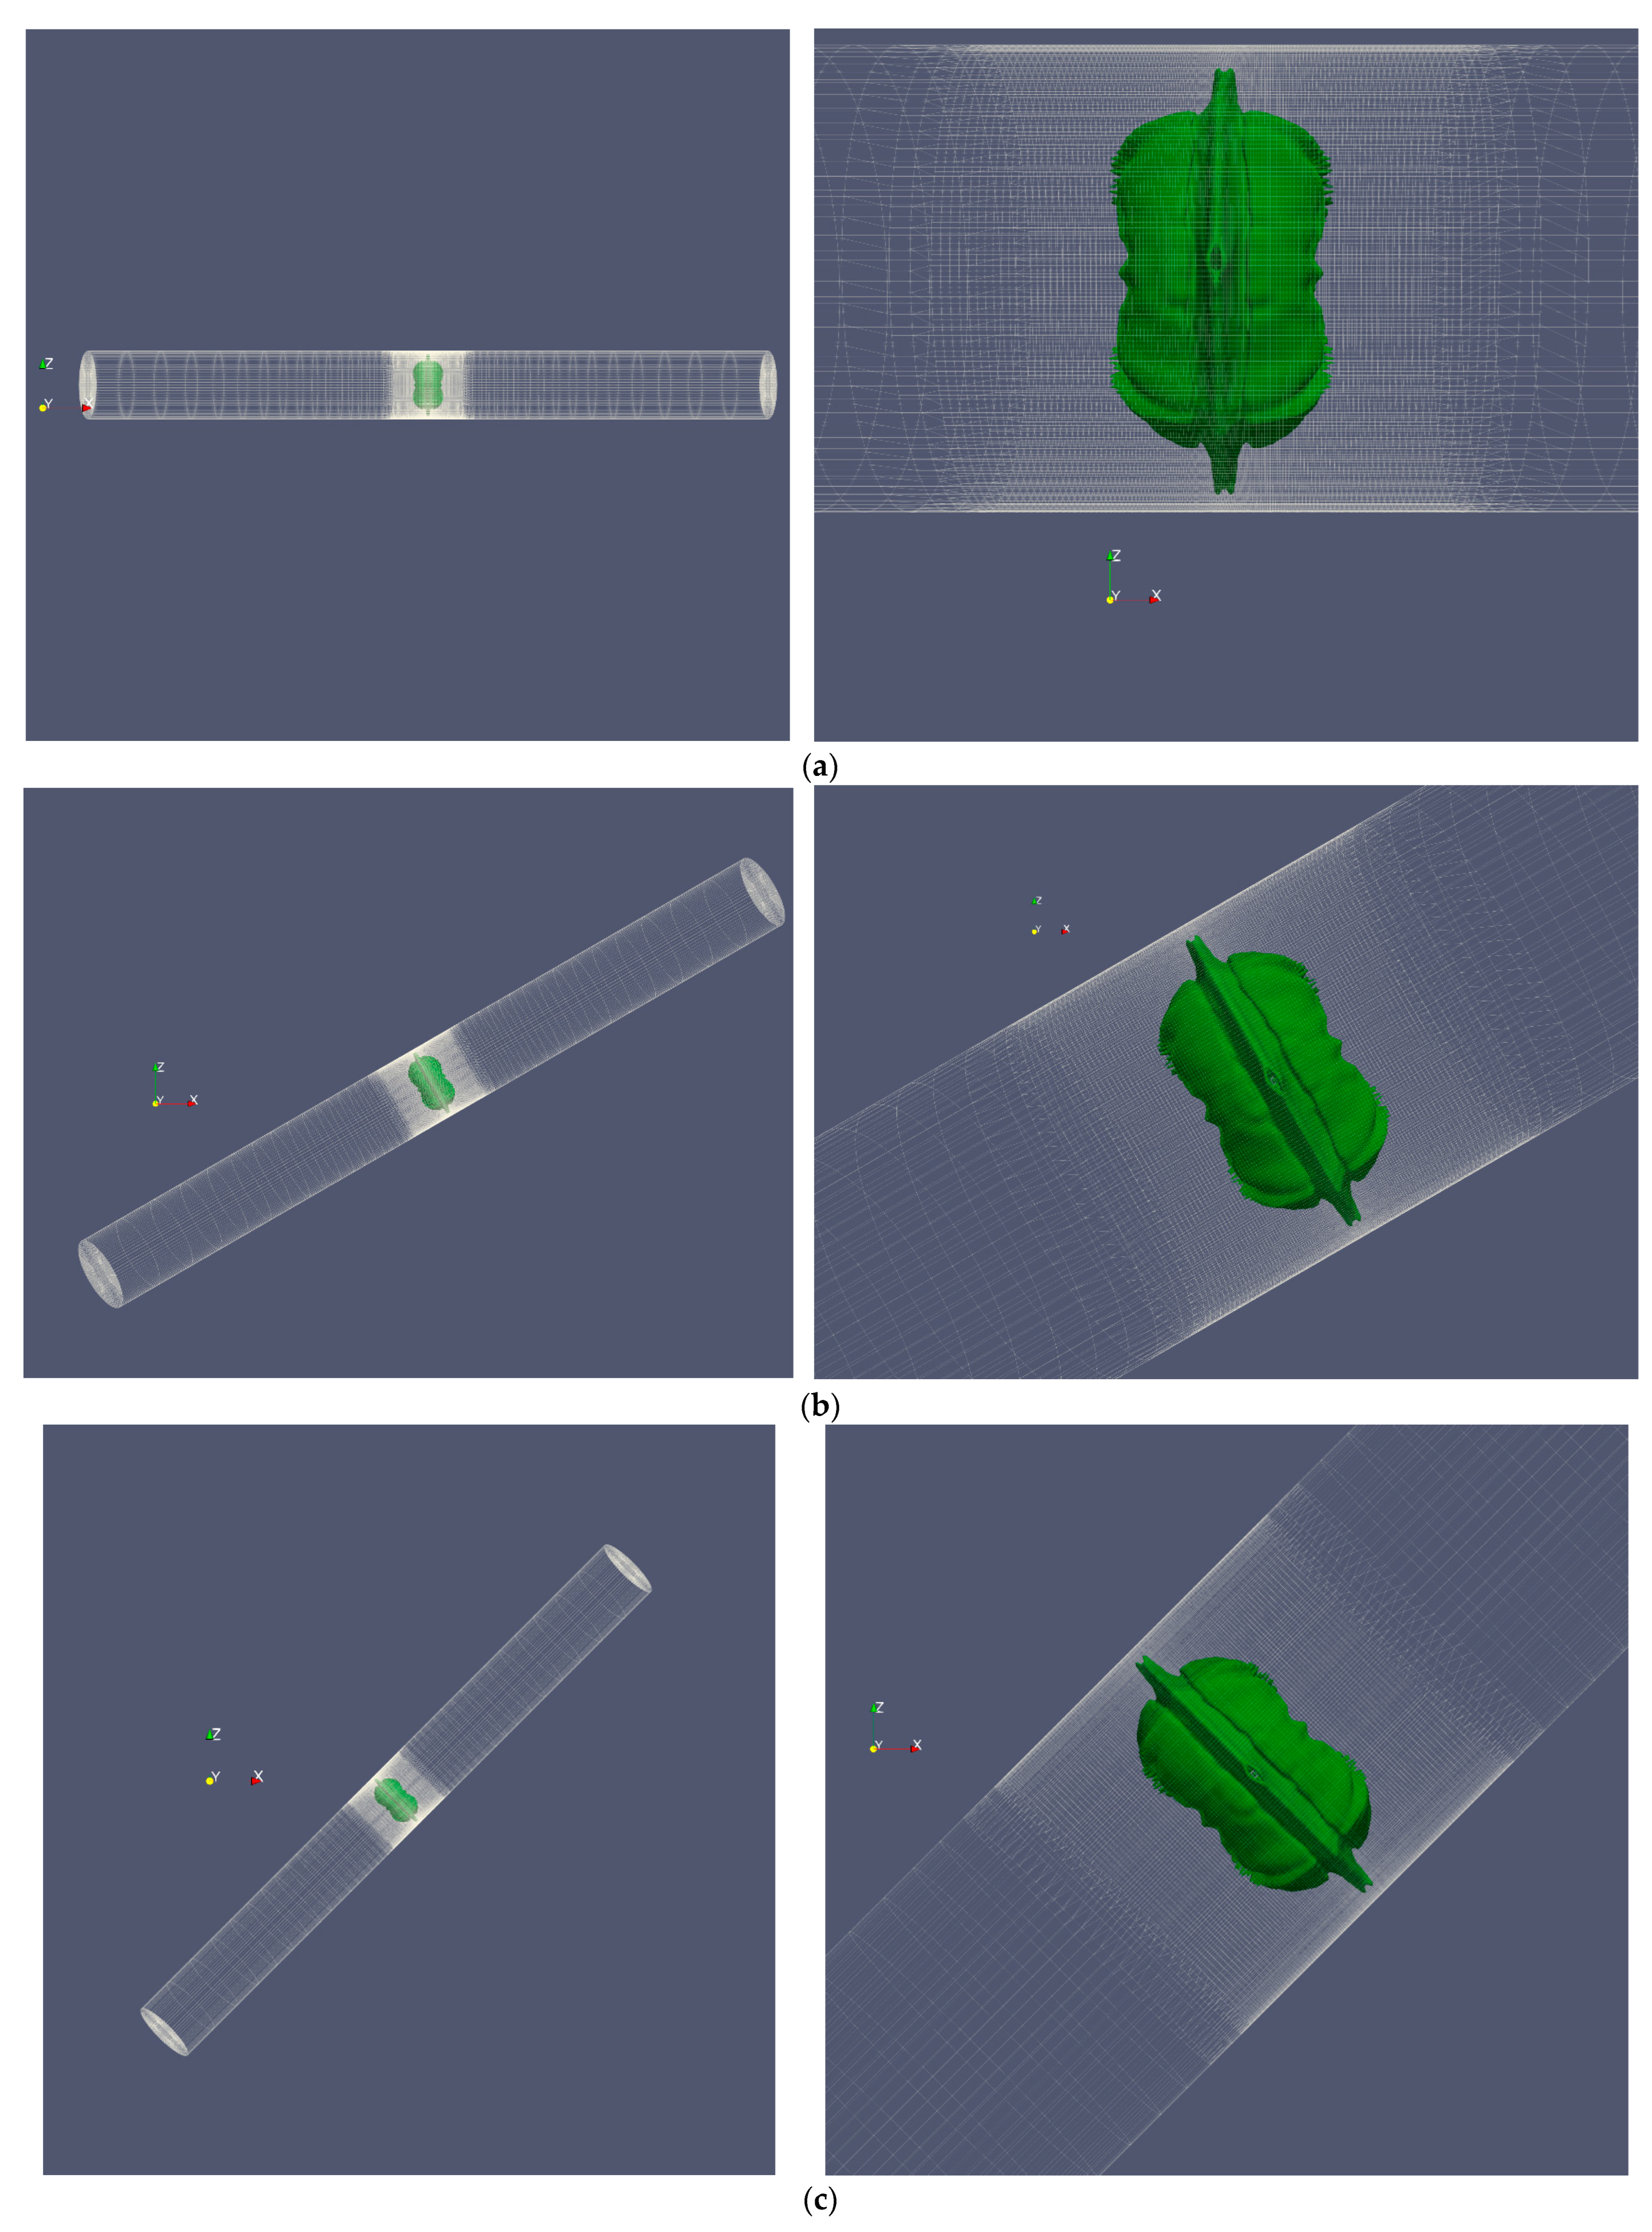
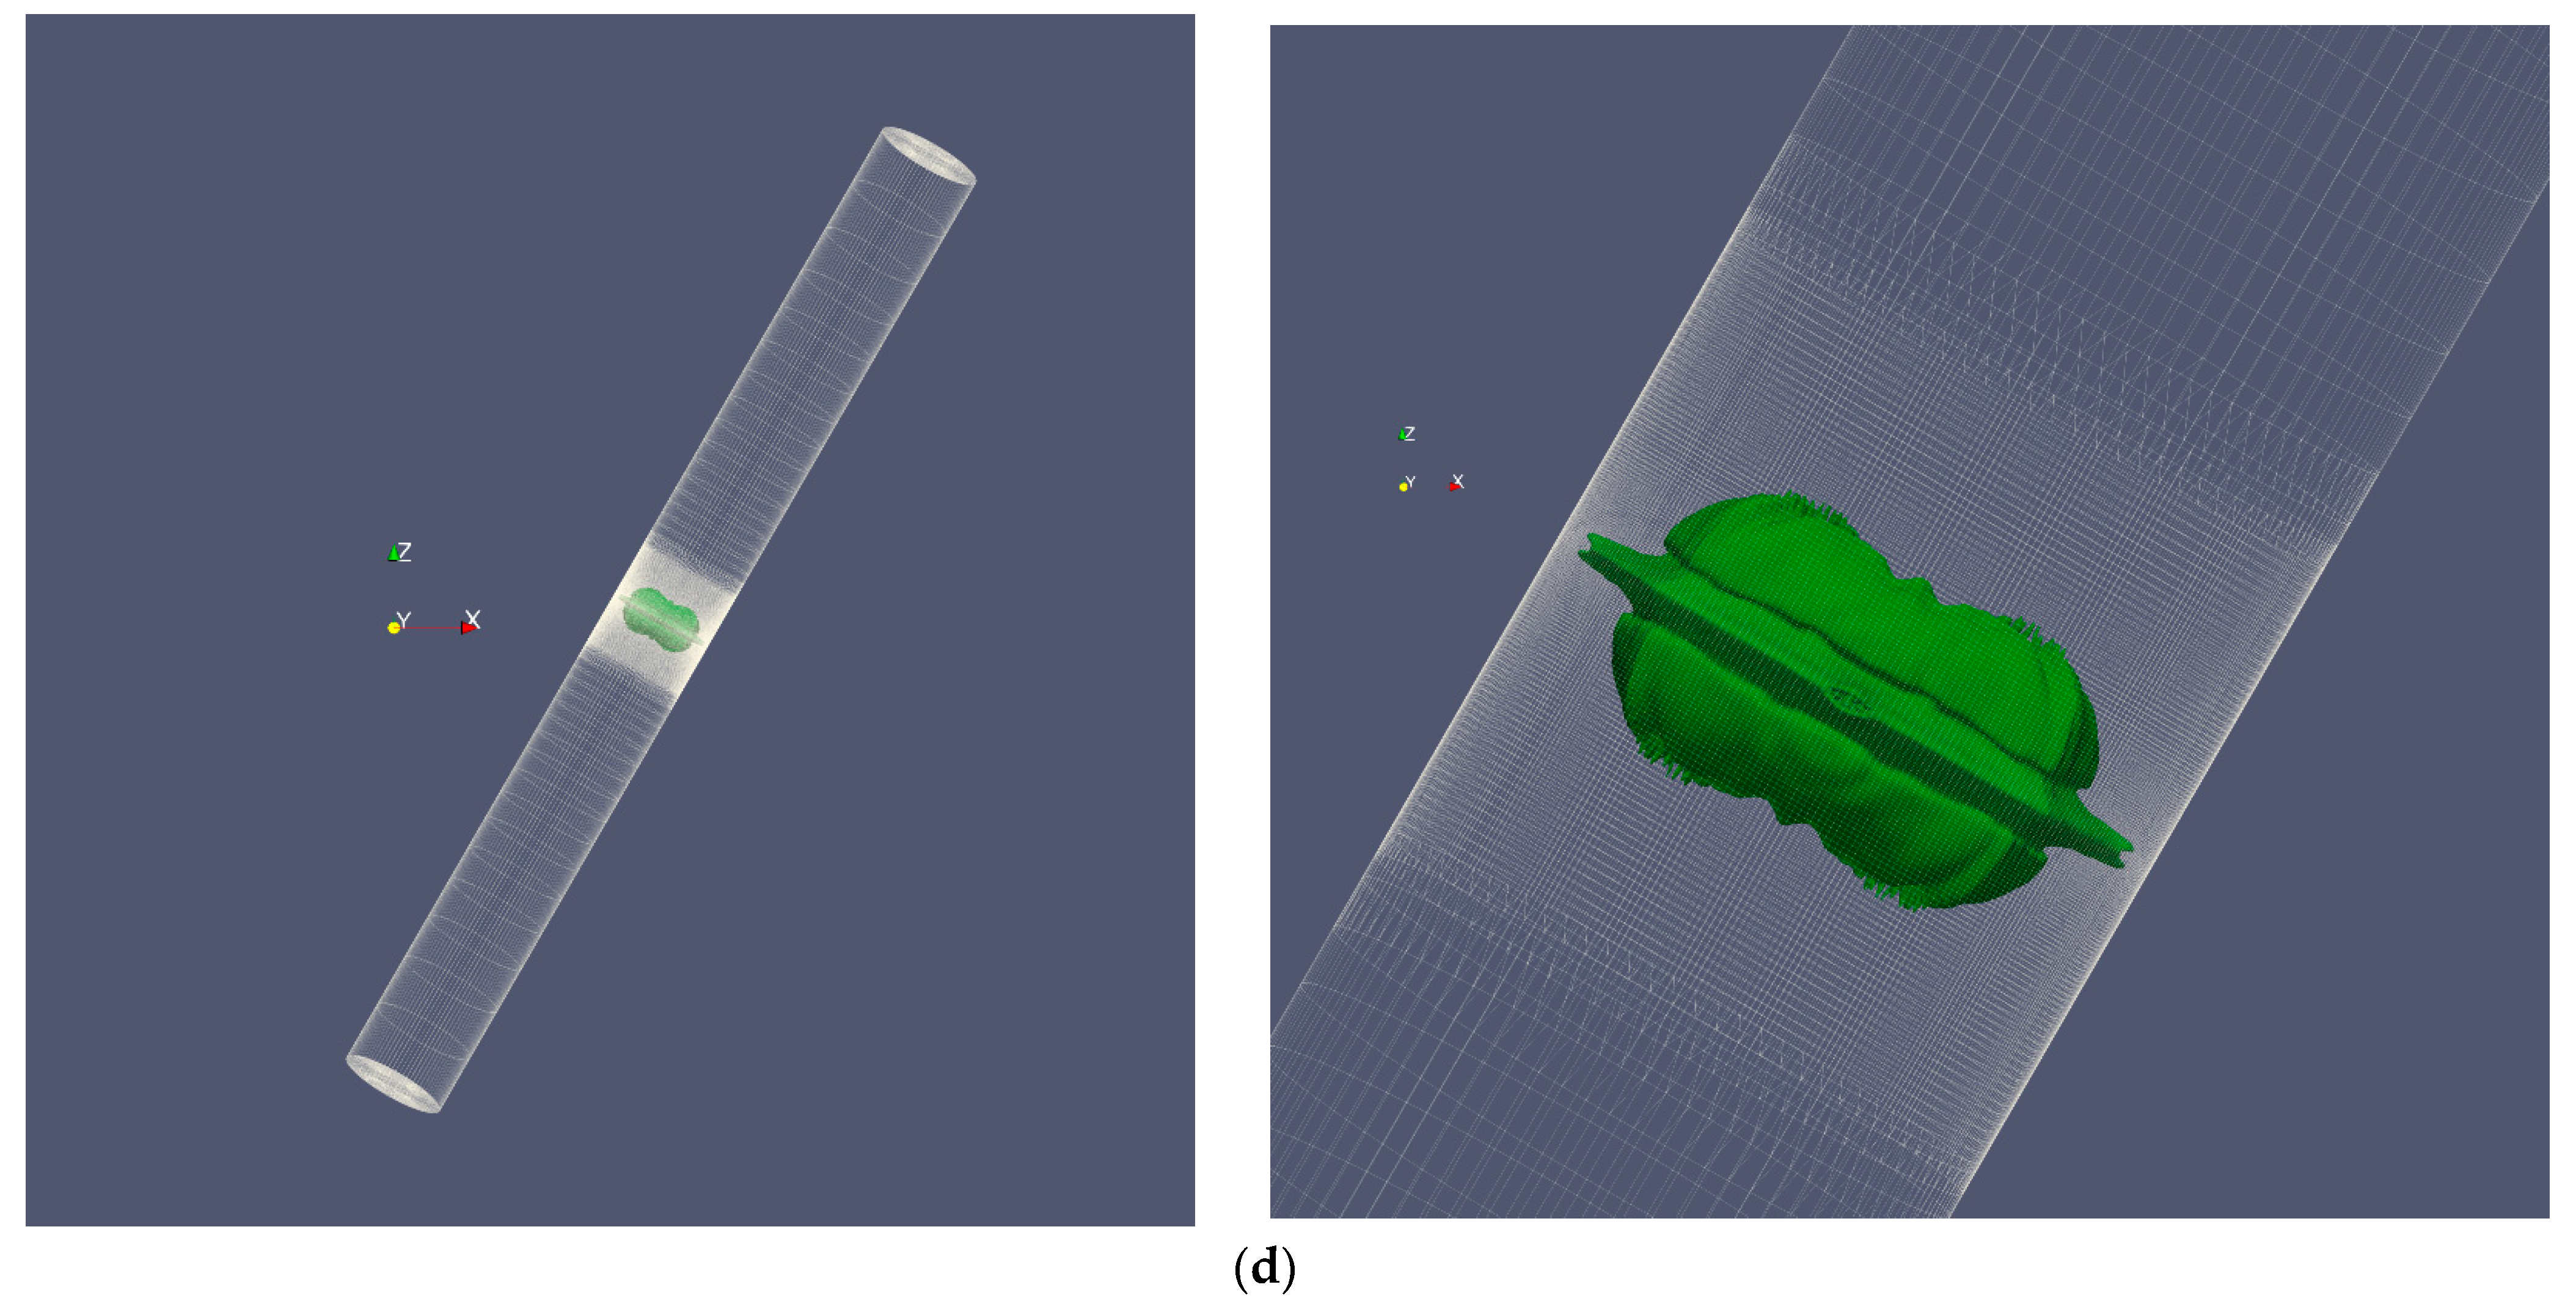
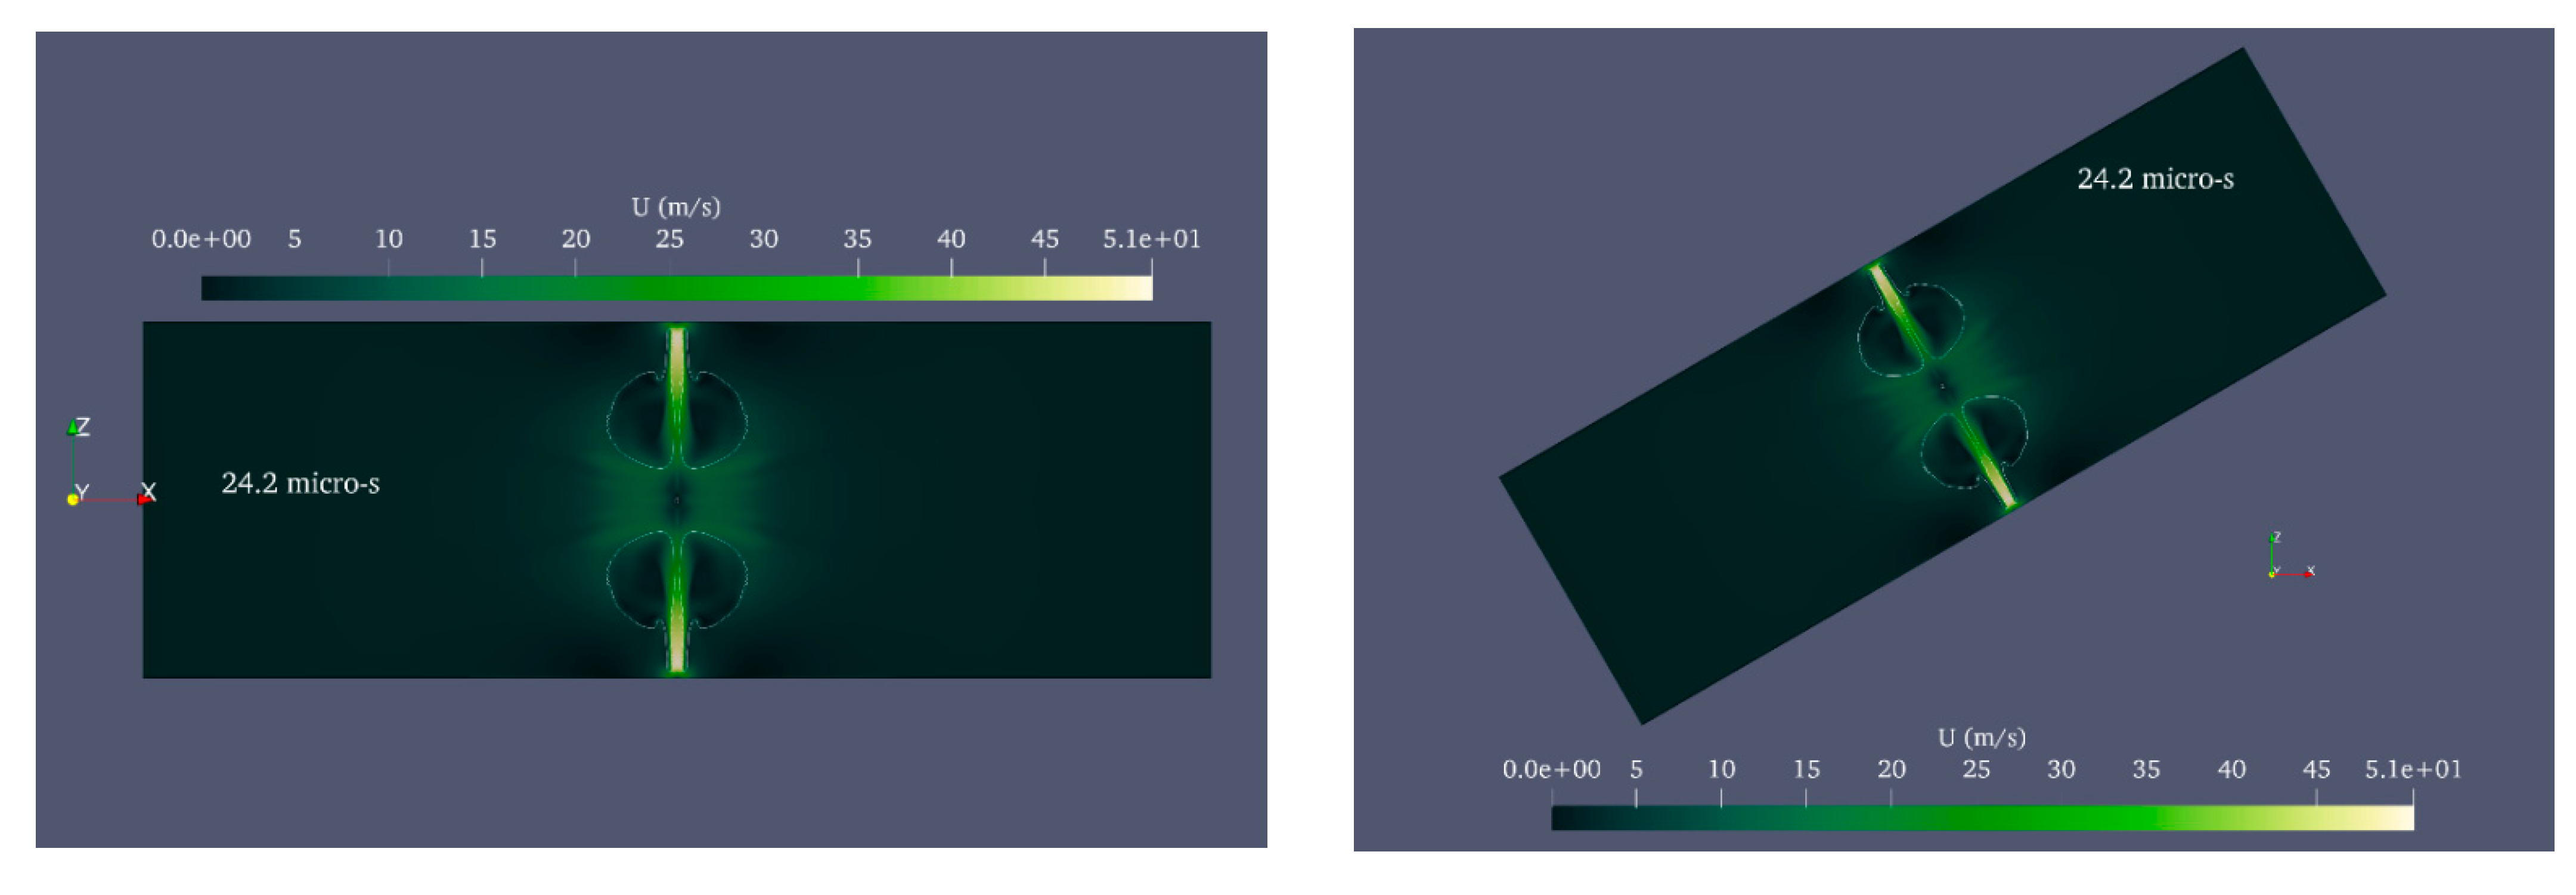
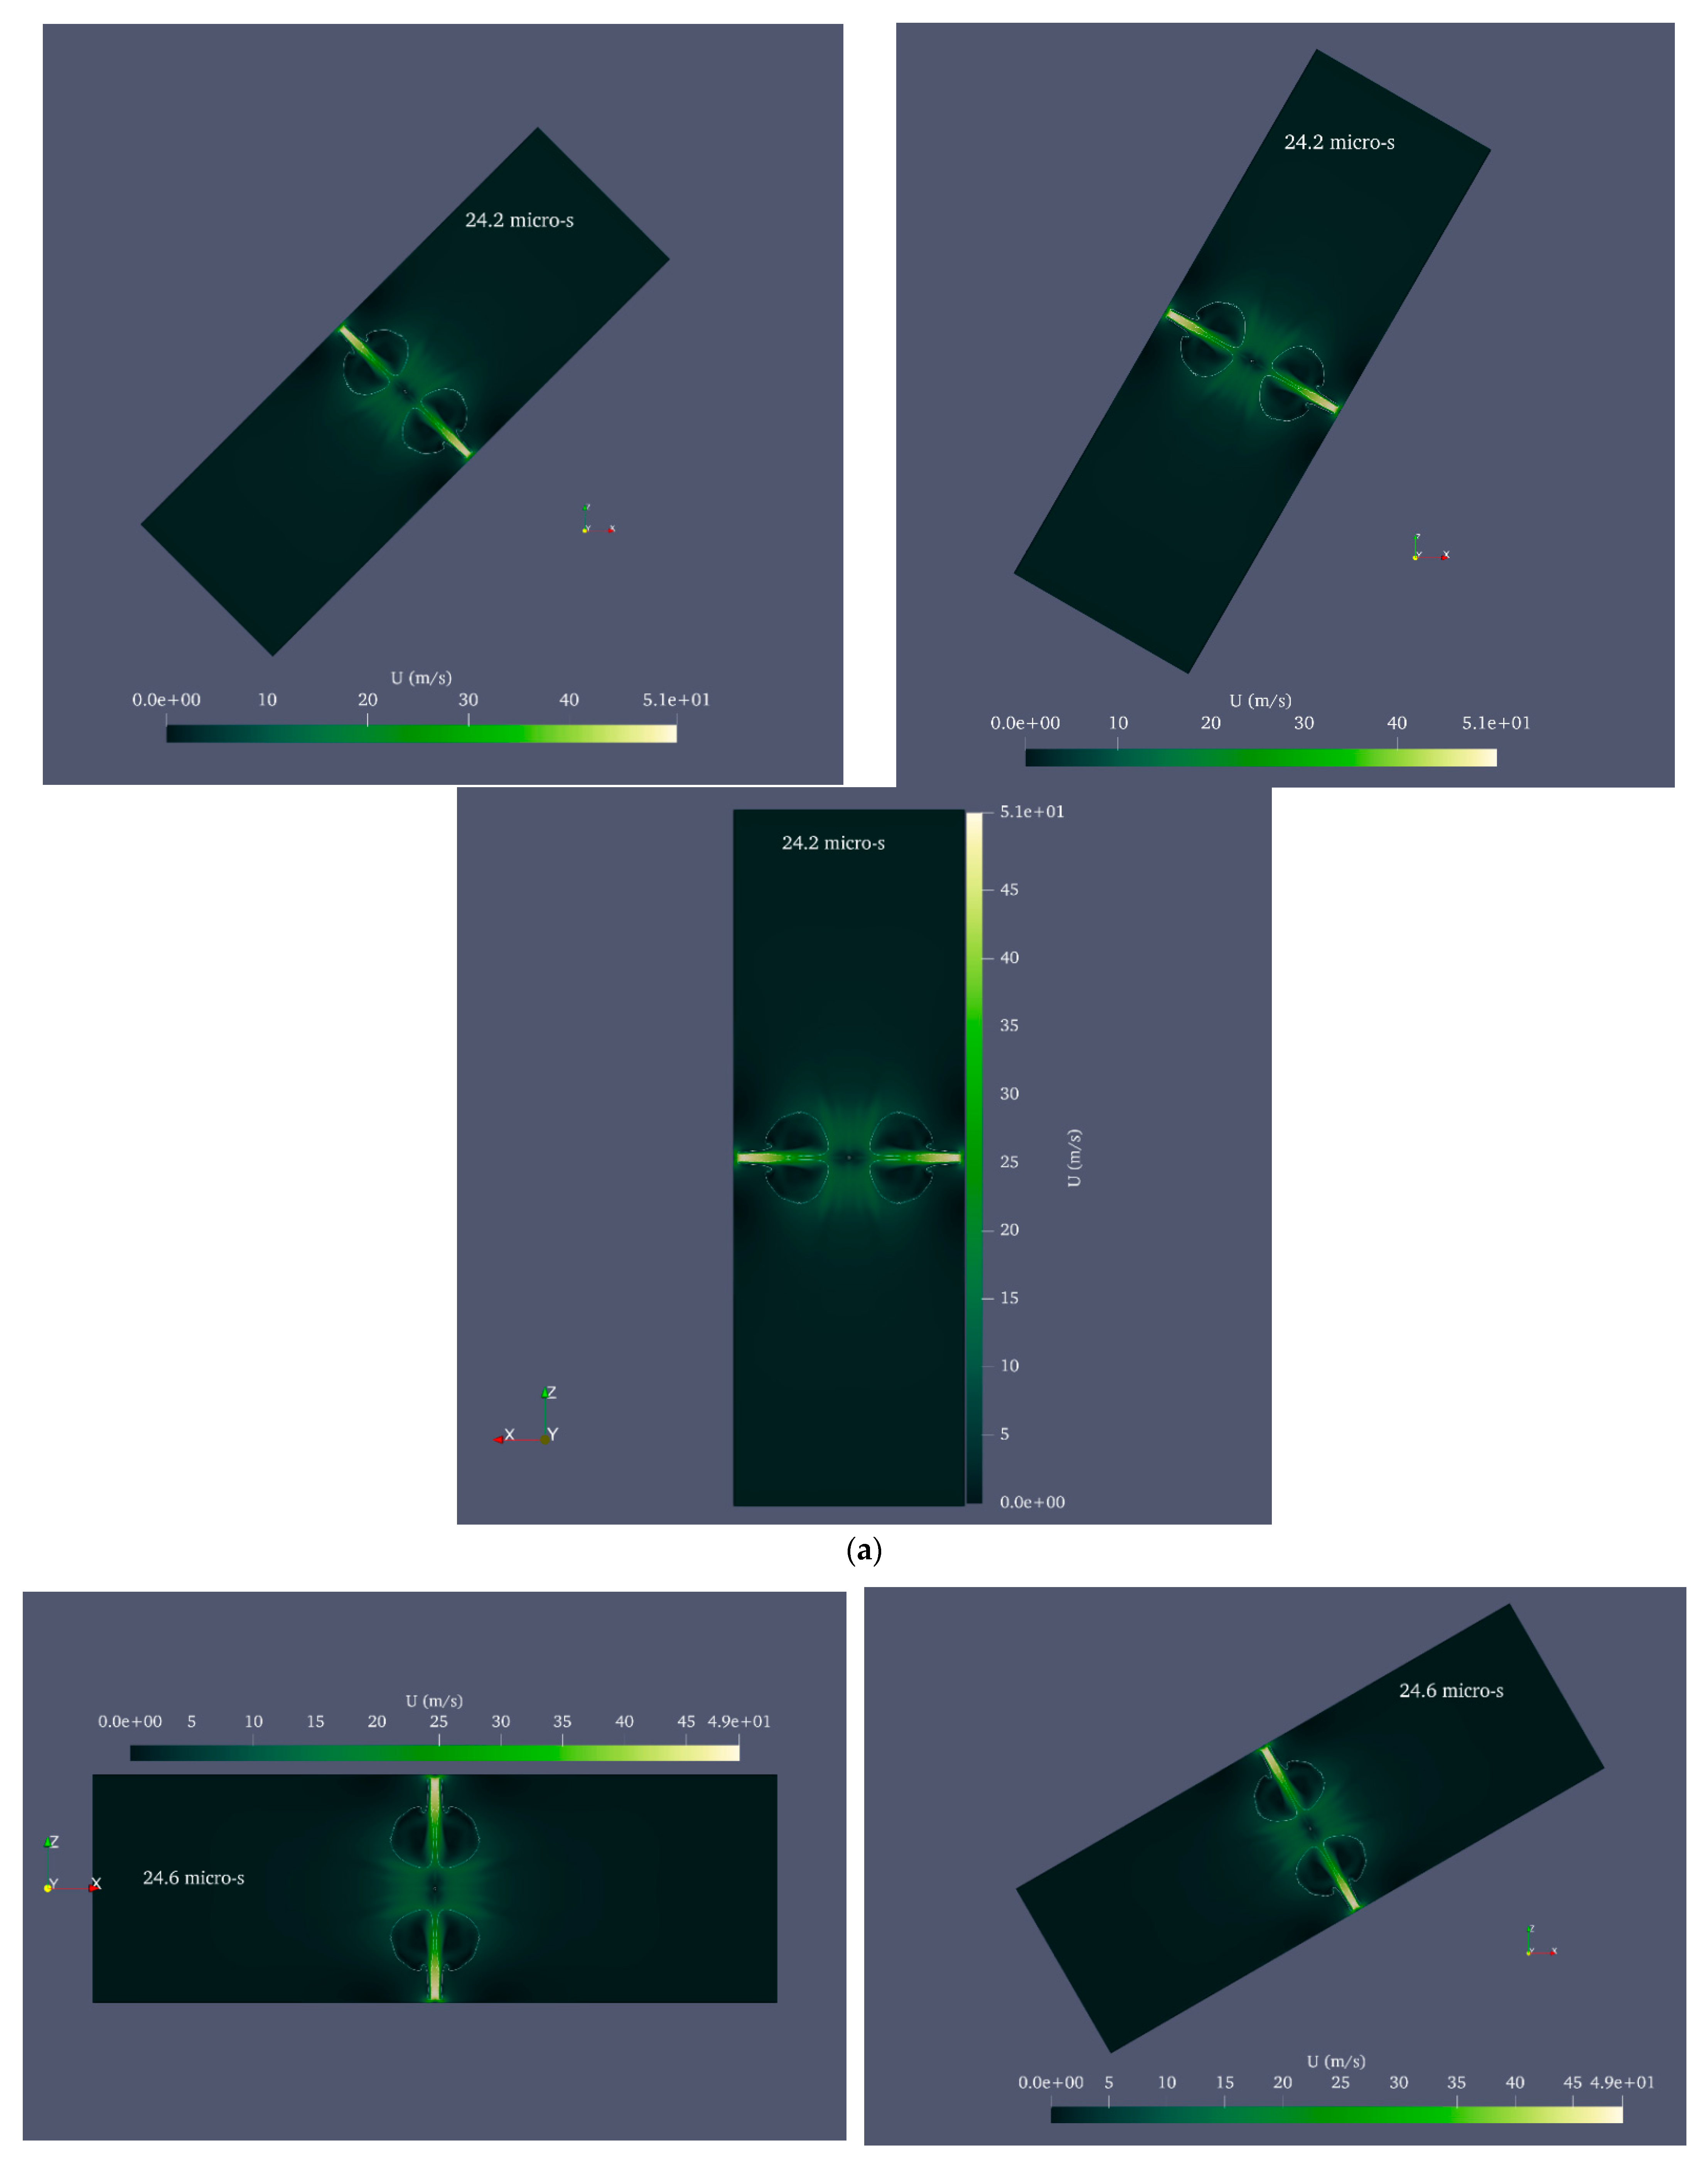
4.2. Simulating a Bubble’s Behavior inside a Rigid Cylinder While the Liquid Is Still
4.3. Simulating Bubble Behavior in a Rigid Cylinder Assuming a Flowing Liquid
4.4. Simulating the Behavior of the Bubble in Blood under the Assumption That the Vessel Wall within the Cylinder Is Rigid
5. Conclusions
Author Contributions
Funding
Data Availability Statement
Conflicts of Interest
References
- Hua, J.G.; Ren, H.; Huang, J.; Luan, M.L.; Chen, Q.D.; Juodkazis, S.; Sun, H.B. Laser-Induced Cavitation-Assisted True 3D Nano-Sculpturing of Hard Materials. Small 2023, 19, 2207968. [Google Scholar] [CrossRef]
- Jiang, H.; Lu, H.; Zhou, Y.; Liu, Y.; Hao, C. High-efficiency degradation catalytic performance of a novel Angelica sinensis poly-saccharide-silver nanomaterial for dyes by ultrasonic cavitation. Ultrason. Sonochem. 2023, 93, 106289. [Google Scholar] [CrossRef]
- Xu, L.; Park, K.; Lei, H.; Liu, P.; Kim, E.; Cho, Y.; Kim, T.; Chen, C. Chemically-induced active micro-nano bubbles assisting chemical mechanical polishing: Modeling and experiments. Friction 2023, 1–17. [Google Scholar] [CrossRef]
- Talabazar, F.R.; Aghdam, A.S.; Jafarpour, M.; Grishenkov, D.; Koşar, A.; Ghorbani, M. Chemical effects in “hydrodynamic cavi-tation on a chip”: The role of cavitating flow patterns. Chem. Eng. J. 2022, 445, 136734. [Google Scholar] [CrossRef]
- Wang, Z.; Huang, B.; Zhang, M.; Wang, G.; Zhao, X. Experimental and numerical investigation of ventilated cavitating flow structures with special emphasis on vortex shedding dynamics. Int. J. Multiph. Flow 2018, 98, 79–95. [Google Scholar] [CrossRef]
- Yang, D.-D.; Yu, A.; Ji, B.; Zhou, J.-J.; Luo, X.-W. Numerical analyses of ventilated cavitation over a 2-D NACA0015 hydrofoil using two turbulence modeling methods. J. Hydrodyn. 2018, 30, 345–356. [Google Scholar] [CrossRef]
- Liu, Y.; Zhang, A.; Tian, Z.; Wang, S. Numerical investigation on global responses of surface ship subjected to underwater ex-plosion in waves. Ocean Eng. 2018, 161, 277–290. [Google Scholar] [CrossRef]
- Hsiao, C.-T.; Chahine, G.L. Effect of a Propeller and Gas Diffusion on Bubble Nuclei Distribution in a Liquid. J. Hydrodyn. 2012, 24, 809–822. [Google Scholar] [CrossRef]
- Wang, J.; Li, S.; Gu, J.; Zhang, A.-M. Particle propulsion from attached acoustic cavitation bubble under strong ultrasonic wave excitation. Phys. Fluids 2023, 35, 042009. [Google Scholar] [CrossRef]
- Cheng, S.-H.; Quan, X.-B.; Zhang, S.; Zhang, T.-Y.; Li, S. Modeling tail bubble dynamics during the launch of an underwater vehicle using the boundary element method. J. Hydrodyn. 2022, 34, 434–443. [Google Scholar] [CrossRef]
- Zhang, S.; Wang, S.; Zhang, A.; Cui, P. Numerical study on motion of the air-gun bubble based on boundary integral method. Ocean Eng. 2018, 154, 70–80. [Google Scholar] [CrossRef]
- Li, G.; Yi, L.; Wang, J.; Song, Y. Hydrodynamic cavitation degradation of Rhodamine B assisted by Fe3+-doped TiO2: Mechanisms, geometric and operation parameters. Ultrason. Sonochem. 2020, 60, 104806. [Google Scholar] [CrossRef] [PubMed]
- Chahine, G.L.; Kapahi, A.; Choi, J.-K.; Hsiao, C.-T. Modeling of surface cleaning by cavitation bubble dynamics and collapse. Ultrason. Sonochem. 2016, 29, 528–549. [Google Scholar] [CrossRef] [PubMed]
- Sagar, H.J.; El Moctar, O. Dynamics of a cavitation bubble between oblique plates. Phys. Fluids 2023, 35, 013324. [Google Scholar] [CrossRef]
- Kashkooli, F.M.; Jakhmola, A.; Hornsby, T.K.; Tavakkoli, J.J.; Kolios, M.C. Ultrasound-mediated nano drug delivery for treating cancer: Fundamental physics to future directions. J. Control. Release 2023, 355, 552–578. [Google Scholar] [CrossRef]
- Chen, X.; Liang, D.; Sun, W.; Shou, X.; Shang, L.; Shen, X. Suspended bubble microcapsule delivery systems from droplet mi-crofluidic technology for the local treatment of gastric cancer. Chem. Eng. J. 2023, 458, 141428. [Google Scholar] [CrossRef]
- Rayleigh, L. VIII. On the pressure developed in a liquid during the collapse of a spherical cavity. Lond. Edinb. Dublin Philos. Mag. J. Sci. 1917, 34, 94–98. [Google Scholar] [CrossRef]
- Plesset, M.S.; Prosperetti, A. Bubble dynamics and cavitation. Annu. Rev. Fluid Mech. 1977, 9, 145–185. [Google Scholar] [CrossRef]
- Gilmore, F.R. The Growth or Collapse of a Spherical Bubble in a Viscous Compressible Liquid; California Institute of Technology: Pasadena, CA, USA, 1952. [Google Scholar]
- Keller, J.B.; Miksis, M. Bubble oscillations of large amplitude. J. Acoust. Soc. Am. 1980, 68, 628–633. [Google Scholar] [CrossRef]
- Blake, J.R.; Gibson, D.C. Growth and collapse of a vapour cavity near a free surface. J. Fluid Mech. 1981, 111, 123–140. [Google Scholar] [CrossRef]
- Pearson, A.; Cox, E.; Blake, J.; Otto, S. Bubble interactions near a free surface. Eng. Anal. Bound. Elem. 2004, 28, 295–313. [Google Scholar] [CrossRef]
- Yu, J.; Li, H.-T.; Sheng, Z.-X.; Hao, Y.; Liu, J.-H. Numerical research on the cavitation effect induced by underwater multi-point explosion near free surface. AIP Adv. 2023, 13, 015021. [Google Scholar] [CrossRef]
- Blake, J.R.; Gibson, D.C. Cavitation Bubbles Near Boundaries. Annu. Rev. Fluid Mech. 1987, 19, 99–123. [Google Scholar] [CrossRef]
- Lechner, C.; Lauterborn, W.; Koch, M.; Mettin, R. Fast, thin jets from bubbles expanding and collapsing in extreme vicinity to a solid boundary: A numerical study. Phys. Rev. Fluids 2019, 4, 021601. [Google Scholar] [CrossRef]
- Postnikov, A.V. Collapse Dynamics of Hemispherical Cavitation Bubble in Contact with a Solid Boundary. Fluid Dyn. 2020, 55, 454–464. [Google Scholar] [CrossRef]
- Lechner, C.; Koch, M.; Lauterborn, W.; Mettin, R. Pressure and tension waves from bubble collapse near a solid boundary: A numerical approach. J. Acoust. Soc. Am. 2017, 142, 3649–3659. [Google Scholar] [CrossRef]
- Dadvand, A.; Moloudi, G.; Saleki-Haselghoubi, N.; Dawoodian, M. Dynamics of a gas bubble near the aperture of a perforated concave rigid plate. Ocean Eng. 2022, 258, 111697. [Google Scholar] [CrossRef]
- Cui, J.; Zhou, T.-R.; Huang, X.; Li, Z.-C. Experimental study of bubble dynamics in the neighbourhood of a vertical incomplete boundary. Ultrason. Sonochem. 2021, 75, 105587. [Google Scholar] [CrossRef] [PubMed]
- Zhai, Y.; Xu, W.; Luo, J.; Li, J. Experimental study on the characteristics of microjets and shock waves of cavitation bubbles near elastic boundaries. Ocean Eng. 2022, 257, 111664. [Google Scholar] [CrossRef]
- Weinberg, K.; Aghayan, S. A variational model of bubble cavitation in soft gels and its experimental validation. Mech. Mater. 2023, 177, 104547. [Google Scholar] [CrossRef]
- Brujan, E.-A.; Zhang, A.-M.; Liu, Y.-L.; Ogasawara, T.; Takahira, H. Jetting and migration of a laser-induced cavitation bubble in a rectangular channel. J. Fluid Mech. 2022, 948, A6. [Google Scholar] [CrossRef]
- Brujan, E.-A.; Takahira, H.; Ogasawara, T. Planar jets in collapsing cavitation bubbles. Exp. Therm. Fluid Sci. 2018, 101, 48–61. [Google Scholar] [CrossRef]
- Brujan, E.-A.; Noda, T.; Ishigami, A.; Ogasawara, T.; Takahira, H. Dynamics of laser-induced cavitation bubbles near two per-pendicular rigid walls. J. Fluid Mech. 2018, 841, 28–49. [Google Scholar] [CrossRef]
- Lechner, C.; Koch, M.; Lauterborn, W.; Mettin, R. Fast jets from bubbles close to solid objects: Examples from pillars in water to infinite planes in different liquids. Tech. Mech. 2023, 43, 21–37. [Google Scholar]
- Sun, T.; Zhou, L.; Yin, Z.; Zong, Z. Cavitation bubble dynamics and structural loads of high-speed water entry of a cylinder using fluid-structure interaction method. Appl. Ocean Res. 2020, 101, 102285. [Google Scholar] [CrossRef]
- Bao, H.; Reuter, F.; Zhang, H.; Lu, J.; Ohl, C.-D. Impact-driven cavitation bubble dynamics. Exp. Fluids 2023, 64, 27. [Google Scholar] [CrossRef]
- Rouzbahani, F.; Shervani-Tabar, M. Numerical Study on the Growth and Collapse of a Cavitation Bubble inside a Rigid Cylinder with a Compliant Coating. Adv. Mater. Res. 2014, 875-877, 1194–1198. [Google Scholar] [CrossRef]
- Zhang, J. Effect of stand-off distance on “counterjet” and high impact pressure by a numerical study of laser-induced cavitation bubble near a wall. Int. J. Multiph. Flow 2021, 142, 103706. [Google Scholar] [CrossRef]
- Tzanakis, I.; Eskin, D.; Georgoulas, A.; Fytanidis, D. Incubation pit analysis and calculation of the hydrodynamic impact pressure from the implosion of an acoustic cavitation bubble. Ultrason. Sonochem. 2014, 21, 866–878. [Google Scholar] [CrossRef]
- Rodriguez, M., Jr.; Beig, S.A.; Barbier, C.N.; Johnsen, E. Dynamics of an inertially collapsing gas bubble between two parallel, rigid walls. J. Fluid Mech. 2022, 946, A43. [Google Scholar] [CrossRef]
- Ye, L.; Zhu, X. Analysis of the effect of impact of near-wall acoustic bubble collapse micro-jet on Al 1060. Ultrason. Sonochem. 2017, 36, 507–516. [Google Scholar] [CrossRef] [PubMed]
- Söhnholz, H. Temperatureffekte Bei der Lasererzeugten Kavitation. Ph.D. Thesis, Georg-August Universität, Göttingen, Germany, 2016. [Google Scholar]
- Koch, M. Laser Cavitation Bubbles at Objects: Merging Numerical and Experimental Methods. Ph.D. Thesis, Georg-August Universität, Göttingen, Germany, 2020. [Google Scholar]
- Koch, M.; Lechner, C.; Reuter, F.; Köhler, K.; Mettin, R.; Lauterborn, W. Numerical modeling of laser generated cavitation bubbles with the finite volume and volume of fluid method, using OpenFOAM. Comput. Fluids 2016, 126, 71–90. [Google Scholar] [CrossRef]
- Katopodes, N.D. Volume of fluid method. In Free-Surface Flow; Butterworth-Heinemann: Oxford, UK, 2019; pp. 766–802. [Google Scholar]
- Aitken, F.; Foulc, J.-N. From Deep Sea to Laboratory 3: From Tait’s Work on the Compressibility of Seawater to Equations-of-State for Liquids; John Wiley & Sons: Hoboken, NJ, USA, 2019. [Google Scholar]
- Löfstedt, R.; Barber, B.P.; Putterman, S.J. Toward a hydrodynamic theory of sonoluminescence. Phys. Fluids A Fluid Dyn. 1993, 5, 2911–2928. [Google Scholar] [CrossRef]
- Xie, X.; Hu, M.; Chen, W.; Wei, X.; Hu, W.; Gao, X.; Yuan, X.; Hong, M. Cavitation bubble dynamics during laser wet etching of transparent sapphire substrates by 1064 nm laser irradiation. J. Laser Micro Nanoeng. 2013, 8, 259. [Google Scholar] [CrossRef]
- Zhang, H.; Lu, Z.; Zhang, P.; Gu, J.; Luo, C.; Tong, Y.; Ren, X. Experimental and numerical investigation of bubble oscillation and jet impact near a solid boundary. Opt. Laser Technol. 2021, 138, 106606. [Google Scholar] [CrossRef]
- Han, B.; Zhu, R.; Guo, Z.; Liu, L.; Ni, X.-W. Control of the liquid jet formation through the symmetric and asymmetric collapse of a single bubble generated between two parallel solid plates. Fluids 2018, 72, 114–122. [Google Scholar] [CrossRef]
- Hancox, N.; Brunton, J. A discussion on deformation of solids by the impact of liquids, and its relation to rain damage in aircraft and missiles, to blade erosion in steam turbines, and to cavitation erosion-The erosion of solids by the repeated impact of liquid drops. Philos. Trans. R. Soc. Lond. Ser. A Math. Phys. Sci. 1966, 260, 121–139. [Google Scholar]
- Shaw, S.J.; Schiffers, W.P.; Emmony, D.C. Experimental observations of the stress experienced by a solid surface when a laser-created bubble oscillates in its vicinity. J. Acoust. Soc. Am. 2001, 110, 1822–1827. [Google Scholar] [CrossRef]
- Blake, J.R.; Taib, B.B.; Doherty, G. Transient cavities near boundaries. Part 1. Rigid boundary. J. Fluid Mech. 1986, 170, 479–497. [Google Scholar] [CrossRef]
- Serruys, P.; Rensing, B. Handbook of Coronary Stents; University Medical Center Rotterdam: Rotterdam, The Netherlands, 2001. [Google Scholar]
- Vitello, D.; Ripper, R.M.; Fettiplace, M.R.; Weinberg, G.L.; Vitello, J.M. Blood Density Is Nearly Equal to Water Density: A Validation Study of the Gravimetric Method of Measuring Intraoperative Blood Loss. J. Veter. Med. 2015, 2015, 152730. [Google Scholar] [CrossRef]
- Nahirnyak, V.M.; Yoon, S.W.; Holland, C.K. Acousto-mechanical and thermal properties of clotted blood. J. Acoust. Soc. Am. 2006, 119, 3766–3772. [Google Scholar] [CrossRef] [PubMed]
- Brujan, E. Cavitation in Non-Newtonian Fluids: With Biomedical and Bioengineering Applications; Springer Science & Business Media: Berlin/Heidelberg, Germany, 2010. [Google Scholar]
- Yogeswaran, S.; Liu, F. Vascular flow simulations using SimVascular and OpenFOAM. medRxiv 2021. [Google Scholar] [CrossRef]
- Suresh, A.; Rajan, V. Study of non-Newtonian blood flow through arteries using OpenFOAM. In AIP Conference Proceedings; AIP Publishing LLC: Melville, NY, USA, 2019; p. 040003. [Google Scholar]
- Greenshields, C.J. OpenFOAM User Guide, Version 6; The OpenFOAM Foundation: London, UK, 2018; Volume 237, p. 624. [Google Scholar]
- Rigatelli, G.; Zuin, M.; Bilato, C.; Nguyen, T. Coronary artery cavitation as a trigger for atherosclerotic plaque progression: A simplified numerical and computational fluid dynamic demonstration. Rev. Cardiovasc. Med. 2022, 23, 58. [Google Scholar] [CrossRef] [PubMed]


| Rlaser (mm) | Elaser (mj) | Rinit (mm) | Tinit (K) | Pinit (MPa) | Water Hammer Impact on Other Bubble Wall | Water Hammer Impact in 96% of Cylinder Radius | Water Hammer Impact in 98% of Cylinder Radius | Water Hammer Impact in 99% of Cylinder Radius | ||||
|---|---|---|---|---|---|---|---|---|---|---|---|---|
| Pwh (MPa) | Pwh (MPa) | Pwh (MPa) | Pwh (MPa) | |||||||||
| 0.06 | 2.0 | 0.15 | 1721 | 50 | 80.5 | 23.1 | 16.0 | 45.1 | 9.3 | 50.4 | 3.7 | 52.7 |
| 0.06 | 2.6 | 0.15 | 1855 | 65 | 101.6 | 22.2 | 16.8 | 35.4 | 9.9 | 36.9 | 6.1 | 37.5 |
| 0.06 | 3.3 | 0.15 | 1969 | 80 | 111.5 | 21.6 | 22.4 | 32.7 | 17.3 | 33.5 | 14.3 | 34.3 |
| 0.08 | 4.8 | 0.2 | 1722 | 50 | 94.6 | 22.3 | 24.5 | 29.4 | 26.2 | 30.3 | 19.9 | 30.6 |
| 0.08 | 6.3 | 0.2 | 1856 | 65 | 103.2 | 21.2 | 36.7 | 27.8 | 30.4 | 33.4 | 21.8 | 36.3 |
| 0.08 | 7.7 | 0.2 | 1970 | 80 | 113.0 | 21.1 | 47.4 | 25.5 | 44.4 | 26.4 | 35.3 | 26.6 |
| 0.1 | 9.4 | 0.25 | 1722 | 50 | 111.0 | 21.5 | 62.0 | 25.1 | 52.6 | 25.5 | 46.9 | 25.8 |
| 0.1 | 12.2 | 0.25 | 1857 | 65 | 118.0 | 20.2 | 66.1 | 23.4 | 55.4 | 24.6 | 49.3 | 27.4 |
| 0.1 | 15.1 | 0.25 | 1970 | 80 | 120.4 | 19.5 | 71.2 | 21.9 | 69.9 | 22.3 | 52.7 | 22.5 |
Disclaimer/Publisher’s Note: The statements, opinions and data contained in all publications are solely those of the individual author(s) and contributor(s) and not of MDPI and/or the editor(s). MDPI and/or the editor(s) disclaim responsibility for any injury to people or property resulting from any ideas, methods, instructions or products referred to in the content. |
© 2023 by the authors. Licensee MDPI, Basel, Switzerland. This article is an open access article distributed under the terms and conditions of the Creative Commons Attribution (CC BY) license (https://creativecommons.org/licenses/by/4.0/).
Share and Cite
Hariri, A.; Shervani-Tabar, M.T.; Parvizi, R. Laser-Produced Cavitation Bubble Behavior in Newtonian and Non-Newtonian Liquid Inside a Rigid Cylinder: Numerical Study of Liquid Disc Microjet Impact Using OpenFOAM. Micromachines 2023, 14, 1416. https://doi.org/10.3390/mi14071416
Hariri A, Shervani-Tabar MT, Parvizi R. Laser-Produced Cavitation Bubble Behavior in Newtonian and Non-Newtonian Liquid Inside a Rigid Cylinder: Numerical Study of Liquid Disc Microjet Impact Using OpenFOAM. Micromachines. 2023; 14(7):1416. https://doi.org/10.3390/mi14071416
Chicago/Turabian StyleHariri, Amirhossein, Mohammad T. Shervani-Tabar, and Rezayat Parvizi. 2023. "Laser-Produced Cavitation Bubble Behavior in Newtonian and Non-Newtonian Liquid Inside a Rigid Cylinder: Numerical Study of Liquid Disc Microjet Impact Using OpenFOAM" Micromachines 14, no. 7: 1416. https://doi.org/10.3390/mi14071416
APA StyleHariri, A., Shervani-Tabar, M. T., & Parvizi, R. (2023). Laser-Produced Cavitation Bubble Behavior in Newtonian and Non-Newtonian Liquid Inside a Rigid Cylinder: Numerical Study of Liquid Disc Microjet Impact Using OpenFOAM. Micromachines, 14(7), 1416. https://doi.org/10.3390/mi14071416