
Multi-Depth Computer-Generated Hologram Based on Stochastic Gradient Descent Algorithm with Weighted Complex Loss Function and Masked Diffraction

 ,
,
Abstract
1. Introduction
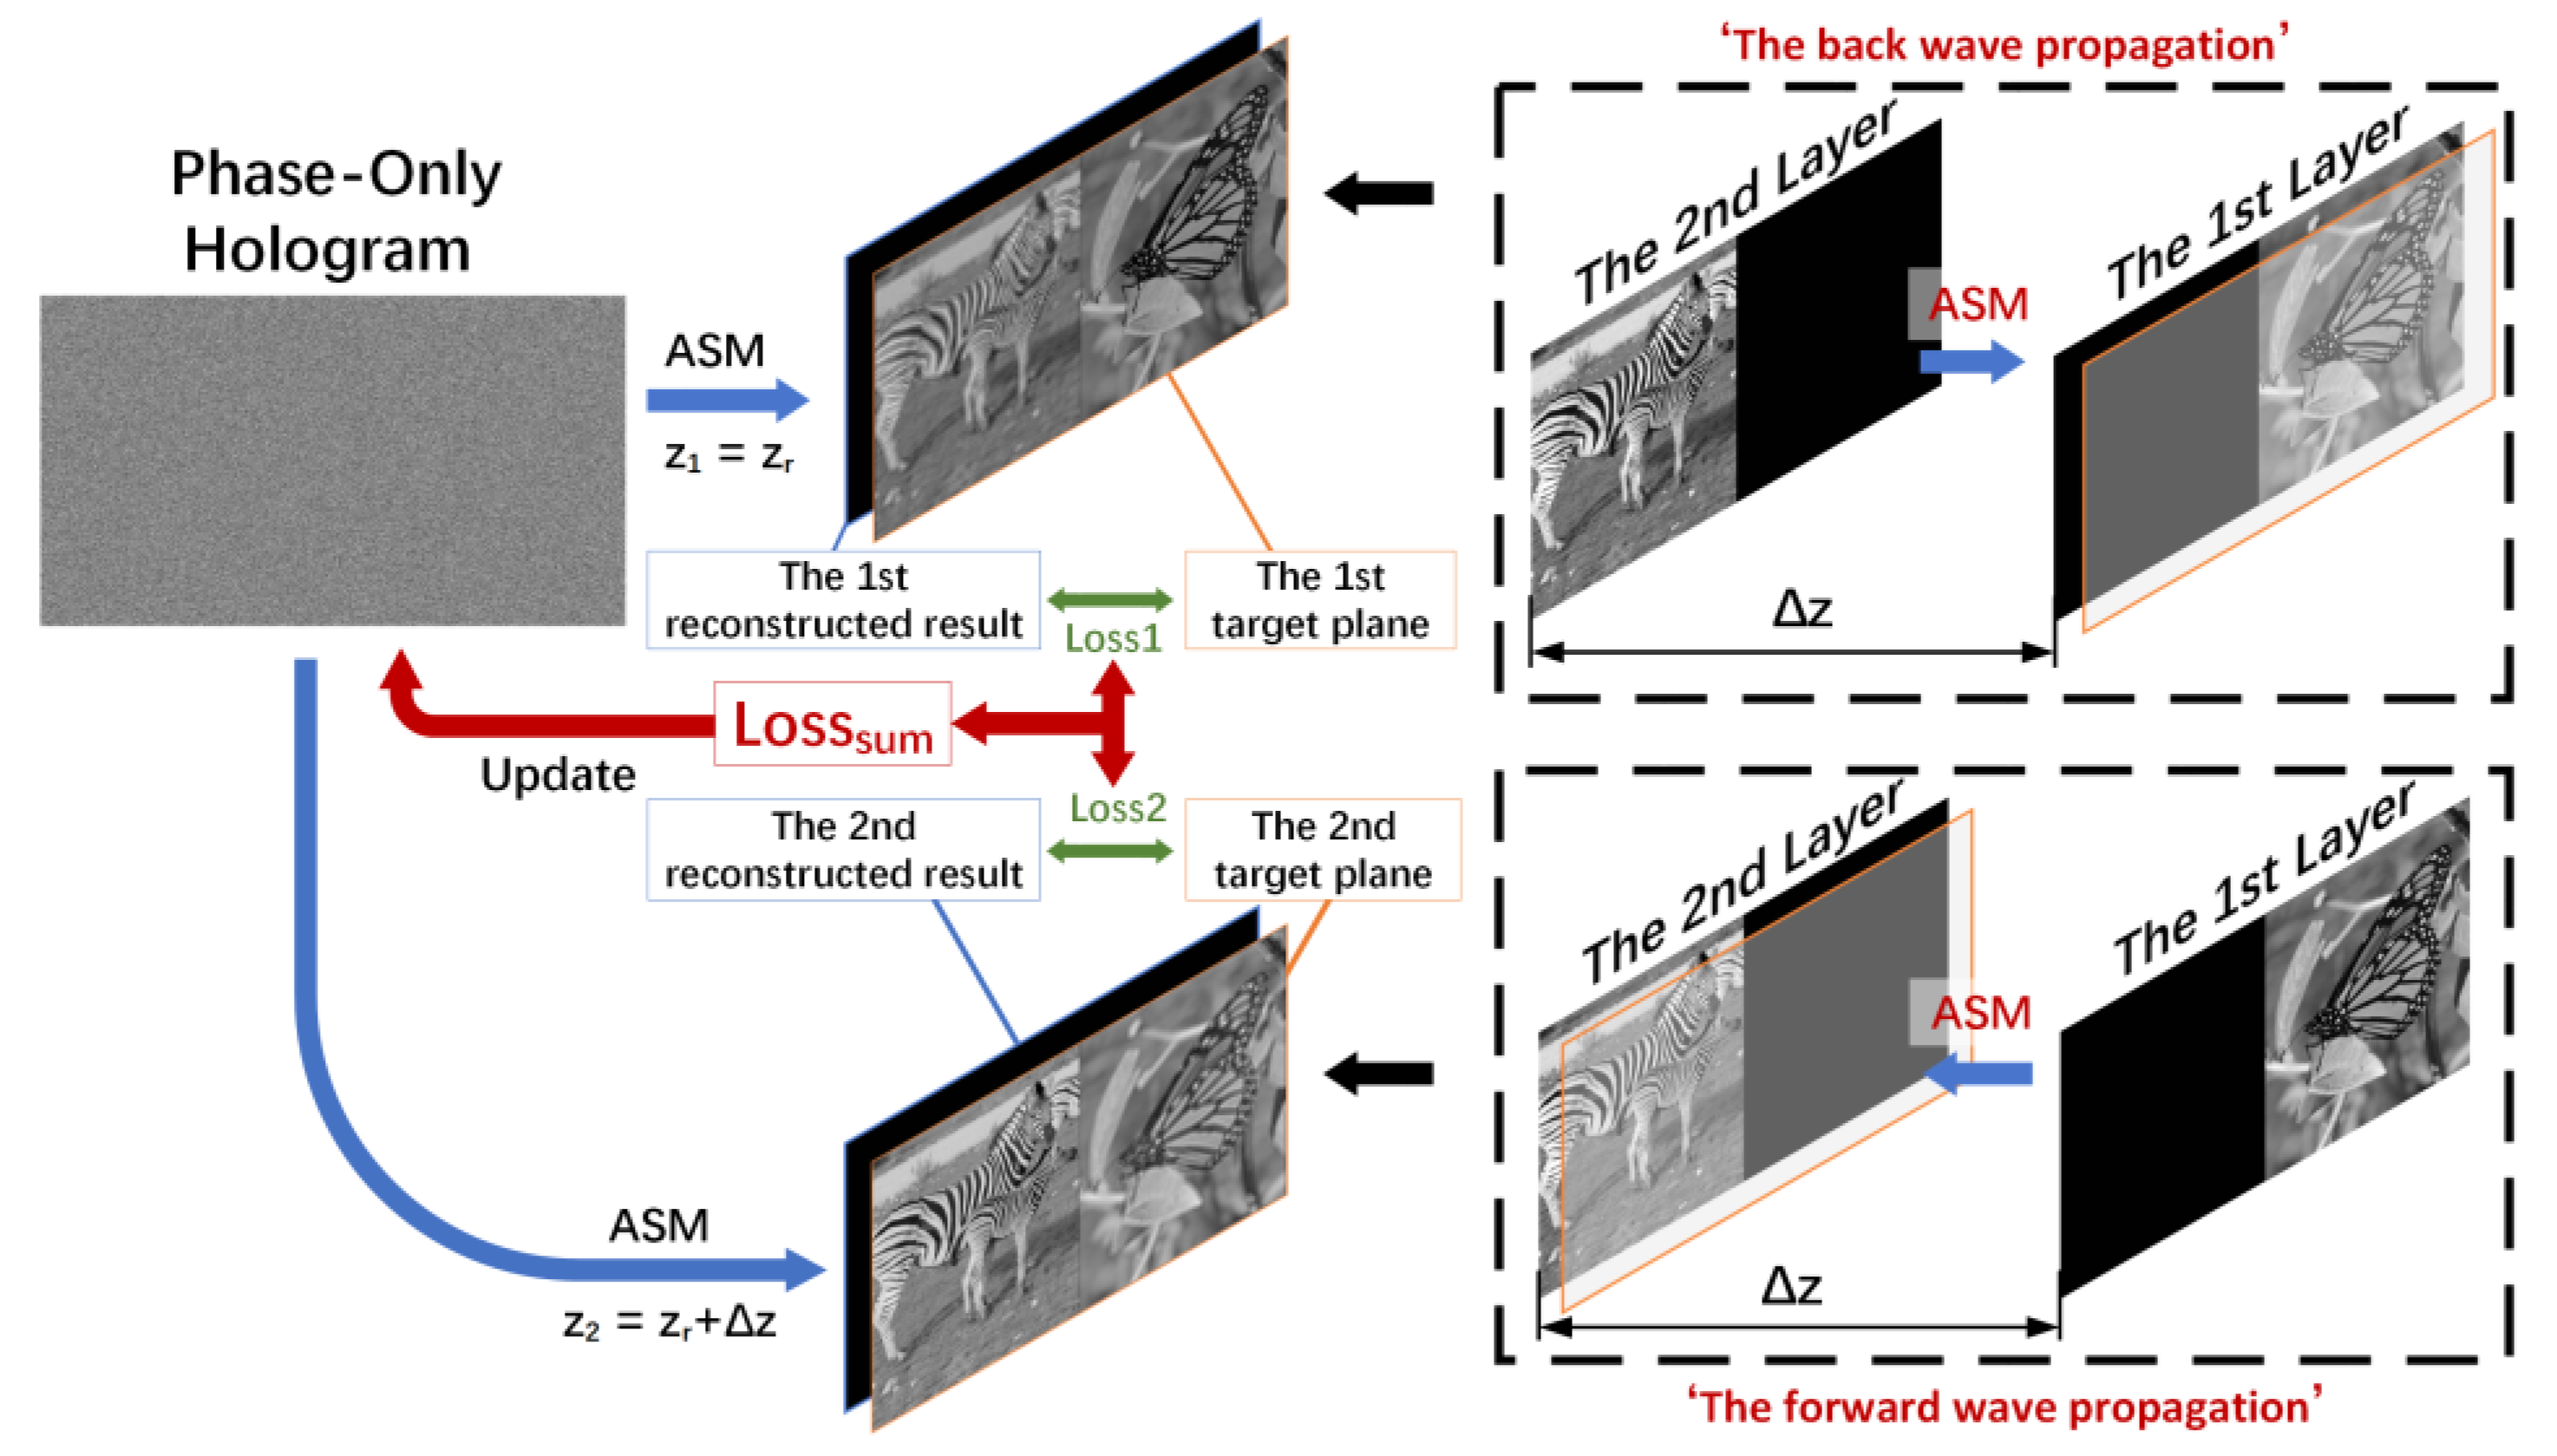
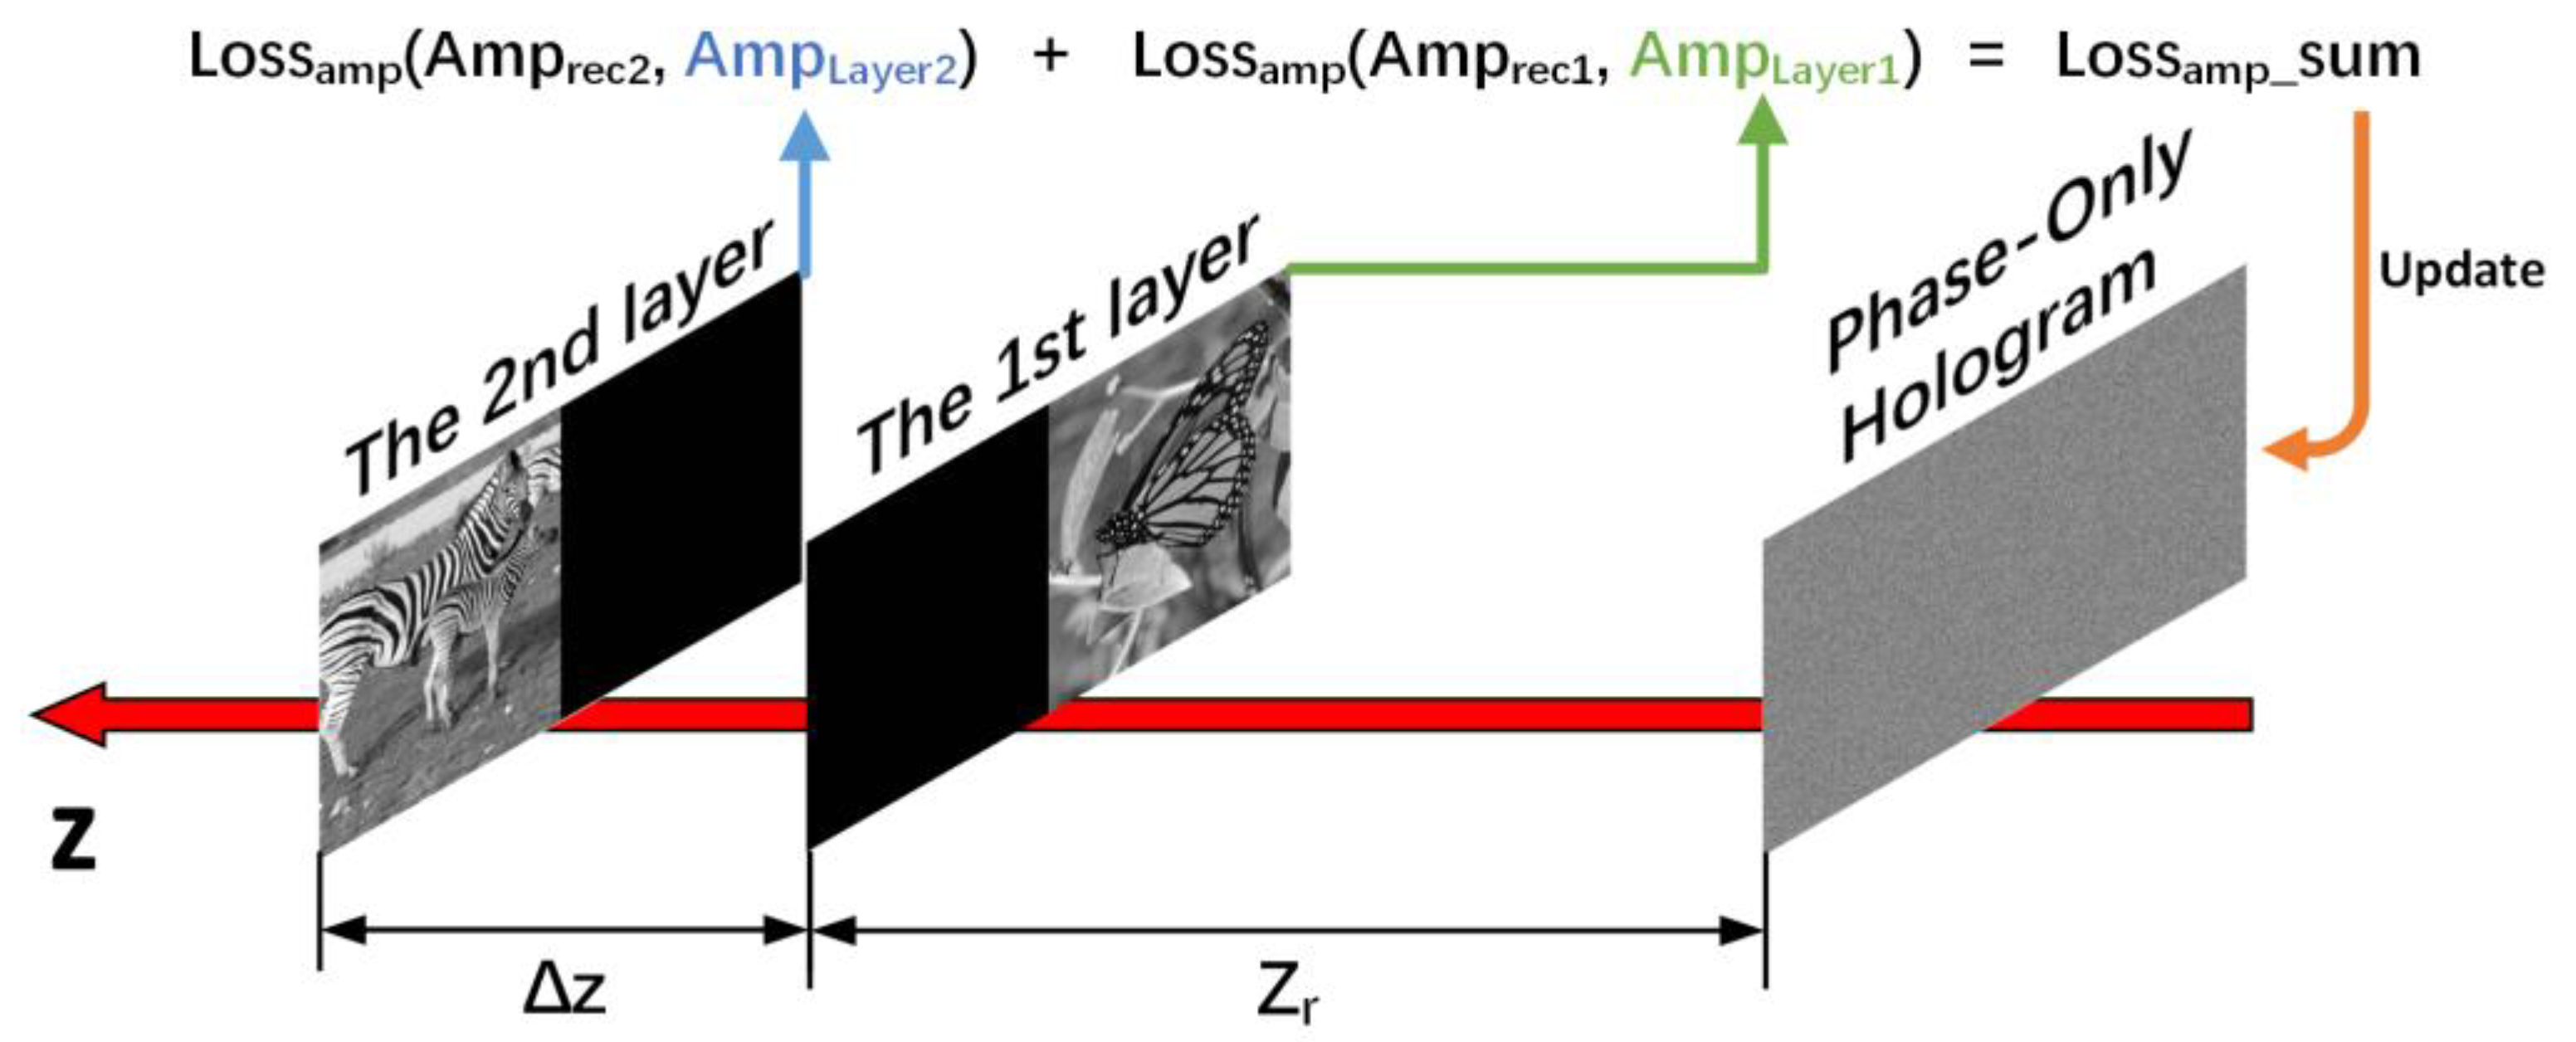
2. Methods
3. Results
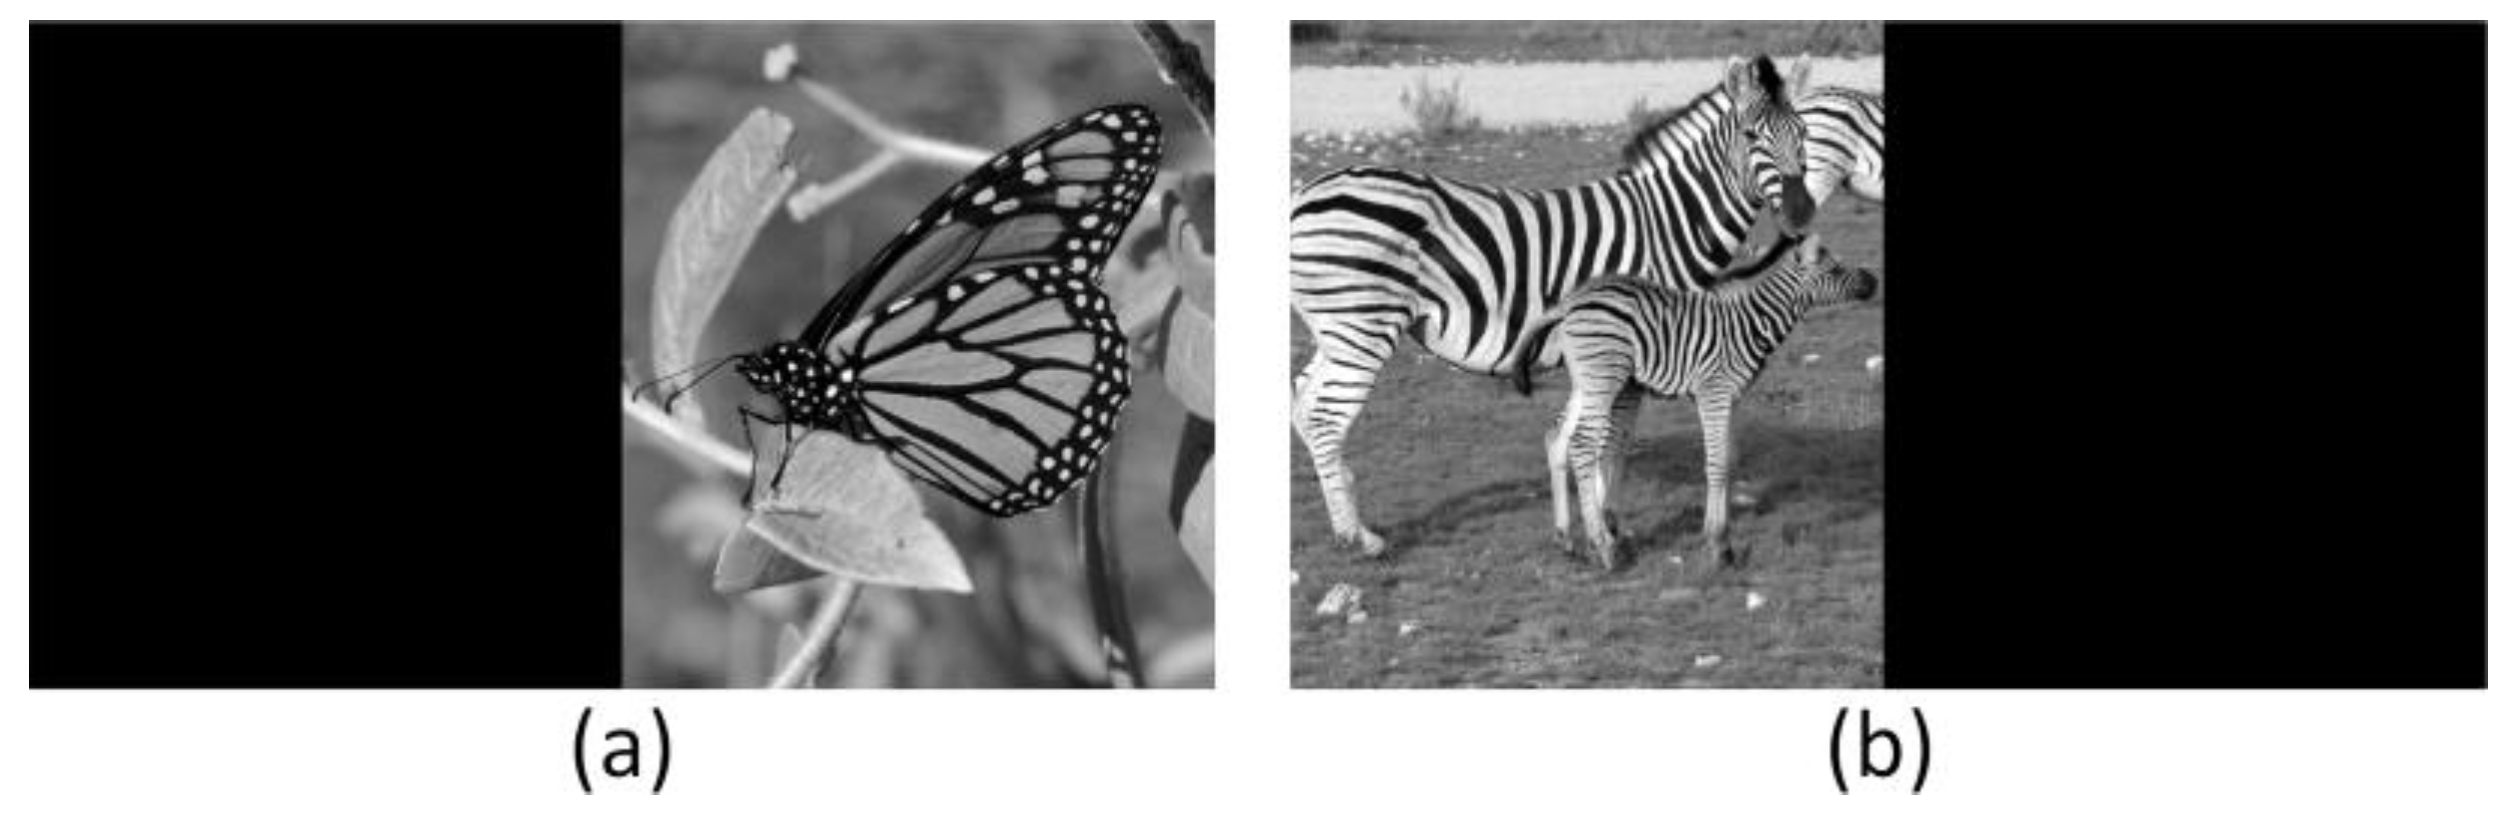
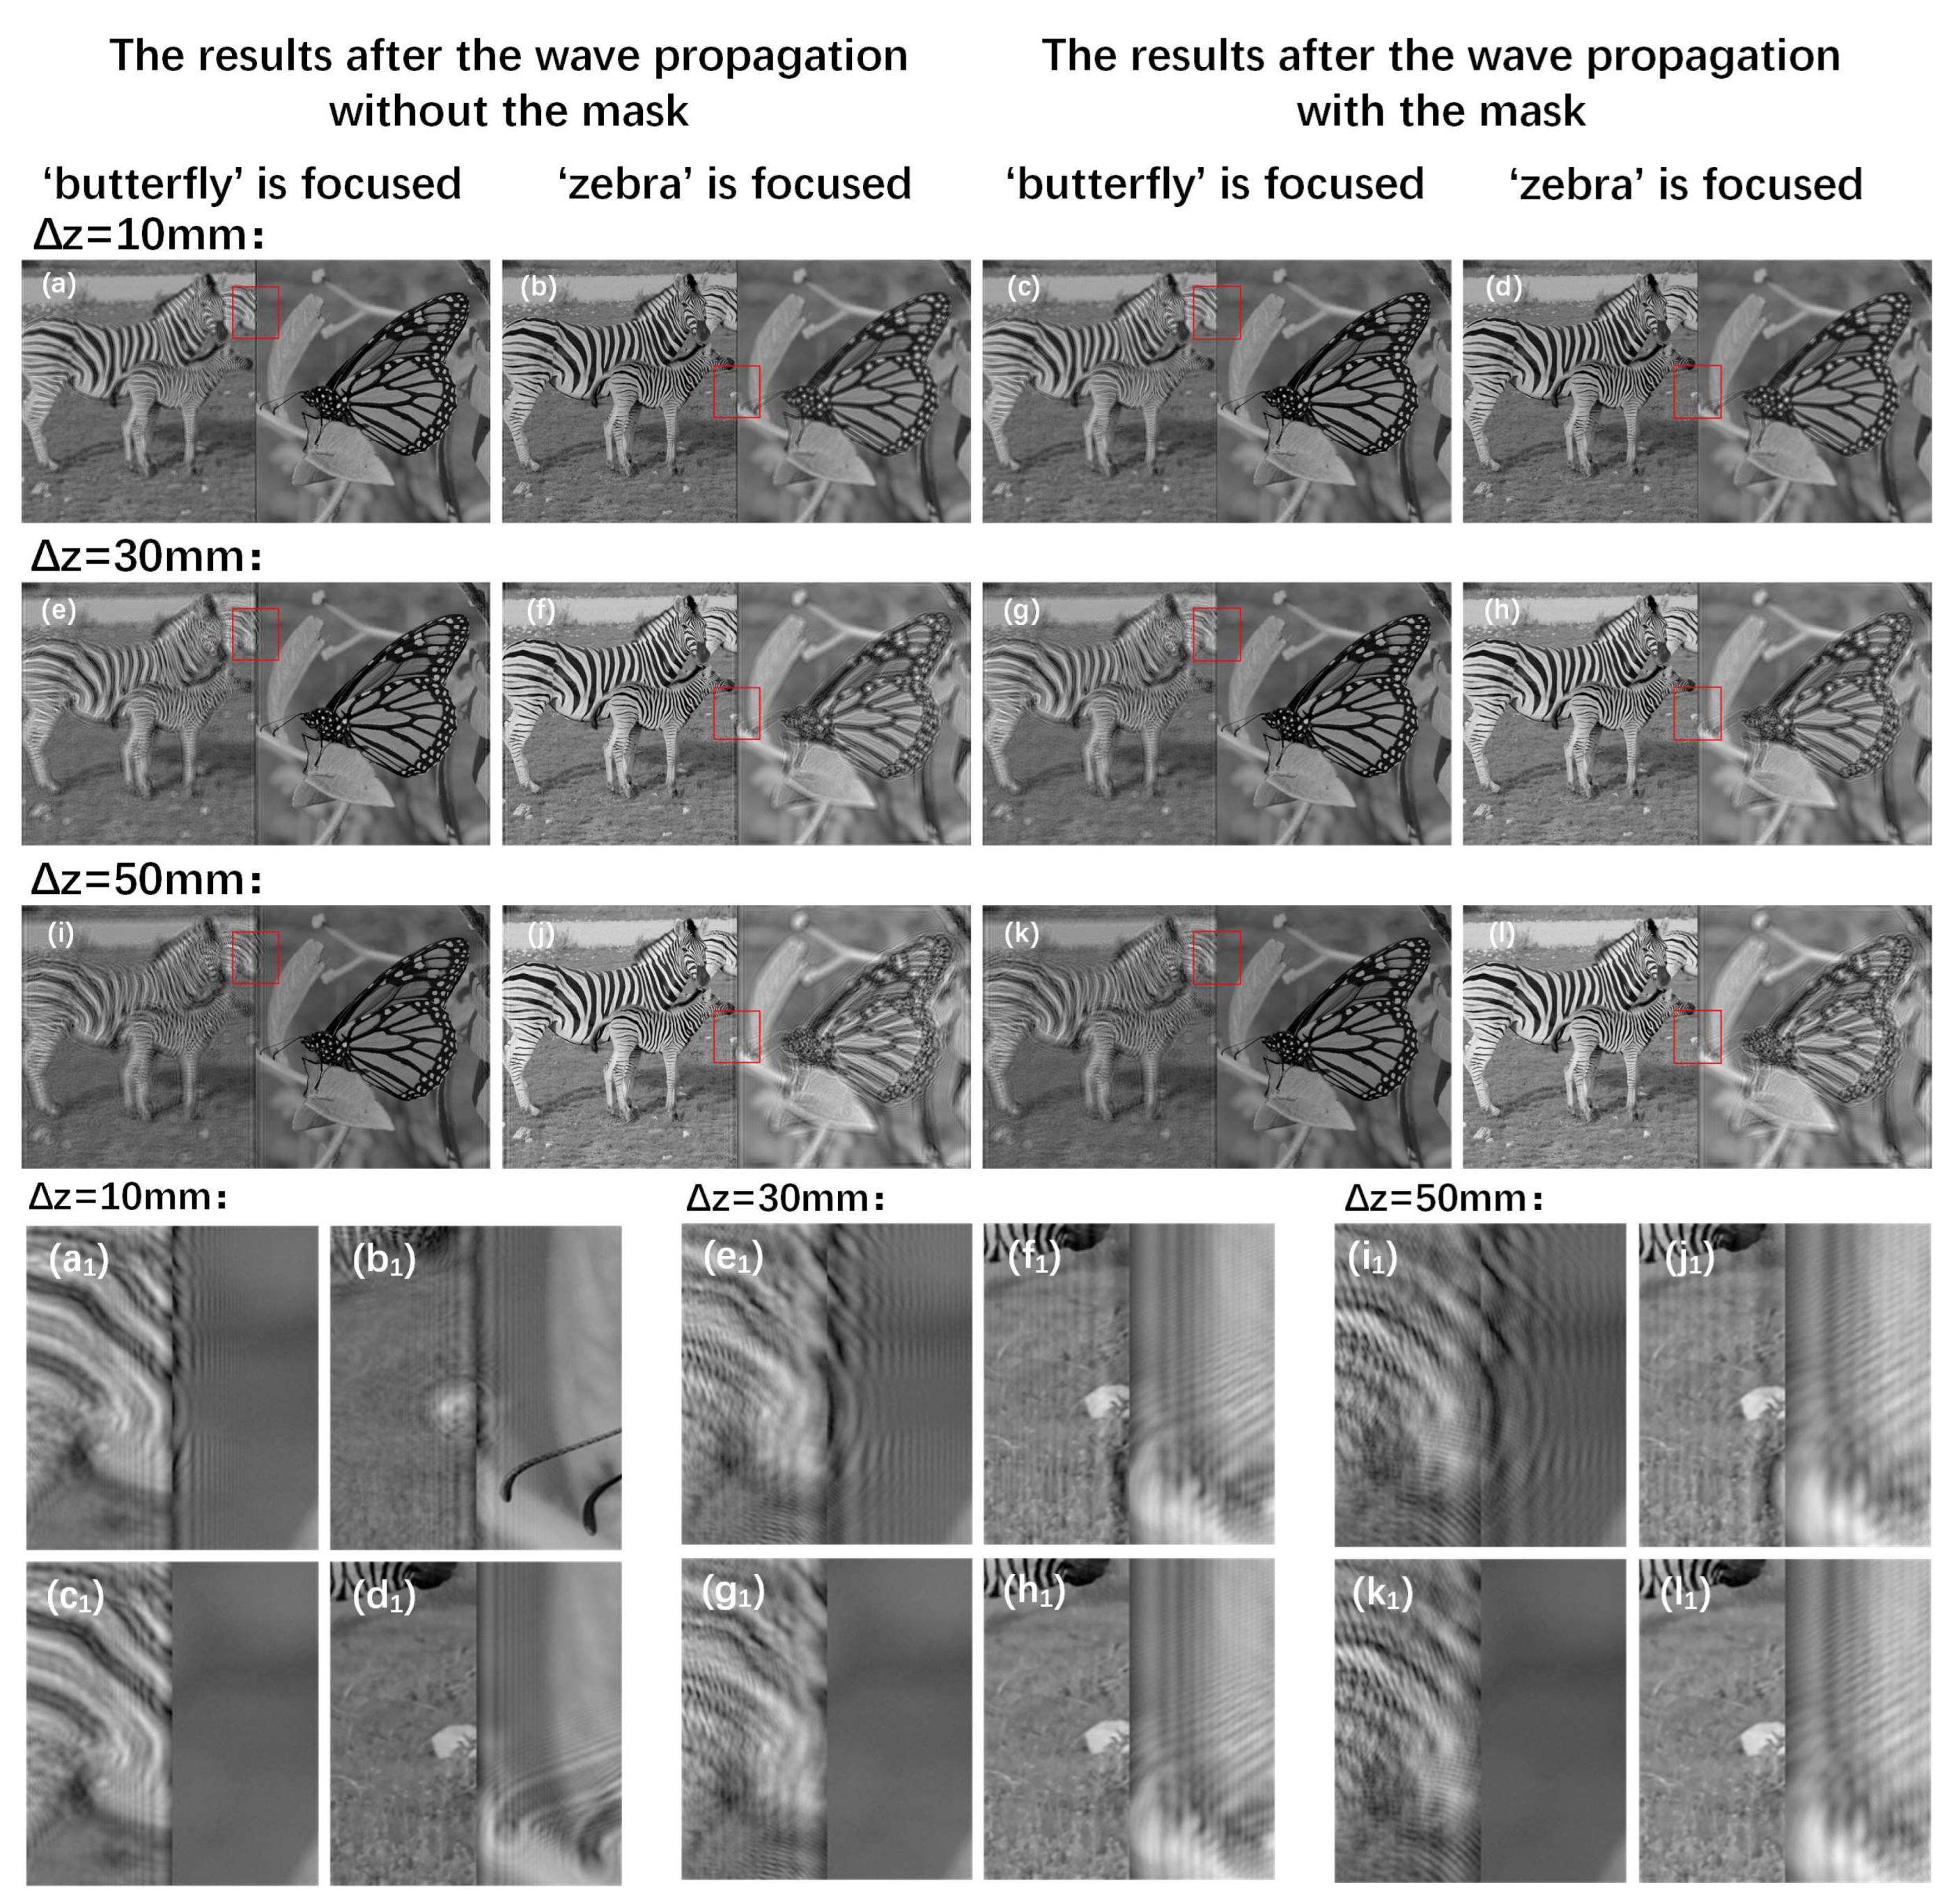
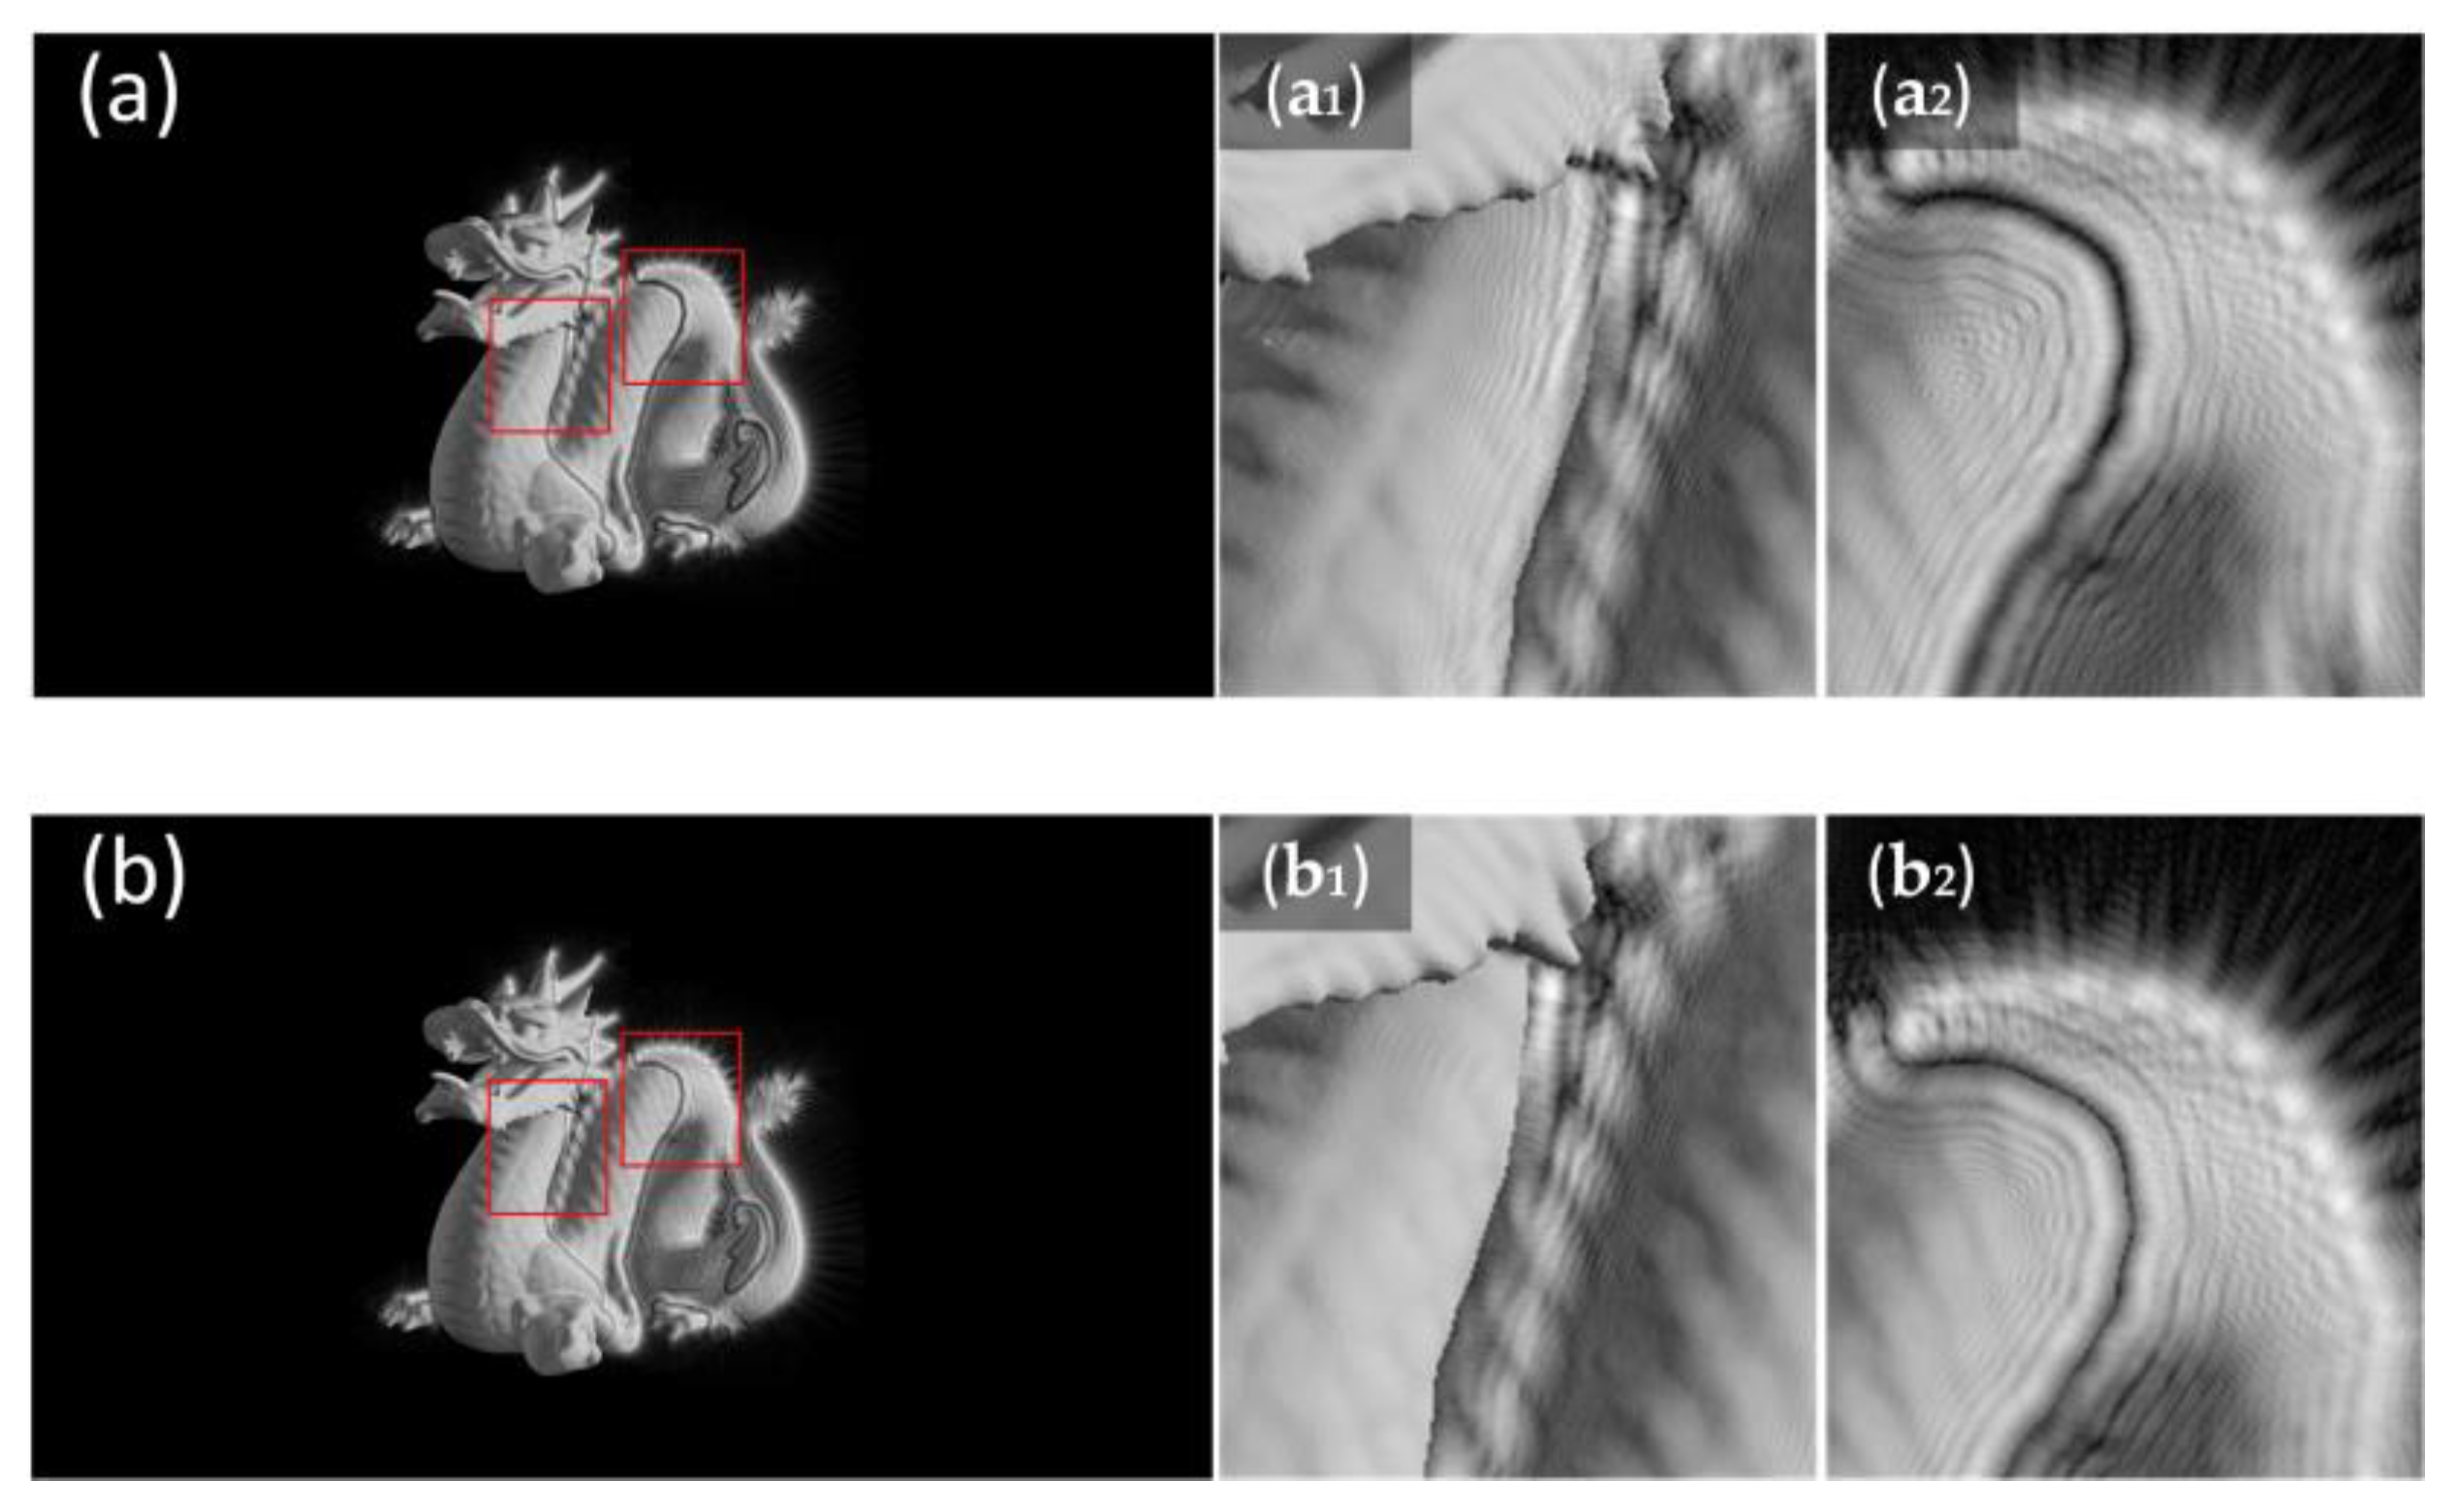
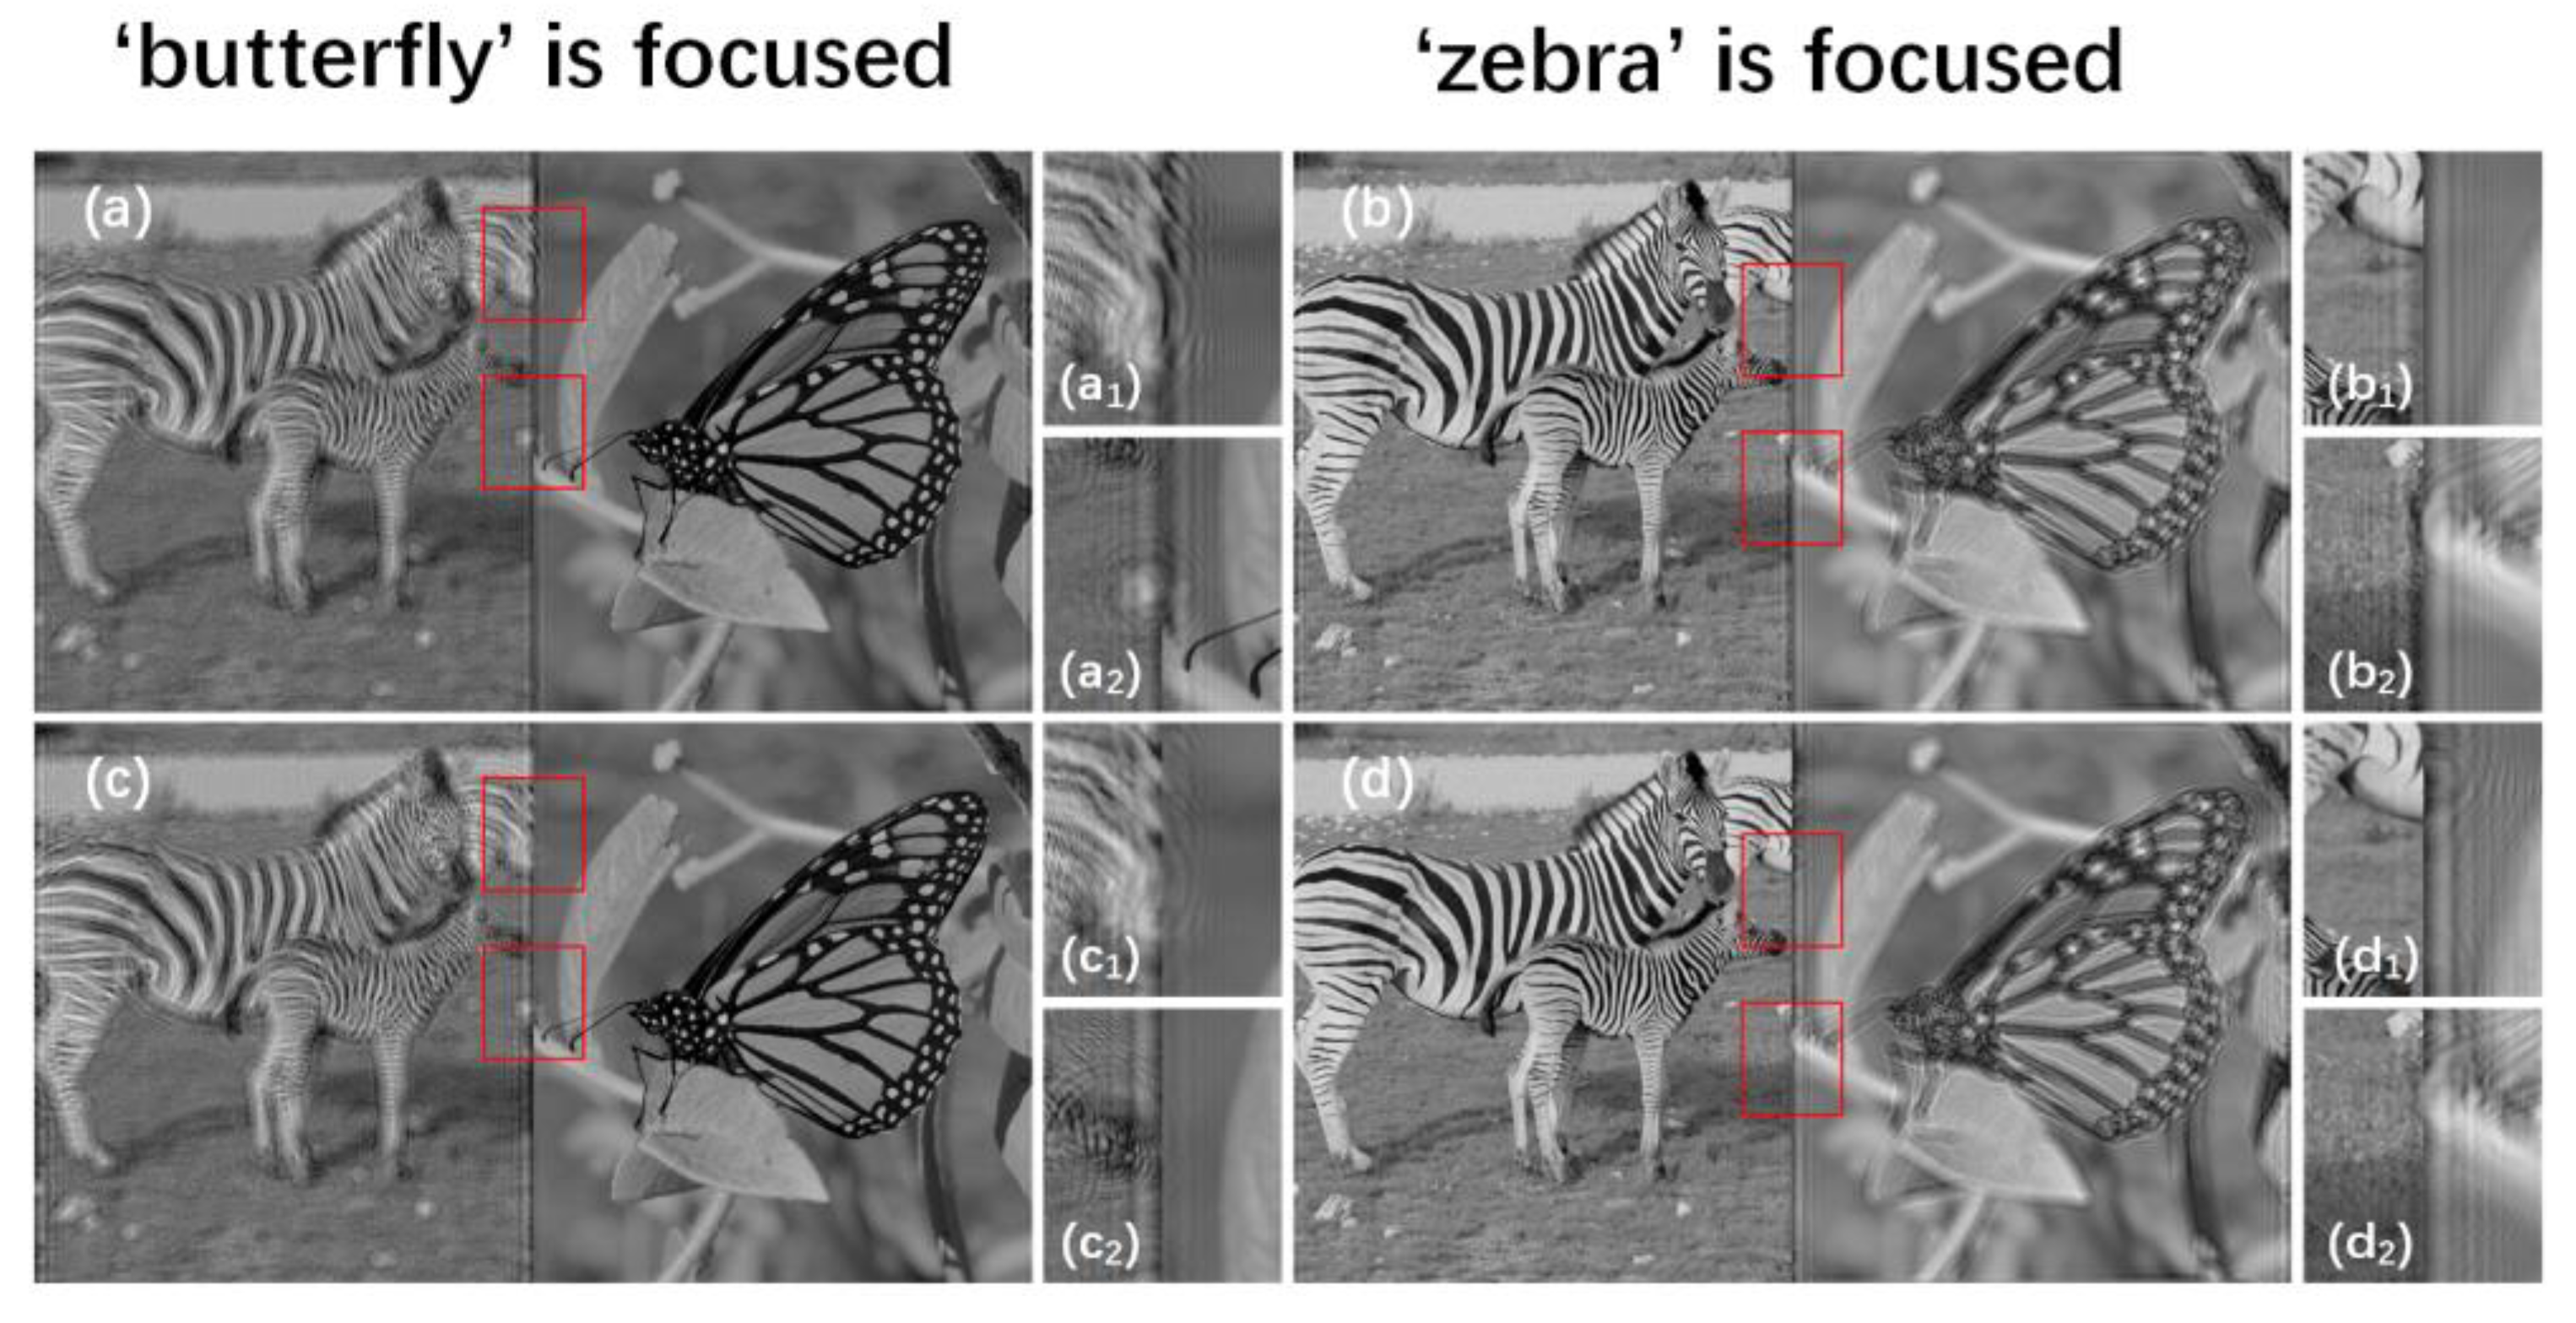
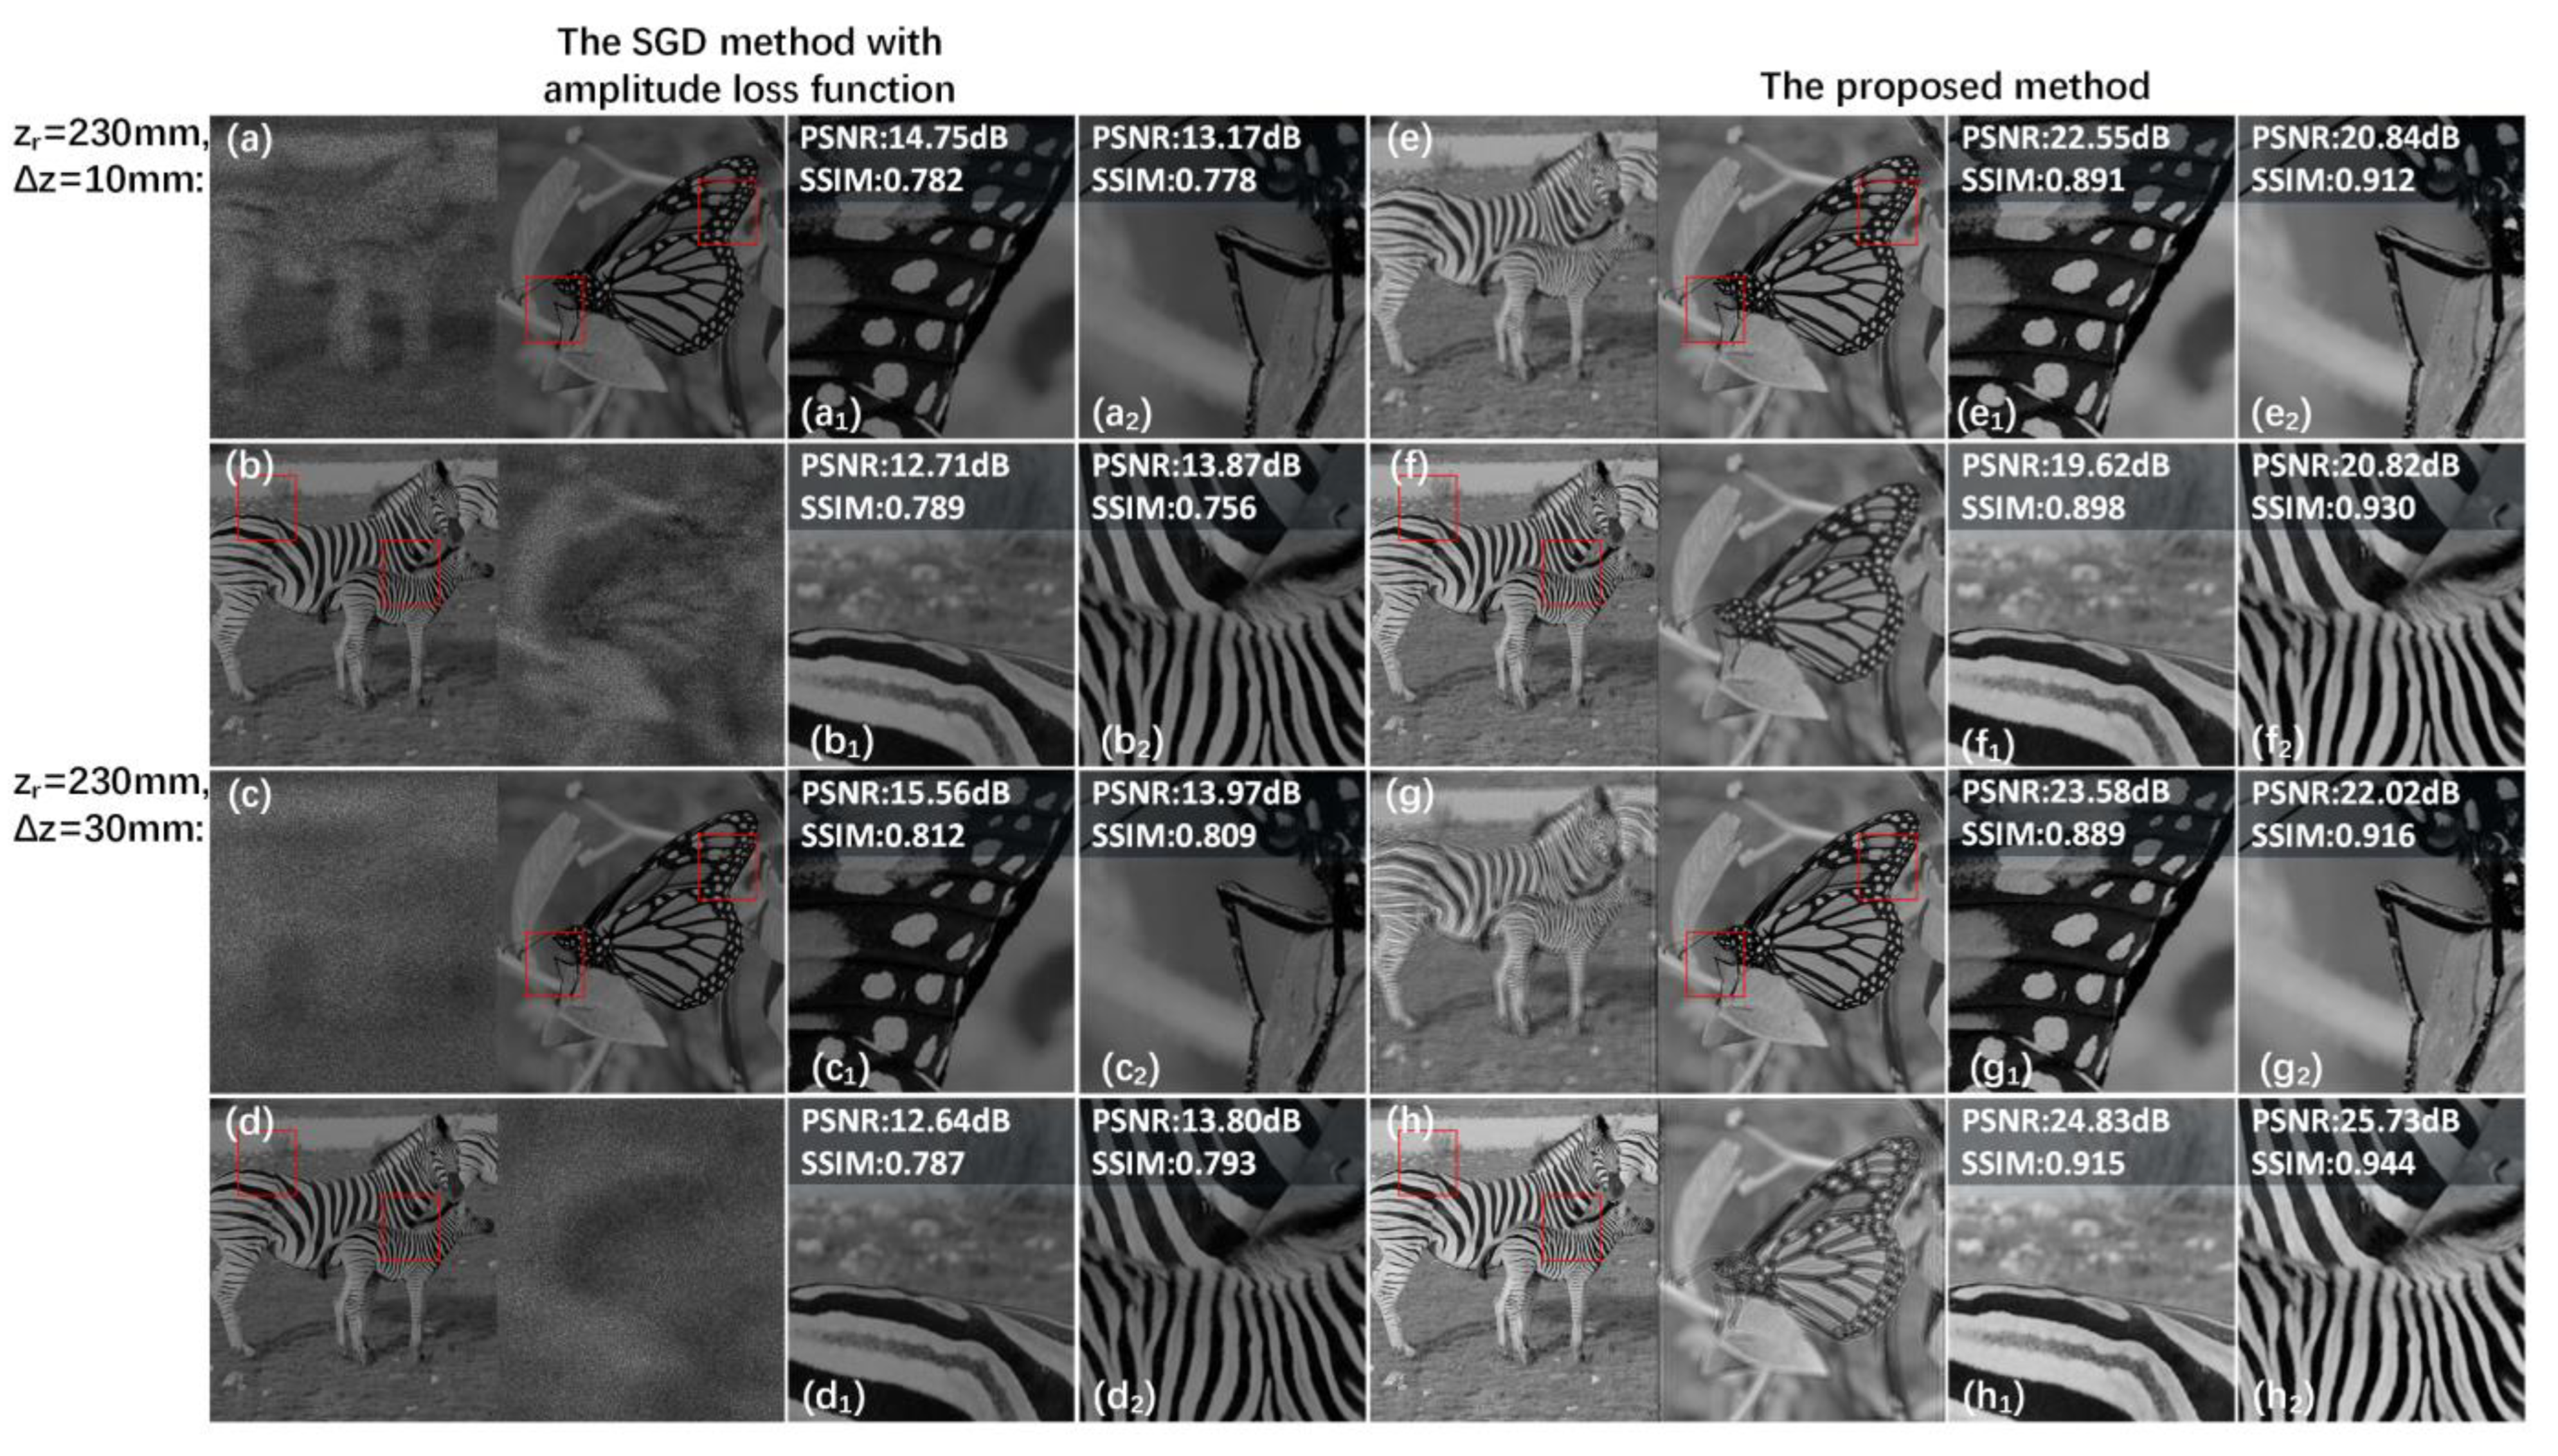
3.1. Simulation Results
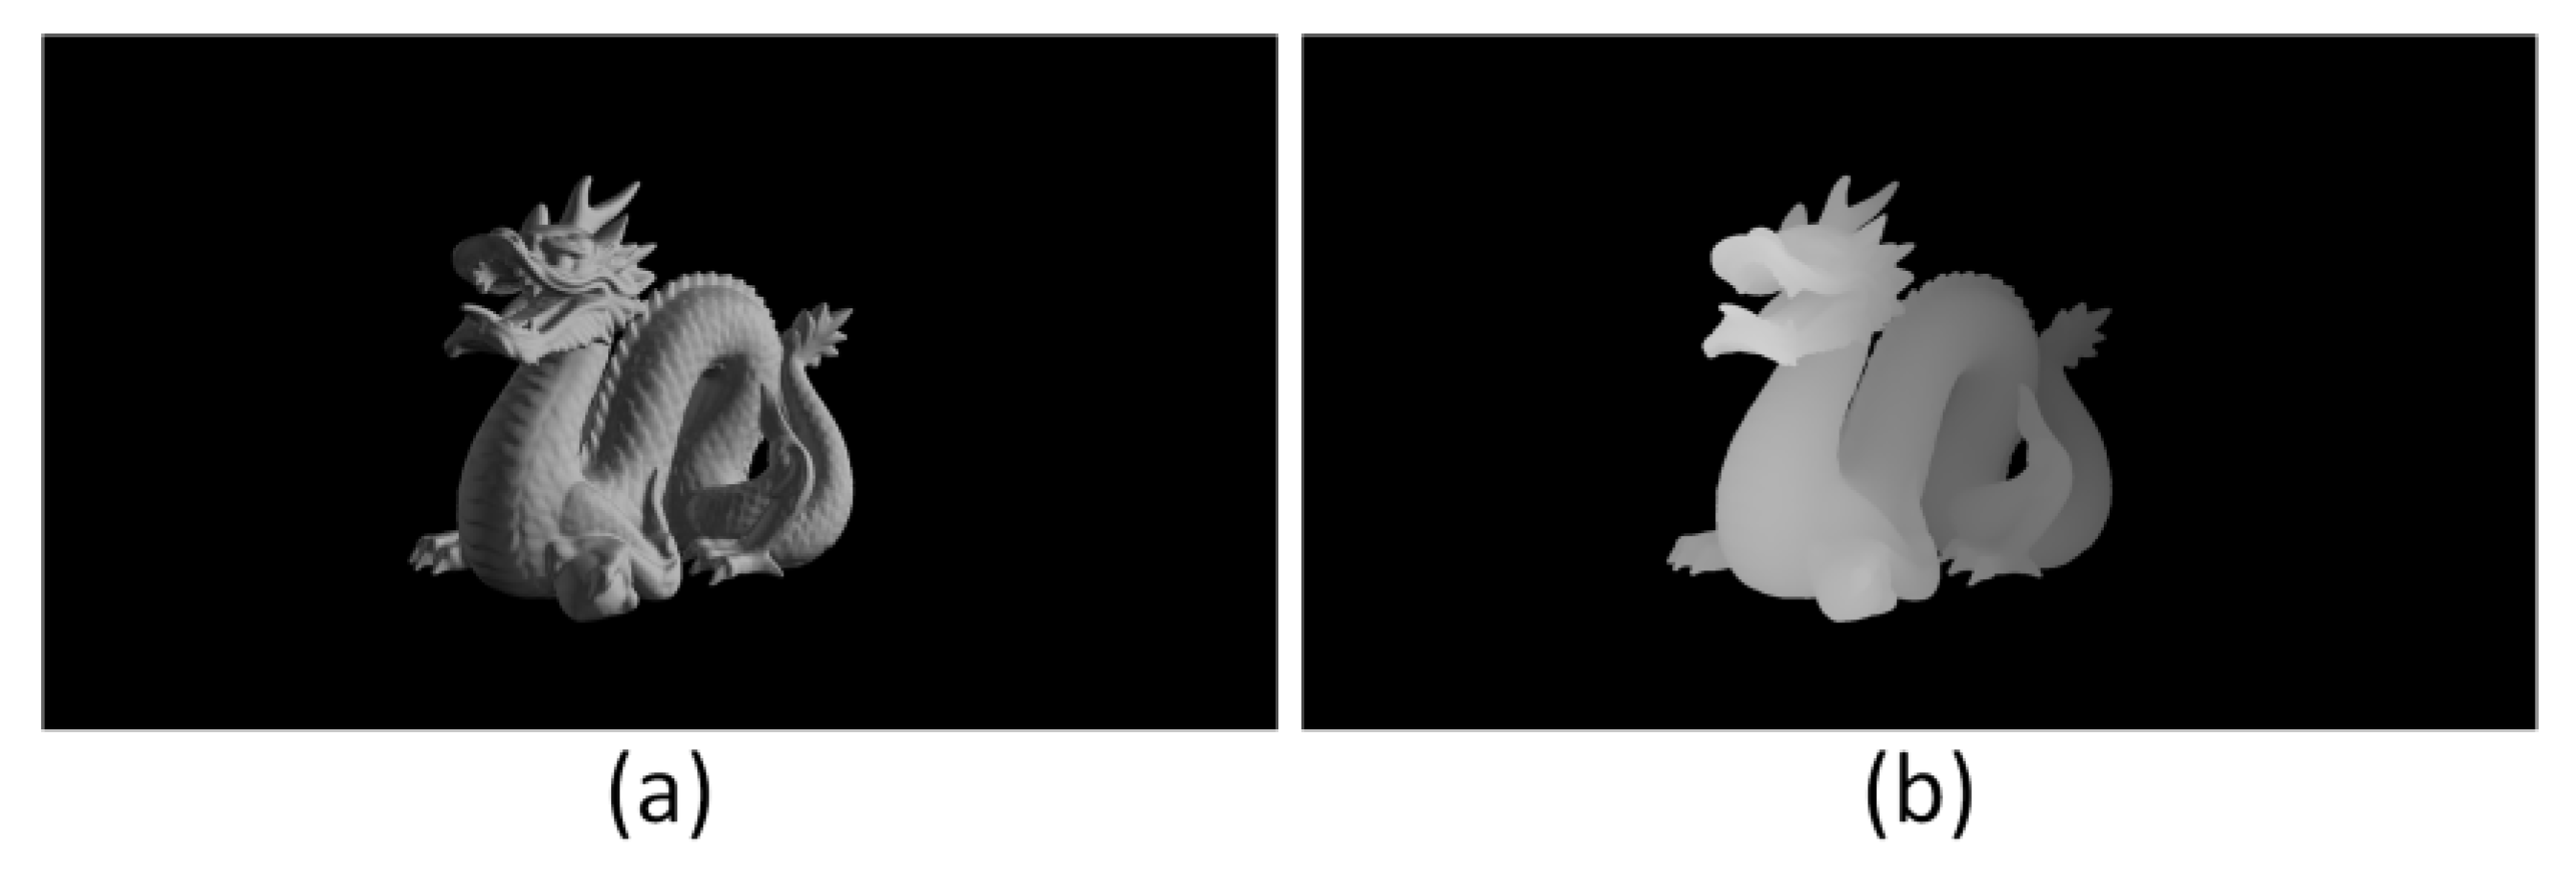
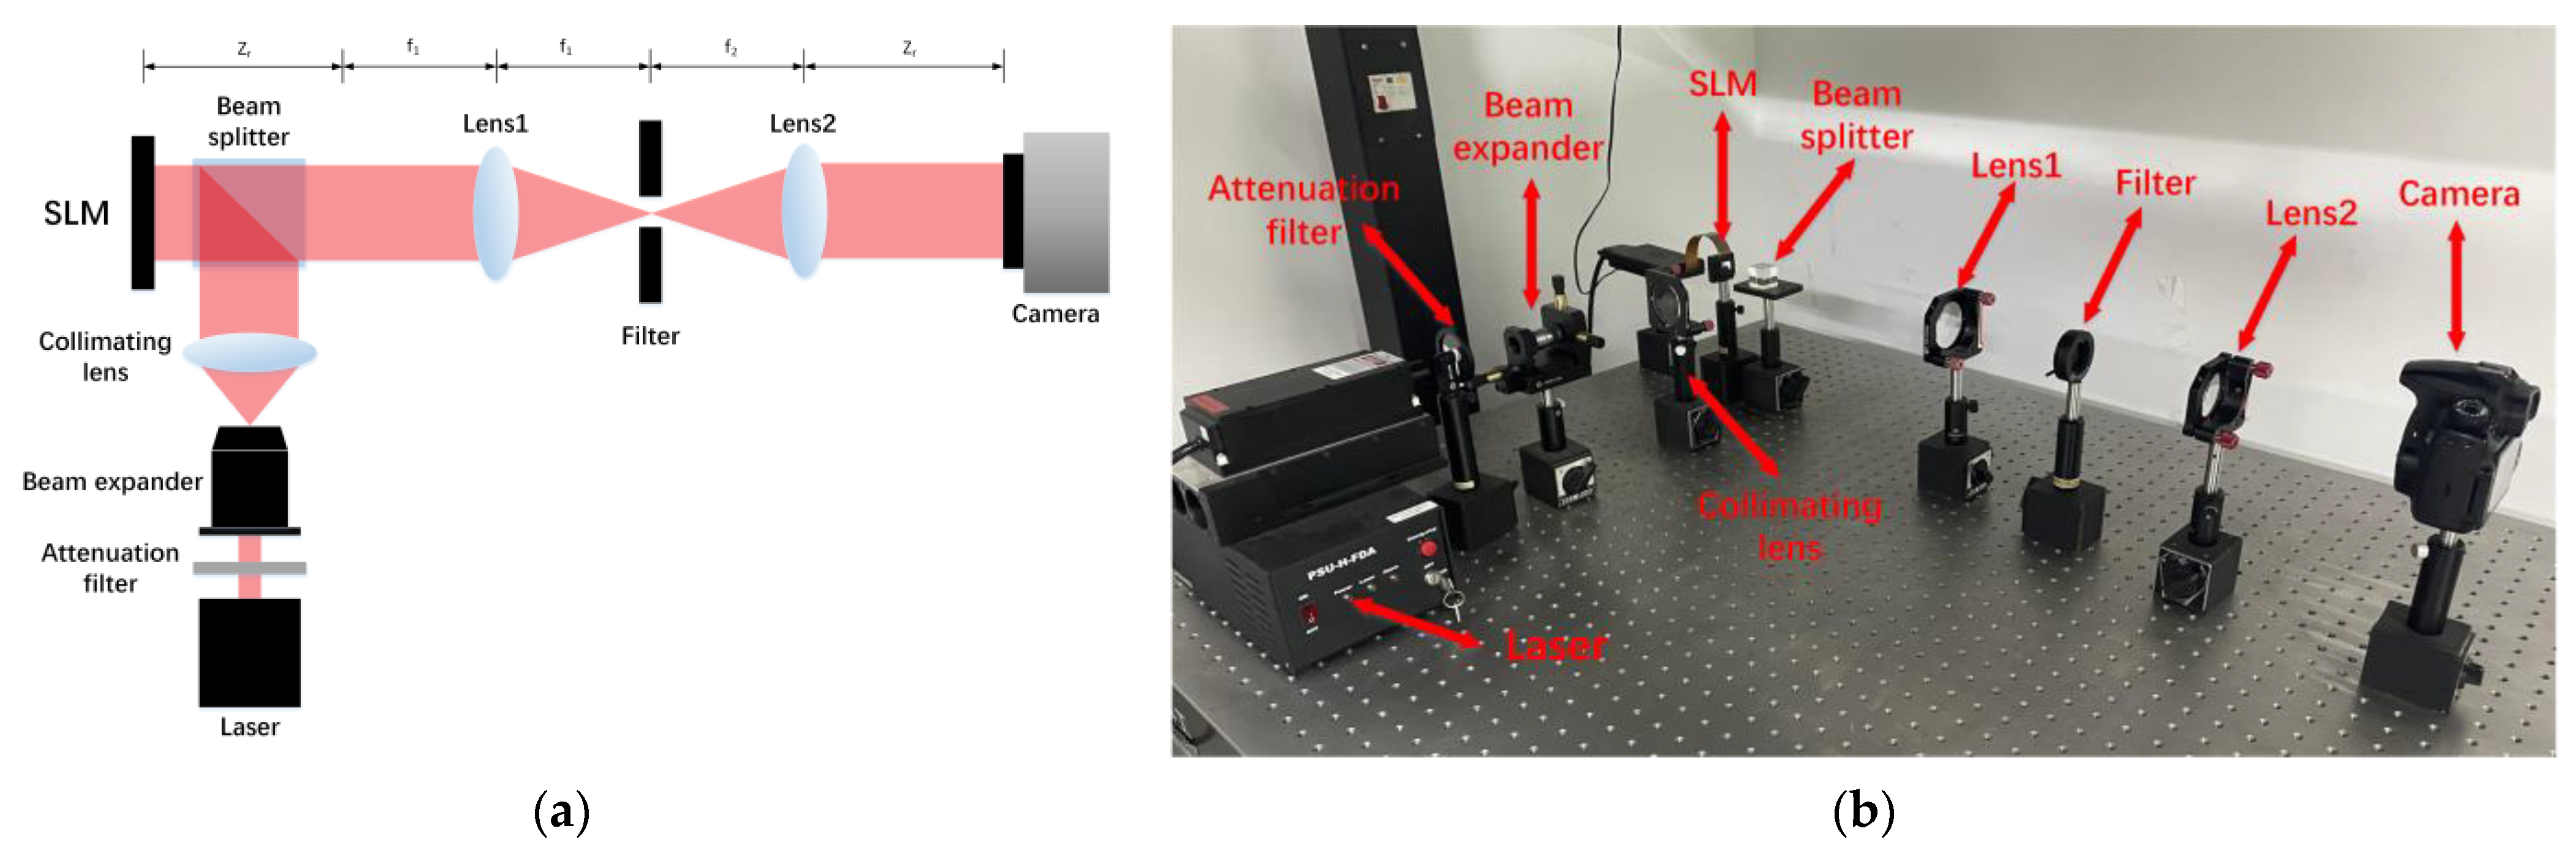
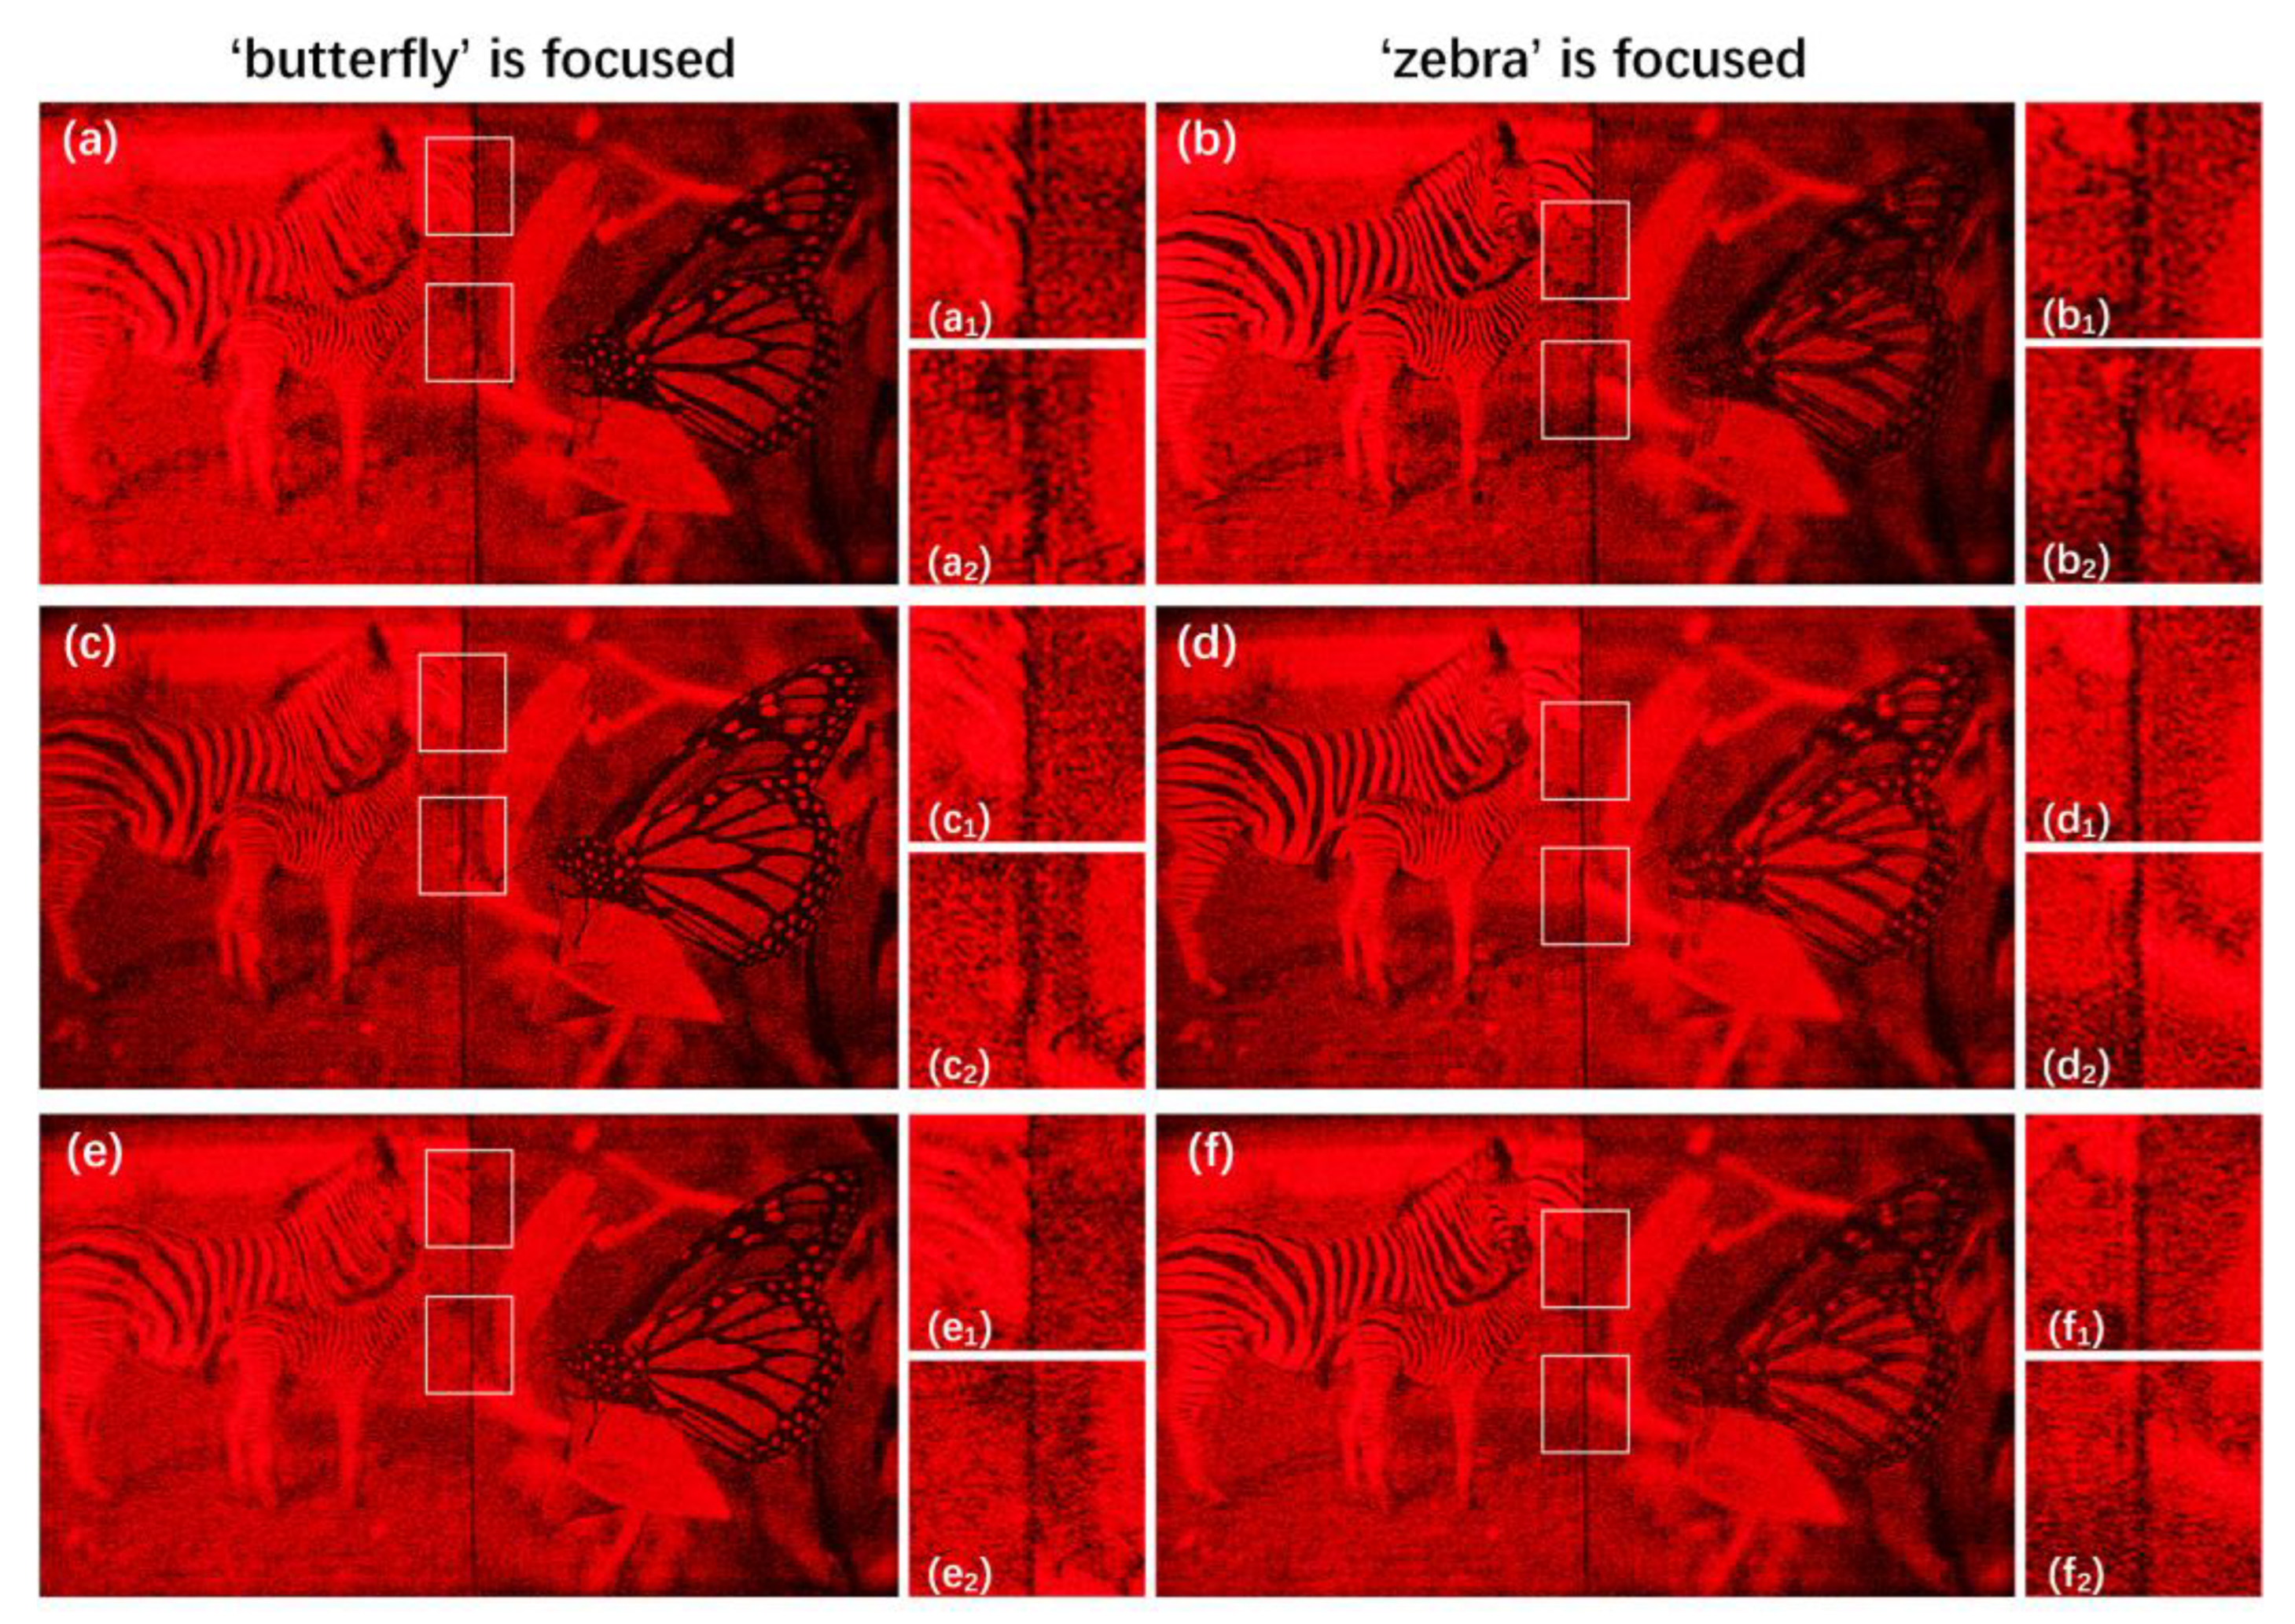
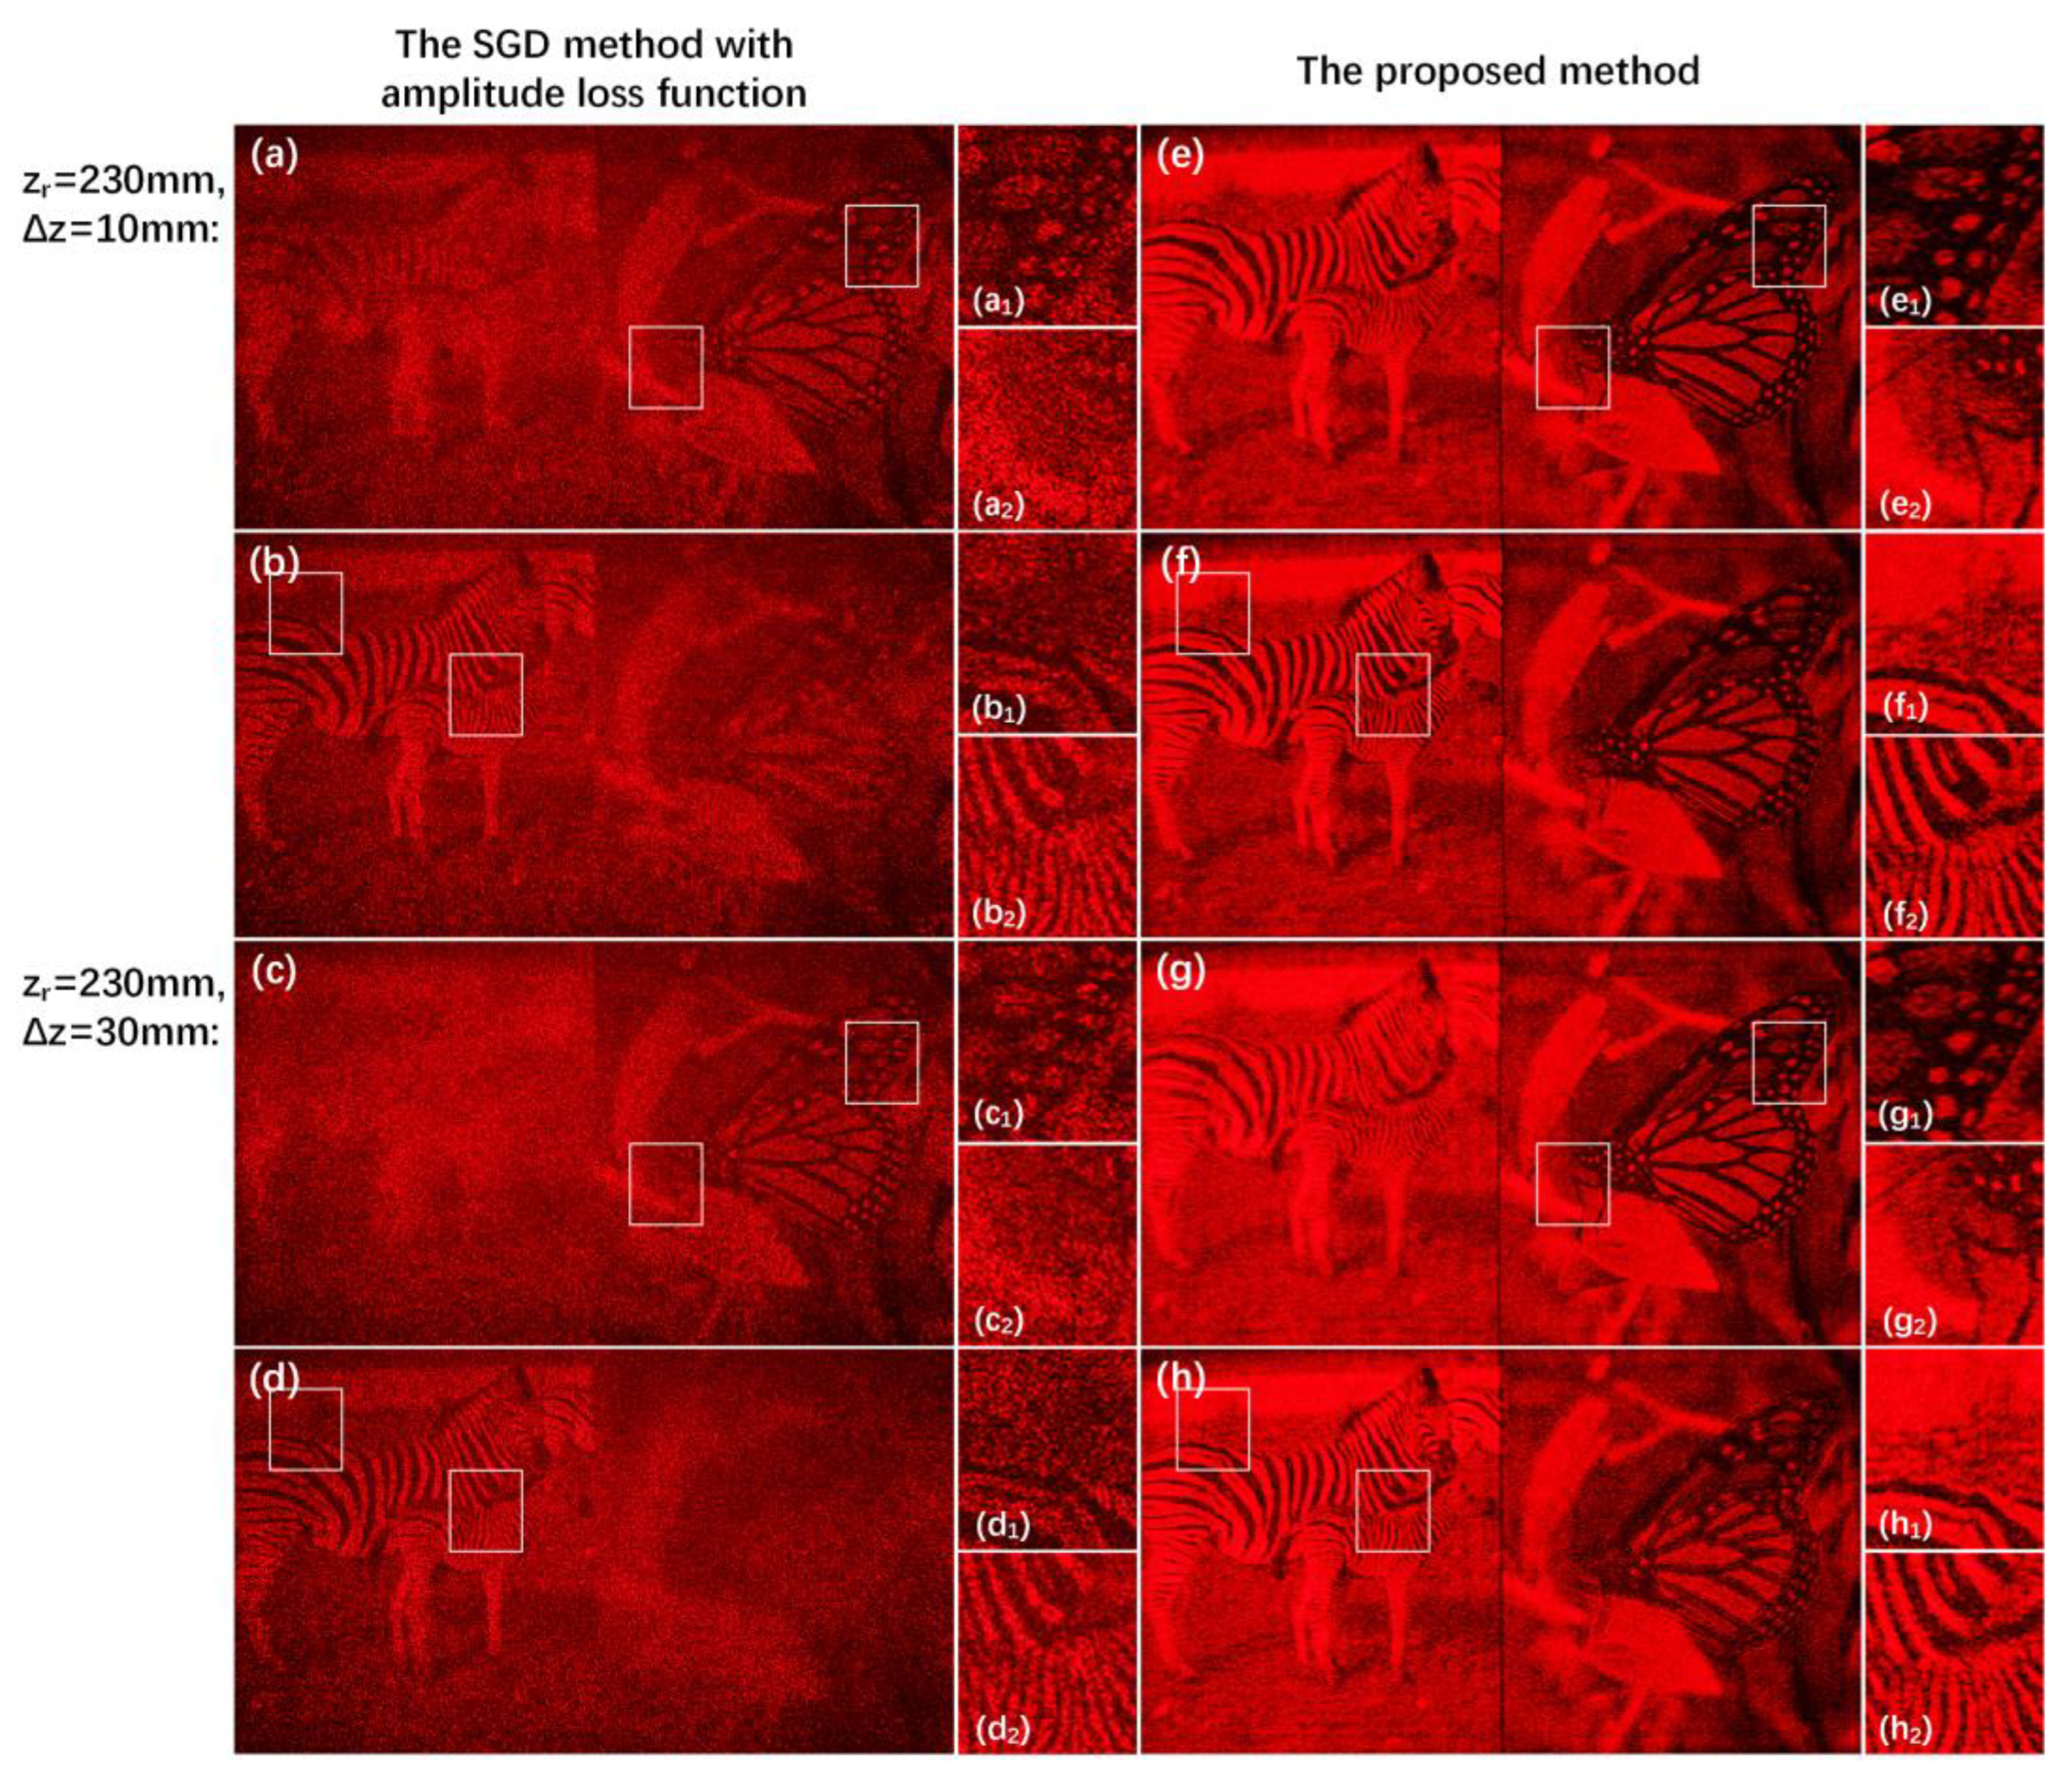
3.2. Optical Results
4. Conclusions
Author Contributions
Funding
Institutional Review Board Statement
Informed Consent Statement
Data Availability Statement
Conflicts of Interest
References
- Zhang, H.; Zhao, Y.; Cao, L.; Jin, G. Three-dimensional display technologies in wave and ray optics: A review. Chin. Opt. Lett. 2014, 12, 060002. [Google Scholar] [CrossRef]
- Wang, D.; Xiao, D.; Li, N.-N.; Liu, C.; Wang, Q.-H. Holographic display system based on effective area expansion of SLM. IEEE Photonics J. 2019, 11, 1–12. [Google Scholar] [CrossRef]
- Hong, J.; Kim, Y.; Choi, H.-J.; Hahn, J.; Park, J.-H.; Kim, H.; Min, S.-W.; Chen, N.; Lee, B. Three-dimensional display technologies of recent interest: Principles, status, and issues. Appl. Opt. 2011, 50, H87–H115. [Google Scholar] [CrossRef]
- Wen, J.; Yan, X.; Jiang, X.; Yan, Z.; Fan, F.; Li, P.; Chen, Z.; Chen, S. Integral imaging based light field display with holographic diffusor: Principles, potentials and restrictions. Opt. Express 2019, 27, 27441–27458. [Google Scholar] [CrossRef] [PubMed]
- Li, Y.L.; Li, N.N.; Wang, D.; Chu, F.; Lee, S.D.; Zheng, Y.W.; Wang, Q.H. Tunable liquid crystal grating based holographic 3D display system with wide viewing angle and large size. Light Sci. Appl. 2022, 11, 188. [Google Scholar] [CrossRef]
- Sui, X.; He, Z.; Jin, G.; Chu, D.; Cao, L. Band-limited double-phase method for enhancing image sharpness in complex modulated computer-generated holograms. Opt. Express 2021, 29, 2597–2612. [Google Scholar] [CrossRef]
- Qi, Y.; Chang, C.; Xia, J. Speckleless holographic display by complex modulation based on double-phase method. Opt. Express 2016, 24, 30368–30378. [Google Scholar] [CrossRef]
- Gerchberg, R.W. A practical algorithm for the determination of plane from image and diffraction pictures. Optik 1972, 35, 237–246. [Google Scholar]
- Rundquist, A.; Efimov, A.; Reitze, D.H. Pulse shaping with the Gerchberg–Saxton algorithm. JOSA B 2002, 19, 2468–2478. [Google Scholar] [CrossRef]
- Yang, G.-z.; Dong, B.-z.; Gu, B.-y.; Zhuang, J.-y.; Ersoy, O.K. Gerchberg–Saxton and Yang–Gu algorithms for phase retrieval in a nonunitary transform system: A comparison. Appl. Opt. 1994, 33, 209–218. [Google Scholar] [CrossRef]
- Peng, Y.; Choi, S.; Padmanaban, N.; Wetzstein, G. Neural holography with camera-in-the-loop training. ACM Trans. Graph. (TOG) 2020, 39, 1–14. [Google Scholar] [CrossRef]
- Zhang, J.; Pégard, N.; Zhong, J.; Adesnik, H.; Waller, L. 3D computer-generated holography by non-convex optimization. Optica 2017, 4, 1306–1313. [Google Scholar] [CrossRef]
- Choi, S.; Kim, J.; Peng, Y.; Wetzstein, G. Optimizing image quality for holographic near-eye displays with michelson holography. Optica 2021, 8, 143–146. [Google Scholar] [CrossRef]
- Chakravarthula, P.; Peng, Y.; Kollin, J.; Fuchs, H.; Heide, F. Wirtinger holography for near-eye displays. ACM Trans. Graph. (TOG) 2019, 38, 1–13. [Google Scholar] [CrossRef]
- Yoo, D.; Jo, Y.; Nam, S.-W.; Chen, C.; Lee, B. Optimization of computer-generated holograms featuring phase randomness control. Opt. Lett. 2021, 46, 4769–4772. [Google Scholar] [CrossRef] [PubMed]
- Chen, C.; Lee, B.; Li, N.-N.; Chae, M.; Wang, D.; Wang, Q.-H.; Lee, B. Multi-depth hologram generation using stochastic gradient descent algorithm with complex loss function. Opt. Express 2021, 29, 15089–15103. [Google Scholar] [CrossRef]
- Lee, J.; Jeong, J.; Cho, J.; Yoo, D.; Lee, B.; Lee, B. Deep neural network for multi-depth hologram generation and its training strategy. Opt. Express 2020, 28, 27137–27154. [Google Scholar] [CrossRef]
- Zhao, Y.; Cao, L.; Zhang, H.; Kong, D.; Jin, G. Accurate calculation of computer-generated holograms using angular-spectrum layer-oriented method. Opt. Express 2015, 23, 25440–25449. [Google Scholar] [CrossRef]
- Chen, J.-S.; Chu, D. Improved layer-based method for rapid hologram generation and real-time interactive holographic display applications. Opt. Express 2015, 23, 18143–18155. [Google Scholar] [CrossRef]
- Zhang, H.; Cao, L.; Jin, G. Computer-generated hologram with occlusion effect using layer-based processing. Appl. Opt. 2017, 56, F138–F143. [Google Scholar] [CrossRef]
- Kavaklı, K.; Itoh, Y.; Urey, H.; Akşit, K. Realistic Defocus Blur for Multiplane Computer-Generated Holography. arXiv 2022, arXiv:2205.07030. [Google Scholar]


| Method | = 230 mm, = 10 mm | = 230 mm, = 30 mm | = 230 mm, = 50 mm |
|---|---|---|---|
| The proposed method | 48.9338 s | 47.5858 s | 48.8018 s |
| The SGD method with complex loss function | 30.6387 s | 28.7206 s | 28.1467 s |
Disclaimer/Publisher’s Note: The statements, opinions and data contained in all publications are solely those of the individual author(s) and contributor(s) and not of MDPI and/or the editor(s). MDPI and/or the editor(s) disclaim responsibility for any injury to people or property resulting from any ideas, methods, instructions or products referred to in the content. |
© 2023 by the authors. Licensee MDPI, Basel, Switzerland. This article is an open access article distributed under the terms and conditions of the Creative Commons Attribution (CC BY) license (https://creativecommons.org/licenses/by/4.0/).
Share and Cite
Quan, J.; Yan, B.; Sang, X.; Zhong, C.; Li, H.; Qin, X.; Xiao, R.; Sun, Z.; Dong, Y.; Zhang, H. Multi-Depth Computer-Generated Hologram Based on Stochastic Gradient Descent Algorithm with Weighted Complex Loss Function and Masked Diffraction. Micromachines 2023, 14, 605. https://doi.org/10.3390/mi14030605
Quan J, Yan B, Sang X, Zhong C, Li H, Qin X, Xiao R, Sun Z, Dong Y, Zhang H. Multi-Depth Computer-Generated Hologram Based on Stochastic Gradient Descent Algorithm with Weighted Complex Loss Function and Masked Diffraction. Micromachines. 2023; 14(3):605. https://doi.org/10.3390/mi14030605
Chicago/Turabian StyleQuan, Jiale, Binbin Yan, Xinzhu Sang, Chongli Zhong, Hui Li, Xiujuan Qin, Rui Xiao, Zhi Sun, Yu Dong, and Huming Zhang. 2023. "Multi-Depth Computer-Generated Hologram Based on Stochastic Gradient Descent Algorithm with Weighted Complex Loss Function and Masked Diffraction" Micromachines 14, no. 3: 605. https://doi.org/10.3390/mi14030605
APA StyleQuan, J., Yan, B., Sang, X., Zhong, C., Li, H., Qin, X., Xiao, R., Sun, Z., Dong, Y., & Zhang, H. (2023). Multi-Depth Computer-Generated Hologram Based on Stochastic Gradient Descent Algorithm with Weighted Complex Loss Function and Masked Diffraction. Micromachines, 14(3), 605. https://doi.org/10.3390/mi14030605