


Prediction Model for Liquid-Assisted Femtosecond Laser Micro Milling of Quartz without Taper

Abstract
:1. Introduction
2. Materials and Methods
2.1. Materials
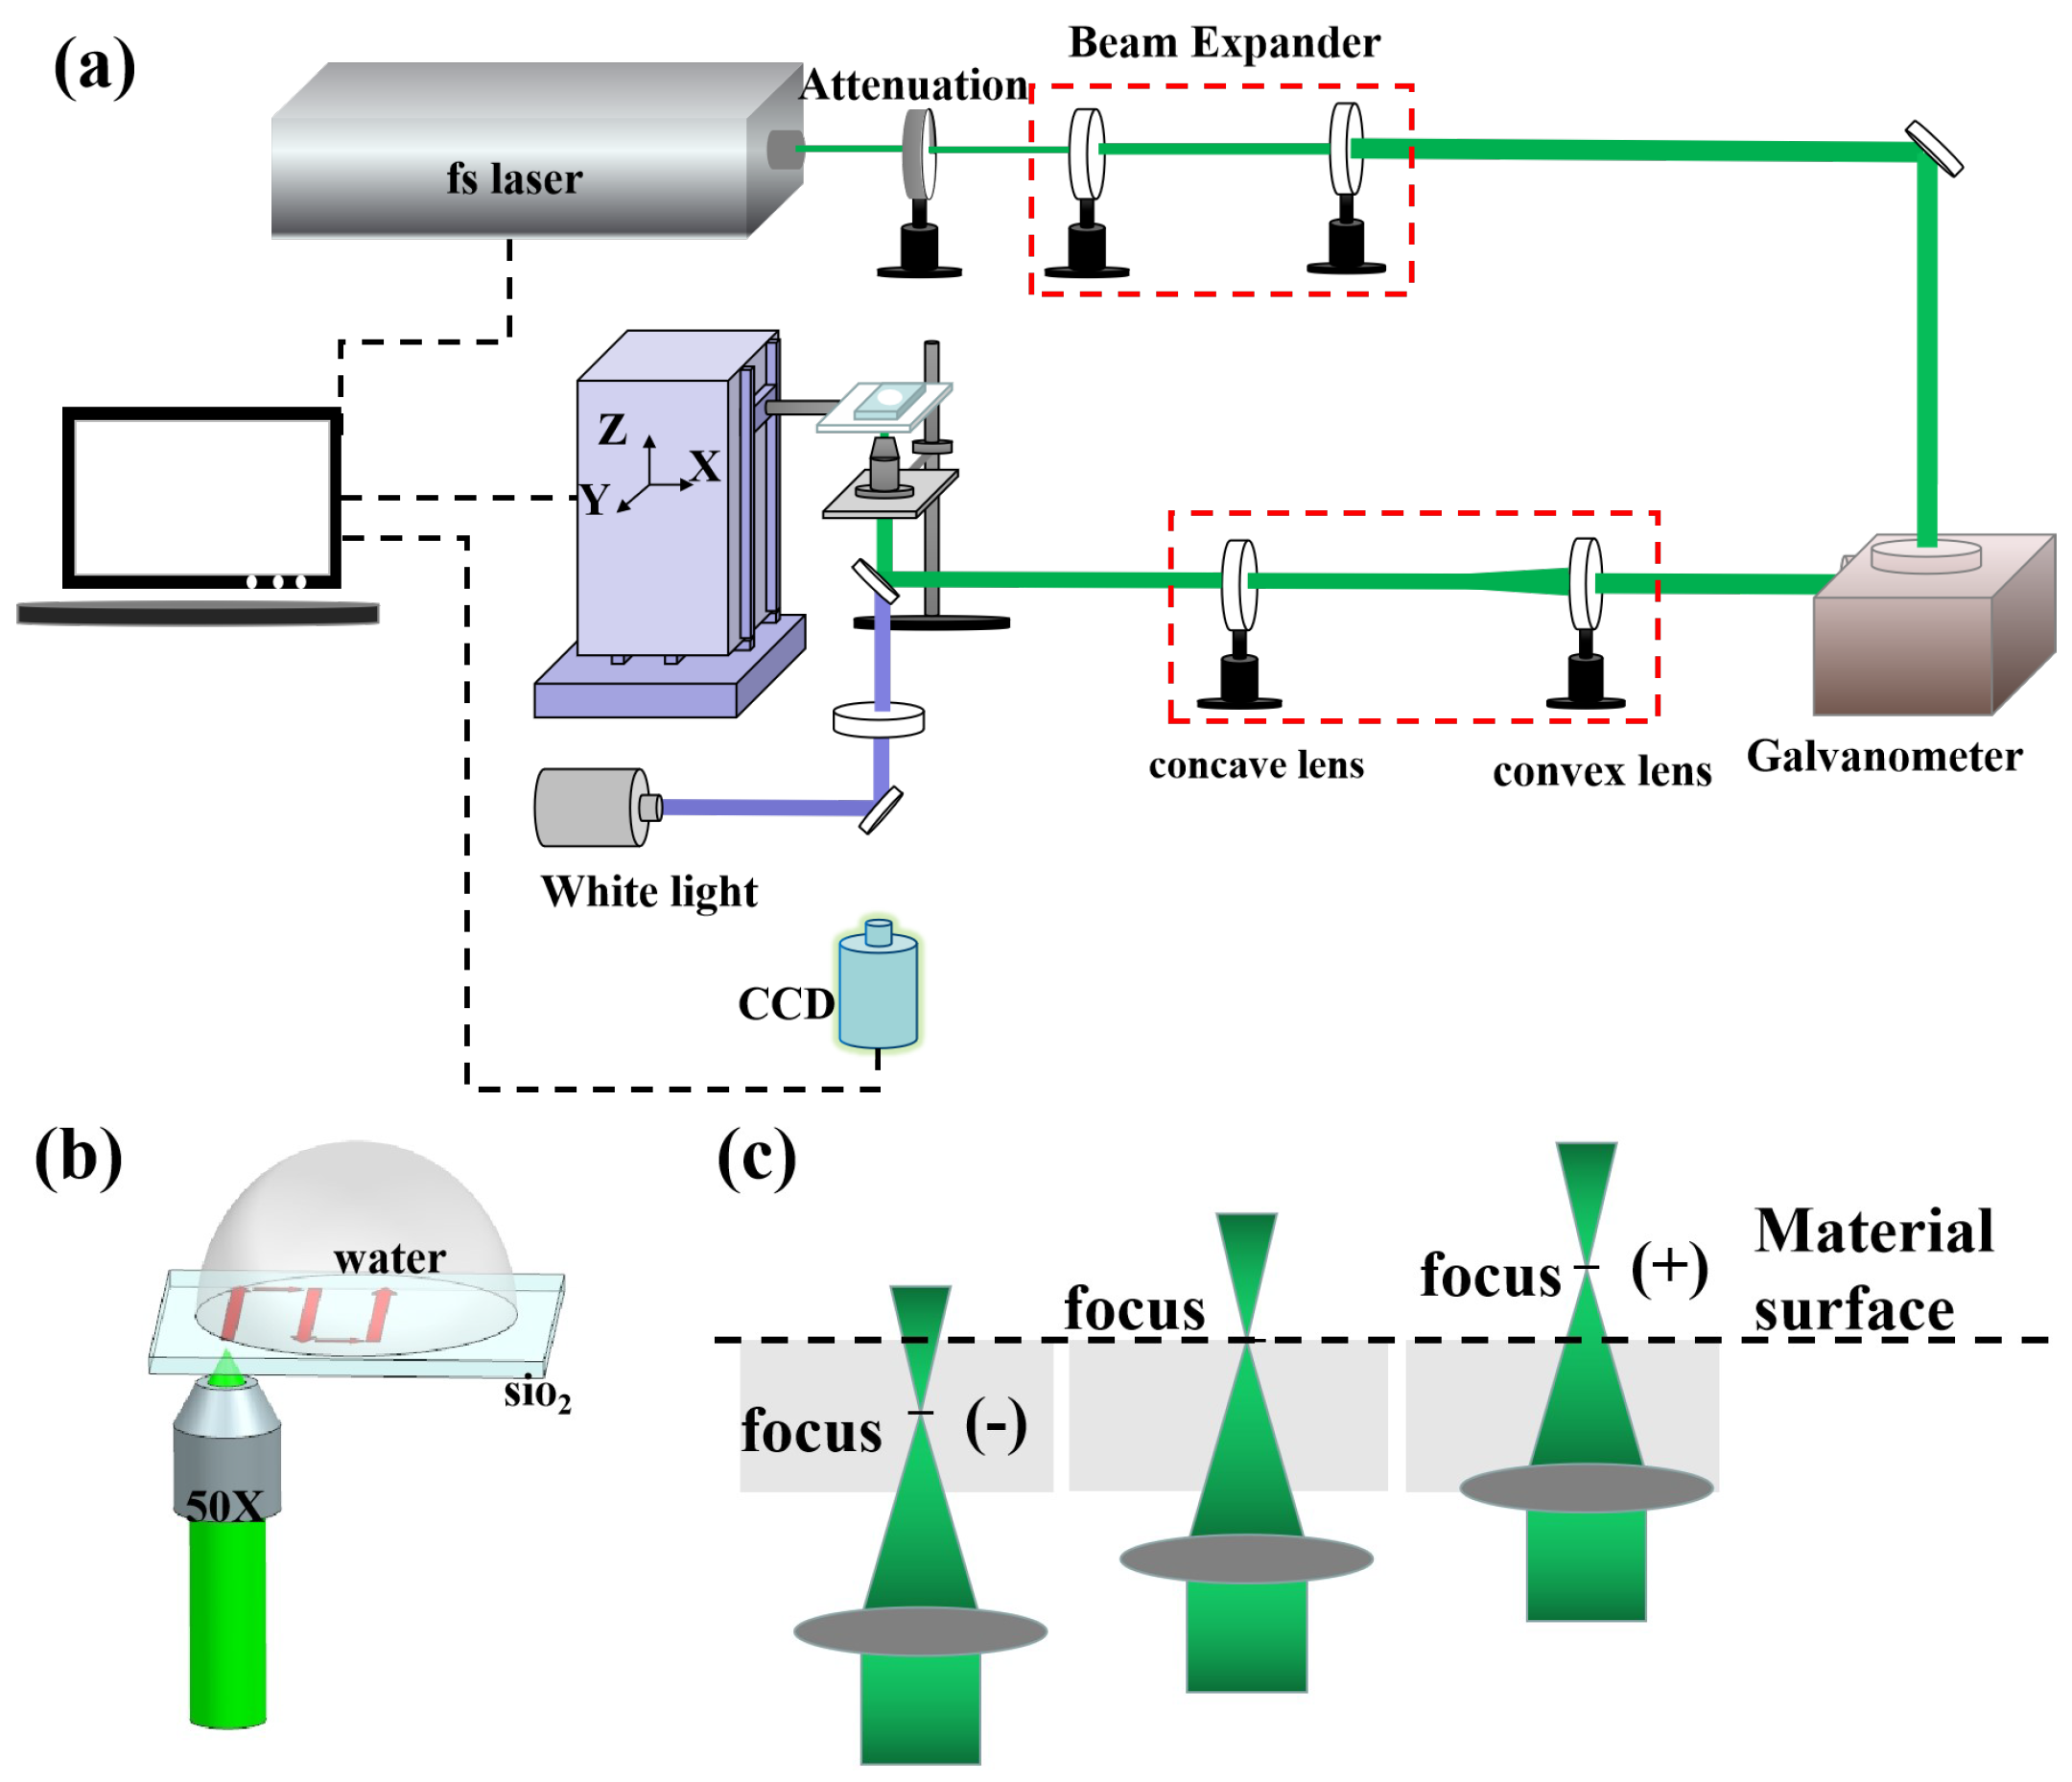
2.2. Methods
2.3. Experimentation Procedure
3. Results
ANOVA Results
4. Discussion
4.1. Prediction Model Validation
4.2. Deep Micro Hole Machining
5. Conclusions
- (1)
- DOE and ANOVA analysis can effectively screen the main factors affecting responses, avoiding large numbers of experimental studies.
- (2)
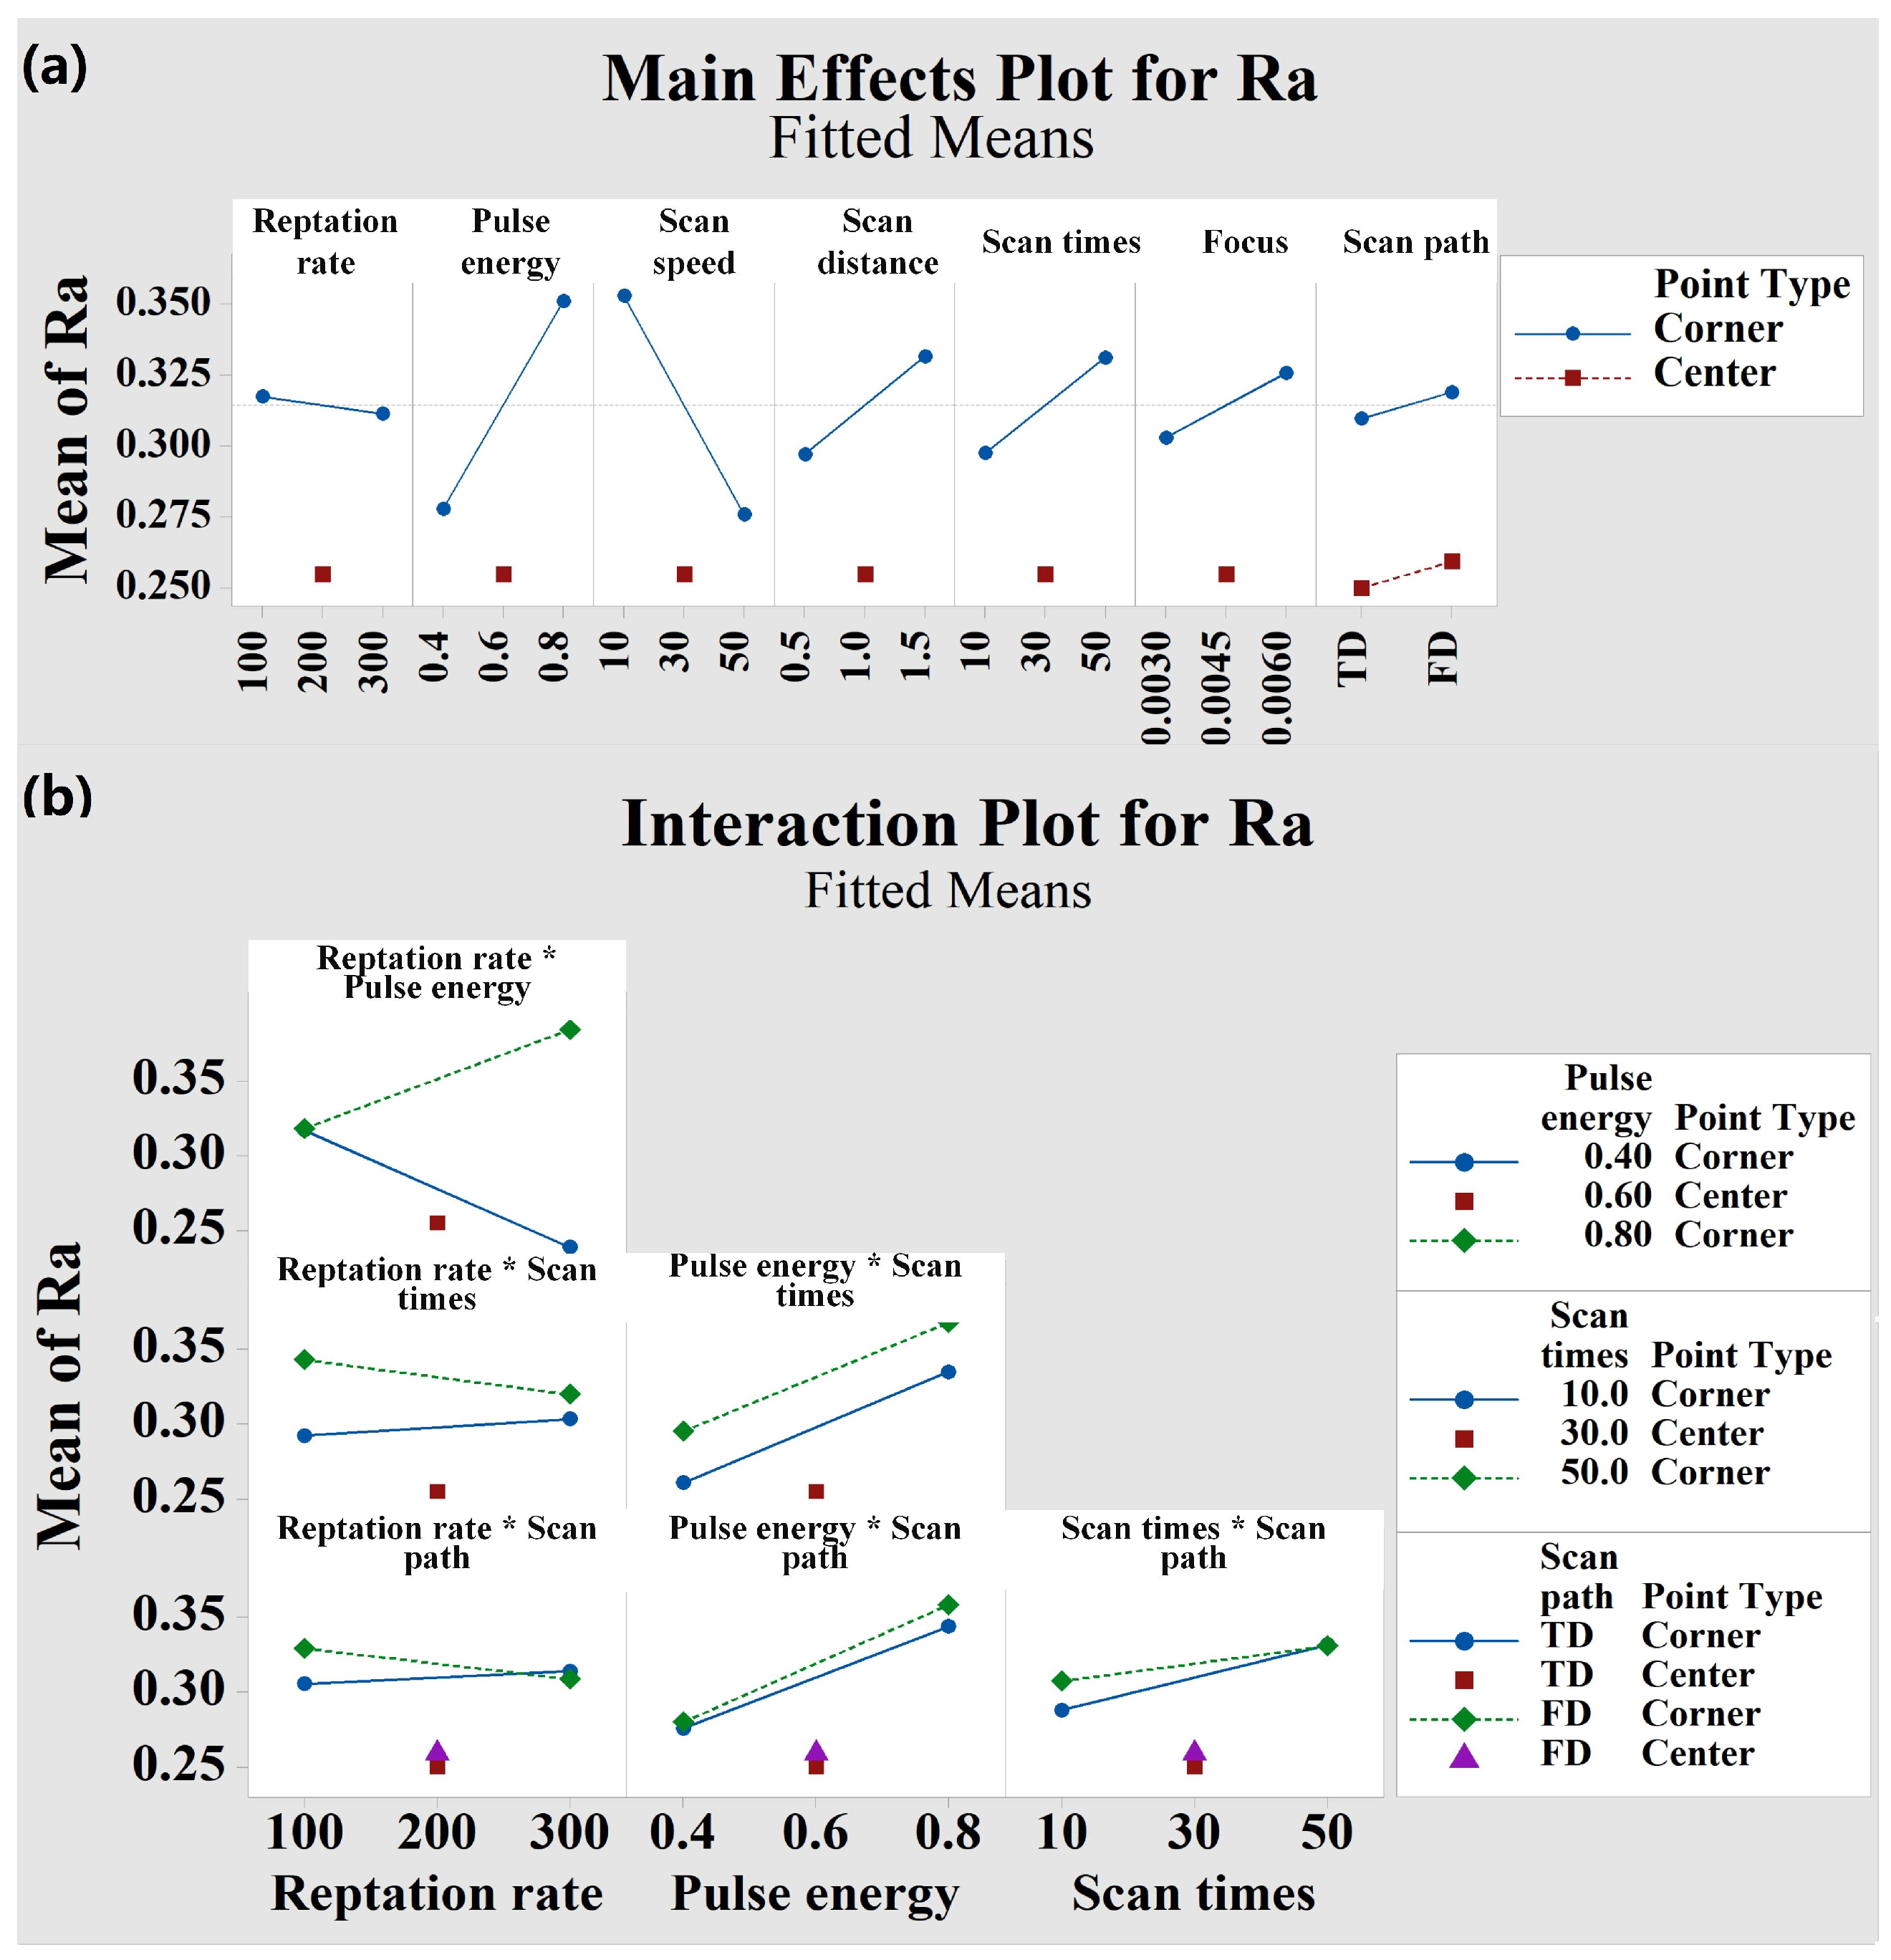
- The Ra is mainly influenced by the pulse energy, scan speed, scan distance, and scan times.
- (3)
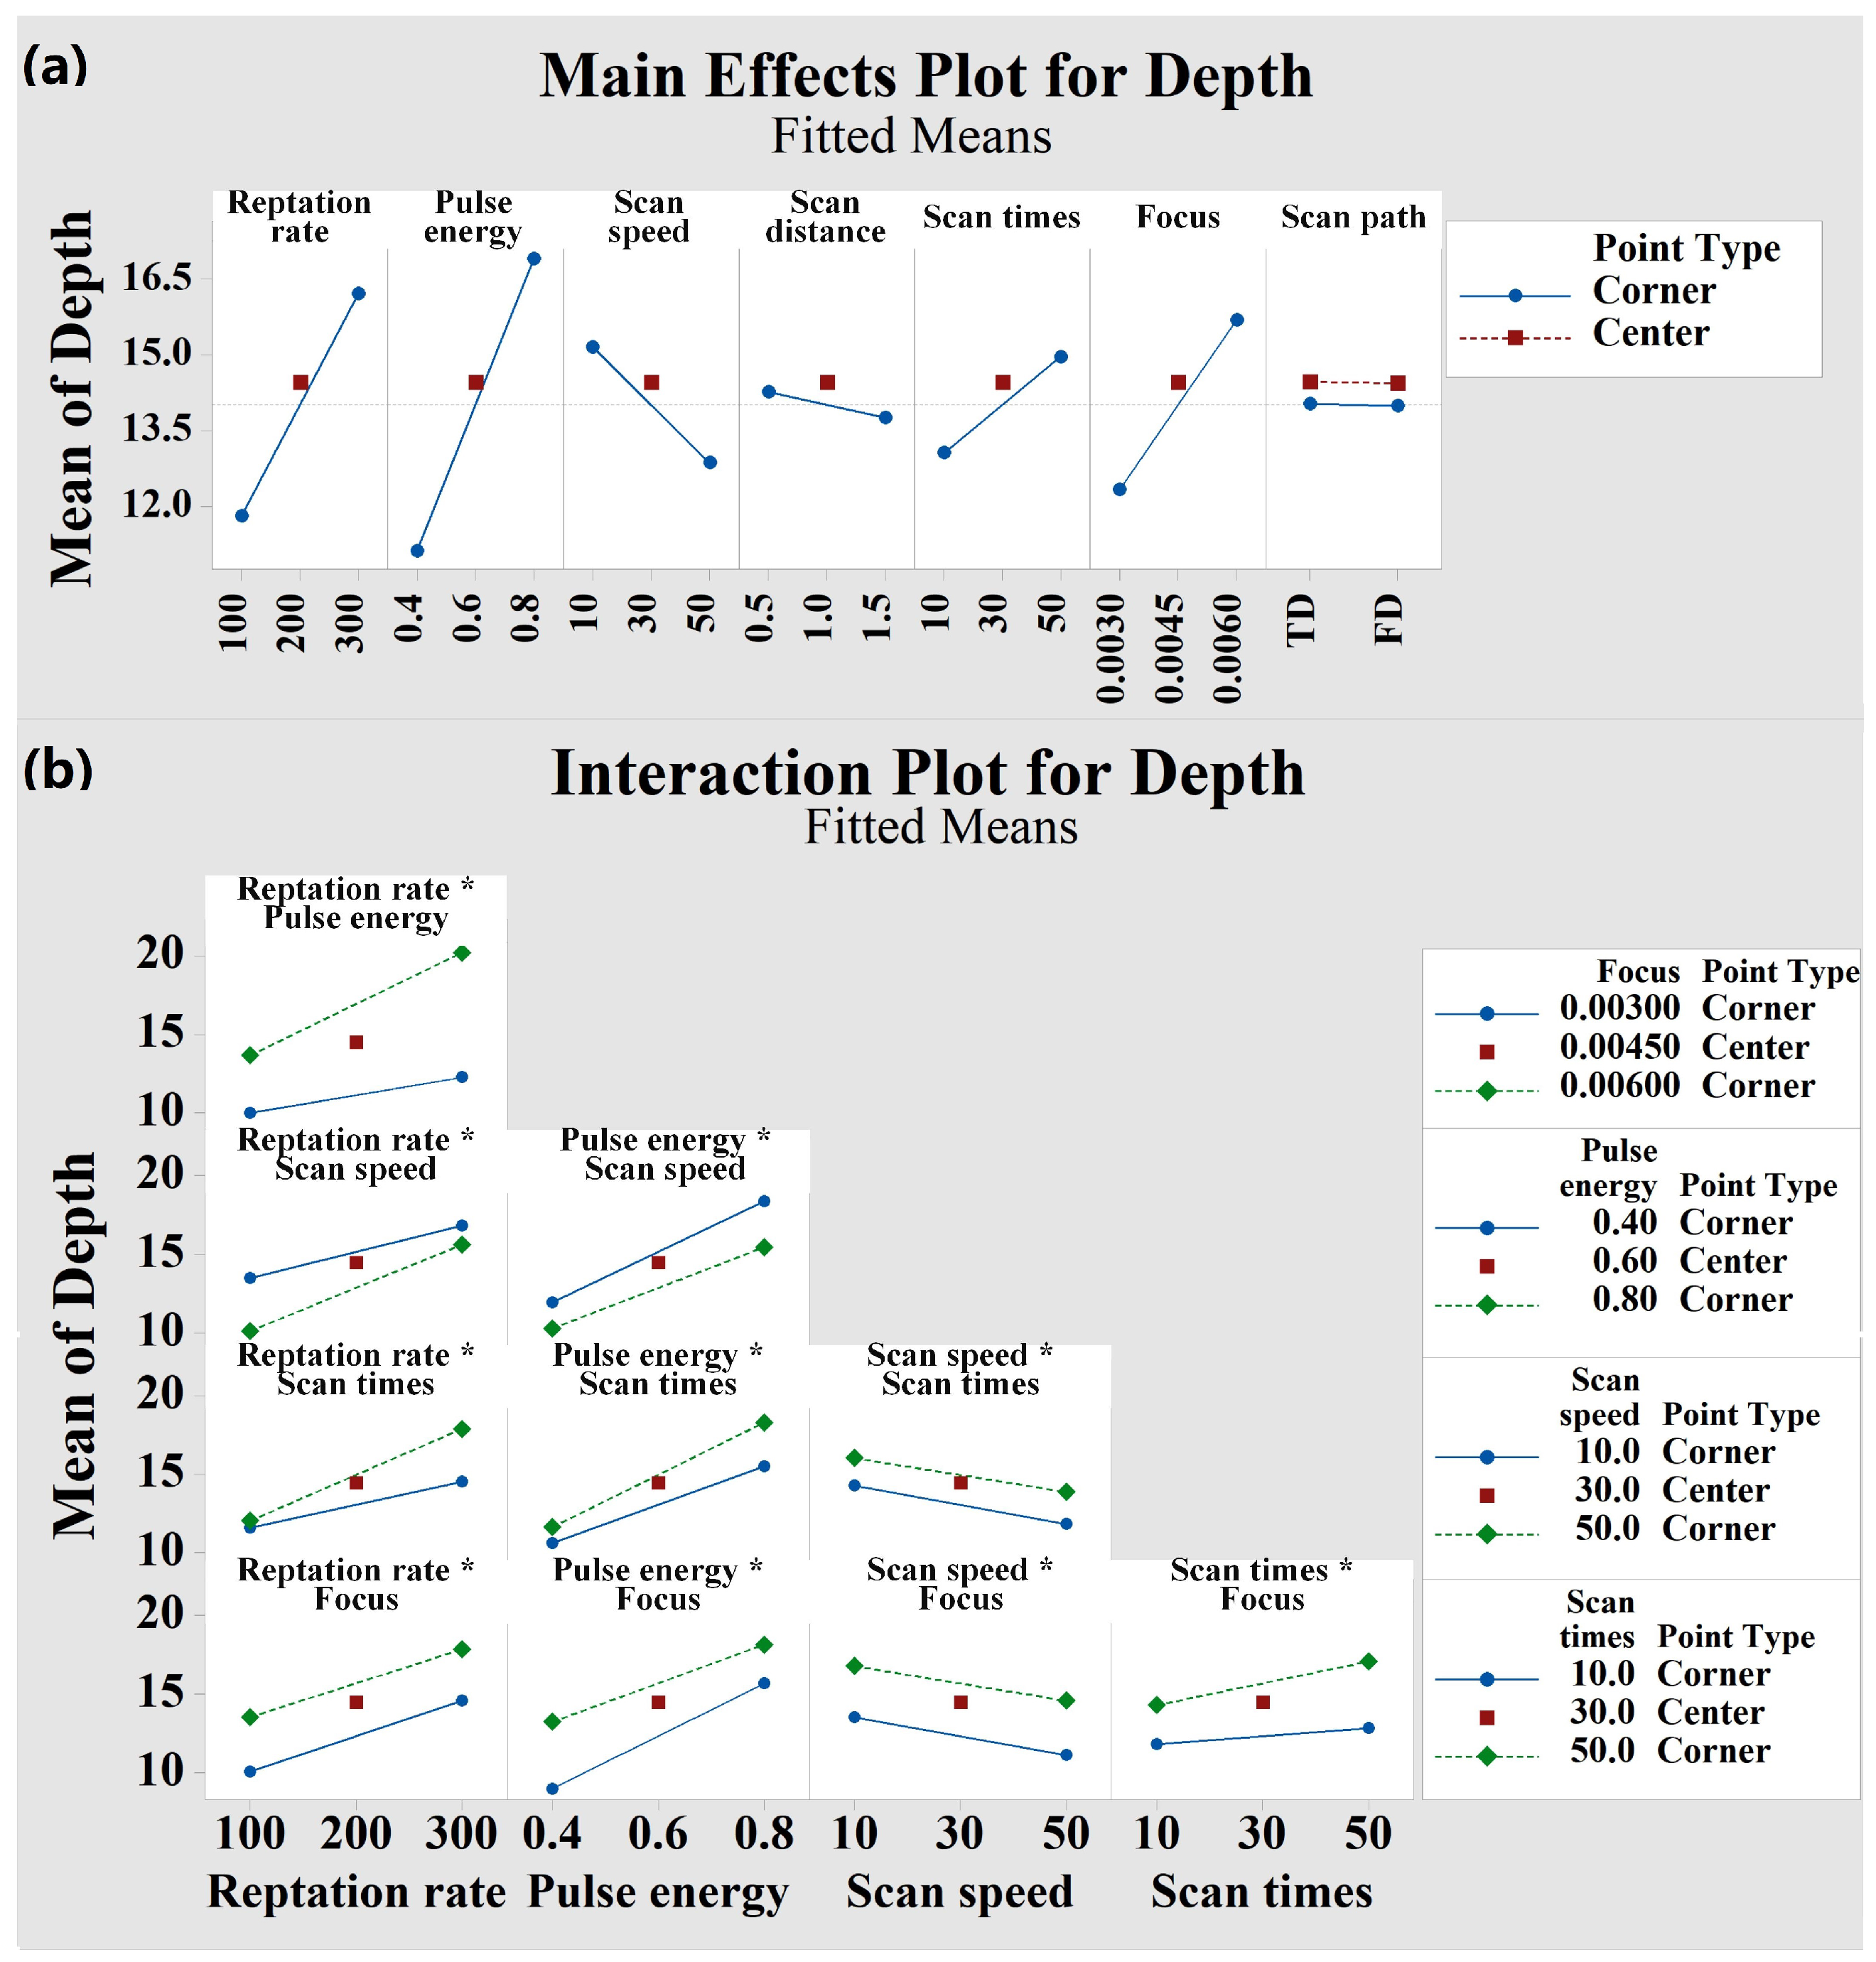
- The depth is mainly affected by the pulse energy, repetition frequency, defocus amount, scan speed and scan times.
- (4)
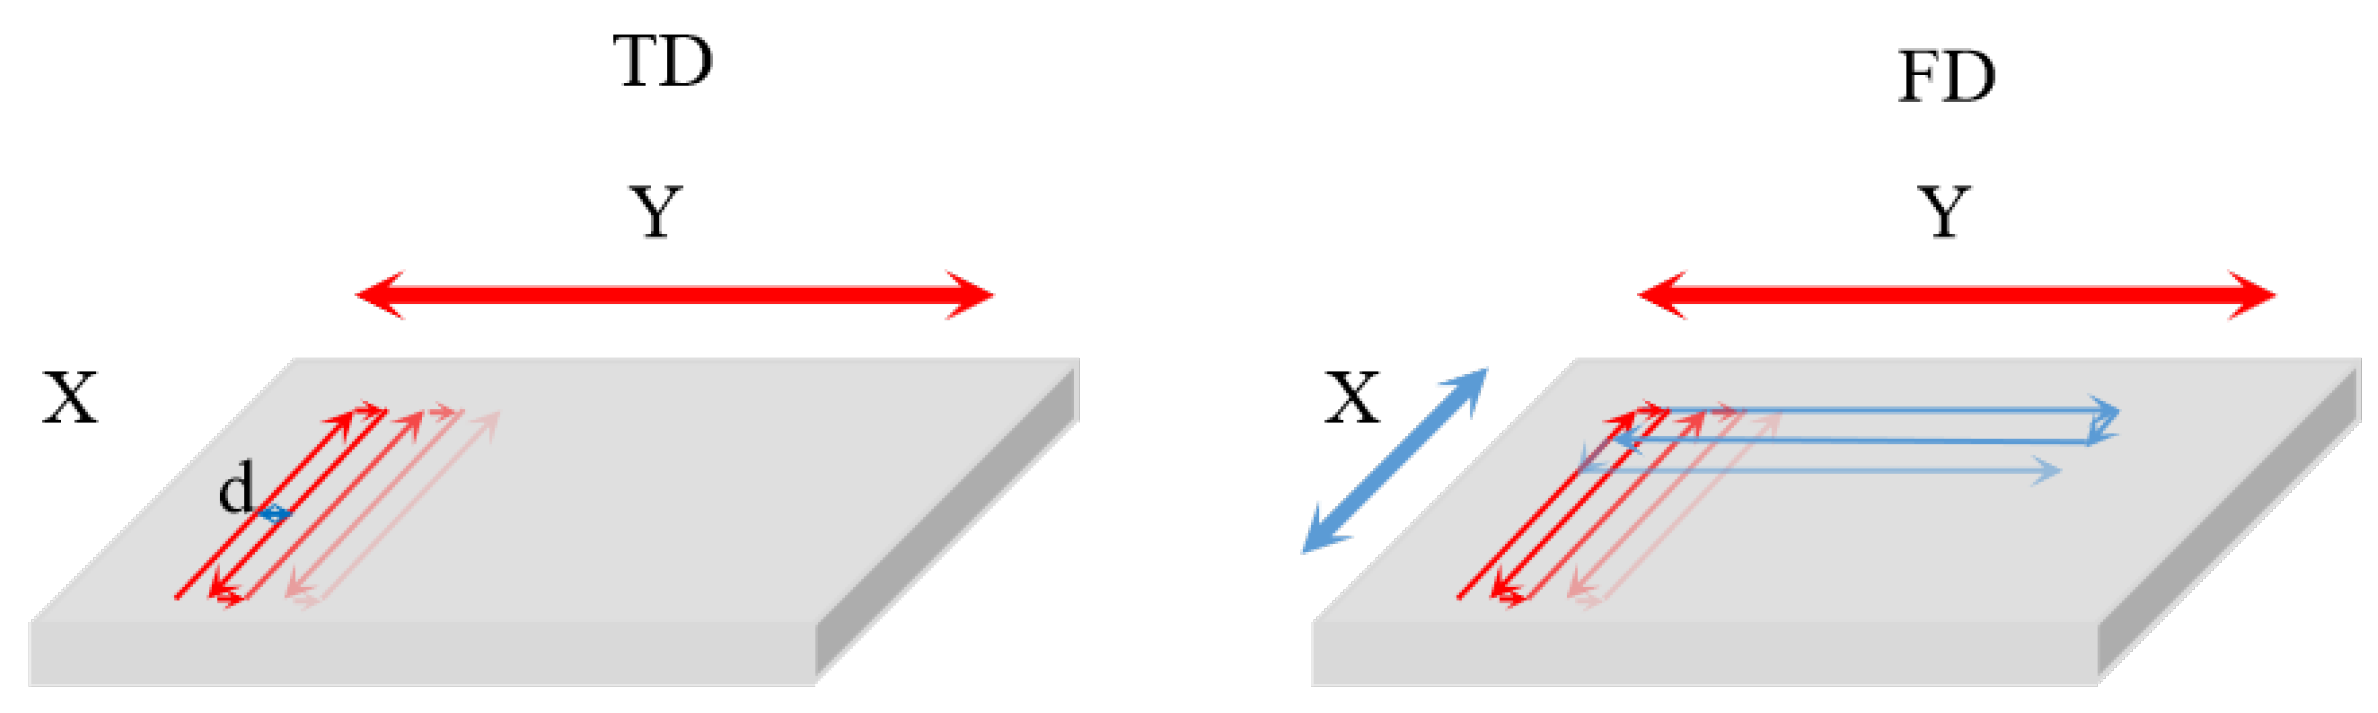
- The effect of scan path on depth response is not obvious, but its interaction with the scan times has a more obvious effect on roughness.
- (5)
- The regression prediction model of roughness versus depth was experimentally derived and validated in a 3-point factorial scheme, with all depth values of the tests falling within the PI and all roughness values falling within a tighter CI than the prediction interval, demonstrating the good predictive power of the prediction model.
- (6)
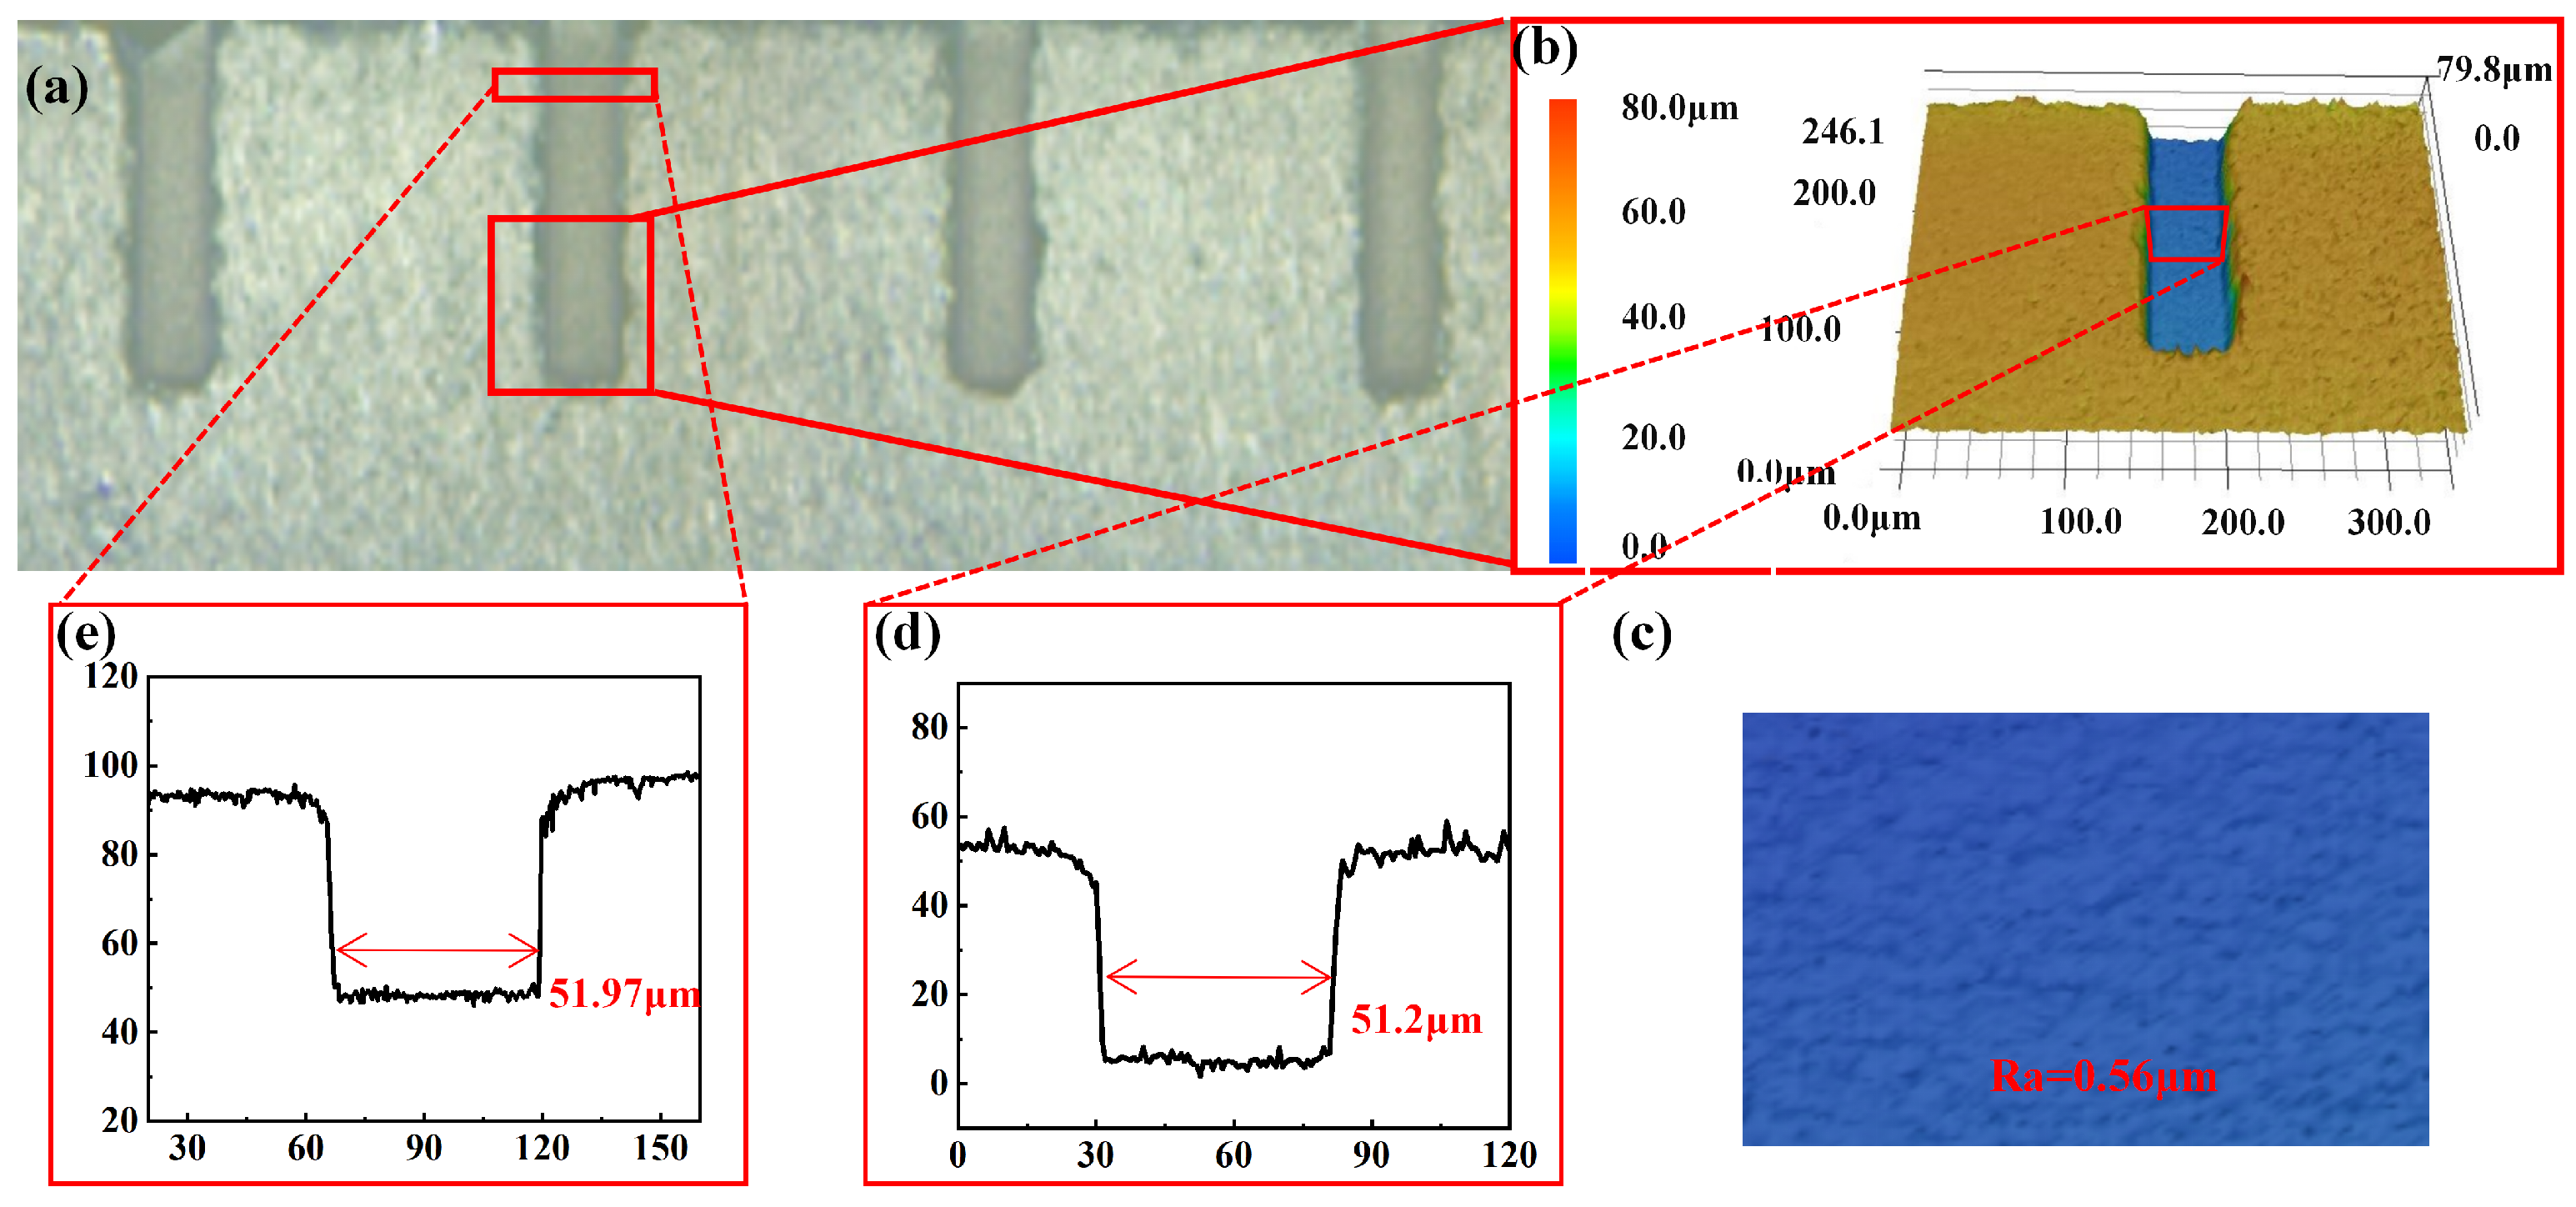
- As high efficiency and low roughness are the first requirements of production, we used the optimized experimental parameters with a repetition frequency of 300 kHz, pulse energy , scan speed 50 mm/s, scan distance , number of scan times 10, and defocus amount −0.003 mm to process large depth microblind holes.
Author Contributions
Funding
Institutional Review Board Statement
Informed Consent Statement
Data Availability Statement
Acknowledgments
Conflicts of Interest
References
- Kai, E.; Mizutani, K. Micro-drilling of monocrystalline silicon using a cutting tool. Precis. Eng. 2002, 26, 263–268. [Google Scholar]
- Muttamara, A.; Fukuzawa, Y.; Mohri, N.; Tani, T. Probability of precision micro-machining of insulating Si3N4 ceramics by EDM. J. Mater. Process. Technol. 2003, 140, 243–247. [Google Scholar] [CrossRef]
- Wei, C.; Zhao, L.; Hu, D.; Ni, J. Electrical discharge machining of ceramic matrix composites with ceramic fiber reinforcements. Int. J. Adv. Manuf. Technol. 2013, 64, 187–194. [Google Scholar] [CrossRef]
- Ahn, S.H.; Shi, H.R.; Choi, D.K.; Chong, N.C. Electro-chemical micro drilling using ultra short pulses. Precis. Eng. 2004, 28, 129–134. [Google Scholar] [CrossRef]
- Lee, T.C.; Chan, C.W. Mechanism of the Ultrasonic Machining of Ceramic Composites. J. Mater. Process. Technol. 1997, 71, 195–201. [Google Scholar] [CrossRef]
- Wang, J.; Zhang, J.; Feng, P. Effects of tool vibration on fiber fracture in rotary ultrasonic machining of C/SiC ceramic matrix composites. Compos. Part B Eng. 2017, 129, 233–242. [Google Scholar] [CrossRef]
- Wang, H.; Zhu, S.; Anand, A.; Ye, X. Experimental characterization of laser trepanning performance enhanced by water-based ultrasonic assistance. Opt. Laser Technol. 2019, 109, 547–560. [Google Scholar] [CrossRef]
- Watanabe, W.; Yan, L.; Itoh, K. Ultrafast laser micro-processing of transparent material. Opt. Laser Technol. 2016, 78, 52–61. [Google Scholar] [CrossRef]
- Gottumukkala, N.R.; Gupta, M.C. Laser processing of sapphire and fabrication of diffractive optical elements. Appl. Opt. 2022, 61, 2391–2397. [Google Scholar] [CrossRef] [PubMed]
- Shan, C.; Yang, Q.; Bian, H.; Hou, X.; Chen, F. Fabrication of Three-Dimensional Microvalves of Internal Nested Structures Inside Fused Silica. Micromachines 2021, 12, 43. [Google Scholar] [CrossRef]
- Gottmann, J.; Hermans, M.; Repiev, N.; Ortmann, J. Selective Laser-Induced Etching of 3D Precision Quartz Glass Components for Microfluidic Applications—Up-Scaling of Complexity and Speed. Micromachines 2017, 8, 110. [Google Scholar] [CrossRef] [Green Version]
- Lu, Y.; Duan, Y.; Liu, X.; Chen, Q.; Sun, H. High-quality rapid laser drilling of transparent hard materials. Opt. Lett. 2022, 47, 921–924. [Google Scholar] [CrossRef] [PubMed]
- Schwarz, S.; Rung, S.; Esen, C.; Hellmann, R. Ultrashort pulsed laser backside ablation of fused silica. Opt. Express 2021, 29, 23477–23486. [Google Scholar] [CrossRef] [PubMed]
- Li, Y.; Qu, S. Water-assisted femtosecond laser ablation for fabricating three-dimensional microfluidic chips. Curr. Appl. Phys. 2013, 13, 1292–1295. [Google Scholar] [CrossRef]
- Cao, X.W.; Chen, Q.D.; Fan, H.; Zhang, L.; Saulius, J.; Sun, H.B. Liquid-Assisted Femtosecond Laser Precision-Machining of Silica. Nanomaterials 2018, 8, 287. [Google Scholar] [CrossRef] [PubMed]
- Hwang, D.J.; Choi, T.Y.; Grigoropoulos, C.P. Liquid-assisted femtosecond laser drilling of straight and three-dimensional microchannels in glass. Appl. Phys. A 2004, 79, 605–612. [Google Scholar] [CrossRef]
- Li, Y.; Qu, S.; Guo, Z. Fabrication of microfluidic devices in silica glass by water-assisted ablation with femtosecond laser pulses. J. Micromech. Microeng. 2011, 21, 075008. [Google Scholar] [CrossRef]
- An, R.; Li, Y.; Dou, Y.; Liu, D.; Gong, Q. Water-assisted drilling of microfluidic chambers inside silica glass with femtosecond laser pulses. Appl. Phys. A 2006, 83, 27–29. [Google Scholar] [CrossRef]
- Leone, C.; Genna, S.; Tagliaferri, F.; Palumbo, B.; Dix, M. Experimental investigation on laser milling of aluminium oxide using a 30 W Q-switched Yb:YAG fiber laser. Opt. Laser Technol. 2016, 76, 127–137. [Google Scholar] [CrossRef]
- Volpe, A.; Trotta, G.; Krishnan, U.; Ancona, A. Prediction model of the depth of the femtosecond laser micro-milling of PMMA. Opt. Laser Technol. 2019, 120, 105713. [Google Scholar] [CrossRef]

| Factors | Abbreviation | Fs-Laser Parameters Range | ||
|---|---|---|---|---|
| Low Level | Central Point | High Level | ||
| Repetition rate [kHz] | A | 100 | 200 | 300 |
| Pulse energy [] | B | 0.4 | 0.6 | 0.8 |
| Scan speed [mm/s] | C | 10 | 30 | 50 |
| Scan distance [] | D | 0.5 | 1 | 1.5 |
| Scan times | E | 10 | 30 | 50 |
| Focus [mm] | F | −0.003 | −0.0045 | −0.006 |
| Scan path | G | TD | - | FD |
| Repetition Rate [kHz] | Pulse Energy [J] | Scan Speed [mm/s] | Scan Distance [m] | Scan Times | Focus [mm] | Scan Path | |
|---|---|---|---|---|---|---|---|
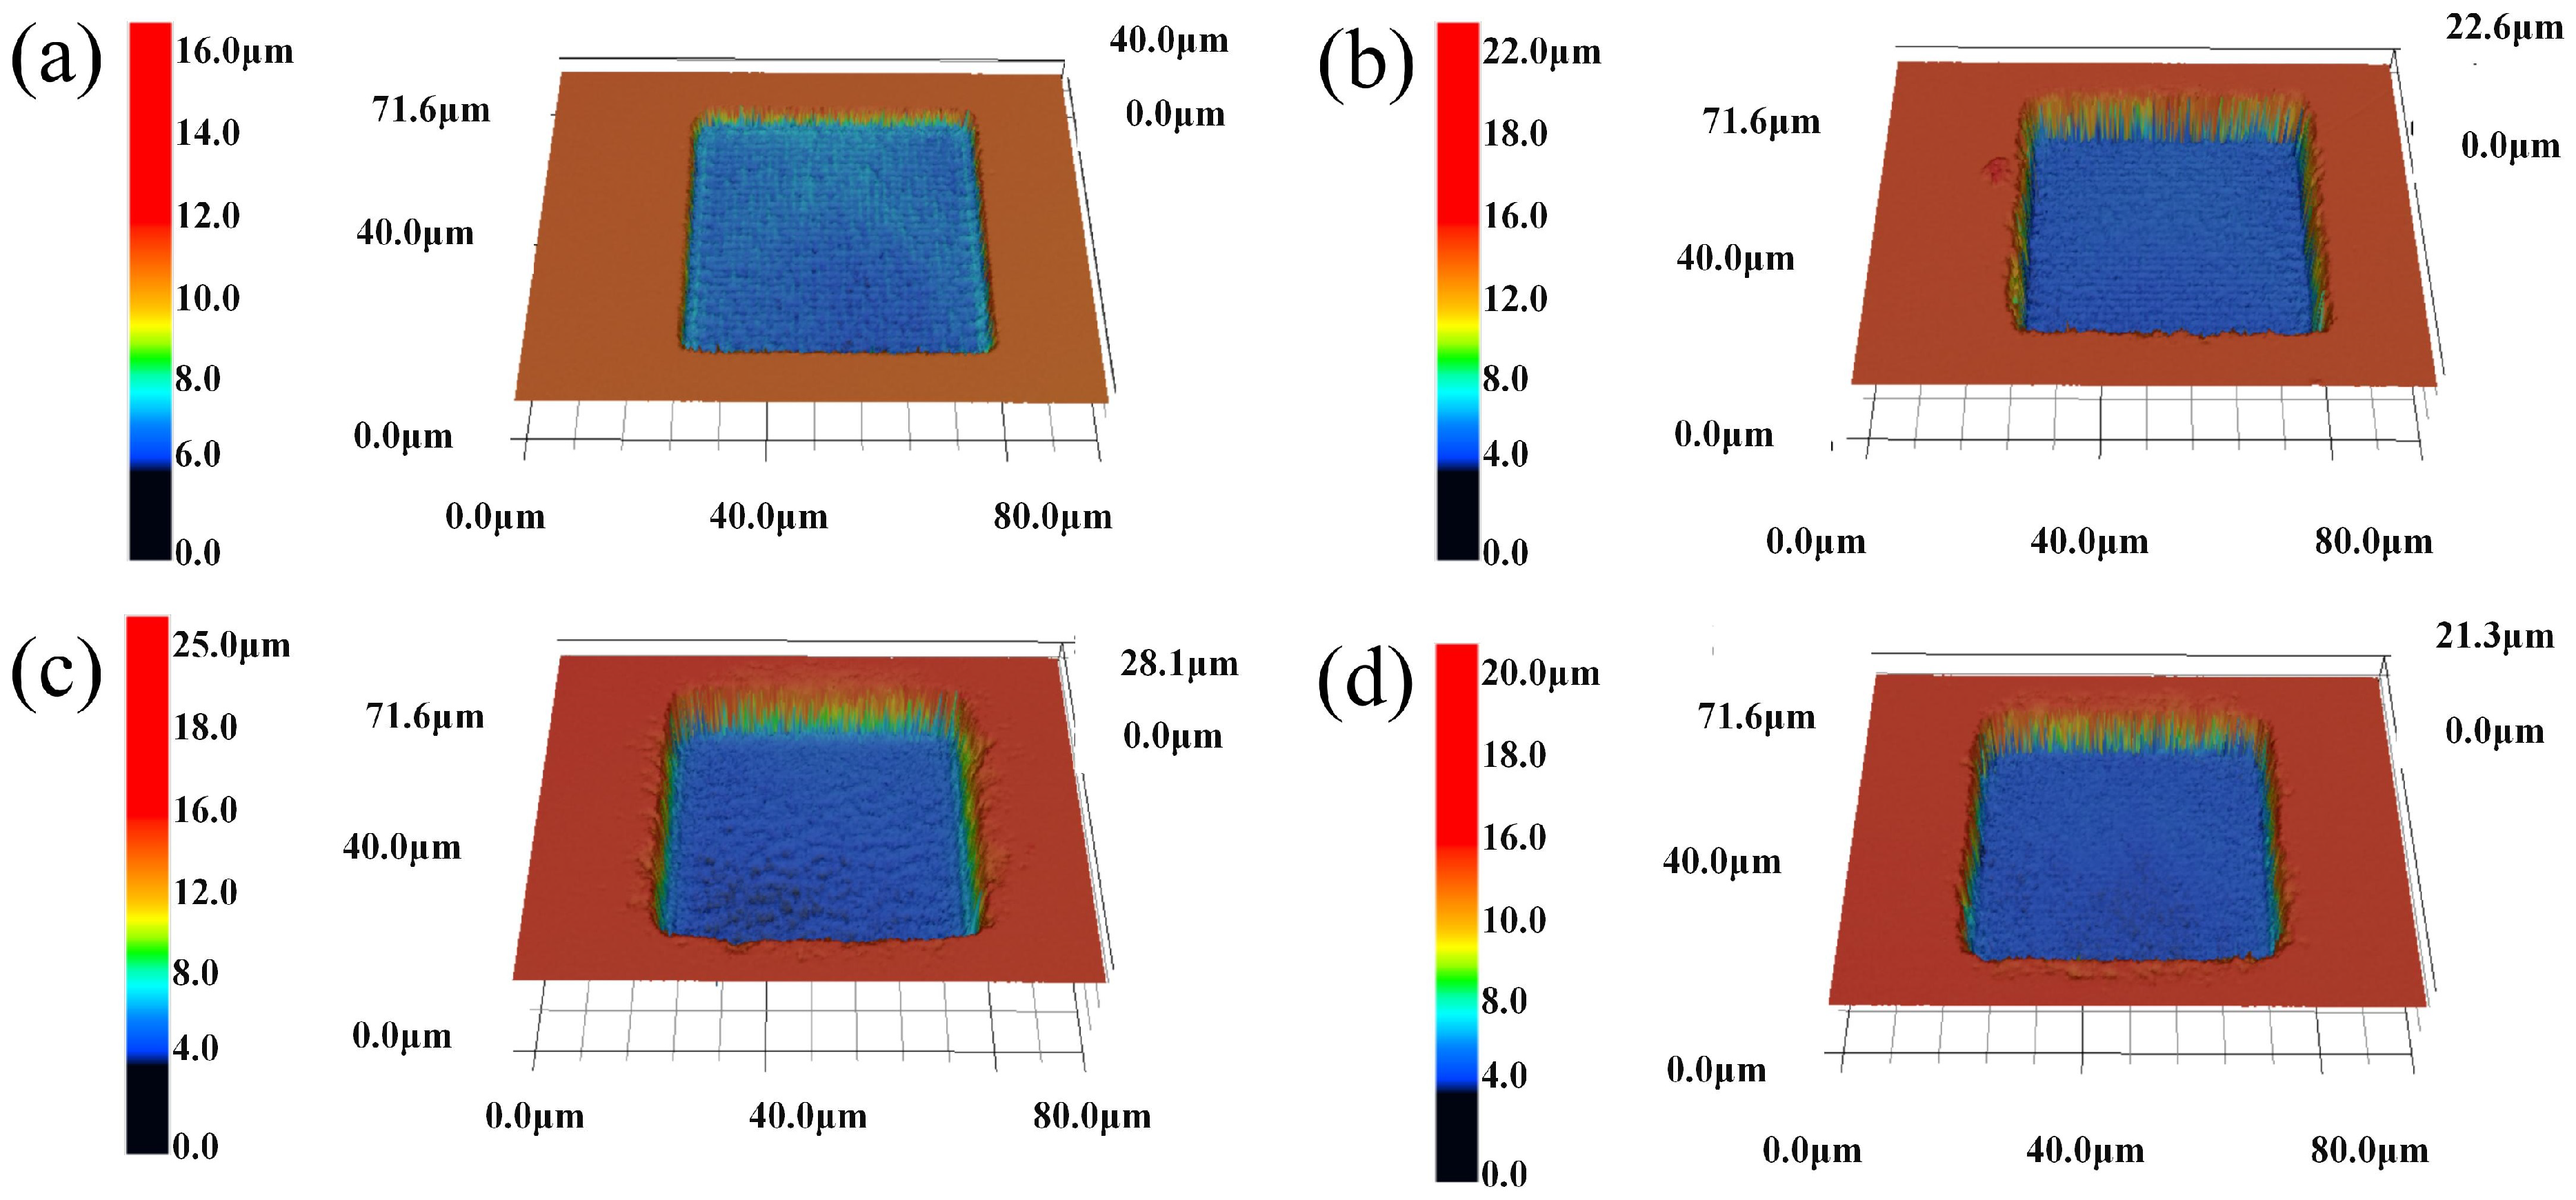
| a | 100 | 0.4 | 50 | 1.5 | 50 | −0.003 | FD |
| b | 100 | 0.8 | 50 | 1.5 | 10 | −0.006 | TD |
| c | 200 | 0.6 | 30 | 1 | 30 | −0.0045 | FD |
| d | 300 | 0.4 | 50 | 1.5 | 50 | −0.003 | FD |
| Source | DF | Adj SS | Adj MS | F-Value | p-Value |
|---|---|---|---|---|---|
| Model | 8 | 0.63905 | 0.079881 | 12.84 | 0.000 |
| Linear | 6 | 0.43389 | 0.072315 | 11.63 | 0.000 |
| Repetition rate | 1 | 0.00219 | 0.002195 | 0.35 | 0.554 |
| Pulse energy | 1 | 0.18075 | 0.180751 | 29.06 | 0.000 |
| Scan speed | 1 | 0.18075 | 0.180751 | 29.06 | 0.000 |
| Scan distance | 1 | 0.02910 | 0.029101 | 4.68 | 0.033 |
| Scan times | 1 | 0.04026 | 0.040257 | 6.47 | 0.012 |
| Scan path | 1 | 0.00084 | 0.000838 | 0.13 | 0.714 |
| Two-way Interactions | 2 | 0.20516 | 0.102579 | 16.49 | 0.000 |
| Repetition rate × Pulse energy | 1 | 0.15194 | 0.151938 | 24.43 | 0.000 |
| Scan times × Scan path | 1 | 0.05322 | 0.053220 | 8.56 | 0.004 |
| Error | 121 | 0.75257 | 0.006220 | ||
| Curvature | 1 | 0.00846 | 0.008461 | 1.36 | 0.245 |
| Lack-of-Fit | 120 | 0.74411 | 0.006201 | - | - |
| Total | 129 | 1.39162 |
| Source | DF | Adj SS | Adj MS | F-Value | p-Value |
|---|---|---|---|---|---|
| Model | 10 | 2514.82 | 251.48 | 38.64 | 0.000 |
| Linear | 5 | 2211.04 | 442.21 | 67.94 | 0.000 |
| Repetition rate | 1 | 600.40 | 600.40 | 92.24 | 0.000 |
| Pulse energy | 1 | 1044.82 | 1044.82 | 160.52 | 0.000 |
| Scan speed | 1 | 135.42 | 135.42 | 20.81 | 0.000 |
| Scan times | 1 | 94.67 | 94.67 | 14.54 | 0.000 |
| Focus | 1 | 335.73 | 335.73 | 51.58 | 0.000 |
| Two-way Interactions | 5 | 303.78 | 60.76 | 9.33 | 0.000 |
| Repetition rate × Pulse energy | 1 | 125.77 | 125.77 | 19.32 | 0.000 |
| Repetition rate × Scan speed | 1 | 41.36 | 41.36 | 6.35 | 0.013 |
| Repetition rate × Scan times | 1 | 79.73 | 79.73 | 12.25 | 0.001 |
| Pulse energy × Scan times | 1 | 31.38 | 31.38 | 4.82 | 0.030 |
| Scan times × Focus | 1 | 25.54 | 25.54 | 3.92 | 0.050 |
| Error | 119 | 774.59 | 6.51 | ||
| Curvature | 1 | 0.48 | 0.48 | 0.07 | 0.786 |
| Lack-of-Fit | 118 | 774.10 | 6.56 | - | - |
| Total | 129 | 3289.41 |
| Variable | Settings of Point 1 | Settings of Point 2 | Settings of Point 3 | |||
|---|---|---|---|---|---|---|
| Repetition rate [kHz] | 200 | 100 | 300 | |||
| Pulse energy [] | 0.4 | 0.6 | 0.5 | |||
| Scan speed [mm/s] | 20 | 30 | 40 | |||
| Scan distance [] | 0.5 | 0.8 | 1 | |||
| Scan times | 30 | 45 | 40 | |||
| Focus [mm] | −0.003 | −0.006 | −0.003 | |||
| Scan path | 2 | 4 | 2 | |||
| Minitab Prediction | CI | PI | CI | PI | CI | PI |
| Depth values [] | (9.206,10.812) | (4.894,15.124) | (12.848,14.778) | (8.67,18.956) | (11.863,13.819) | (7.695,17.986) |
| Ra values [] | (0.263,0.327) | (0.133,0.458) | (0.296,0.35) | (0.162,0.485) | (0.244,0.302) | (0.111,0.435) |
| Experimentation | ||||||
| Trial depth value [] | 13.05 | 18.21 | 9.65 | |||
| Trial Ra value [] | 0.27 | 0.32 | 0.28 |
Publisher’s Note: MDPI stays neutral with regard to jurisdictional claims in published maps and institutional affiliations. |
© 2022 by the authors. Licensee MDPI, Basel, Switzerland. This article is an open access article distributed under the terms and conditions of the Creative Commons Attribution (CC BY) license (https://creativecommons.org/licenses/by/4.0/).
Share and Cite
Yuan, H.; Chen, Z.; Wu, P.; Deng, Y.; Cao, X.; Zhang, W. Prediction Model for Liquid-Assisted Femtosecond Laser Micro Milling of Quartz without Taper. Micromachines 2022, 13, 1398. https://doi.org/10.3390/mi13091398
Yuan H, Chen Z, Wu P, Deng Y, Cao X, Zhang W. Prediction Model for Liquid-Assisted Femtosecond Laser Micro Milling of Quartz without Taper. Micromachines. 2022; 13(9):1398. https://doi.org/10.3390/mi13091398
Chicago/Turabian StyleYuan, Hongbing, Zhihao Chen, Peichao Wu, Yimin Deng, Xiaowen Cao, and Wenwu Zhang. 2022. "Prediction Model for Liquid-Assisted Femtosecond Laser Micro Milling of Quartz without Taper" Micromachines 13, no. 9: 1398. https://doi.org/10.3390/mi13091398
APA StyleYuan, H., Chen, Z., Wu, P., Deng, Y., Cao, X., & Zhang, W. (2022). Prediction Model for Liquid-Assisted Femtosecond Laser Micro Milling of Quartz without Taper. Micromachines, 13(9), 1398. https://doi.org/10.3390/mi13091398