
Brain-Implantable Multifunctional Probe for Simultaneous Detection of Glutamate and GABA Neurotransmitters: Optimization and In Vivo Studies

 , , and
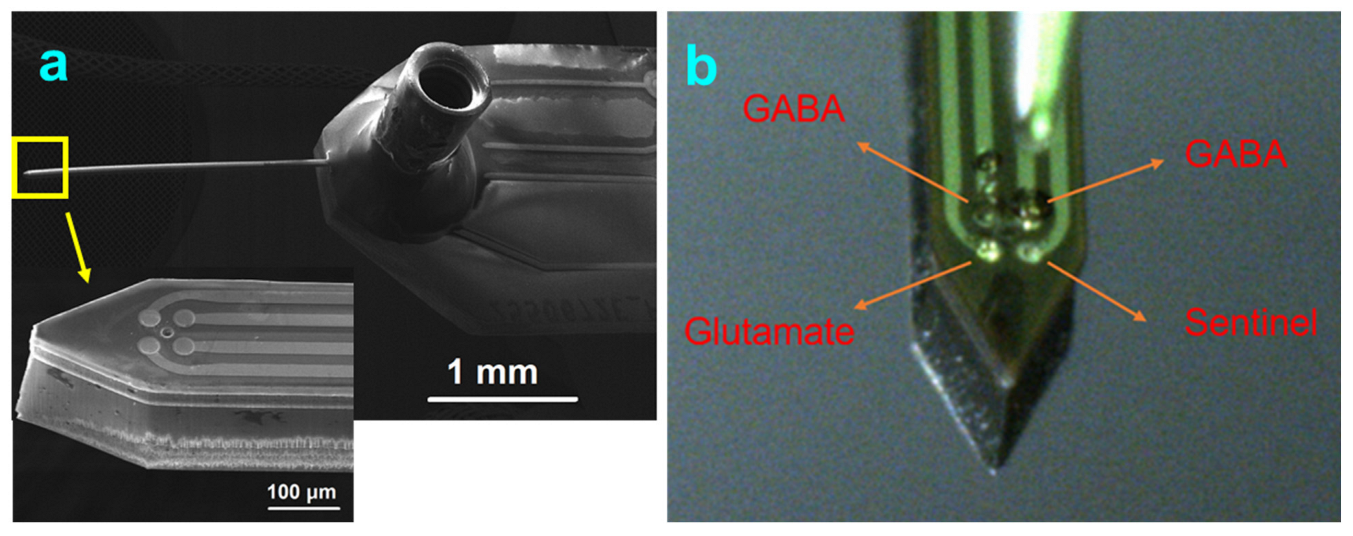
Abstract
:1. Introduction
2. Materials and Methods
2.1. Design Considerations and Microfabrication
2.2. Electrochemical Characterization
2.3. Chemicals and Enzyme Coating
2.4. Amperometry Calibration and Detection of NTs
2.5. Probe Implantation and In Vivo Recording
3. Results and Discussions
3.1. Electrochemical Characterization
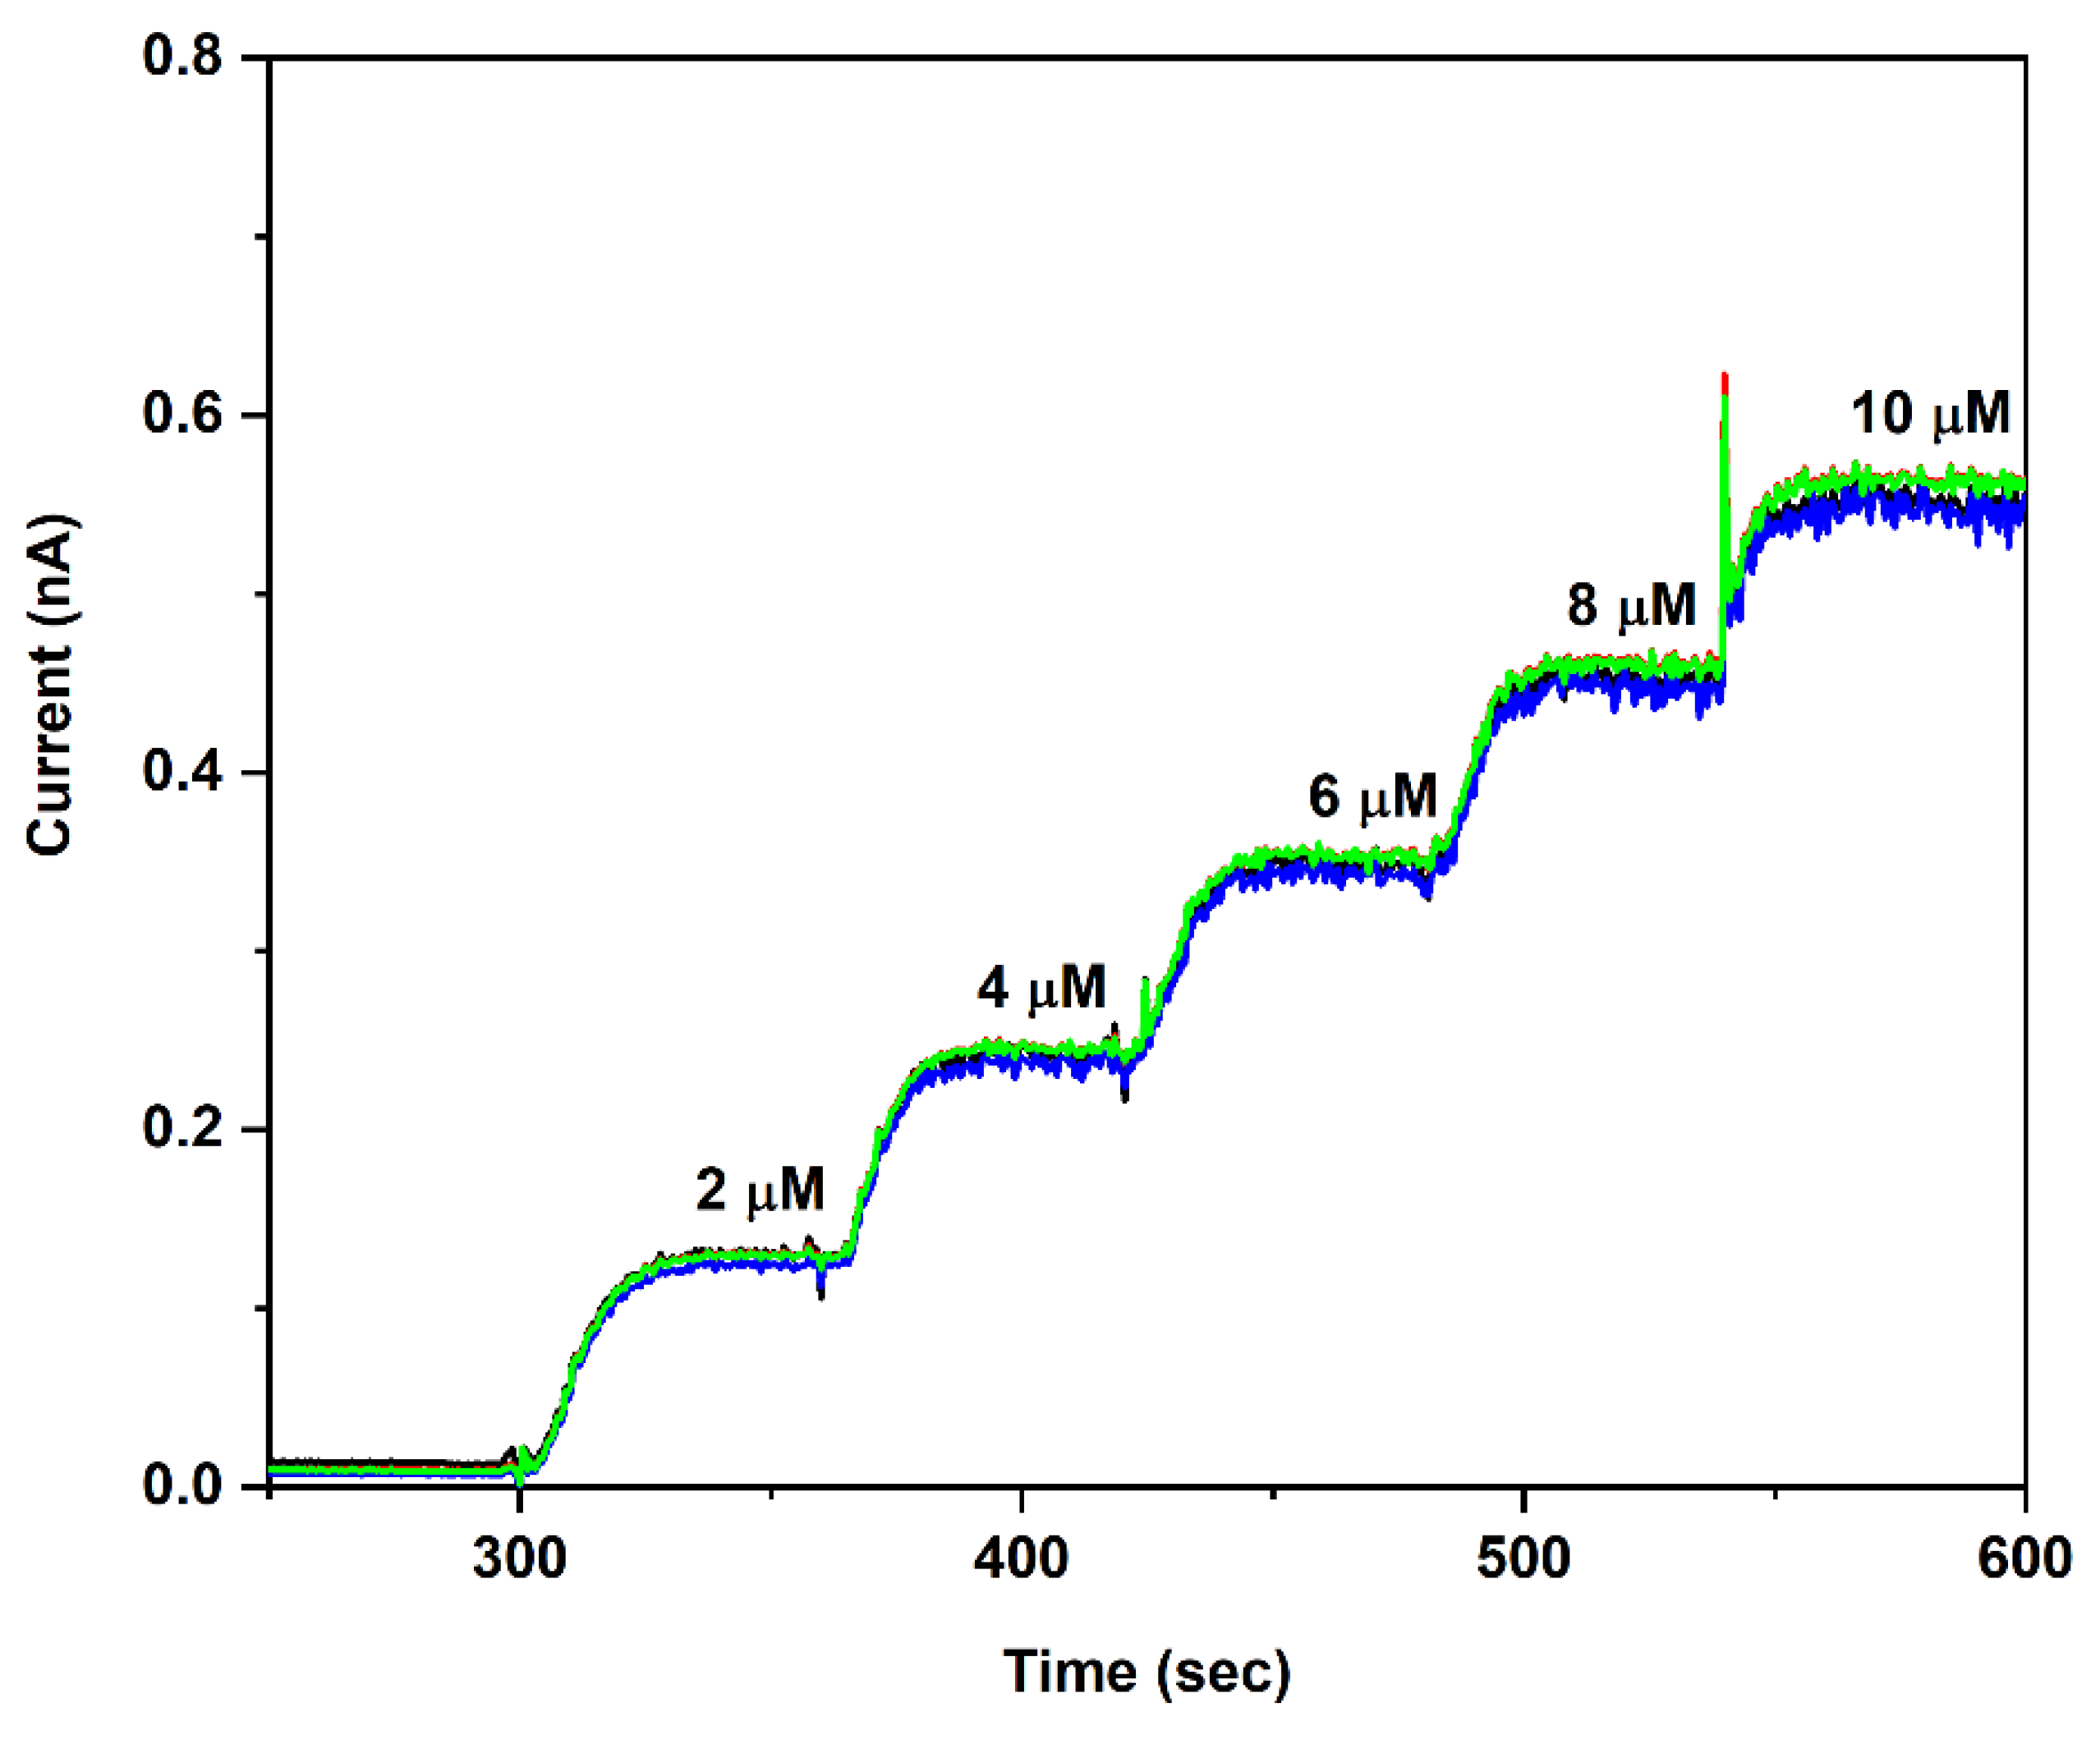
3.1.1. H2O2 Calibration
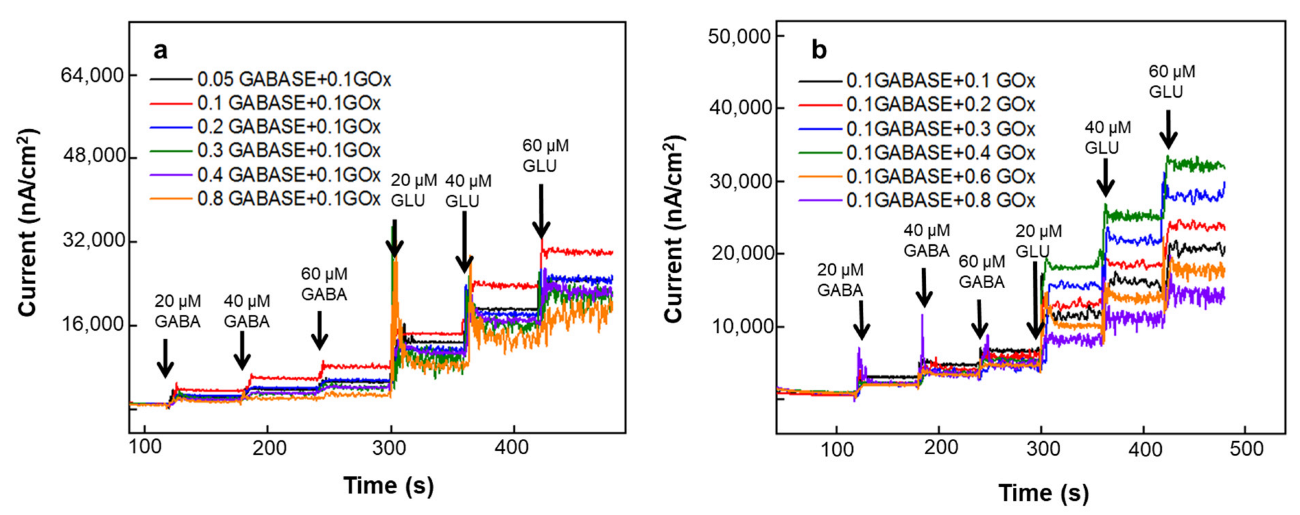
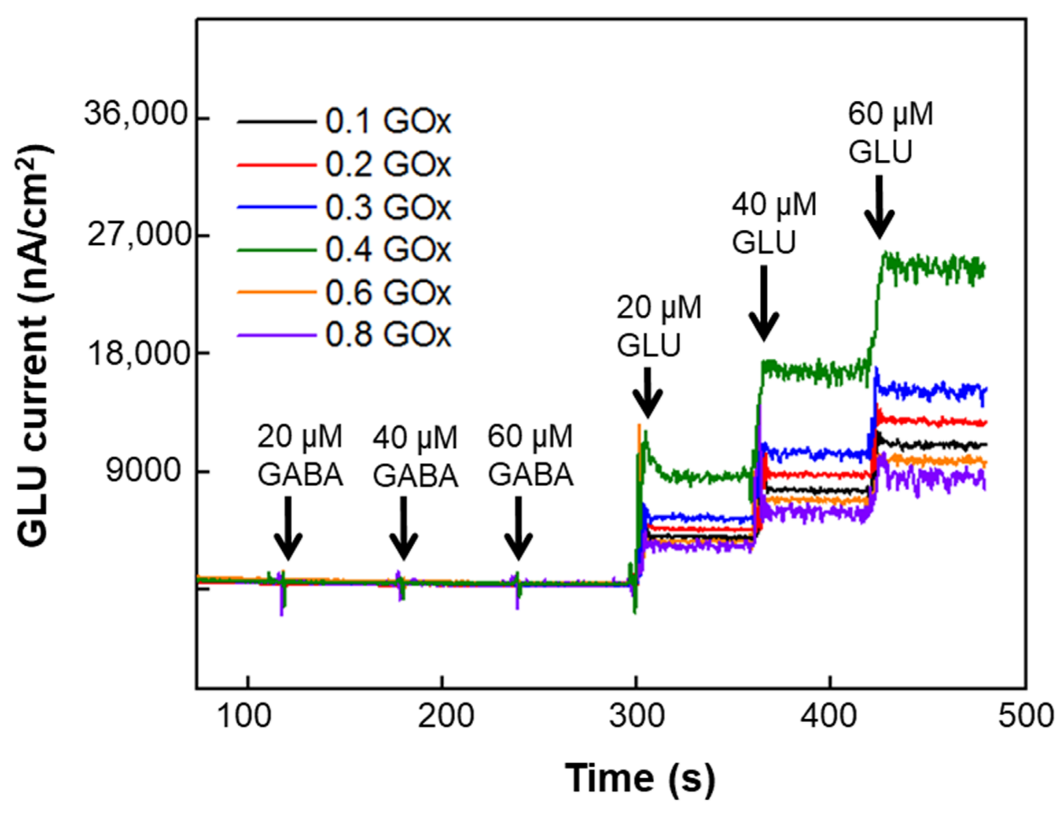
3.1.2. Effect of GOx and GABASE Concentrations on NT Sensitivity
3.1.3. Effect of mPD Coating Conditions on NT Selectivity
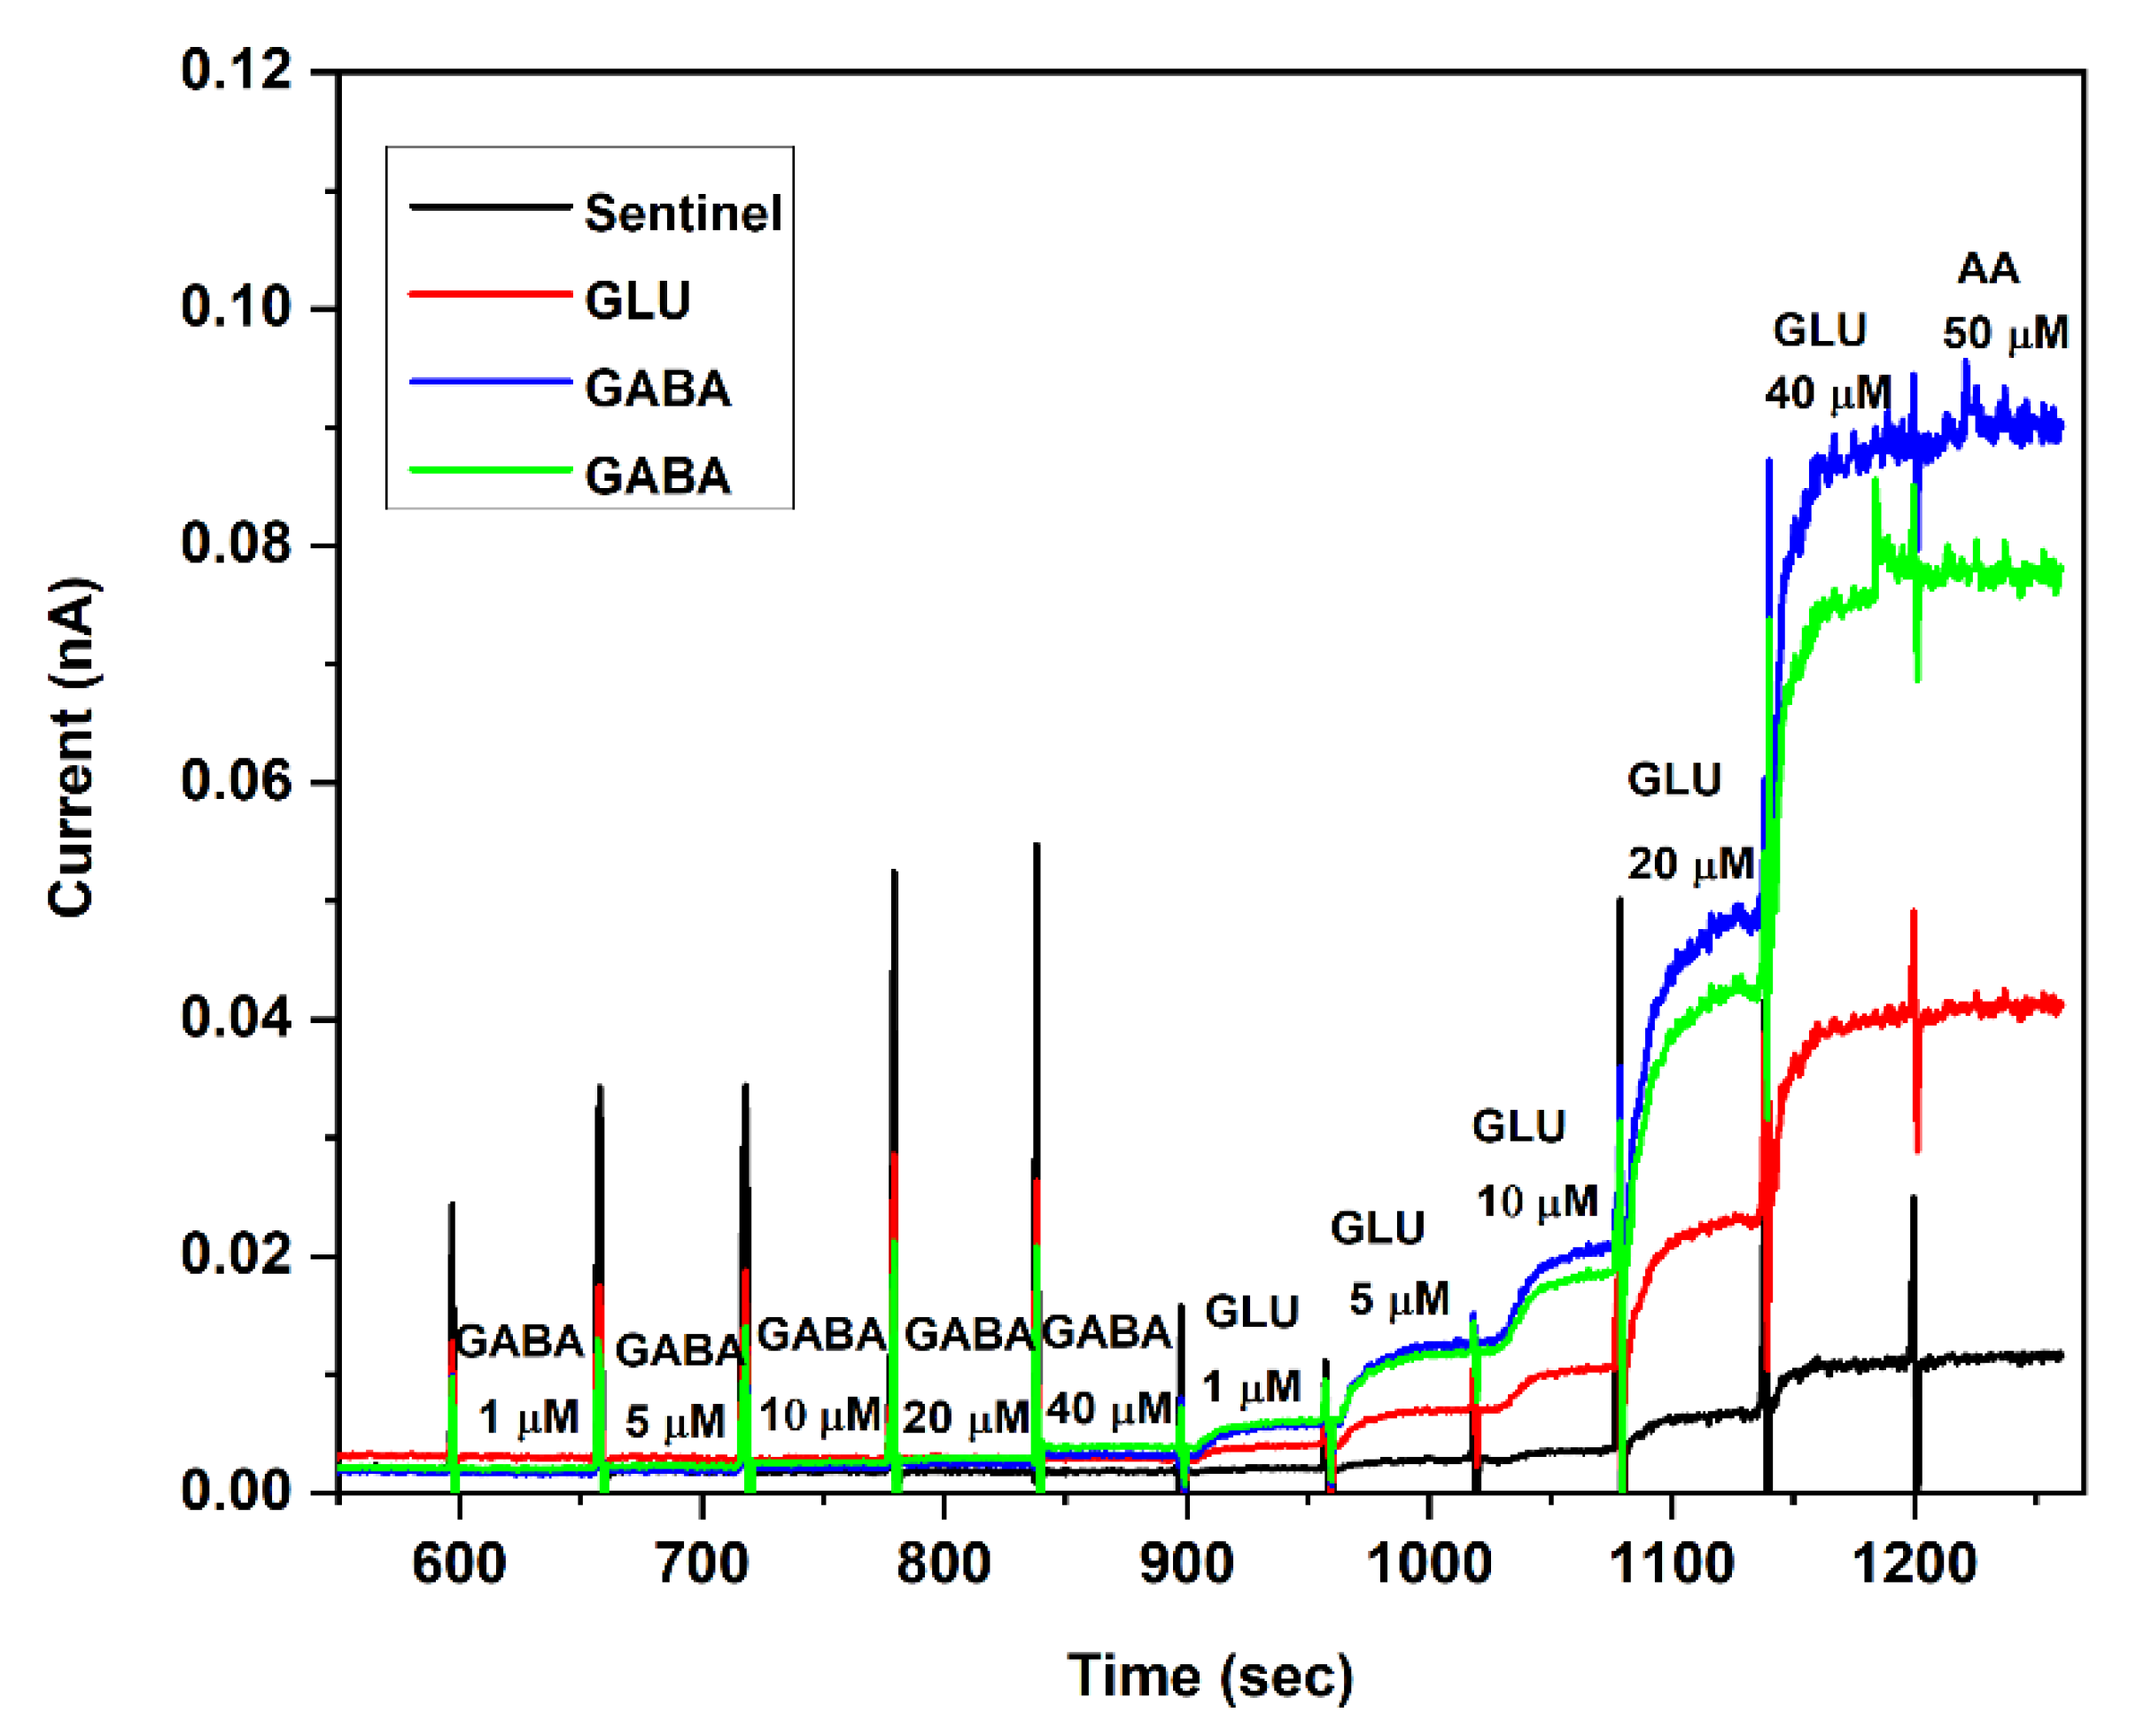
3.2. ODIC Calibration
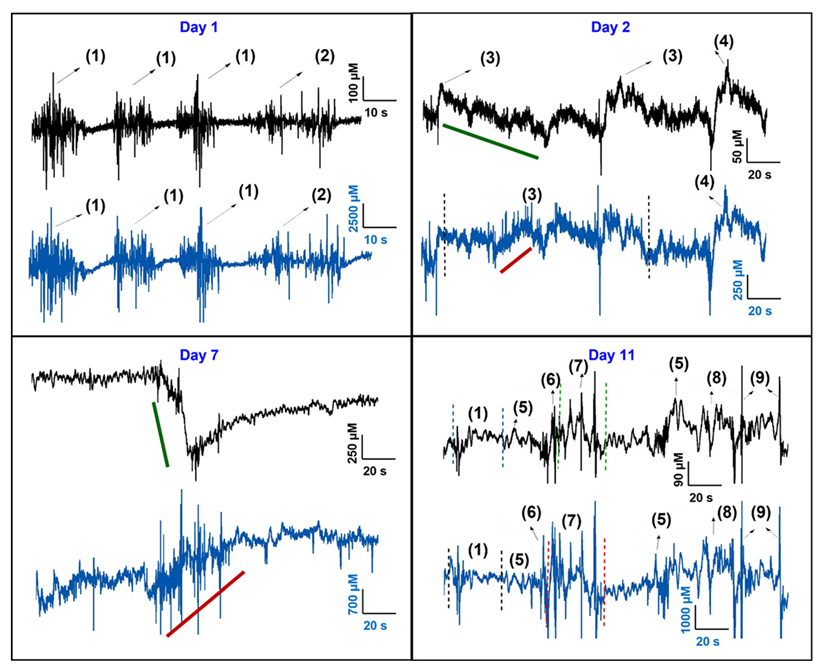
3.3. In Vivo Testing of Si Probe
4. Conclusions
Supplementary Materials
Author Contributions
Funding
Institutional Review Board Statement
Informed Consent Statement
Data Availability Statement
Acknowledgments
Conflicts of Interest
References
- Robinson, D.L.; Hermans, A.; Seipel, A.T.; Wightman, R.M. Monitoring rapid chemical communication in the brain. Chem. Rev. 2008, 108, 2554–2584. [Google Scholar] [CrossRef] [PubMed] [Green Version]
- Robinson, D.L.; Wightman, R.M. Rapid dopamine release in freely moving rats. In Electrochemical Methods for Neuroscience; Michael, A.C., Borland, L.M., Eds.; CRC Press: Boca Raton, FL, USA, 2007; pp. 17–34. [Google Scholar]
- Sandberg, S.G.; Garris, P.A. Neurochemistry of addiction: Monitoring essential neurotransmitters of addiction. In Advances in the Neuroscience of Addiction; Kuhn, C.M., Koob, G.F., Eds.; CRC Press: Boca Raton, FL, USA, 2010; pp. 101–136. [Google Scholar]
- Willuhn, I.; Wanat, M.J.; Clark, J.J.; Phillips, P.E. Dopamine signaling in the nucleus accumbens of animals self-administering drugs of abuse. Curr. Top. Behav. Neurosci. 2010, 3, 29–71. [Google Scholar] [CrossRef] [PubMed]
- Cahill, P.S.; Walker, Q.D.; Finnegan, J.M.; Mickelson, G.E.; Travis, E.R.; Wightman, R.M. Microelectrodes for the measurement of catecholamines in biological systems. Anal. Chem. 1996, 68, 3180–3186. [Google Scholar] [CrossRef] [PubMed]
- Bhata, R.; Axtella, R.; Mitrab, A.; Miranda, M.; Lock, C.; Tsien, R.W.; Steinman, L. Inhibitory role for GABA in autoimmune inflammation. Proc. Natl. Acad. Sci. USA 2010, 107, 2580–2585. [Google Scholar] [CrossRef] [Green Version]
- Caudill, W.L.; Houck, G.P.; Wightman, R.M. Determination of γ-aminobutyric acid by liquid chromatography with electrochemical detection. J. Chromatogr. B Biomed. Sci. Appl. 1982, 227, 331–339. [Google Scholar] [CrossRef]
- Smith, S. Measurement of GABA in rat brain microdialysates using o-phthaldialdehyde—sulphite derivatization and high-performance liquid chromatography with electrochemical detection. J. Chromatogr. B Biomed. Sci. Appl. 1994, 652, 228–233. [Google Scholar] [CrossRef]
- Wong, C.G.; Bottiglieri, T.; Snead, O.C. GABA, gamma-hydroxybutyric acid, and neurological disease. Ann. Neurol. 2003, 54, S3–S12. [Google Scholar] [CrossRef]
- You, C.; Yao, L.; Yao, P.; Li, L.; Ding, P.; Liang, S.; Liu, C.; Xue, N. An iEEG Recording and Adjust-able Shunt-Current Conduction Platform for Epilepsy Treatment. Biosensors 2022, 12, 247. [Google Scholar] [CrossRef]
- Kadakkuzha, B.M.; Sathyanarayanan, V.P. Genomics and proteomics in solving brain complexity. Mol. Biosyst. 2013, 9, 1807–1821. [Google Scholar] [CrossRef]
- Ganau, L.; Prisco, L.; Ligarotti, G.K.I.; Ambu, R.; Ganau, M. Understanding the Pathological Basis of Neurological Diseases Through Diagnostic Platforms Based on Innovations in Biomedical Engineering: New Concepts and Theranostics Perspectives. Medicines 2018, 5, 22. [Google Scholar] [CrossRef] [Green Version]
- Kehr, U.U. Fast HPLC Estimation of γ-Aminobutyric Acid in Microdialysis Perfusates: Effect of Nipecotic and 3-Mercaptopropionic Acids. J. Neurochem. 1988, 51, 1308–1310. [Google Scholar] [CrossRef] [PubMed]
- Rowley, H.L.; Martin, K.F.; Marsden, C.A. Determination of in vivo amino acid neurotransmitters by high-performance liquid chromatography with o-phthalaldehyde-sulphite derivatisation. J. Neurosci. Methods 1995, 57, 93–99. [Google Scholar] [CrossRef]
- Andrea, A.; Monge-Acuna, J.F. A high performance liquid chromatography method with electrochemical detection of gamma-aminobutyric acid, glutamate and glutamine in rat brain homogenates. J. Neurosci. Methods 2009, 183, 176–181. [Google Scholar] [CrossRef]
- Reinhoud, N.J. Analysis of glutamate, GABA, noradrenaline, dopamine, serotonin, and metabolites using microbore UHPLC with electrochemical detection. ACS Chem. Neurosci. 2013, 4, 888–894. [Google Scholar] [CrossRef] [PubMed] [Green Version]
- Qi Zhang, Bruce Bailey, Marc Plante, David Thomas, and Ian Acworth. Fast UHPLC Methods for Analysis of Amino Acids. Available online: chrome-extension://efaidnbmnnnibpcajpcglclefindmkaj/http://tools.thermofisher.com/content/sfs/posters/114372-PO-ECD-Amino-Acids-70537.pdf (accessed on 14 January 2022).
- Watson, C.J.; Venton, B.J.; Kennedy, R.T. In vivo measurements of neurotransmitters by microdialysis sampling. Anal. Chem. 2006, 78, 1391–1399. [Google Scholar] [CrossRef]
- Mabrouk, O.S.; Han, J.L.; Wong, J.-M.T.; Akil, H.; Kennedy, R.T.; Flagel, S.B. The in Vivo Neurochemical Profile of Selectively Bred High-Responder and Low-Responder Rats Reveals Baseline, Cocaine-Evoked, and Novelty-Evoked Differences in Monoaminergic Systems. ACS Chem. Neurosci. 2018, 9, 715–724. [Google Scholar] [CrossRef] [Green Version]
- Zhang, X.; Hatamie, A.; Ewing, A.G. Nanoelectrochemical analysis inside a single living cell. Curr. Opin. Electrochem. 2020, 22, 94–101. [Google Scholar] [CrossRef]
- Nasr, B.; Chatterton, R.; Yong, J.H.M.; Jamshidi, P.; D’Abaco, G.M.; Bjorksten, A.R.; Kavehei, O.; Chana, G.; Dottori, M.; Skafidas, E. Self-organized nanostructure modified microelectrode for sensitive electrochemical glutamate detection in stem cells-derived brain organoids. Biosensors 2018, 8, 14. [Google Scholar] [CrossRef] [Green Version]
- Hascup, K.N.; Rutherford, E.C.; Quintero, J.E.; Day, B.K.; Burmeister, J.; Gerhardt, G.A. Second-by-second measures of glutamate and other neurotransmitters using enzyme-based microelectrode arrays. In Electrochemical Methods for Neuroscience; Michael, A.C., Borland, L.M., Eds.; CRC Press: Boca Raton, FL, USA, 2007; pp. 407–450. Available online: https://www.ncbi.nlm.nih.gov/books/NBK2567/ (accessed on 14 January 2022).
- Garguilo, M.G.; Michael, A.C. Quantification of choline in the extracellular fluid of brain tissue with amperometric micro sensors. Anal. Chem. 1994, 66, 2621–2629. [Google Scholar] [CrossRef]
- Mazzei, F. Peroxidase based amperometric biosensors for the determination of γ-aminobutyric acid. Anal. Chim. Acta 1996, 328, 41–46. [Google Scholar] [CrossRef]
- Sekioka, N.; Kato, D.; Kurita, R.; Niwa, S.; Hirono, O. Improved detection limit for an electrochemical γ-aminobutyric acid sensor based on stable NADPH detection using an electron cyclotron resonance sputtered carbon film electrode. Sens. Actuators B 2008, 129, 442–449. [Google Scholar] [CrossRef]
- Niwa, O.; Kurita, R.; Horiuchi, T.; Torimitsu, K. Small-Volume On-Line Sensor for Continuous Measurement of γ-Aminobutyric Acid. Anal. Chem. 1998, 70, 89–93. [Google Scholar] [CrossRef] [PubMed]
- Antec Scientific. Alexys Neurotransmitter Analyzer, Gaba and Glutamate, Application Note 213_020#01. Available online: https://antecscientific.com/applications/neurotransmitters/gaba-and-glutamate/ (accessed on 19 January 2022).
- Hossain, I.; Tan, C.; Doughty, P.T.; Dutta, G.; Murray, T.A.; Siddiqui, S.; Iasemidis, L.; Arumugam, P.U. A Novel Microbiosensor Microarray for Continuous ex Vivo Monitoring of Gamma-Aminobutyric Acid in Real-Time. Front. Neurosci. 2018, 12, 500. [Google Scholar] [CrossRef] [PubMed] [Green Version]
- Doughty, P.T.; Hossain, I.; Gong, C.; Ponder, K.A.; Pati, S.; Arumugam, P.U.; Murray, T.A. Novel microwire-based biosensor probe for simultaneous real-time measurement of glutamate and GABA dynamics in vitro and in vivo. Sci. Rep. 2020, 10, 12777. [Google Scholar] [CrossRef] [PubMed]
- Moldovan, N.; Blaga, I.I.; Billa, S.; Hossain, I.; Gong, C.; Jones, C.E.; Murray, T.A.; Divan, R.; Siddiqui, S.; Arumugam, P.U. Brain-implantable multifunctional probe for simultaneous detection of glutamate and GABA neurotransmitters. Sens. Actuators B Chem. 2021, 337, 129795. [Google Scholar] [CrossRef]
- Tan, C.; Doughty, P.T.; Magee, K.; Murray, T.A.; Siddiqui, S.; Arumugam, P.U. Effect of process parameters on electrochemical performance of a glutamate microbiosensor. J. Electrochem. Soc. 2020, 167, 027528. [Google Scholar] [CrossRef]
- Evans, S.A.; Elliott, J.M.; Andrews, L.M.; Bartlett, P.N.; Doyle, P.J.; Denuault, G. Detection of Hydrogen Peroxide at Mesoporous Platinum Microelectrodes. Anal. Chem. 2002, 74, 1322–1326. [Google Scholar] [CrossRef]
- Dutta, G.; Siddiqui, S.; Zeng, H.; Carlisle, J.A.; Arumugam, P.U. The effect of electrode size and surface heterogeneity on electrochemical properties of ultrananocr ystalline diamond microelectrode. J. Electroanal. Chem. 2015, 756, 61–68. [Google Scholar] [CrossRef]
- Han, J.-H.; Boo, H.; Park, S.; Chung, T.D. Electrochemical oxidation of hydrogen peroxide at nanoporous platinum electrodes and the application to glutamate microsensor. Electrochim. Acta 2006, 52, 1788–1791. [Google Scholar] [CrossRef]
- Weltin, A.; Kieninger, J.; Enderle, B.; Gellner, A.K.; Fritsch, B.; Urban, G.A. Polymer-based, flexible glutamate and lactate microsensors for in vivo applications. Biosens. Bioelectron. 2014, 61, 192–199. [Google Scholar] [CrossRef]
- Burmeister, J.J.; Price, D.A.; Pomerleau, F.; Huettl, P.; Quintero, J.E.; Gerhardt, G.A. Challenges of simultaneous measurements of brain extracellular GABA and glutamate in vivo using enzyme-coated microelectrode arrays. J. Neurosci. Methods 2020, 329, 108435. [Google Scholar] [CrossRef] [PubMed]


Publisher’s Note: MDPI stays neutral with regard to jurisdictional claims in published maps and institutional affiliations. |
© 2022 by the authors. Licensee MDPI, Basel, Switzerland. This article is an open access article distributed under the terms and conditions of the Creative Commons Attribution (CC BY) license (https://creativecommons.org/licenses/by/4.0/).
Share and Cite
Billa, S.; Yanamadala, Y.; Hossain, I.; Siddiqui, S.; Moldovan, N.; Murray, T.A.; Arumugam, P.U. Brain-Implantable Multifunctional Probe for Simultaneous Detection of Glutamate and GABA Neurotransmitters: Optimization and In Vivo Studies. Micromachines 2022, 13, 1008. https://doi.org/10.3390/mi13071008
Billa S, Yanamadala Y, Hossain I, Siddiqui S, Moldovan N, Murray TA, Arumugam PU. Brain-Implantable Multifunctional Probe for Simultaneous Detection of Glutamate and GABA Neurotransmitters: Optimization and In Vivo Studies. Micromachines. 2022; 13(7):1008. https://doi.org/10.3390/mi13071008
Chicago/Turabian StyleBilla, Sanjeev, Yaswanthi Yanamadala, Imran Hossain, Shabnam Siddiqui, Nicolaie Moldovan, Teresa A. Murray, and Prabhu U. Arumugam. 2022. "Brain-Implantable Multifunctional Probe for Simultaneous Detection of Glutamate and GABA Neurotransmitters: Optimization and In Vivo Studies" Micromachines 13, no. 7: 1008. https://doi.org/10.3390/mi13071008
APA StyleBilla, S., Yanamadala, Y., Hossain, I., Siddiqui, S., Moldovan, N., Murray, T. A., & Arumugam, P. U. (2022). Brain-Implantable Multifunctional Probe for Simultaneous Detection of Glutamate and GABA Neurotransmitters: Optimization and In Vivo Studies. Micromachines, 13(7), 1008. https://doi.org/10.3390/mi13071008