
Characterization of a Centrifugal Microfluidic Orthogonal Flow Platform

 , ,
, , 
 and
and 
Abstract
:1. Introduction
1.1. Statement of the Problem
1.2. Microfluidic Foundations
2. Experimental
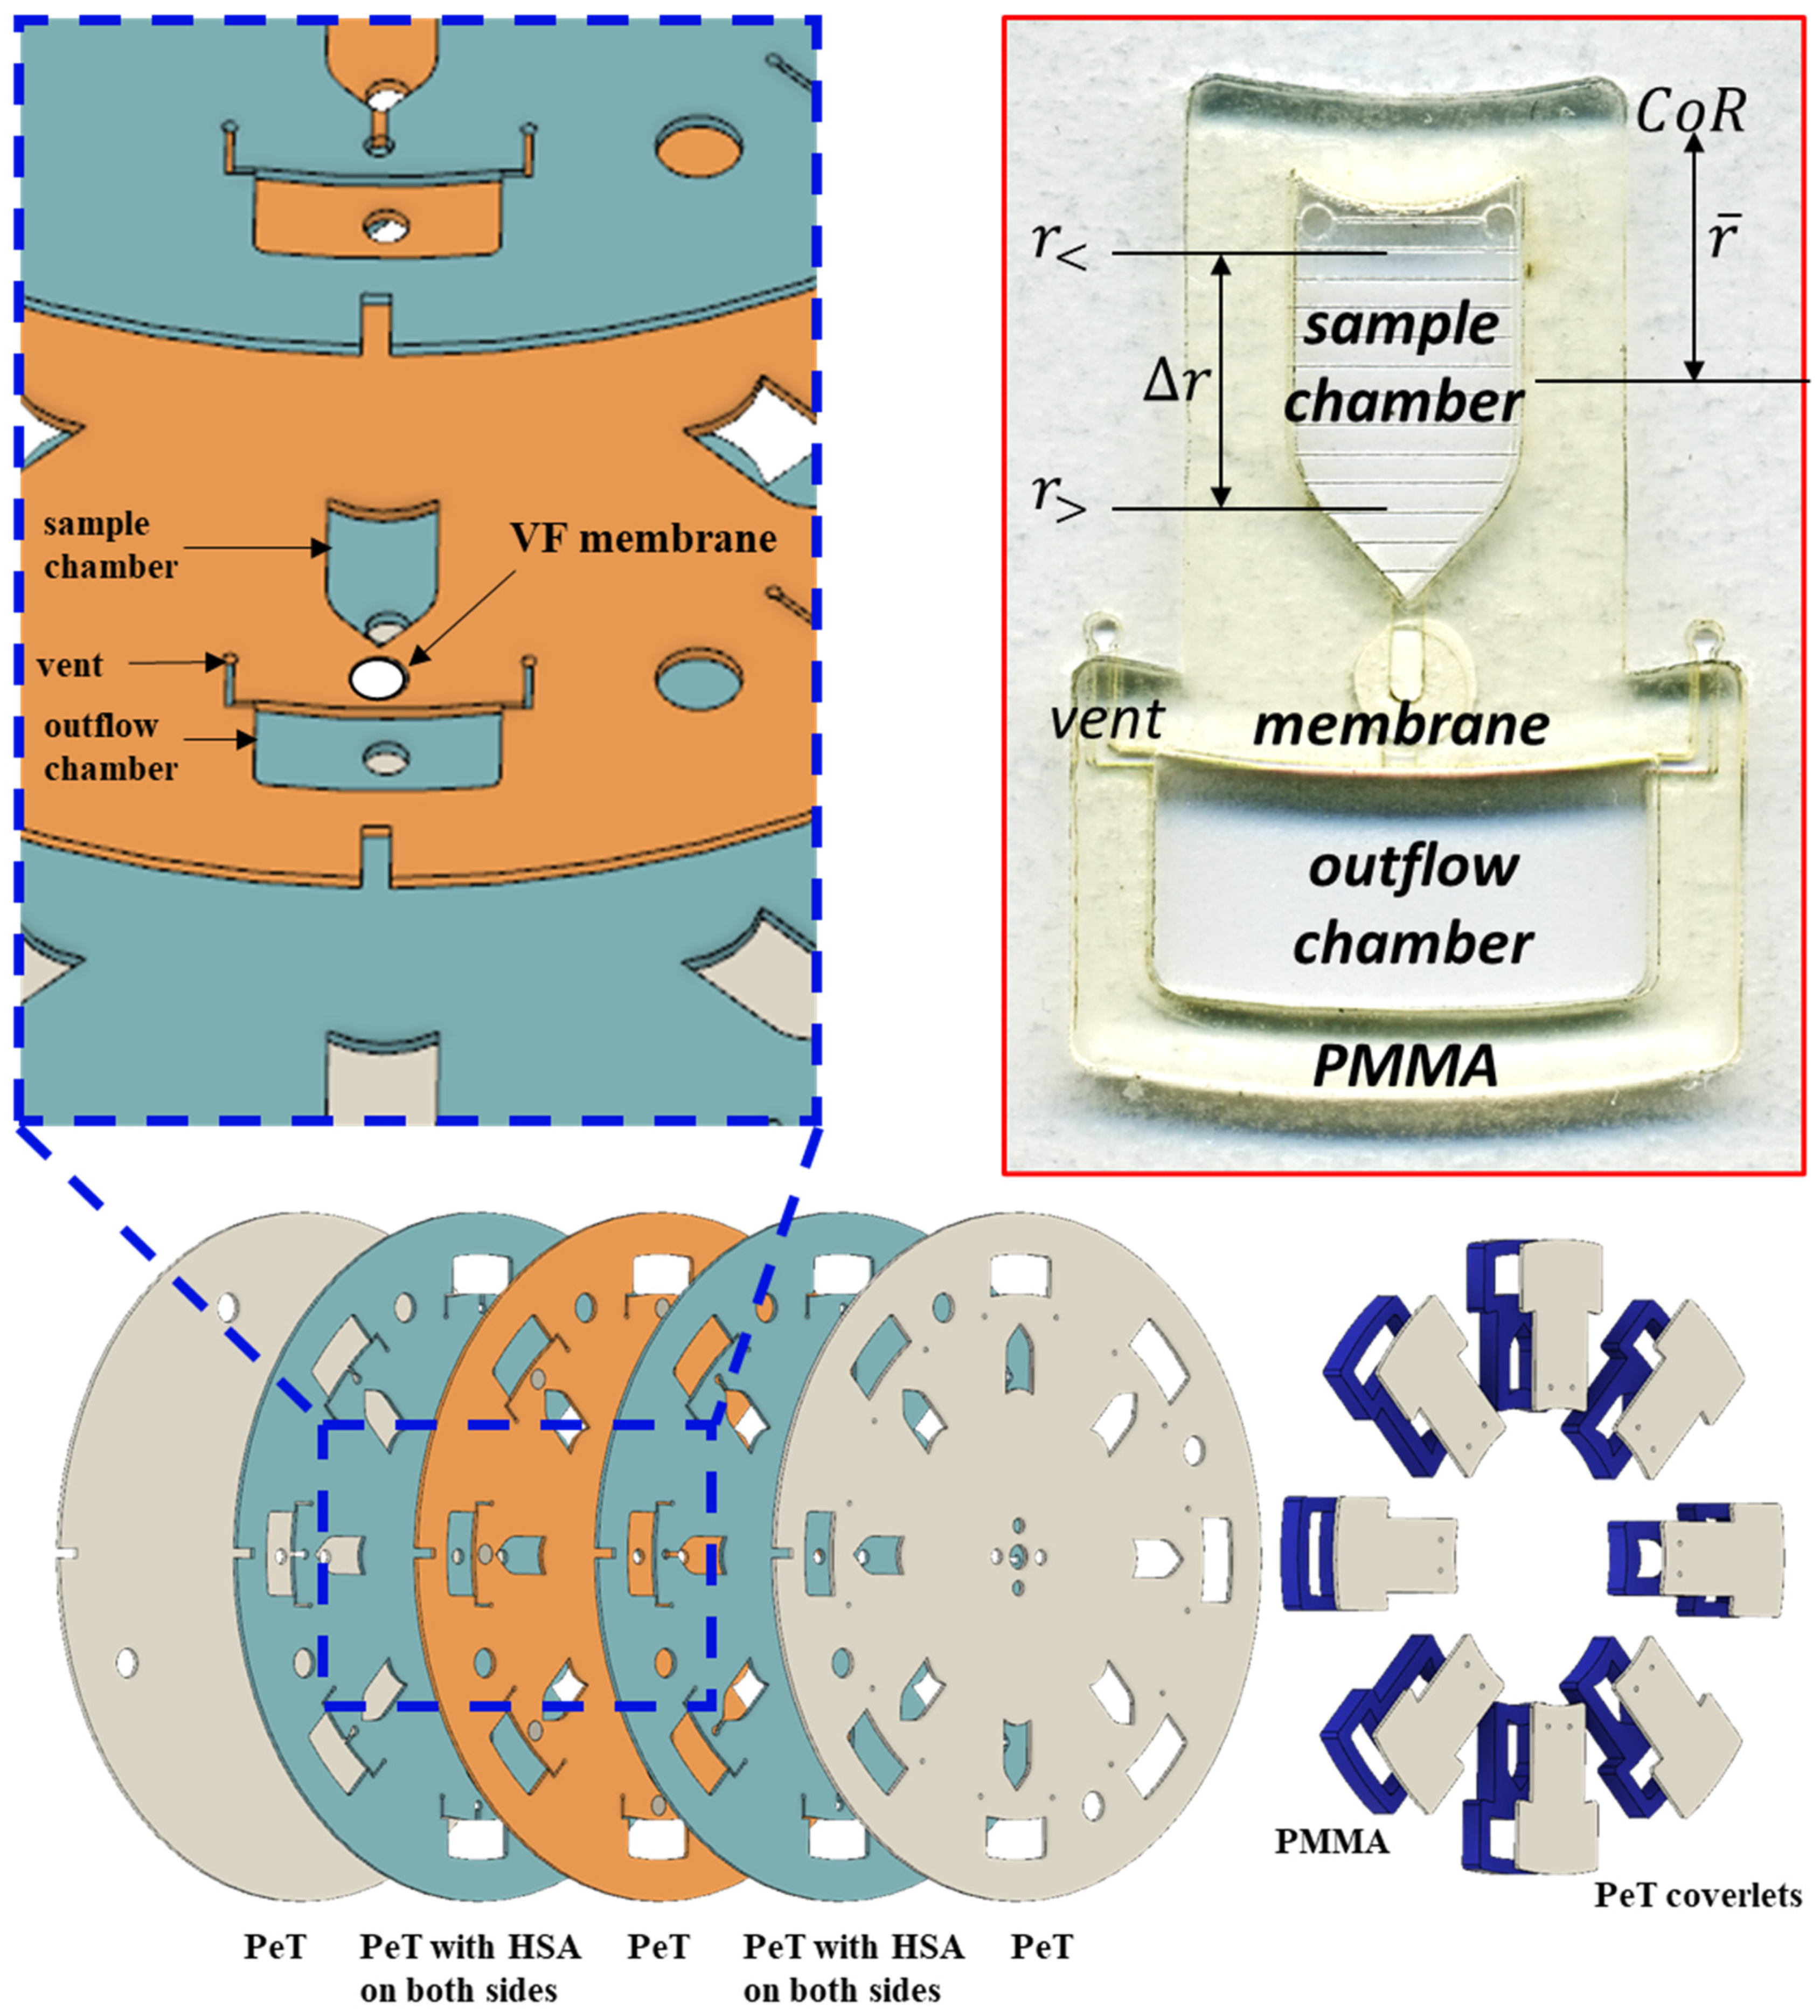
2.1. Fabrication
2.2. Microfluidic Layout and Flow Pattern
2.3. Centrifugally Driven Orthogonal Flow (Proof-of-Principle)
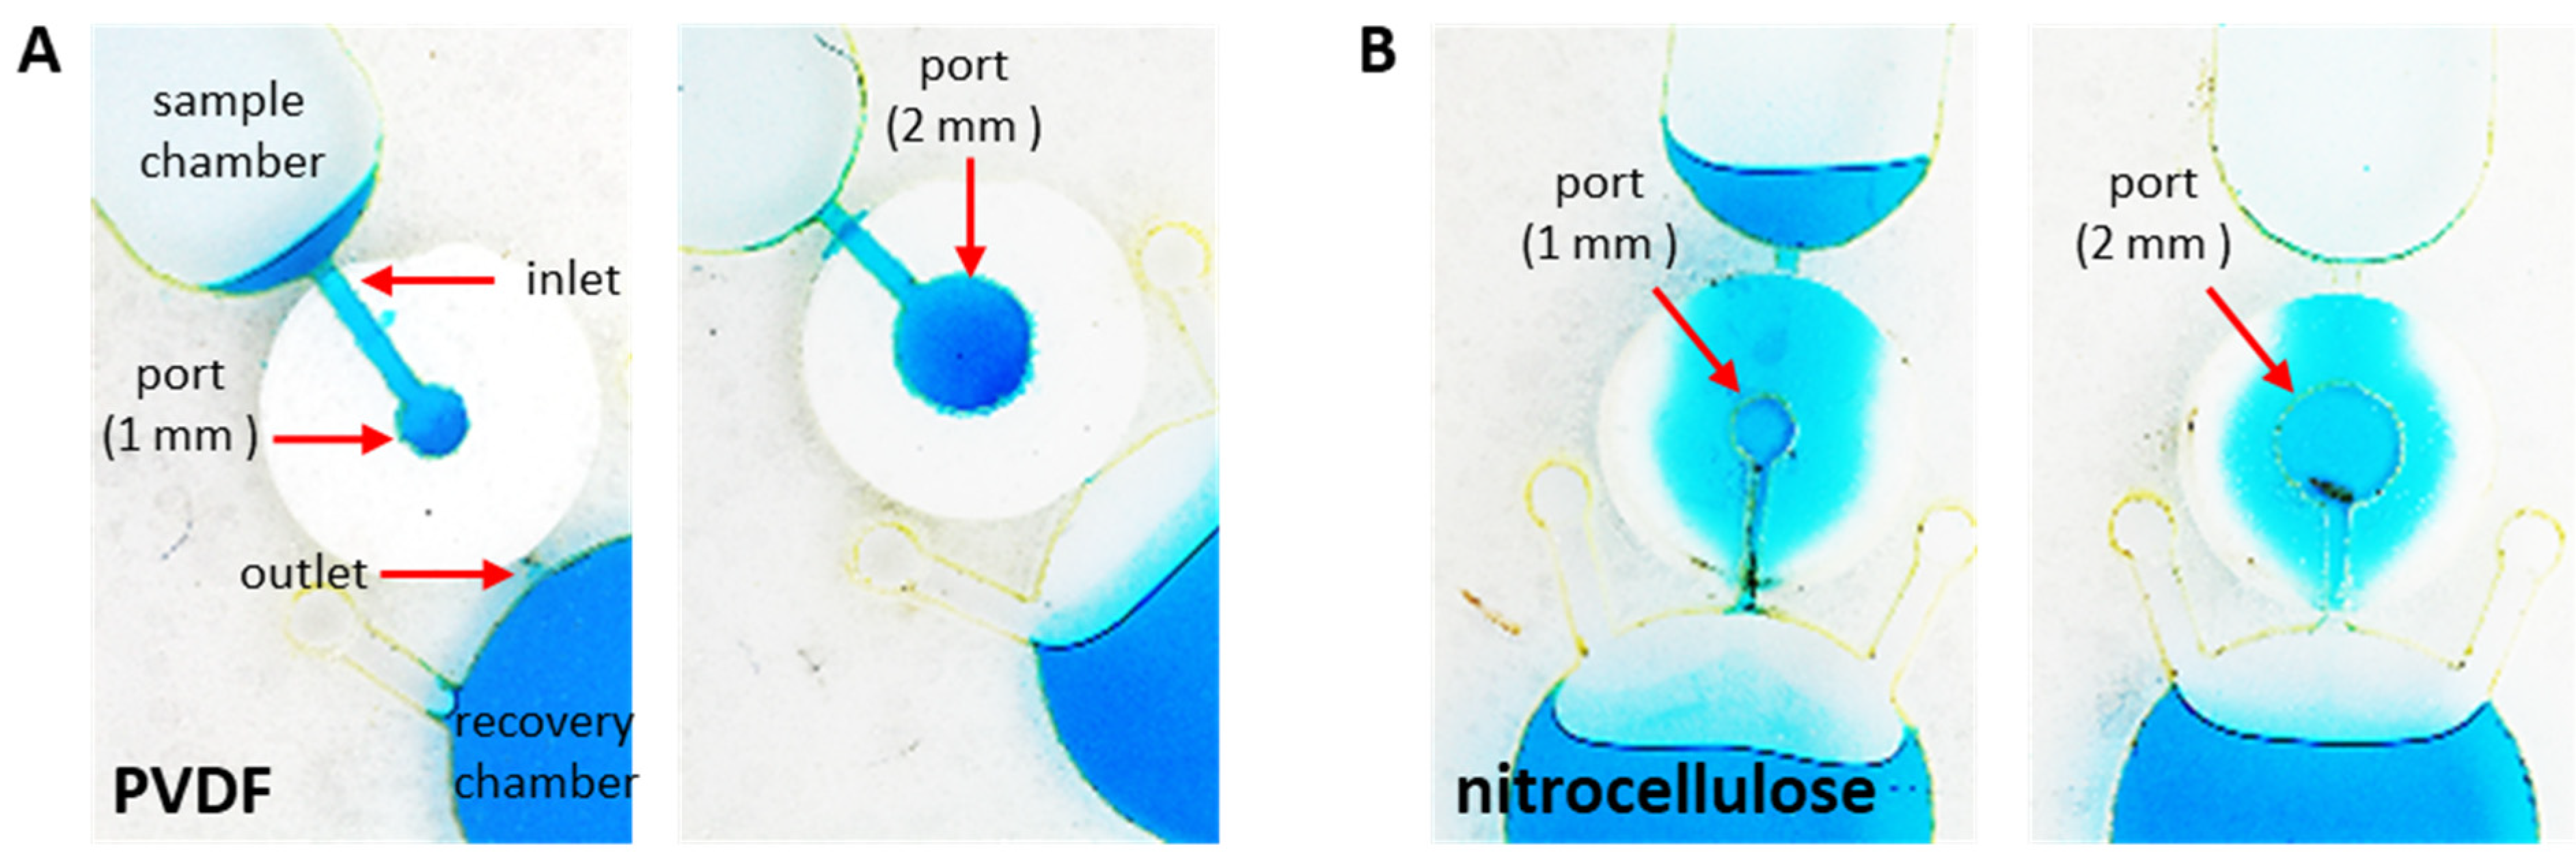
2.4. Characterization of On-Disc Orthogonal Flow
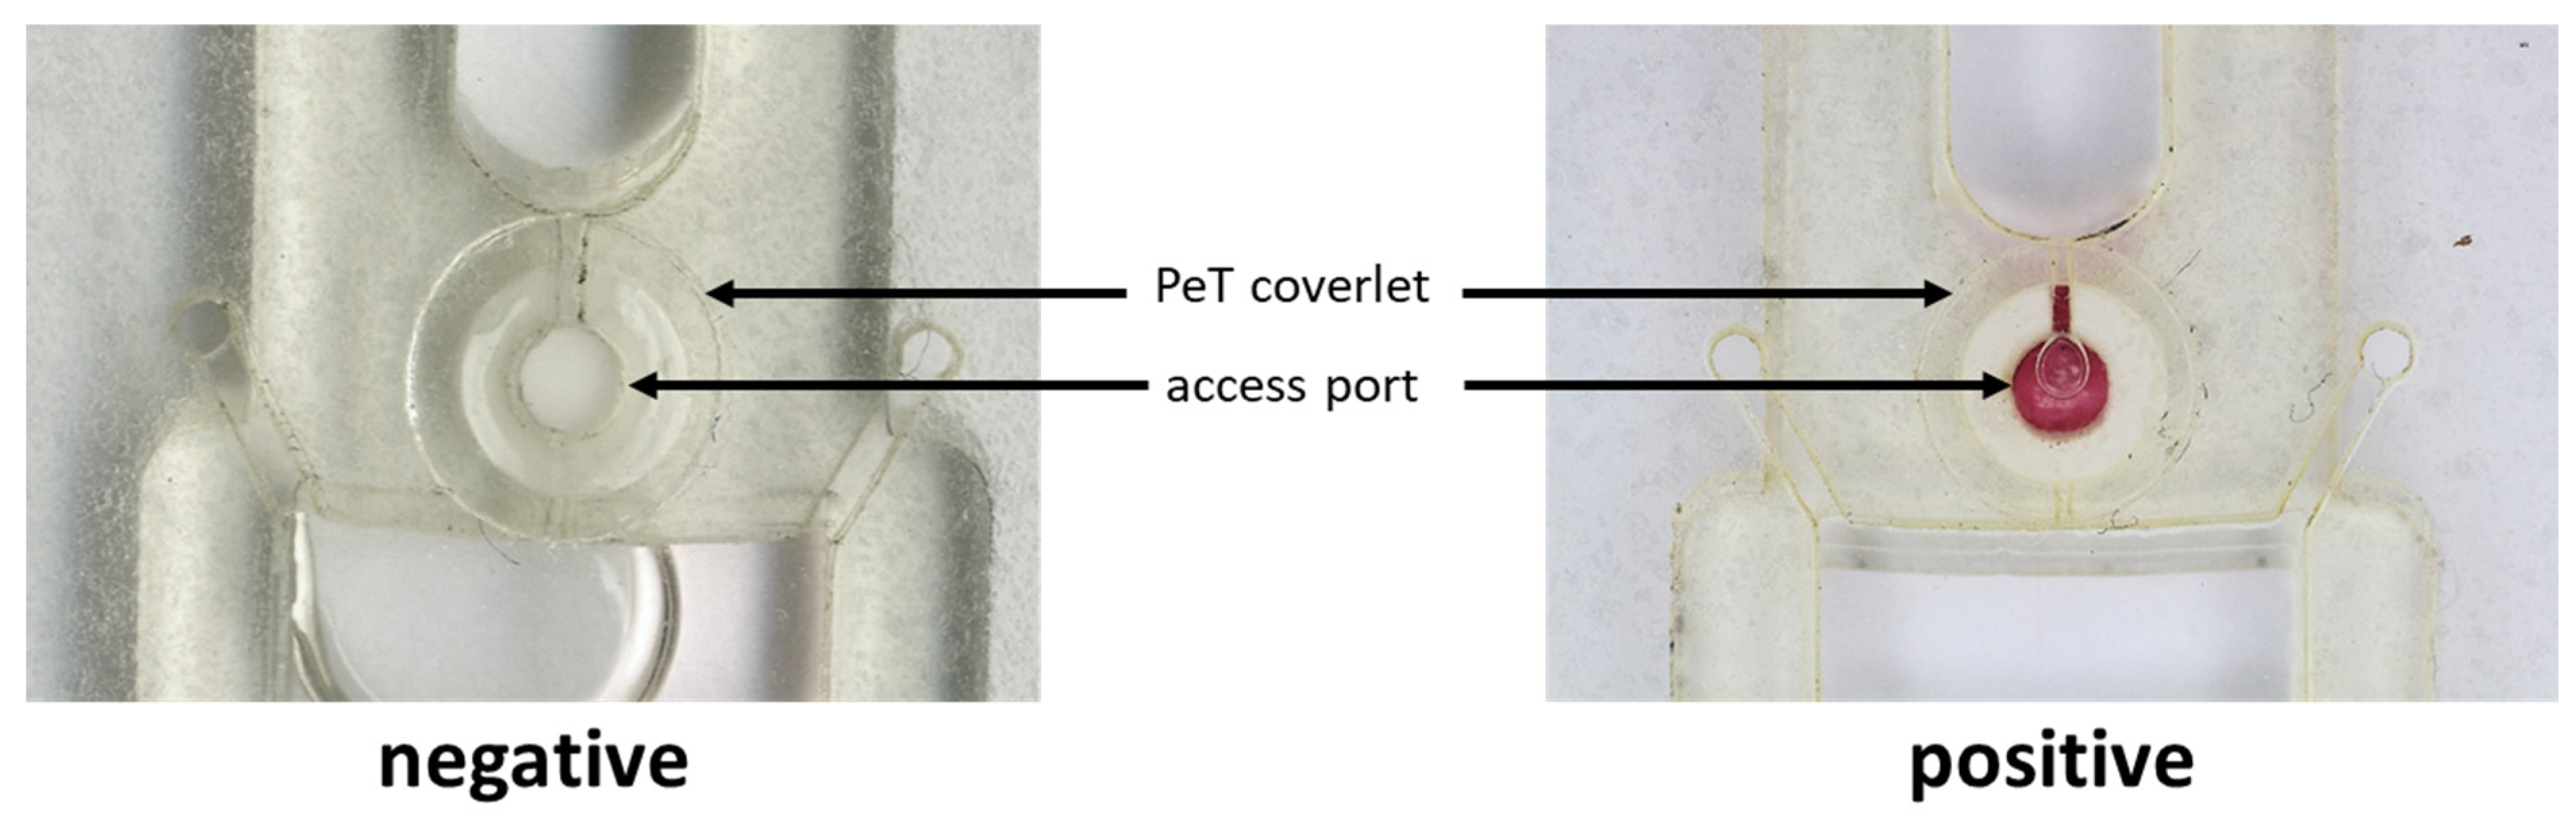
2.5. On-Disc Immunodetection of Ebola Virus-like Particles
3. Results and Discussion
3.1. On-Disc Orthogonal Flow
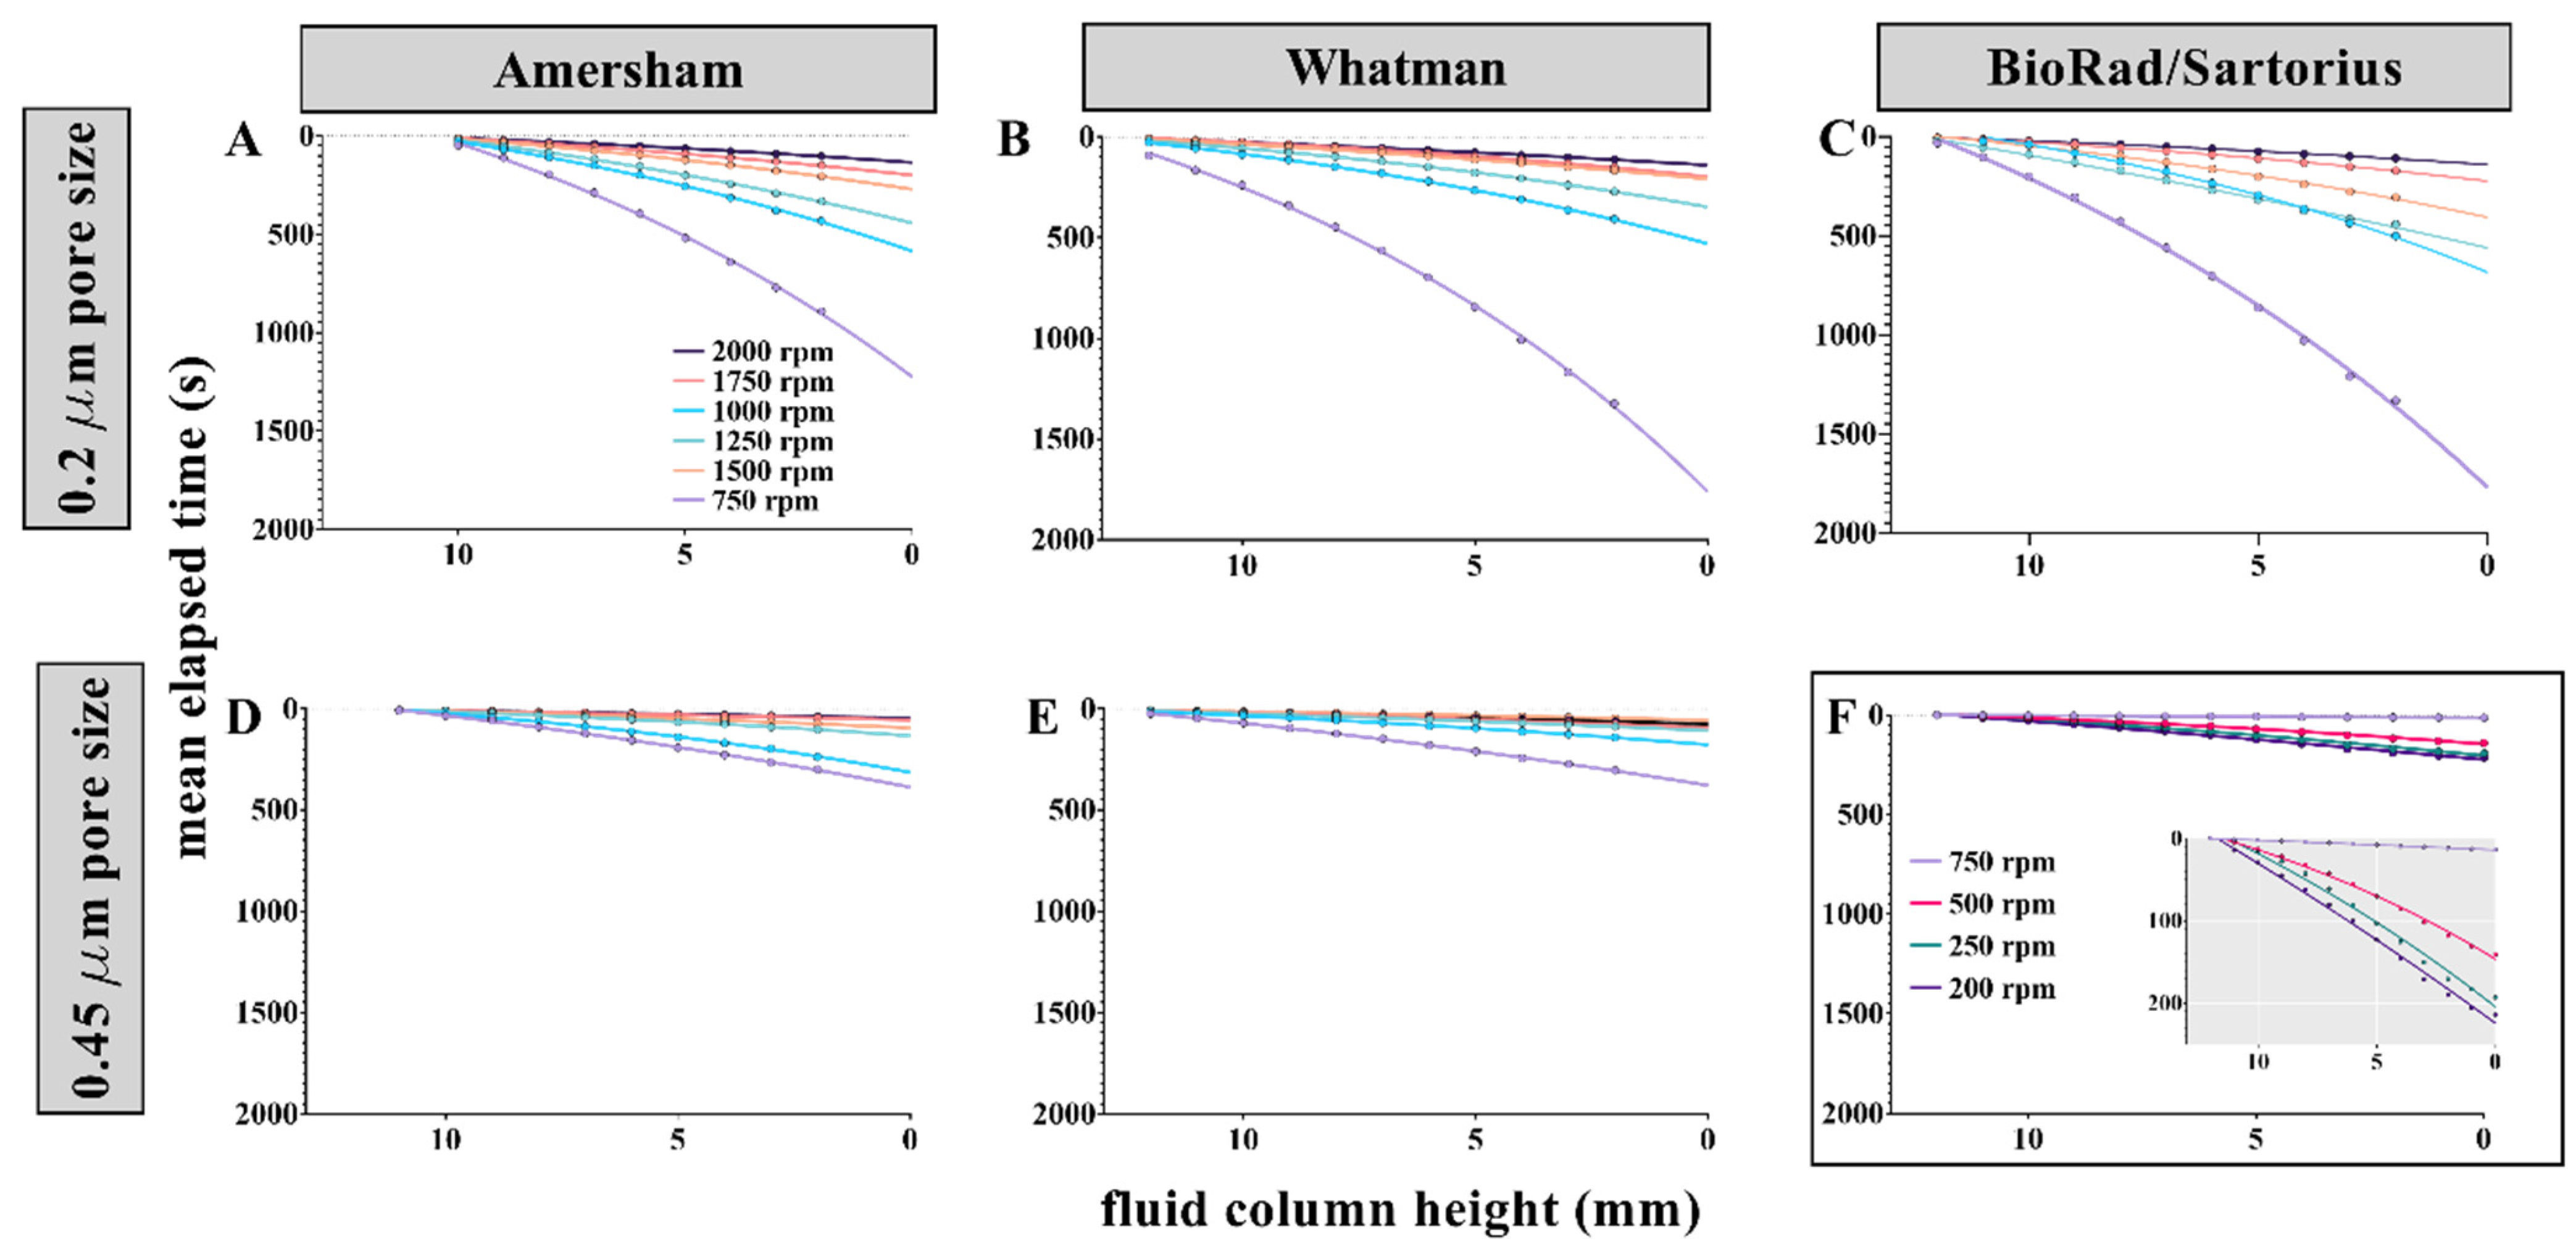
3.2. Effect of Membrane Pore Size and Rotational Frequency
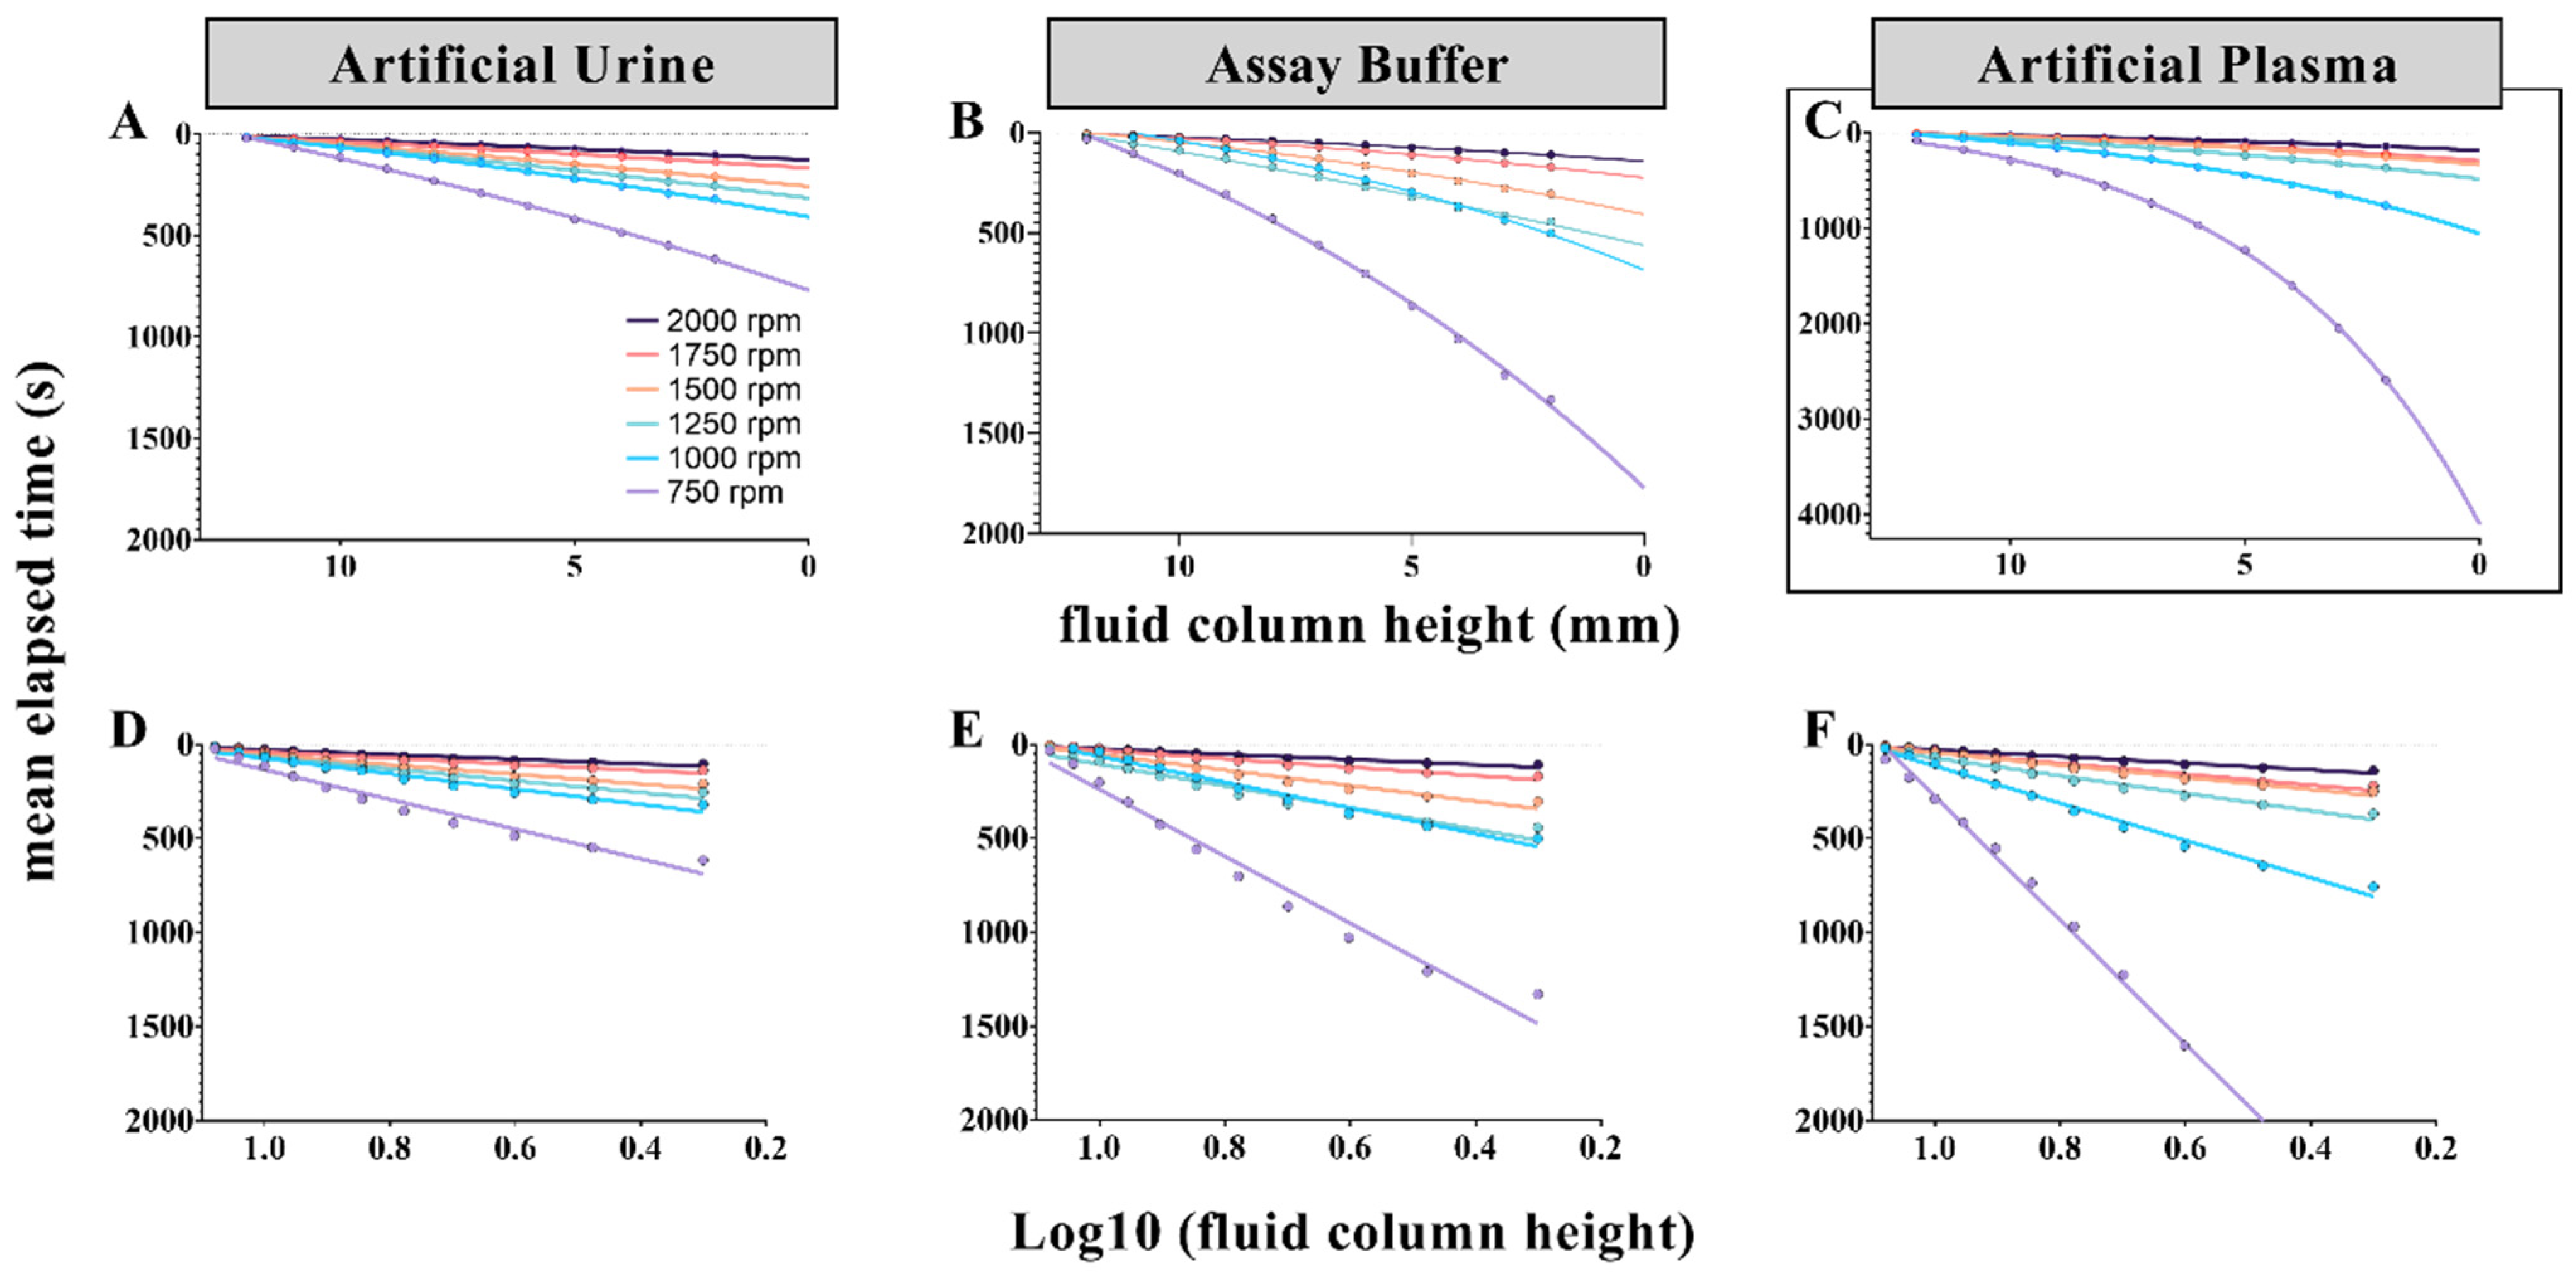
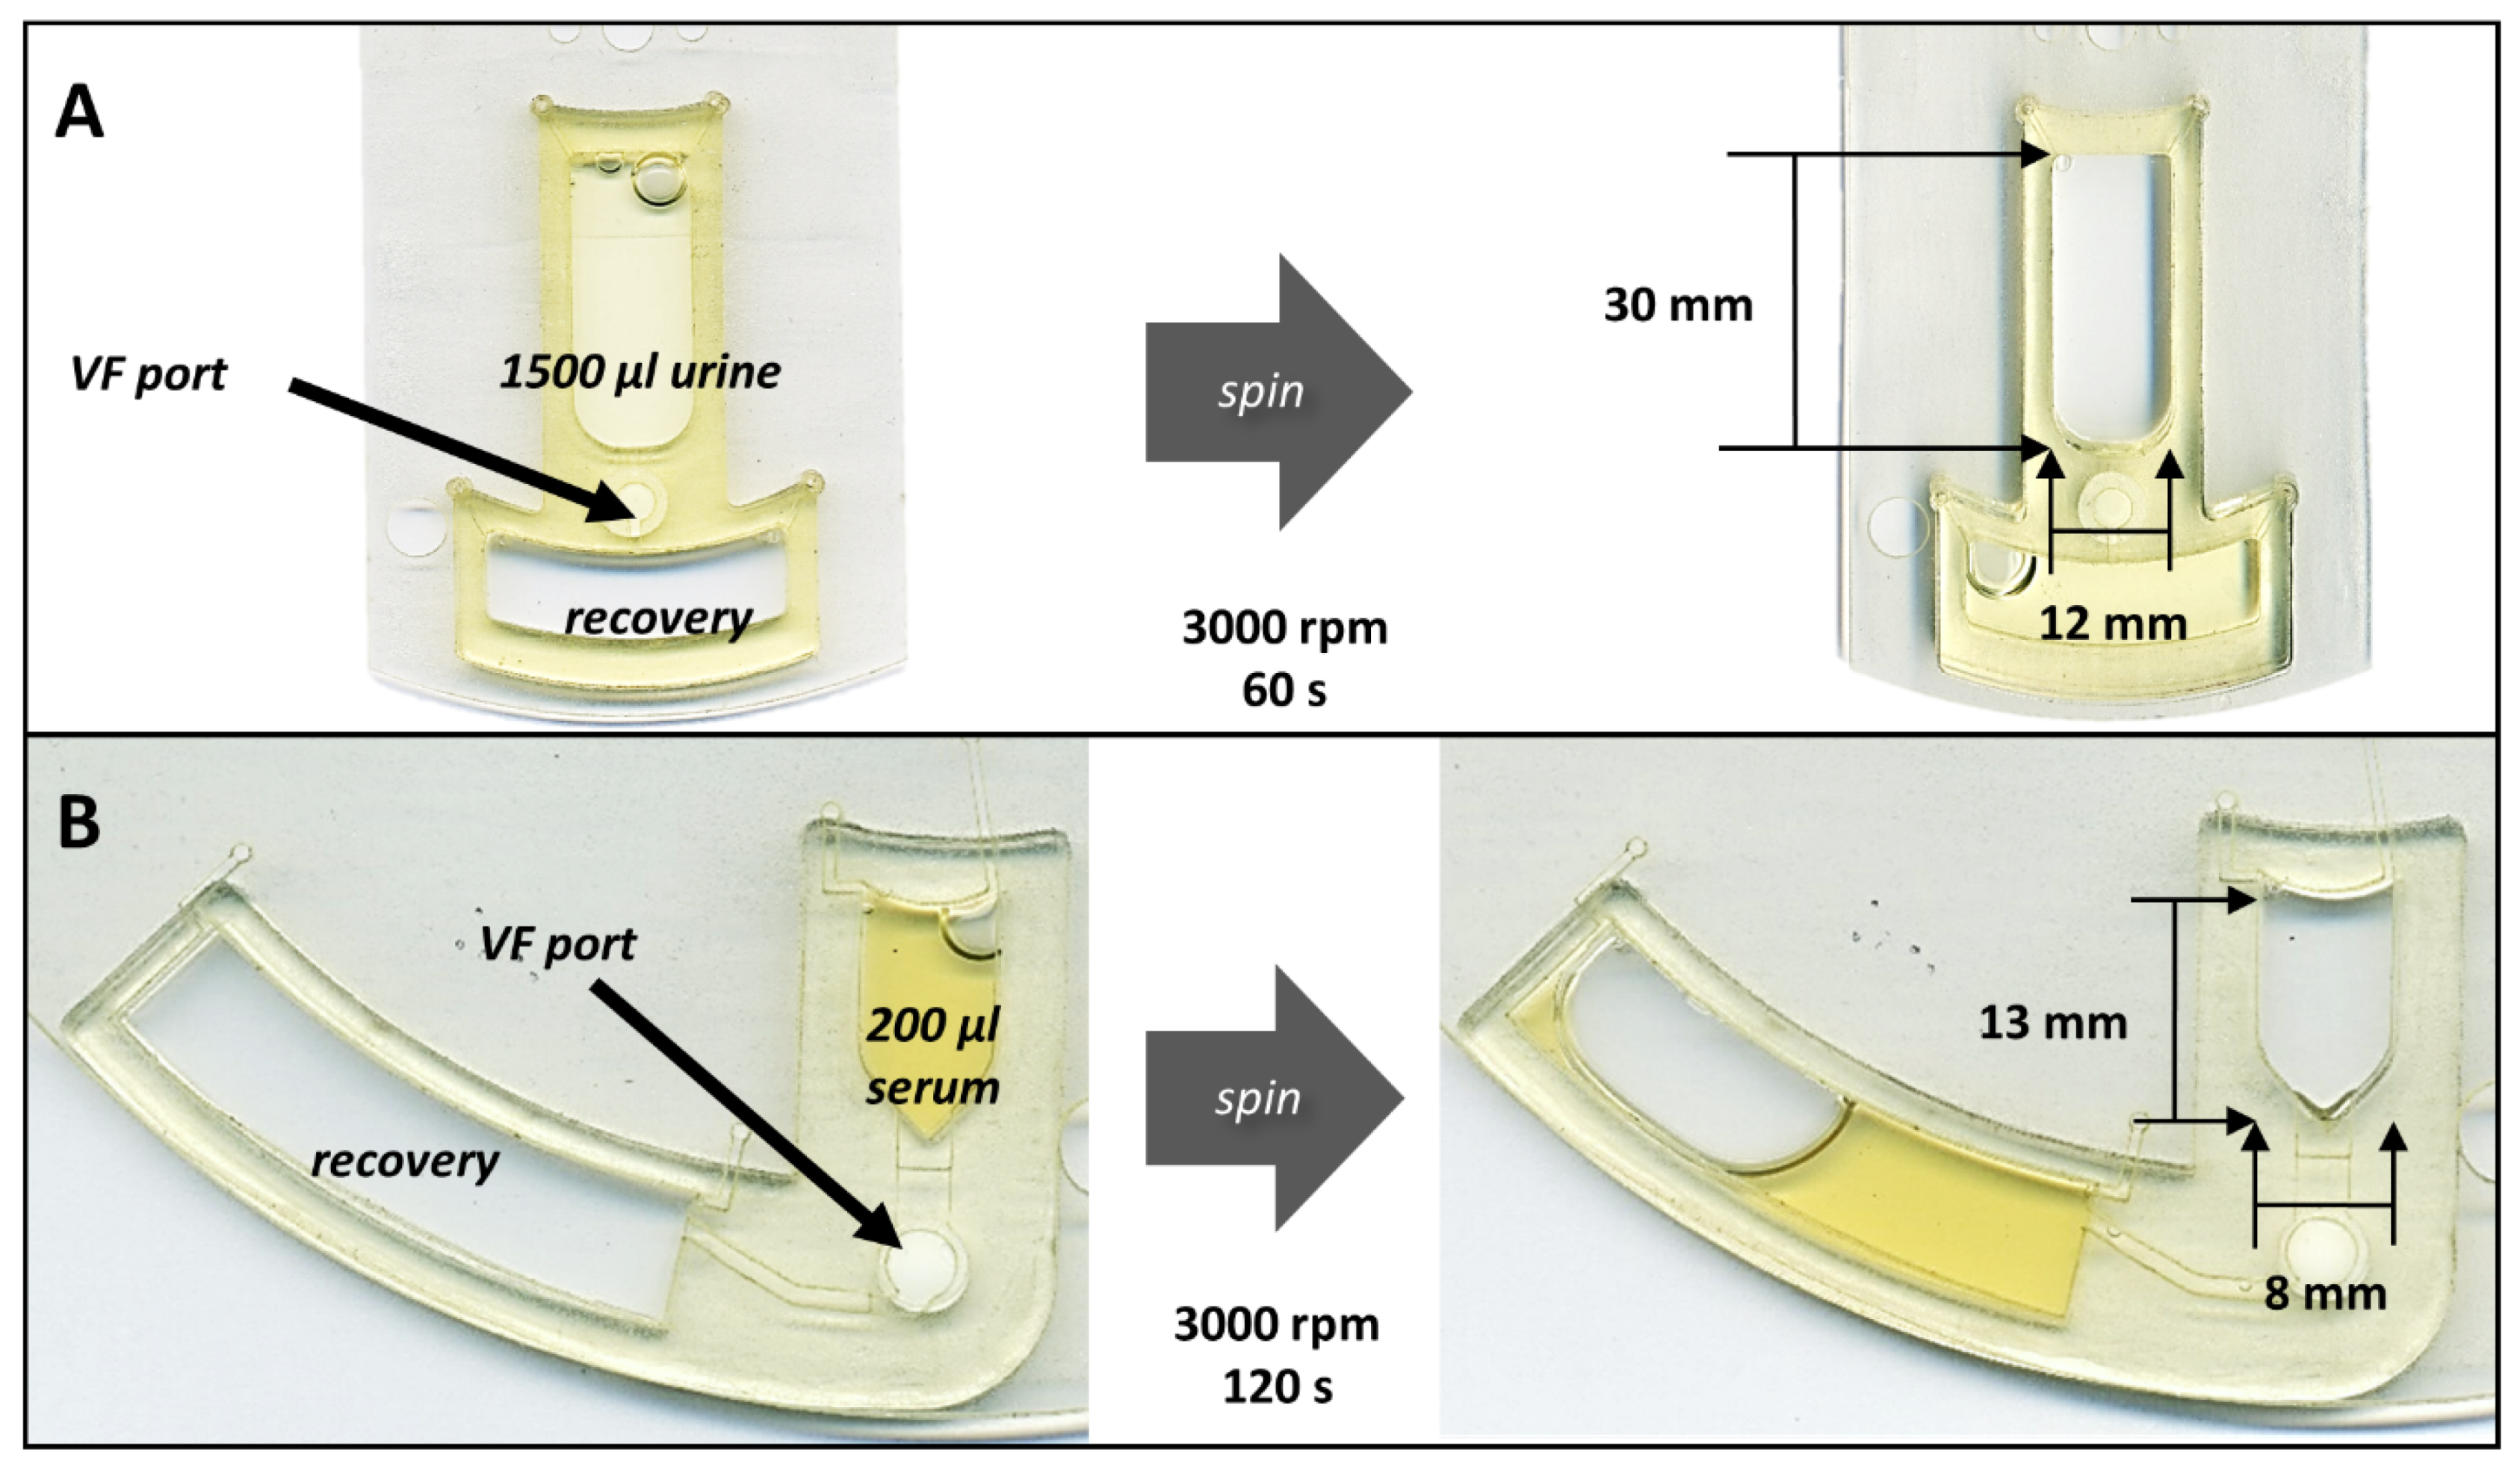
3.3. Effect of Sample Composition
4. Conclusions
Supplementary Materials
Author Contributions
Funding
Acknowledgments
Conflicts of Interest
References
- Burger, R.; Kirby, D.; Glynn, M.; Nwankire, C.; O’Sullivan, M.; Siegrist, J.; Kinahan, D.; Aguirre, G.; Kijanka, G.; Gorkin, R.A.; et al. Centrifugal microfluidics for cell analysis. Curr. Opin. Chem. Biol. 2012, 16, 409–414. [Google Scholar] [CrossRef] [PubMed]
- Maguire, I.; O’Kennedy, R.; Ducrée, J.; Regan, F. A review of centrifugal microfluidics in environmental monitoring. Anal. Methods 2018, 10, 1497–1515. [Google Scholar] [CrossRef]
- Strohmeier, O.; Keller, M.; Schwemmer, F.; Zehnle, S.; Mark, D.; von Stetten, F.; Zengerle, R.; Paust, N. Centrifugal microfluidic platforms: Advanced unit operations and applications. Chem. Soc. Rev. 2015, 44, 6187–6229. [Google Scholar] [CrossRef] [PubMed]
- Reyes, D.R.; Iossifidis, D.; Auroux, P.-A.; Manz, A. Micro total analysis systems. 1. Introduction, theory, and technology. Anal. Chem. 2002, 74, 2623–2636. [Google Scholar] [CrossRef] [PubMed]
- Manz, A.; Graber, N.; Widmer, H.á. Miniaturized total chemical analysis systems: A novel concept for chemical sensing. Sens. Actuators B Chem. 1990, 1, 244–248. [Google Scholar] [CrossRef]
- Ducrée, J.; Haeberle, S.; Lutz, S.; Pausch, S.; Von Stetten, F.; Zengerle, R. The centrifugal microfluidic Bio-Disk platform. J. Micromech. Microeng. 2007, 17, S103. [Google Scholar] [CrossRef]
- Gorkin, R.; Park, J.; Siegrist, J.; Amasia, M.; Lee, B.S.; Park, J.-M.; Kim, J.; Kim, H.; Madou, M.; Cho, Y.-K. Centrifugal microfluidics for biomedical applications. Lab Chip 2010, 10, 1758–1773. [Google Scholar] [CrossRef] [PubMed]
- Madou, M.; Zoval, J.; Jia, G.; Kido, H.; Kim, J.; Kim, N. Lab on a CD. Annu. Rev. Biomed. Eng. 2006, 8, 601–628. [Google Scholar] [CrossRef]
- Lai, S.; Wang, S.; Luo, J.; Lee, L.J.; Yang, S.-T.; Madou, M.J. Design of a compact disk-like microfluidic platform for enzyme-linked immunosorbent assay. Anal. Chem. 2004, 76, 1832–1837. [Google Scholar] [CrossRef]
- Kainz, D.M.; Früh, S.M.; Hutzenlaub, T.; Zengerle, R.; Paust, N. Flow control for lateral flow strips with centrifugal microfluidics. Lab Chip 2019, 19, 2718–2727. [Google Scholar] [CrossRef]
- Templeton, E.J.; Salin, E.D. A novel filtration method integrated on centrifugal microfluidic devices. Microfluid. Nanofluid. 2014, 17, 245–251. [Google Scholar] [CrossRef]
- Karle, M.; Wöhrle, J.; von Stetten, F.; Zengerle, R.; Mark, D. In Axial centrifugal filtration—A novel approach for rapid bacterial concentration from a large volume. In Proceedings of the 2013 Transducers & Eurosensors XXVII: The 17th International Conference on Solid-State Sensors, Actuators and Microsystems (Transducers & Eurosensors XXVII); Barcelona, Spain, 16–20 June 2013, IEEE: Piscataway Township, NJ, USA, 2013; pp. 1235–1238. [Google Scholar]
- Lenz, K.D.; Jakhar, S.; Chen, J.W.; Anderson, A.S.; Purcell, D.C.; Ishak, M.O.; Harris, J.F.; Akhadov, L.E.; Kubicek-Sutherland, J.Z.; Nath, P. A centrifugal microfluidic cross-flow filtration platform to separate serum from whole blood for the detection of amphiphilic biomarkers. Sci. Rep. 2021, 11, 5287. [Google Scholar] [CrossRef] [PubMed]
- Dignan, L.M.; Woolf, M.S.; Ross, J.A.; Baehr, C.; Holstege, C.P.; Pravetoni, M.; Landers, J.P. A Membrane-Modulated Centrifugal Microdevice for Enzyme-Linked Immunosorbent Assay-Based Detection of Illicit and Misused Drugs. Anal. Chem. 2021, 93, 16213–16221. [Google Scholar] [CrossRef] [PubMed]
- Gubala, V.; Harris, L.F.; Ricco, A.J.; Tan, M.X.; Williams, D.E. Point of care diagnostics: Status and future. Anal. Chem. 2012, 84, 487–515. [Google Scholar] [CrossRef] [PubMed]
- Jiang, N.; Ahmed, R.; Damayantharan, M.; Ünal, B.; Butt, H.; Yetisen, A.K. Lateral and Vertical Flow Assays for Point-of-Care Diagnostics. Adv. Healthc. Mater. 2019, 8, 1900244. [Google Scholar] [CrossRef] [PubMed]
- Gong, M.M.; Sinton, D. Turning the page: Advancing paper-based microfluidics for broad diagnostic application. Chem. Rev. 2017, 117, 8447–8480. [Google Scholar] [CrossRef]
- Fu, E.; Ramsey, S.A.; Kauffman, P.; Lutz, B.; Yager, P. Transport in two-dimensional paper networks. Microfluid. Nanofluid. 2011, 10, 29–35. [Google Scholar] [CrossRef]
- Washburn, E.W. The dynamics of capillary flow. Phys. Rev. 1921, 17, 273. [Google Scholar] [CrossRef]
- Posthuma-Trumpie, G.A.; Korf, J.; van Amerongen, A. Lateral flow (immuno) assay: Its strengths, weaknesses, opportunities and threats. A literature survey. Anal. Bioanal. Chem. 2009, 393, 569–582. [Google Scholar] [CrossRef]
- Joung, H.-A.; Ballard, Z.S.; Ma, A.; Tseng, D.K.; Teshome, H.; Burakowski, S.; Garner, O.B.; Carlo, D.D.; Ozcan, A. Paper-based multiplexed vertical flow assay for point-of-care testing. Lab Chip 2019, 19, 1027–1034. [Google Scholar] [CrossRef]
- Chen, P.; Gates-Hollingsworth, M.; Pandit, S.; Park, A.; Montgomery, D.; AuCoin, D.; Gu, J.; Zenhausern, F. Paper-based Vertical Flow Immunoassay (VFI) for detection of bio-threat pathogens. Talanta 2019, 191, 81–88. [Google Scholar] [CrossRef] [PubMed]
- Quesada-González, D.; Merkoçi, A. Nanoparticle-based lateral flow biosensors. Biosens. Bioelectron. 2015, 73, 47–63. [Google Scholar] [CrossRef]
- Anderson, N.G. The development of automated systems for clinical and research use. Clin. Chim. Acta 1969, 25, 321–330. [Google Scholar] [CrossRef]
- Thompson, B.L.; Ouyang, Y.; Duarte, G.R.; Carrilho, E.; Krauss, S.T.; Landers, J.P. Inexpensive, rapid prototyping of microfluidic devices using overhead transparencies and a laser print, cut and laminate fabrication method. Nat. Protoc. 2015, 10, 875–886. [Google Scholar] [CrossRef] [PubMed]
- Birch, C.; DuVall, J.A.; Le Roux, D.; Thompson, B.L.; Tsuei, A.-C.; Li, J.; Nelson, D.A.; Mills, D.L.; Landers, J.P.; Root, B.E. Rapid Fabrication of Electrophoretic Microfluidic Devices from Polyester, Adhesives and Gold Leaf. Micromachines 2017, 8, 17. [Google Scholar] [CrossRef]
- Gorkin III, R.; Nwankire, C.E.; Gaughran, J.; Zhang, X.; Donohoe, G.G.; Rook, M.; O’Kennedy, R.; Ducrée, J. Centrifugo-pneumatic valving utilizing dissolvable films. Lab Chip 2012, 12, 2894–2902. [Google Scholar] [CrossRef] [PubMed]
- Garcia-Cordero, J.L.; Kurzbuch, D.; Benito-Lopez, F.; Diamond, D.; Lee, L.P.; Ricco, A.J. Optically addressable single-use microfluidic valves by laser printer lithography. Lab Chip 2010, 10, 2680–2687. [Google Scholar] [CrossRef] [PubMed]
- García-Payo, M.d.C.; Izquierdo-Gil, M.A.; Fernández-Pineda, C. Wetting study of hydrophobic membranes via liquid entry pressure measurements with aqueous alcohol solutions. J. Colloid Interface Sci. 2000, 230, 420–431. [Google Scholar] [CrossRef] [PubMed]
- Liu, L.; Qiu, C.; Chen, Q.; Zhang, S. Corrosion behavior of Zr-based bulk metallic glasses in different artificial body fluids. J. Alloy. Compd. 2006, 425, 268–273. [Google Scholar] [CrossRef]
- Liu, L.; Shou, L.; Yu, H.; Yao, J. Mechanical properties and corrosion resistance of vulcanized silicone rubber after exposure to artificial urine. J. Macromol. Sci. Part B 2015, 54, 962–974. [Google Scholar] [CrossRef]
- Pietrzyńska, M.; Voelkel, A. Stability of simulated body fluids such as blood plasma, artificial urine and artificial saliva. Microchem. J. 2017, 134, 197–201. [Google Scholar] [CrossRef]
- R Core Team. R: A Language and Environment for Statistical Computing, R version 3.5.1 (2018-07-02) “Feather Spray”; R Foundation for Statistical Computing: Vienna, Austria, 2018. [Google Scholar]
- R Studio Team. R Studio: Integrated Development for R; RStudio v.1.1.456; RStudio, Inc.: Boston, MA, USA, 2018. [Google Scholar]
- Wickham, H. ggplot2: Elegant Graphics for Data Analysis; Springer: Berlin/Heidelberg, Germany, 2016. [Google Scholar]
- Liu, M.; Wu, J.; Gan, Y.; Hanaor, D.A.H.; Chen, C.Q. Evaporation Limited Radial Capillary Penetration in Porous Media. Langmuir 2016, 32, 9899–9904. [Google Scholar] [CrossRef] [PubMed]
- Liu, M.; Wu, J.; Gan, Y.; Hanaor, D.A.H.; Chen, C.Q. Tuning capillary penetration in porous media: Combining geometrical and evaporation effects. Int. J. Heat Mass Transf. 2018, 123, 239–250. [Google Scholar] [CrossRef]
- Danino, D.; Marmur, A. Radial Capillary Penetration into Paper: Limited and Unlimited Liquid Reservoirs. J. Colloid Interface Sci. 1994, 166, 245–250. [Google Scholar] [CrossRef]
- Palakurthi, N.K.; Konangi, S.; Ghia, U.; Comer, K. Micro-scale simulation of unidirectional capillary transport of wetting liquid through 3D fibrous porous media: Estimation of effective pore radii. Int. J. Multiph. Flow 2015, 77, 48–57. [Google Scholar] [CrossRef]
- Lim, H.; Jafry, A.T.; Lee, J. Fabrication, flow control, and applications of microfluidic paper-based analytical devices. Molecules 2019, 24, 2869. [Google Scholar] [CrossRef]
- Zaccardi, Y.V.; Alderete, N.; De Belie, N. Lucas-Washburn vs Richards equation for the modelling of water absorption in cementitious materials. In Proceedings of the MATEC Web of Conferences, Cape Town, South Africa, 19–21 November 2018; EDP Sciences: Les Ulis, France, 2018; p. 02019. [Google Scholar]
- Kim, B.-S.; Harriott, P. Critical entry pressure for liquids in hydrophobic membranes. J. Colloid Interface Sci. 1987, 115, 1–8. [Google Scholar] [CrossRef]
- Yegge, J.F. APPARATUS FOR TEACHING PHYSICS: A Buret Model of Exponential Decay. Phys. Teach. 1968, 6, 41. [Google Scholar] [CrossRef]
- Sun, S.; Feng, S.; Ji, C.; Shi, M.; He, X.; Xu, F.; Lu, T.J. Microstructural effects on permeability of Nitrocellulose membranes for biomedical applications. J. Membr. Sci. 2020, 595, 117502. [Google Scholar] [CrossRef]
- Pierce, H.F. Nitrocellulose membranes of graded permeability. J. Biol. Chem. 1927, 75, 795–815. [Google Scholar] [CrossRef]
- Jensen, K.H.; Valente, A.X.; Stone, H.A. Flow rate through microfilters: Influence of the pore size distribution, hydrodynamic interactions, wall slip, and inertia. Phys. Fluids 2014, 26, 052004. [Google Scholar] [CrossRef]
- Nimmo, J.R. Porosity and pore size distribution. Encycl. Soils Environ. 2004, 3, 295–303. [Google Scholar]
- Liu, R.; Jiang, Y.; Li, B.; Yu, L. Estimating permeability of porous media based on modified Hagen–Poiseuille flow in tortuous capillaries with variable lengths. Microfluid. Nanofluid. 2016, 20, 120. [Google Scholar] [CrossRef]
- Gugliuzza, A. Membrane Swelling. In Encyclopedia of Membranes; Drioli, E., Giorno, L., Eds.; Springer: Berlin/Heidelberg, Germany, 2016; pp. 1251–1252. [Google Scholar]
- Gugliuzza, A. Solvent Swollen Polymer. In Encyclopedia of Membranes; Drioli, E., Giorno, L., Eds.; Springer: Berlin/Heidelberg, Germany, 2016; pp. 1801–1802. [Google Scholar]
- Geise, G.M.; Freeman, B.D.; Paul, D.R. Sodium chloride diffusion in sulfonated polymers for membrane applications. J. Membr. Sci. 2013, 427, 186–196. [Google Scholar] [CrossRef]
- Geise, G.M.; Paul, D.R.; Freeman, B.D. Fundamental water and salt transport properties of polymeric materials. Prog. Polym. Sci. 2014, 39, 1–42. [Google Scholar] [CrossRef]
- Khare, A.R.; Peppas, N. Swelling/deswelling of anionic copolymer gels. Biomaterials 1995, 16, 559–567. [Google Scholar] [CrossRef]
- Geise, G.M.; Hickner, M.A.; Logan, B.E. Ammonium bicarbonate transport in anion exchange membranes for salinity gradient energy. ACS Macro Lett. 2013, 2, 814–817. [Google Scholar] [CrossRef]
- Liu, L.; Wang, T.; Liu, C.; Lin, K.; Ding, Y.; Liu, G.; Zhang, G. Mechanistic insights into amplification of specific ion effect in water–nonaqueous solvent mixtures. J. Phys. Chem. B 2013, 117, 2535–2544. [Google Scholar] [CrossRef]
- Glavatskiy, K.; Bhatia, S.K. Effect of pore size on the interfacial resistance of a porous membrane. J. Membr. Sci. 2017, 524, 738–745. [Google Scholar] [CrossRef]
- Boomsma, K.; Poulikakos, D. The effects of compression and pore size variations on the liquid flow characteristics in metal foams. J. Fluids Eng. 2002, 124, 263–272. [Google Scholar] [CrossRef]


Publisher’s Note: MDPI stays neutral with regard to jurisdictional claims in published maps and institutional affiliations. |
© 2022 by the authors. Licensee MDPI, Basel, Switzerland. This article is an open access article distributed under the terms and conditions of the Creative Commons Attribution (CC BY) license (https://creativecommons.org/licenses/by/4.0/).
Share and Cite
Woolf, M.S.; Dignan, L.M.; Karas, S.M.; Lewis, H.M.; Hadley, K.C.; Nauman, A.Q.; Gates-Hollingsworth, M.A.; AuCoin, D.P.; Green, H.R.; Geise, G.M.; et al. Characterization of a Centrifugal Microfluidic Orthogonal Flow Platform. Micromachines 2022, 13, 487. https://doi.org/10.3390/mi13030487
Woolf MS, Dignan LM, Karas SM, Lewis HM, Hadley KC, Nauman AQ, Gates-Hollingsworth MA, AuCoin DP, Green HR, Geise GM, et al. Characterization of a Centrifugal Microfluidic Orthogonal Flow Platform. Micromachines. 2022; 13(3):487. https://doi.org/10.3390/mi13030487
Chicago/Turabian StyleWoolf, Michael Shane, Leah M. Dignan, Scott M. Karas, Hannah M. Lewis, Kevyn C. Hadley, Aeren Q. Nauman, Marcellene A. Gates-Hollingsworth, David P. AuCoin, Heather R. Green, Geoffrey M. Geise, and et al. 2022. "Characterization of a Centrifugal Microfluidic Orthogonal Flow Platform" Micromachines 13, no. 3: 487. https://doi.org/10.3390/mi13030487
APA StyleWoolf, M. S., Dignan, L. M., Karas, S. M., Lewis, H. M., Hadley, K. C., Nauman, A. Q., Gates-Hollingsworth, M. A., AuCoin, D. P., Green, H. R., Geise, G. M., & Landers, J. P. (2022). Characterization of a Centrifugal Microfluidic Orthogonal Flow Platform. Micromachines, 13(3), 487. https://doi.org/10.3390/mi13030487