Abstract
The quantitative characterization of tactile perception, which is crucial in the design of tactile devices, requires the tested samples to have individually and precisely controlled properties associated with the senses. In this work, we microfabricated such tactile samples and then quantitatively characterized tactile perception with a focus on roughness and dryness. In the roughness perception experiments, the tactile samples had a stripe pattern with ridge and groove widths that were individually controlled. The experimental results revealed that the feeling of roughness was more dominated by the width of the groove than that of the ridge and that conventionally used roughness parameters such as and were not sufficient for predicting roughness perception. In the dryness perception experiments, the tactile samples had a micropattern formed by dry etching and an array of squares. The experimental results revealed that dry perception had different properties when the feature sizes were below and above 30 µm, which may have been due to the effect of adhesion on friction. The proposed tactile samples were suitable for the quantitative and precise characterization of tactile perception.
1. Introduction
The tactile perception of surface textures has been studied by many research groups. It is categorized into several psychological tactile dimensions, namely roughness (rough/smooth), stiffness (hard/soft), moisture (moist/dry), friction (sticky/slippery), and warmness (warm/cold) [1,2]. In studies, participants are requested to touch a surface texture and report their feeling using methods such as the semantic differential method, the paired comparison method, and the rating method [3,4]. The results are statistically analyzed with respect to the physical properties of the surface textures. One challenge in such studies is that the physical properties of the textures are difficult to independently control. For example, in our prior study, we used 18 test samples that included wood, polystyrene form A, polystyrene form B, urethane, lumpy rubber, and flat rubber [5,6]. Each sample had different surface properties with respect to parameters such as geometry, roughness, stiffness, friction coefficient, surface energy, and thermal conductivity. To correlate the tactile perception to the individual physical properties, the test samples should have identical properties except for the physical property of interest. For example, when evaluating stiffness, it is preferable to test samples that have different stiffness values but are otherwise identical. Micromanufacturing technologies can be used to develop such tactile samples. For example, photolithography or machining can be used to prepare surfaces with textures on the micrometer to millimeter scale for a given material. An identical surface geometry can be patterned onto different materials using micromolding, photolithography, or machining. Various tactile samples have been reported in the literature, including 3D-printed textures with cone-shaped textons [7], metal samples patterned with picosecond laser pulses [8], photolithographically micromanufactured silicon [9] and polymer samples [10], and stretchable tactile samples with micropatterned features that can be varied [11].
In this study, using tactile samples, we quantitatively characterized the perceptions of roughness and dryness of surface textures and correlated the results with the physical properties of the surfaces. For the roughness perception experiments, we prepared tactile samples with a stripe pattern with ridge and groove widths that were independently controlled. The effect of the pattern dimensions on perception was experimentally characterized. For the dryness perception experiments, we prepared surfaces with a random pattern or a square pattern. Using tactile samples, we experimentally determined the most dominant parameter that affected dryness. The perception experiments were approved by the Research Ethics Committee of the Faculty of Science and Technology, Keio University (31-52).
2. Tactile Samples and Methods
2.1. Ranking Method
In this work, the ranking method was used to investigate the relationship between the surface properties and tactile perception. First, we prepared the tactile samples with surface textures that were precisely controlled by microfabrication. Then, the participants were requested to rank the samples with respect to the tactile perception of interest such as roughness or dryness. The null hypothesis was the independence of the rankings given by the participants. If the null hypothesis was rejected, we could conclude that the tactile perception was affected by the textures.
Kendall’s coefficient of concordance was obtained using the following equations [12]:
where and are the numbers of participants and samples, respectively, and .
The null hypothesis was the independence of the rankings given by the participants. A chi-square test was conducted.
was compared with at the degree of freedom of and the significance level . When and , .
2.2. Roughness Perception Experiments
2.2.1. Tactile Samples for Roughness Perception Experiments
Roughness perception is classified into macroroughness and microroughness perception [13] based on the responsible tactile receptors. Macroroughness, for which the corresponding surface pattern is greater than several hundreds of micrometers, is perceived via Merkel’s disks [14,15,16]. Microroughness, for which the corresponding surface pattern is smaller than 1 mm, is perceived via Meissner corpuscles and Pacinian corpuscles [17,18,19]. Surface-texture patterns ranging from 0.1 to 1 mm are considered to have the properties of both macro- and microroughness and are thus of great interest in roughness perception studies.
To prepare our samples, a negative photoresist (SU-8 3050, Kayaku Advanced Materials, Westborough, MA, USA) was patterned onto a glass substrate. The thickness of the SU-8 was 50 µm, which was sufficient for perception. Stripe patterns with a ridge width and a groove width were patterned using photolithography (see Figure 1). In this work, the effects of and on roughness perception were investigated. Tactile samples with varying from 0.1 to 1 mm in 0.1 mm steps and fixed at 0.5 mm (-constant samples) and those varying from 0.1 to 1 mm in 0.1 mm steps and fixed at 0.5 mm (-constant samples) were prepared.
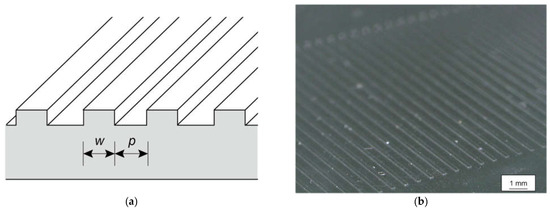
Figure 1.
Tactile samples used for roughness perception experiments. (a) Cross-sectional schematic where and are the ridge and groove widths, respectively. The ridge height was 50 µm. (b) Microscopy image of sample texture.
2.2.2. Roughness Perception Experiments with Tactile Samples
The effects of surface textures, the ridge width , and the groove width were experimentally investigated; and were precisely controlled. The ranking methods were conducted with 10 -constant samples and 10 -constant samples using 11 participants (10 males and 1 female, aged 20 to 29 years). The participants were requested to not look at the tactile samples during the tests. The participants ranked the 10 samples from 1 (least rough) to 10 (most rough).
Next, in order to investigate which parameter was more dominant ( or ), 10 samples composed of 5 -constant ((, ) = (0.2, 0.5), (0.4, 0.5), (0.6, 0.5), (0.8, 0.5), and (1.0, 0.5)) and 5 -constant samples ((, ) = (0.5, 0.2), (0.5, 0.4), (0.5, 0.6), (0.5, 0.8), and (0.5, 1.0)) were ranked by 5 participants (5 males, aged 20 to 29 years). The participants conducted the ranking experiments with the 10 samples twice.
2.3. Dry/Wet Perception Experiments
2.3.1. Tactile Samples for Dry/Wet Perception Experiments
Two types of tactile samples were prepared, namely those with random and square patterns. The samples with a random pattern were composed of polydimethyl siloxane (PDMS). The surface patterns were formed using dry etching with CF4 and O2 plasma [20,21]. The PDMS was prepared with a mixing ratio of the base to the curing agent of 10 (SYLGARD 184 W/C, DOW CORNING TORAY Co., Tokyo, Japan). The dry etching was conducted using an etcher (FA-1, Samco Inc., Kyoto, Japan) with a radio frequency power of 150 W and a flow rate ratio of CF4 to O2 of 3 to 1 at a chamber pressure of 0.1 MPa. The etching time was varied from 10 to 300 min. The surface roughness was measured with a laser microscope (VK-X100, Keyence Co. Ltd., Osaka, Japan). Figure 2 shows photographs of the samples treated with dry etching for 30, 60, 120, and 240 min.
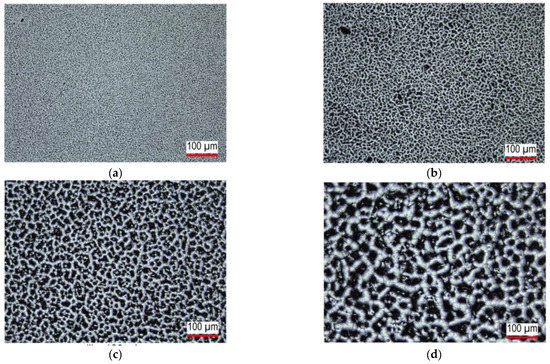
Figure 2.
Tactile samples with random patterns for dry perception experiment. Samples treated with dry etching for (a) 30, (b) 60, (c) 120, and (d) 240 min.
The square pattern was formed with a negative photoresist (SU-8 3005, Kayaku Advanced Materials, Inc., Westborough, MA, USA). The width of the square and the pitch or the gap between squares were varied from 10 to 15 µm in steps of 5 µm. When , the ratio of the top surface to the etched surface was constant.
2.3.2. Dry/Wet Perception Experiments Using Tactile Samples with Random Patterns
The ranking method was conducted to investigate the effects of surface roughness on dry/wet perception using the tactile samples with a random pattern. A total of 9 participants (8 males and 1 female, aged 20 to 29 years) ranked the samples.
2.3.3. Dry/Wet Perception Experiments Using Tactile Samples with Square Patterns
In order to investigate the effects of the surface textures on dry/wet perception, the ranking method was conducted using samples with the same and with respect to the dry feeling. A total of 14 participants (12 males and 2 females, aged 20 to 29 years) ranked the samples. As will be described later, two different trends were found for the feature sizes below and above 30 µm.
To investigate this trend, samples with a width of 15 or 25 µm (below 30 µm) were compared in terms of a dry feeling while was varied from 10 to 50 µm. Samples with a value of 40 or 50 µm (above 30 µm) were then compared. The number of participants was 7 (all males, aged 20 to 29 years). Each participant conducted the comparison twice per condition.
Finally, the effect of the pitch was investigated for samples with a value of 15, 25, 40, or 50 µm while was 5, 10, 15, 20, 25, 30, 35, 40, 45, or 50 µm. The number of participants was 10 (9 males and 1 female, aged 20 to 29 years).

Table 1.
Summary of the experiments.
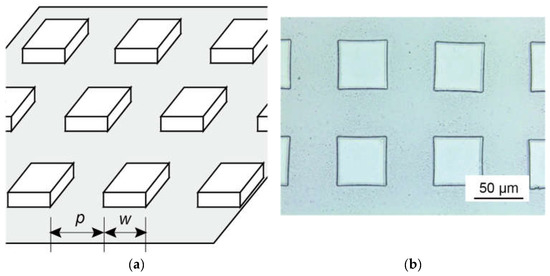
Figure 3.
Tactile samples with square pattern for dry perception experiment: (a) diagram of pattern, where is the square width and is the gap between squares; (b) microscopy image of sample.
Table 1.
Summary of the experiments.
| Tactile Perception | Texture of Tactile Samples | Parameters | Objectives: To Investigate | Number of Participants | Results |
|---|---|---|---|---|---|
| Roughness | Stripe (Figure 1) | Ridge and groove widths | The effects of the ridge and groove widths | 11 (10 males and 1 female, aged 20 to 29 years) | Section 3.1 |
| Which of the ridge and the groove widths was more dominant | 5 (5 males, aged 20 to 29 years) | Section 3.1 | |||
| Dryness | Random (Figure 2) | Etching time/roughness | The effects of the surface roughness | 9 (8 males and 1 female, aged 20 to 29 years) | Section 3.2.1 |
| Square (Figure 3) | Square width and gap between the squares () | The effects of the feature size | 14 (12 males and 2 females, aged 20 to 29 years) | Section 3.2.2 | |
| Square width and gap between the squares | How the dryness perception varied with the feature size below and above 30 µm | 7 (7 males, aged 20 to 29 years) | Section 3.2.2 | ||
| The effects of the gap | 10 (9 males and 1 female, aged 20 to 29 years) | Section 3.2.2 |
3. Results and Discussion
3.1. Roughness Perception Experiments
Figure 4a–c shows the ranking for the 10 -constant samples, 10 -constant samples, and a mix of - and -constant samples, respectively. The relationship shown in Figure 4a was opposite to that shown in Figure 4b.
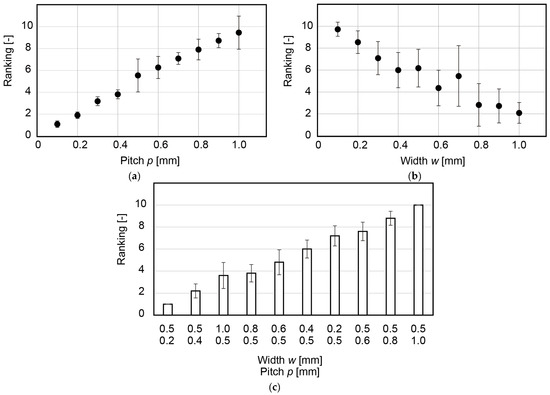
Figure 4.
Ranking of roughness feeling for (a) -constant samples, (b) -constant samples, and (c) mix of - and -constant samples.
For the -constant samples, and . For the -constant samples, and . Therefore, for both cases, the rankings were concordant.
Figure 4c shows that a larger pitch led to a larger roughness feeling and that was more dominant over . For this mix of samples, and . This result showed that for a stripe pattern with a width and a pitch from 0.1 to 1.0 mm, the gap was the dominant factor that affected the feeling of roughness.
3.2. Dry/Wet Perception Experiments
3.2.1. Experiments with Tactile Samples with Random Patterns
The ranking method was conducted for 15 samples. The dry feeling increased with the sample etching time, as shown in Figure 5. The concordance of the ranking was confirmed via chi-square tests, where .
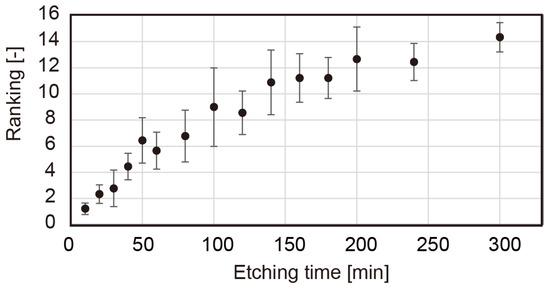
Figure 5.
Ranking of dry perception for various etching times.
Since the roughness increased with the sample etching time, a correlation between the dry feeling and was obtained (see Figure 6a,b). However, as discussed in Section 3.3, did not identify the surface geometry, which had to be carefully investigated using tactile samples.
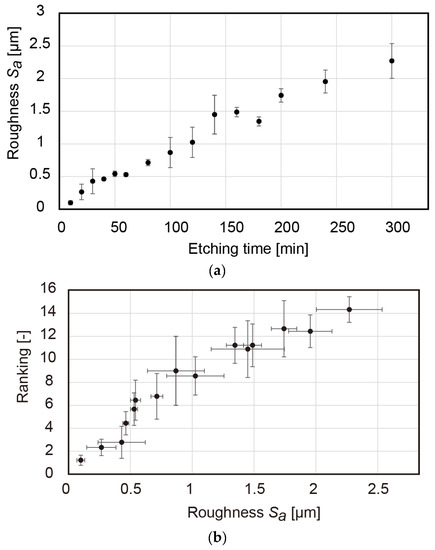
Figure 6.
(a) Increase in arithmetic mean height with sample etching time; (b) ranking of dry perception as function of .
3.2.2. Experiments with Tactile Samples with Square Patterns
Figure 7 shows the ranking of the dry tactile feeling for samples with an equal square width and gap . For these samples, and the statistical concordance was validated. Interestingly, two trends were observed: one for and the other for , with a transition at . When , the dry tactile feeling increased with . However, when , did not affect the dry tactile feeling. For the four samples with , and no statistically significant difference was found. This result implied that the perception mechanism of the dry/wet feeling was different when the surface features were larger or smaller than 30 µm.
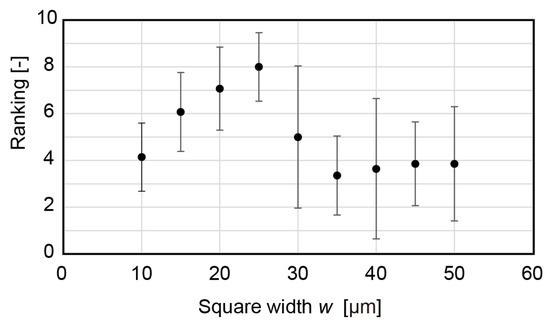
Figure 7.
Ranking of dry perception for various square patterns.
Next, samples with values of 15 and 25 µm and 40 and 50 µm were compared for pitches of 10, 20, 30, 40, and 50 µm. Seven participants (seven males, aged 20 to 29 years) conducted the perception tests twice (the number of trials was ). When 11 or more trials showed the same results, the test was statistically significant at a significance level of 0.05. Table 2 shows the comparison results for samples with values of 15 and 25 µm. In the table, “+” indicates that a line ( produced a drier feeling than a row () and that this difference was statistically significant; N.S. means not significant; and “− “ indicates that the line produced a less dry feeling than the row. The results suggested that a larger resulted in a drier feeling.
Table 2.
Statistical significance in dryness perception between samples with values of 15 and 25 µm. N.S. means not significant.
Table 3 shows the comparison results for samples with values of 40 and 50 µm. The dry feeling depended on the pitch . However, a trend different from that above was found. For samples with a given value, values of 15 and 25 µm did not produce a statistically significant difference. For samples with values of 40 and 50 µm, significant differences were found when was 30, 40, and 50 µm. Of note, a value of 40 µm produced a rougher feeling than did a value of 50 µm, as summarized in Table 4. This different trend may have originated from the perception properties shown in Figure 7.
Table 3.
Statistical significance in dry perception between samples with values of 40 and 50 µm. N.S. means not significant.
Table 4.
Number of trials in which participants perceived that samples with a value of 25 µm were rougher than those with a value of 15 µm and that those with a value of 50 µm were rougher than those with a value of 40 µm for various values. * Significance level < 0.05.
The dry feeling was investigated for samples with a given value. Figure 8a–d show the results for values of 15, 25, 40, and 45 µm, respectively, for various pitch values. A total of 10 participants (9 males and 1 female, aged 20 to 29 years) conducted the ranking experiments. For these samples, ; , ,, and , respectively, and for the cases; and . A drier feeling was produced with an increasing pitch .
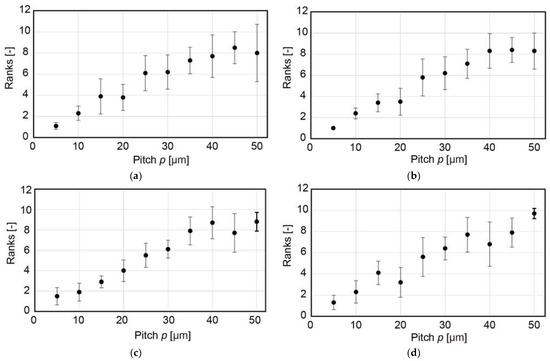
Figure 8.
Ranking of dry perception for values of (a) 15, (b) 25, (c) 40, and (d) 45 µm for various pitch values.
When the rankings of samples with values of 35, 40, 45, and 50 µm were extracted, , 4.2,, and for values of 15, 25, 40, and 45 µm, respectively; and . Except for the case with a value of 50 µm, no statistically significant difference in the rankings was found. This result was consistent with that shown in Figure 7 and agreed with the idea that the perception mechanism of the dry/wet feeling was different between feature sizes below and above 30 µm.
3.3. Discussion
3.3.1. Roughness Feeling
The roughness feeling increased with the width and decreased with the pitch . Surface roughness is conventionally evaluated using the arithmetic mean height , the root mean square roughness , or both. These parameters are respectively expressed as:
where is the sampling length and is the height from the average at position . For a surface with a striped pattern with a width and a pitch , and in the direction perpendicular to the stripe pattern can be expressed as:
where is the height of the stripe pattern. Using these equations, the width and the pitch had the same contribution to the conventional surface roughness parameters and . Conventionally, a roughness feeling is considered to increase with the surface roughness, which is conventionally assessed using , , or both [22]. However, our experiments with micromanufactured tactile samples revealed that the width and the pitch had opposite contributions to the roughness feeling compared with those for a surface with a stripe pattern. This result agreed with previously reported results [14]. Therefore, an assessment of the surface roughness using only and is insufficient for tactile perception experiments. The bearing ratio, which describes the area of the surface above a given depth, was proposed as a measure for determining the contact state in a bonding process [23]. In our case, when the bearing depth was smaller than the depth of the features, the bearing ratio () could be expressed as:
is a function of (; it monotonically decreases with (). Therefore, increases with and decreases with , which agrees with the obtained results, as shown in Figure 4. was considered to represent the contact and hence it was reasonable that had a good correlation with roughness perception. This relation will be further investigated in our future work.
For the - and -constant samples, we investigated the statistical significance of the differences among all ranks. The significance level was 0.05. For the -constant samples, no statistically significant differences were found between the samples with values of 0.9 and 1.0 mm, as shown in Table 5. For the -constant samples, no statistically significant differences were found between the samples with values of 0.5 and 0.6, 0.6 and 0.7, 0.7 and 0.8, 0.8 and 0.9, 0.8 and 1.0, and 0.9 and 1.0, as summarized in Table 6. We found that the statistical significance tended to be lost when the ratio of the two variables, called the Weber ratio, was small. For the -constant samples, no statistically significant differences were found when the ratio was 0.11 or smaller. For the -constant samples, no statistically significant differences were found when the ratio was less than 0.25.
Table 5.
Statistical significance in roughness perception for -constant samples with various values. * Significance level < 0.05. N.S. means not significant.
Table 6.
Statistical significance in roughness perception for -constant samples with various values. * Significance level < 0.05. N.S. means not significant.
3.3.2. Dry/Wet Feeling
The dry feeling increased with surface roughness for samples with a random pattern. As for the roughness feeling, the properties of the surface roughness were carefully investigated using tactile samples with a square pattern. We found that the perception characteristics changed at a feature size threshold of 30 µm. For dynamic touch, it has been reported that the roughness, friction, and stickiness sensations play important roles in wetness perception [24]. A previous study reported that the dry/wet feeling had the same dimension as that of friction [25]. Experiments with molded samples that had triangular grooves revealed that the coefficient of friction was small when the pitch of the surface features was in the range of 40–120 µm and that a non-textured surface and a surface with smaller features had a large coefficient of friction due to adhesion [26]. This explains the perception characteristics observed in our experiments well.
We found experimentally that the pitch contributed more to the dry feeling than did the width, which agreed with the results for the roughness feeling. As shown in Table 7, Table 8, Table 9 and Table 10, statistically significant differences were found when the ratios of the change in the pitches was greater than 0.33, 0.33, 0.21, and 0.16 with values of 15, 25, 40, and 50 µm, respectively.
Table 7.
Statistical significance in dryness perception for samples with a value of 15 µm for various values. * Significance level < 0.05. N.S. means not significant.
Table 8.
Statistical significance in dryness perception for samples with a value of 25 µm for various values. * Significance level < 0.05. N.S. means not significant.
Table 9.
Statistical significance in dryness perception for samples with a value of 40 µm for various values. * Significance level < 0.05. N.S. means not significant.
Table 10.
Statistical significance in dryness perception for samples with a value of 50 µm for various values. * Significance level < 0.05. N.S. means not significant.
4. Conclusions
In this study, we micromanufactured tactile samples with surface features that were precisely controlled. The tactile samples with a stripe pattern revealed that the conventionally used surface roughness parameters, namely and , did not always represent the roughness feeling. The roughness perception increased with the gap width and decreased with the ridge width, where the gap width was dominant over the ridge width. Dry perception was found to have a threshold of 30 µm in terms of feature size, below and above which perception showed a different trend. This was considered to be due to the adhesive friction that occurred when the feature size was below 30 µm. These findings were obtained in experiments using precisely micromanufactured tactile samples.
Author Contributions
Conceptualization, K.Y. and N.M.; methodology, K.Y. and N.M.; software, K.Y.; validation, K.Y. and N.M.; formal analysis, K.Y. and N.M.; investigation, K.Y.; resources, N.M.; data curation, N.M.; writing—original draft preparation, K.Y.; writing—review and editing, N.M.; visualization, N.M.; supervision, N.M.; project administration, N.M.; funding acquisition, N.M. All authors have read and agreed to the published version of the manuscript.
Funding
This work was supported by a Grant-in-Aid for Scientific Research on Innovative Areas (Grant Number 18H05013), JSPS KAKENHI (Grant Number 20H02121), and JST CREST (Grant Number JPMJCR19A2), Japan.
Institutional Review Board Statement
The study was conducted in accordance with the Declaration of Helsinki and approved by the Research Ethics Committee of the Faculty of Science and Technology, Keio University (31-52, 28 February 2020).
Informed Consent Statement
Informed consent was obtained from all subjects involved in the study.
Data Availability Statement
The data presented in this study are openly available in FigShare at doi: 10.6084/m9.figshare.21071137.
Conflicts of Interest
The authors declare no conflict of interest.
References
- Okamoto, S.; Nagano, H.; Yamada, Y. Psychophysical dimensions of tactile perception of textures. IEEE Trans. Hapt. 2013, 6, 81–93. [Google Scholar] [CrossRef] [PubMed]
- Tachi, S. Telexistence: Enabling humans to be virtually ubiquitous. IEEE Comput. Graph. Appl. 2016, 36, 8–14. [Google Scholar] [CrossRef]
- Tanaka, M.; Numazawa, Y. Rating and valuation of human haptic sensation. Int. J. Appl. Electromagn. Mech. 2004, 19, 573–579. [Google Scholar] [CrossRef]
- Tang, W.; Chen, N.; Zhang, J.; Chen, S.; Ge, S.; Zhu, H.; Zhang, S.; Yang, H. Characterization of tactile perception and optimal exploration movement. Tribol. Lett. 2015, 58, 28. [Google Scholar] [CrossRef]
- Kosemura, Y.; Ishikawa, H.; Watanabe, J.; Miki, N. Characterization of surfaces virtually created using MEMS tactile display. Jpn. J. Appl. Phys. 2014, 53, 6–11. [Google Scholar] [CrossRef]
- Kosemura, Y.; Hasegawa, S.; Miki, N. Surface properties that can be displayed by a MEMS-based mechanical tactile display. Micro Nano Lett. 2016, 11, 240. [Google Scholar] [CrossRef]
- Tymms, C.; Zorin, D.; Gardner, E.P. Tactile perception of the roughness of 3D-printd textures. J. Neurophsiol. 2017, 119, 862. [Google Scholar] [CrossRef] [PubMed]
- van Kuilenburg, J.; Masen, M.A.; Groenendijk, M.N.W.; Bana, V.; van der Heide, E. An experimental study on the relation between surface textures and tactile friction. Tribol. Int. 2012, 48, 15. [Google Scholar] [CrossRef]
- Xu, J.; Nonomura, Y.; Mineta, T. Evaluation of tactile sensation using periodic Si micro-bump arrayed surface with various bump sizes. IEEJ Trans. Sens. Micromach. 2019, 139, 393–399. [Google Scholar] [CrossRef]
- Kawazoe, M.; Kosemura, Y.; Miki, N. Encoding and presentation of surface textures using a mechanotactile display. Sens. Actuators A Phys. 2017, 261, 30–39. [Google Scholar] [CrossRef]
- Kawazoe, N.; Miki, N. Tactile samples with variable surface textures to investigate tactile perception characteristic. J. Micromech. Microeng. 2020, 30, 105011. [Google Scholar] [CrossRef]
- Nakamae, M. Study of the Reliability of Visual Evaluation by the Ranking Method: Analysis of ordinal scale and psychological scaling using the normalized-rank approach. Jpn. J. Radiol. Technol. 2000, 56, 725–730. [Google Scholar] [CrossRef]
- Okamoto, S.; Nagano, H.; Ho, H.N. Pervasive Haptics: Science, Design, and Application; Springer: Tokyo, Japan, 2016; pp. 3–20. [Google Scholar]
- Yoshioka, T.; Gibb, B.; Dorsch, A.K.; Hsiao, S.S.; Johnson, K.O. Neural coding mechanisms underlying perceived roughness of finely textured surfaces. J. Neurosci. 2001, 21, 6905–6916. [Google Scholar] [CrossRef]
- Connor, C.E.; Hsiao, S.S.; Phillips, J.R.; Johnson, K.O. Tactile roughness: Neural codes that account for psychophysical magnitude estimates. J. Neurosci. 1990, 10, 3823–3836. [Google Scholar] [CrossRef]
- Blake, D.T.; Hsiao, S.S.; Johnson, K.O. Neural coding mechanisms in tactile pattern recognition: The relative contributions of slowly and rapidly adapting mechanoreceptors to perceived roughness. J. Neurosci. 1997, 17, 7480–7489. [Google Scholar] [CrossRef]
- Bensmaia, S.J.; Hollins, M. The vibrations of texture. Somatosens. Motor Res. 2003, 20, 33–43. [Google Scholar] [CrossRef]
- Lederman, S.J. Tactile roughness of grooved surfaces: The touching process and effects of macro- and microsurface structure. Percept. Psychophys. 1974, 16, 385–395. [Google Scholar] [CrossRef]
- Cascio, C.J.; Sathian, K. Temporal cues contribute to tactile perception of roughness. J. Neurosci. 2001, 21, 5289–5296. [Google Scholar] [CrossRef]
- Hwang, S.J.; Oh, D.J.; Jung, P.G.; Lee, S.M.; Go, J.S.; Kim, J.-H.; Hwang, K.-Y.; Ko, J.S. Dry etching of polydimethylsiloxane using microwave plasma. J. Micromech. Microeng. 2009, 19, 095010. [Google Scholar] [CrossRef]
- Hill, S.; Qian, W.; Chen, W.; Fu, J. Surface micromachining of polydimethylsiloxane for microfluidics applications. Biomicrofluidics 2016, 10, 54114. [Google Scholar] [CrossRef] [PubMed]
- Akhtar, T.; Chen, J.; Ettelaie, R.; Holmes, M.; Henson, B. Human roughness perception and possible factors effecting roughness sensation. J. Text. Stud. 2016, 48, 181–192. [Google Scholar] [CrossRef] [PubMed]
- Miki, N.; Spearing, S.M. Effect of nanoscale surface roughness on the bonding energy of direct-bonded silicon wafers. J. Appl. Phys. 2003, 94, 6800. [Google Scholar] [CrossRef]
- Shibahara, M.; Sato, K. Illusion of wetness by dynamic touch. IEEE Trans. Hapt. 2019, 12, 533–541. [Google Scholar] [CrossRef] [PubMed]
- Drewing, K.; Weyel, C.; Celebi, H.; Kaya, D. Feeling and feelings: Affective and perceptual dimensions of touched materials and their connection. In Proceedings of the IEEE World Haptics Conference (WHC), Munich, Germany, 5 June 2017. [Google Scholar] [CrossRef]
- Kawasegi, N.; Fujii, M.; Shimizu, T.; Sekiguchi, N.; Sumioka, J.; Doi, Y. Physical properties and tactile sensory perception of microtexturedmolded plastics. Precis. Eng. 2014, 38, 292–299. [Google Scholar] [CrossRef]


Publisher’s Note: MDPI stays neutral with regard to jurisdictional claims in published maps and institutional affiliations. |
© 2022 by the authors. Licensee MDPI, Basel, Switzerland. This article is an open access article distributed under the terms and conditions of the Creative Commons Attribution (CC BY) license (https://creativecommons.org/licenses/by/4.0/).