
Intelligent Medical System with Low-Cost Wearable Monitoring Devices to Measure Basic Vital Signals of Admitted Patients


Abstract
:1. Introduction
Organization of the Paper
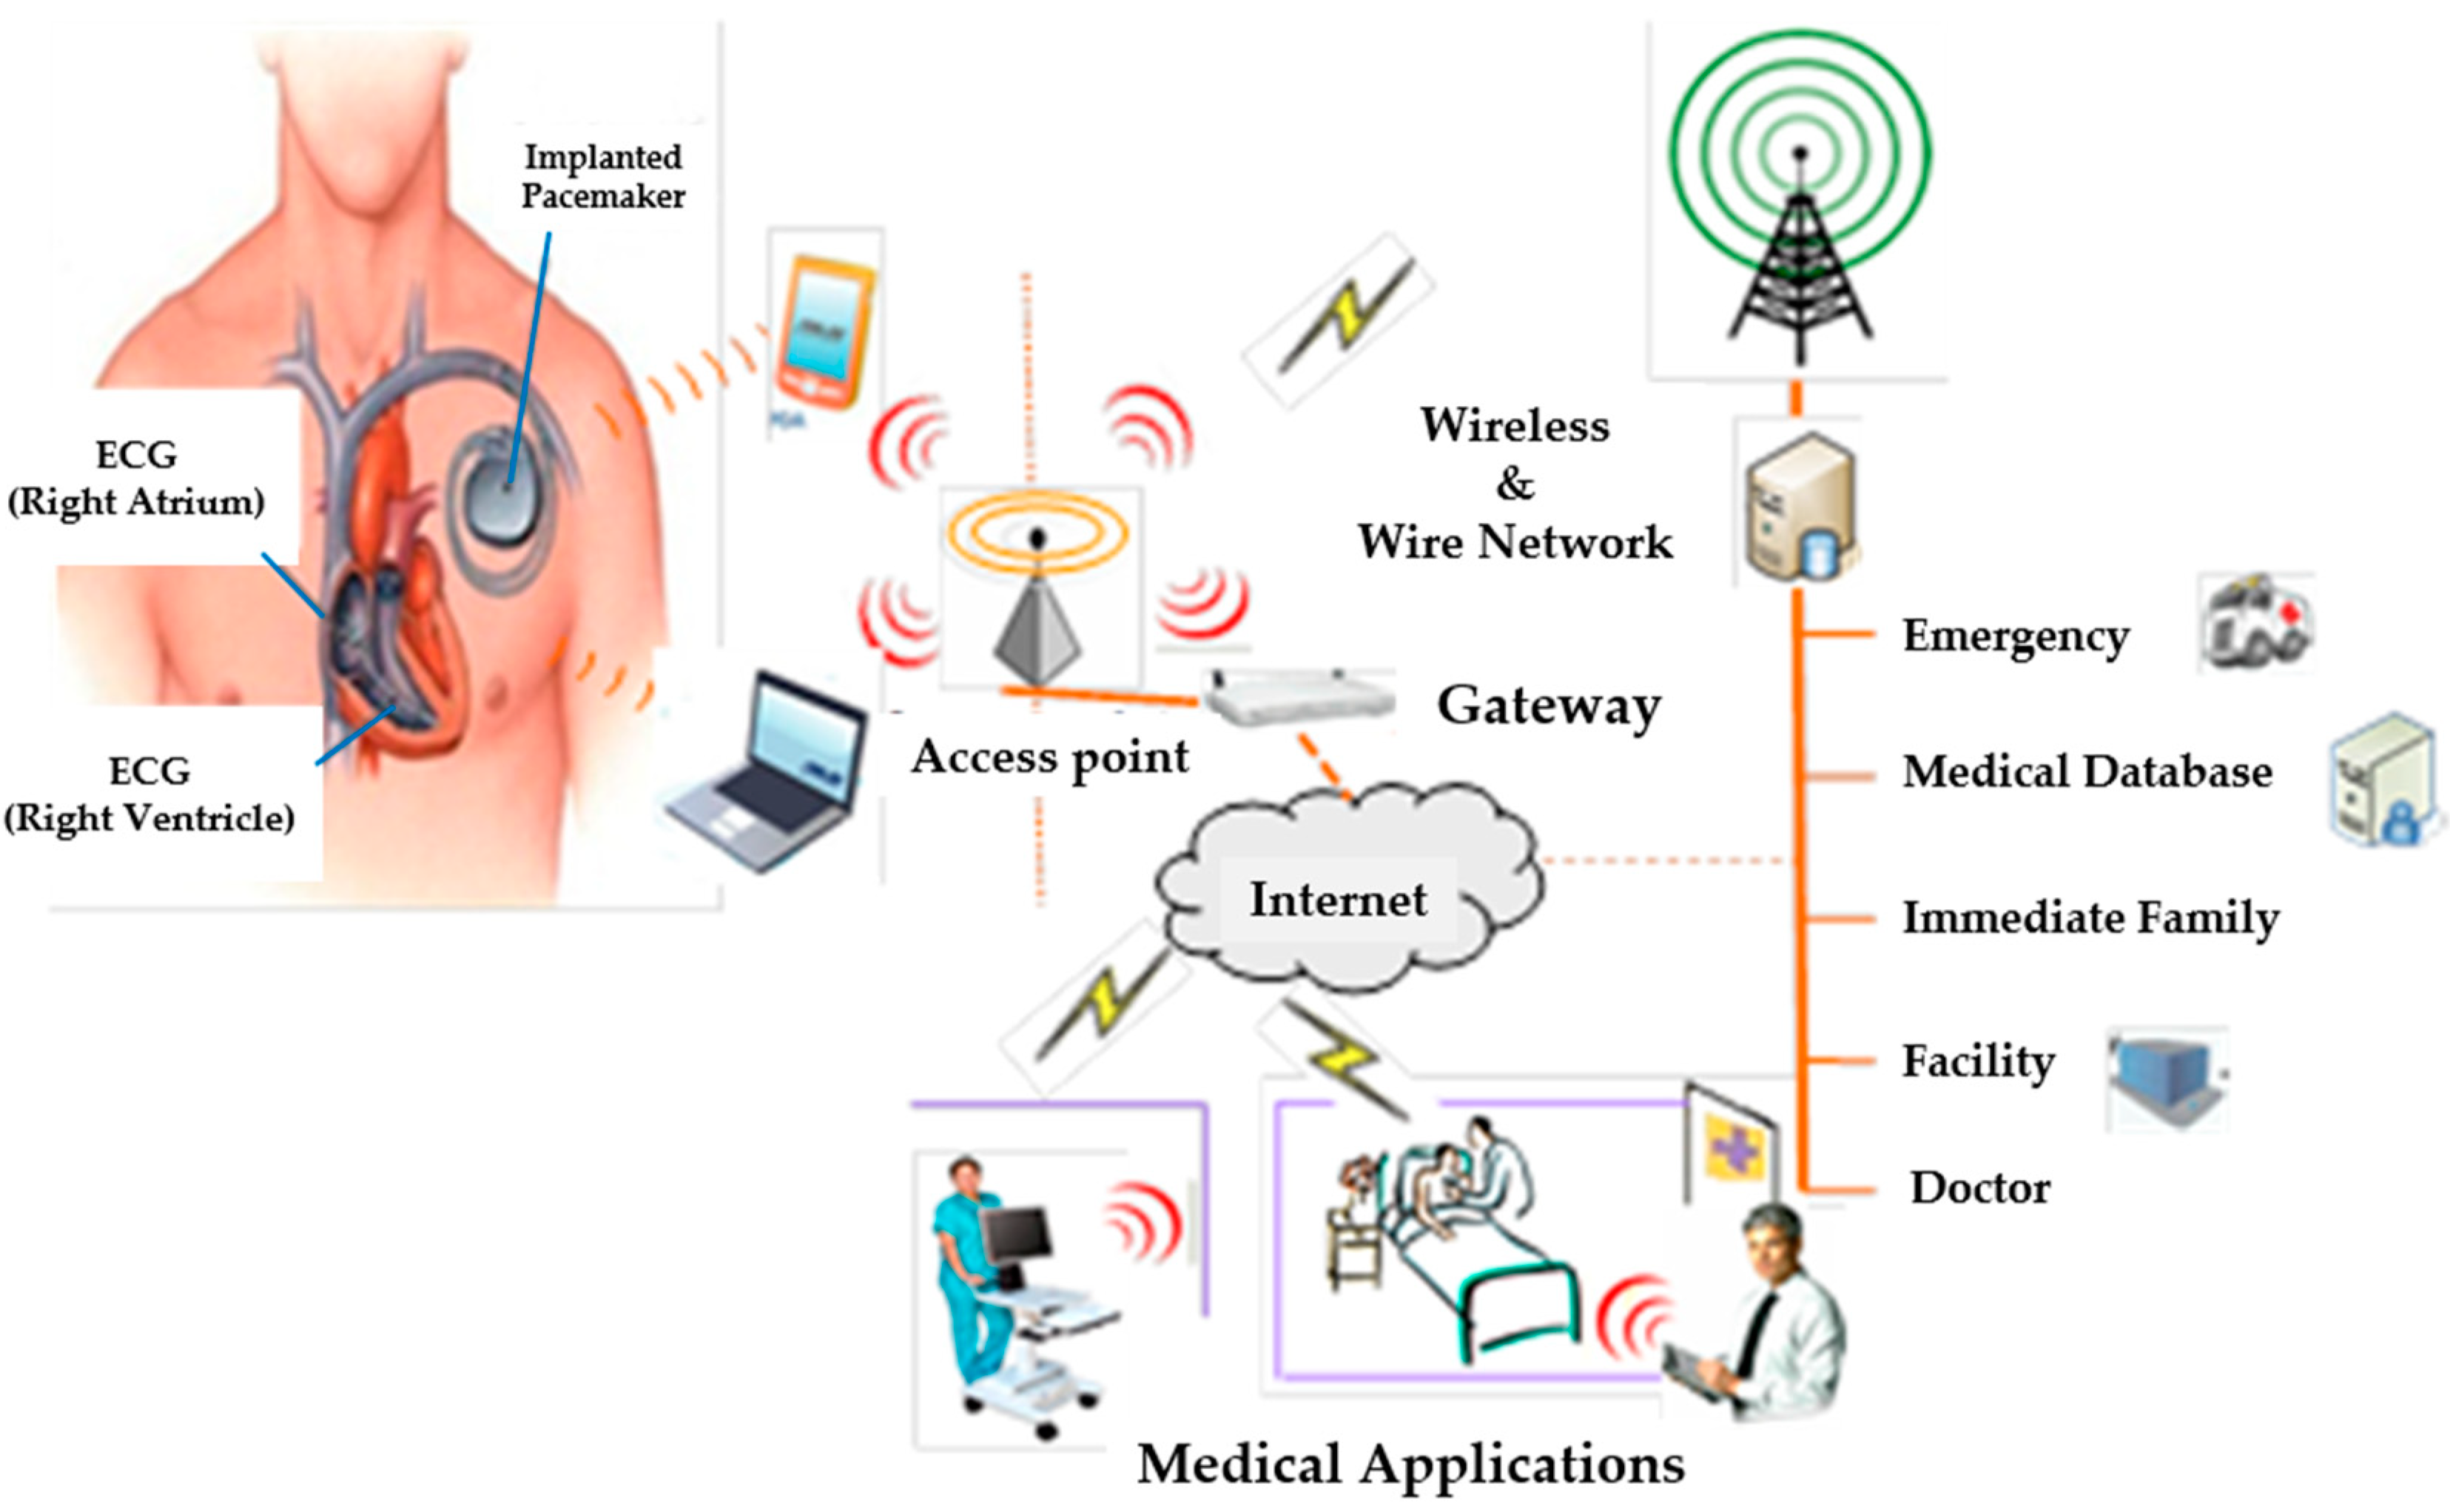
2. Sensors Used in the WBSN for Vital Signs
2.1. Blood Pressure, Pulse, and Heart Rate
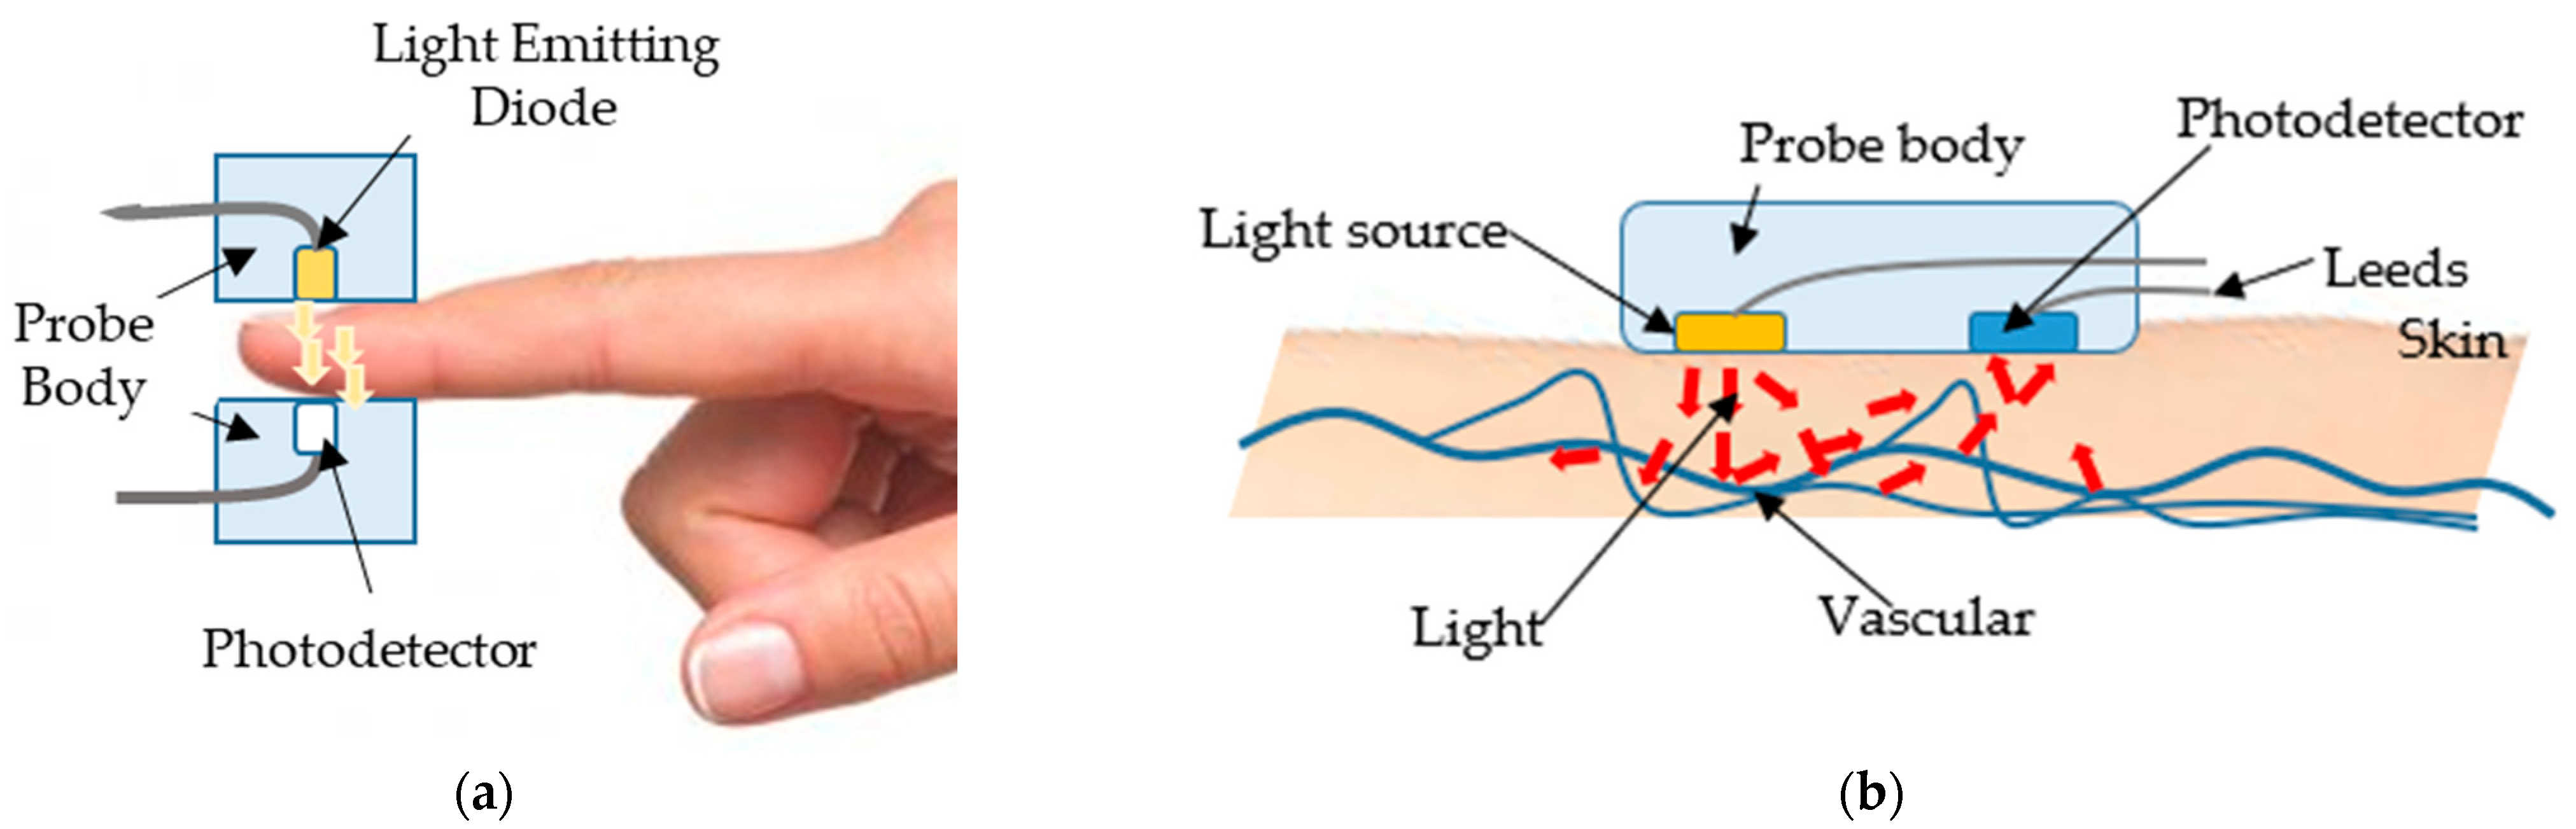
2.2. Method of the Measuring Pulse
2.3. Relationship between Blood Pressure and Heart Rate
2.4. The Concept Idea of Vital Sign Monitoring Devices
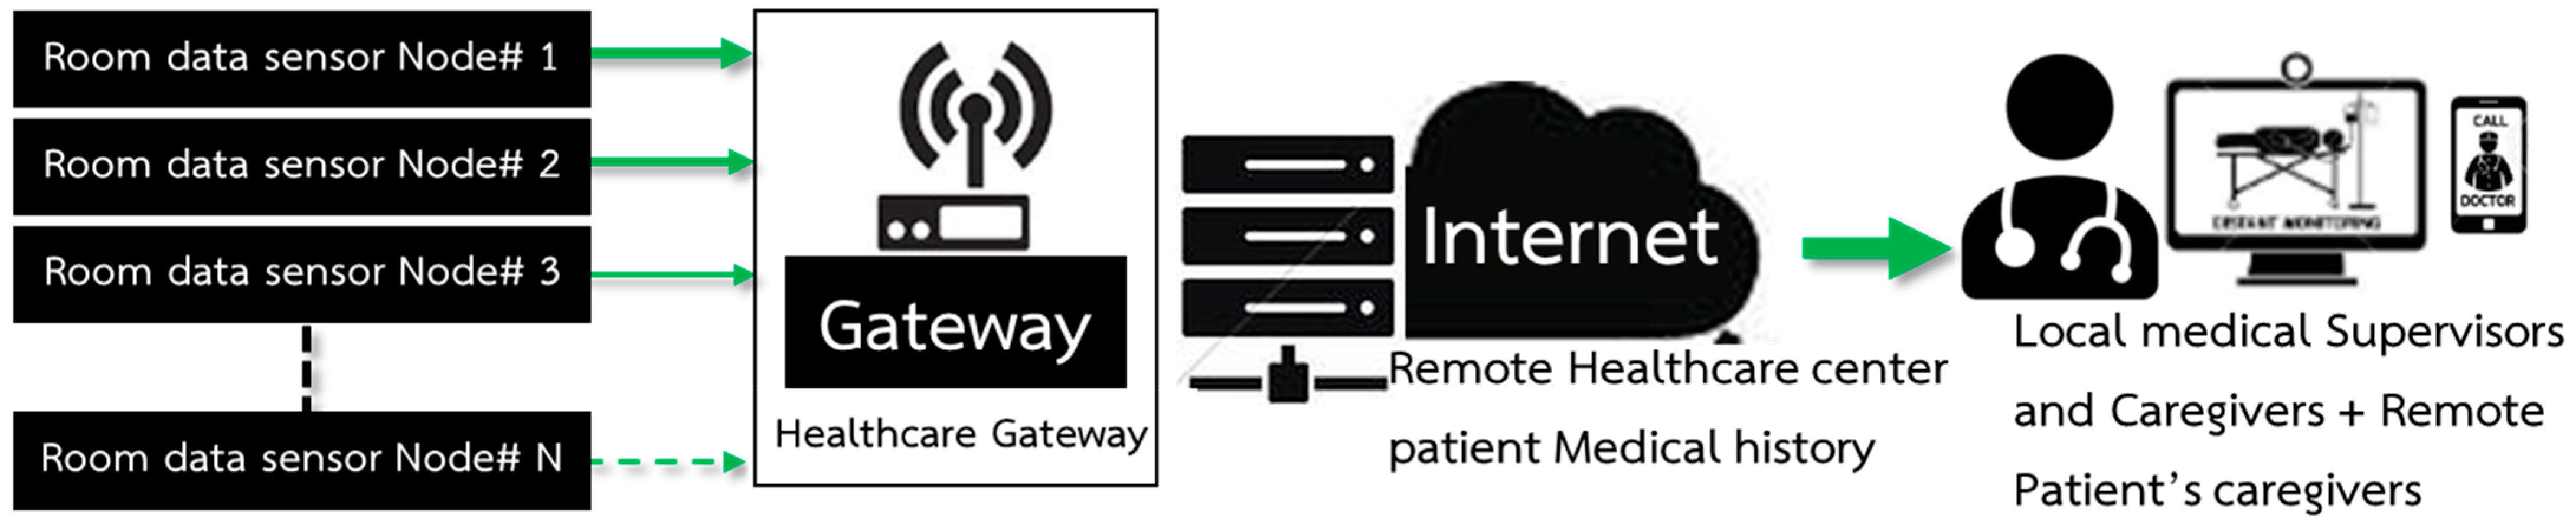
3. The Proposed Overall Architecture System
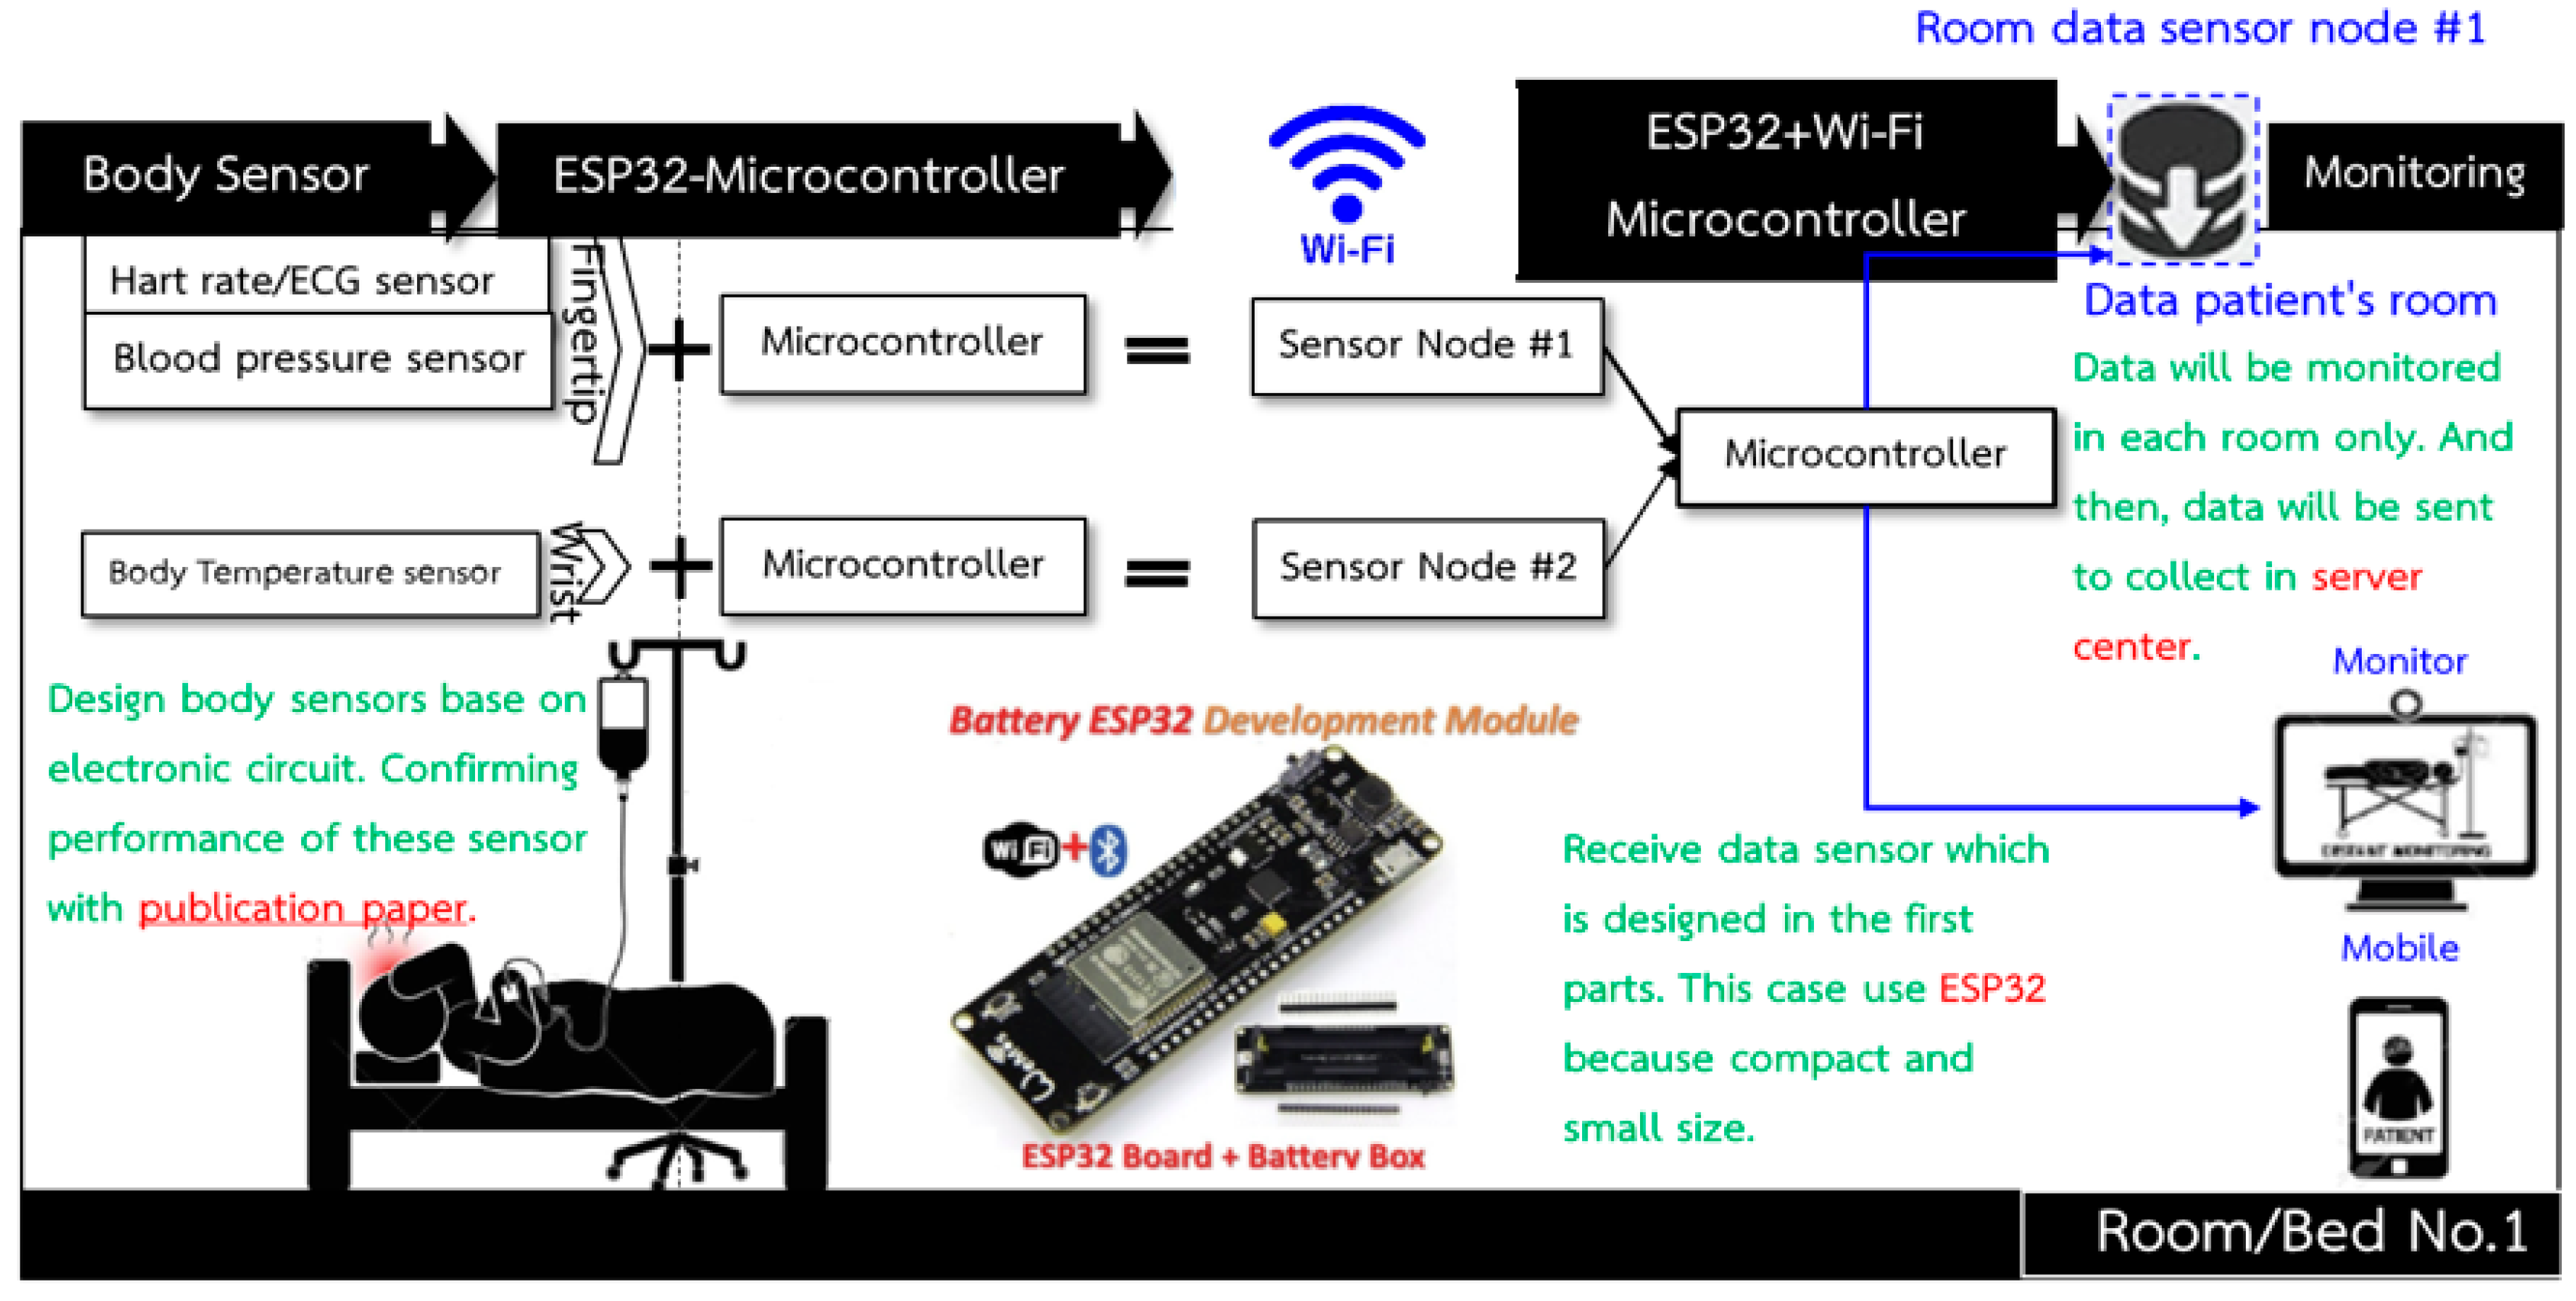
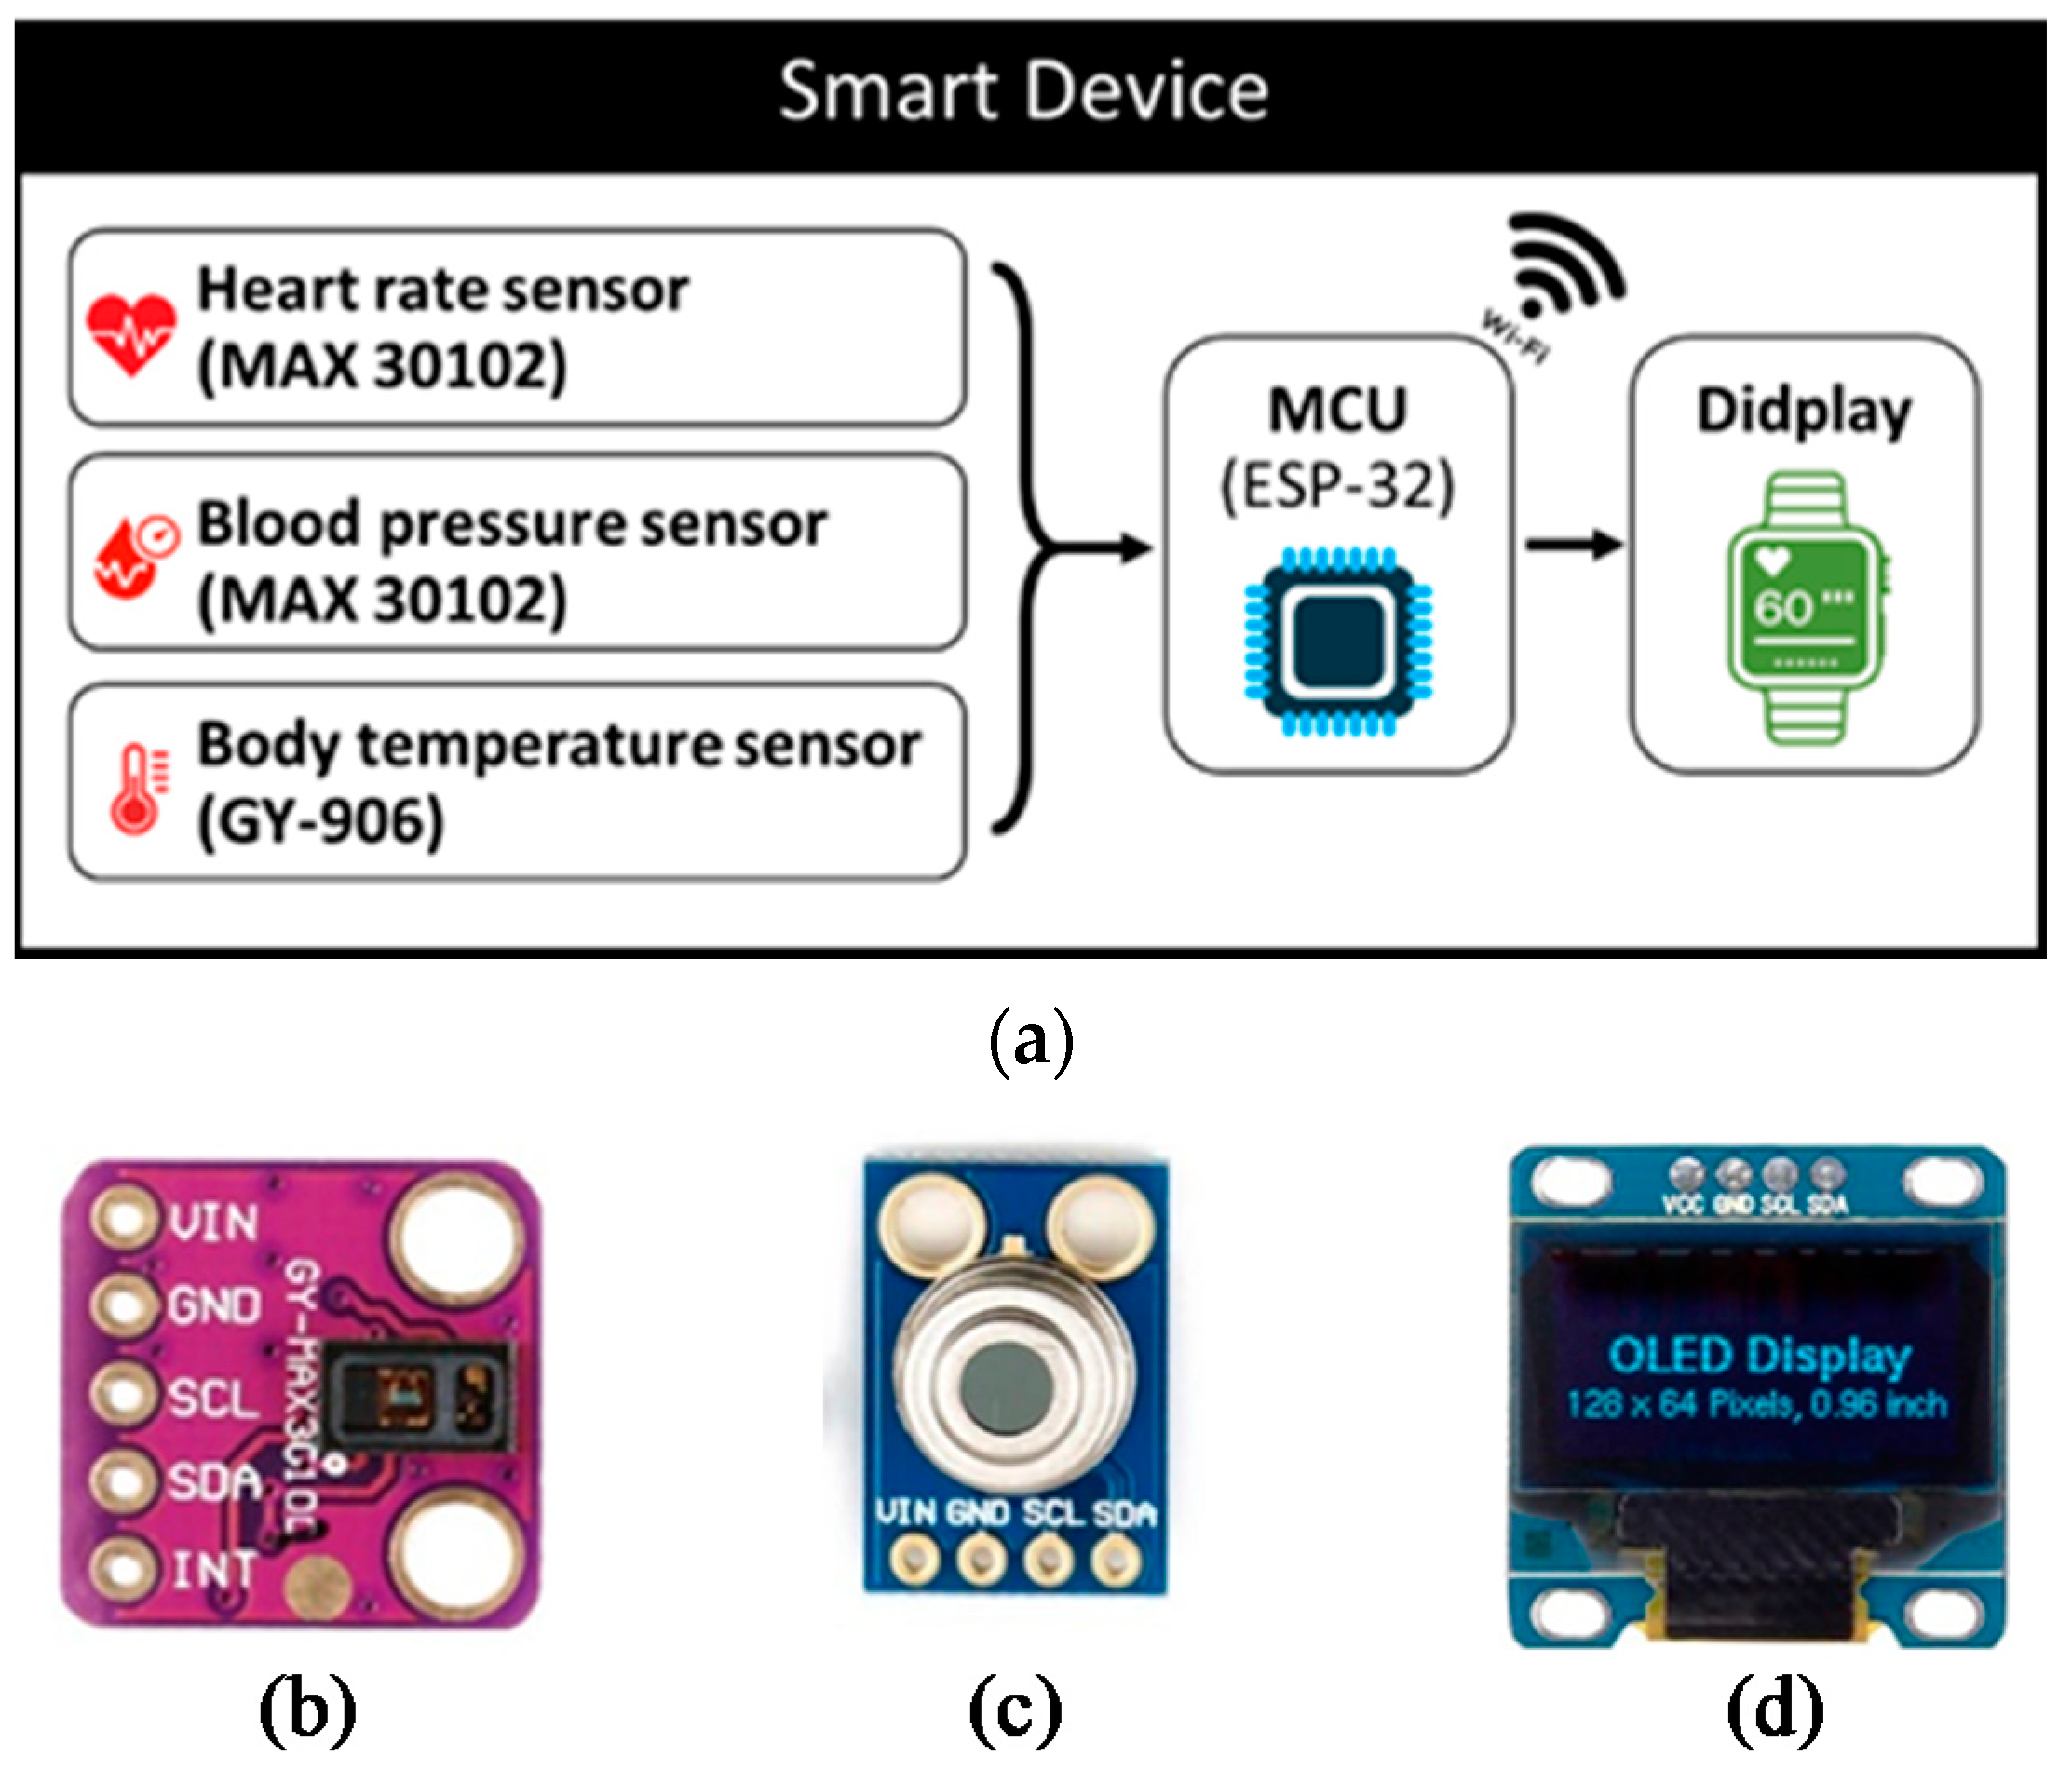
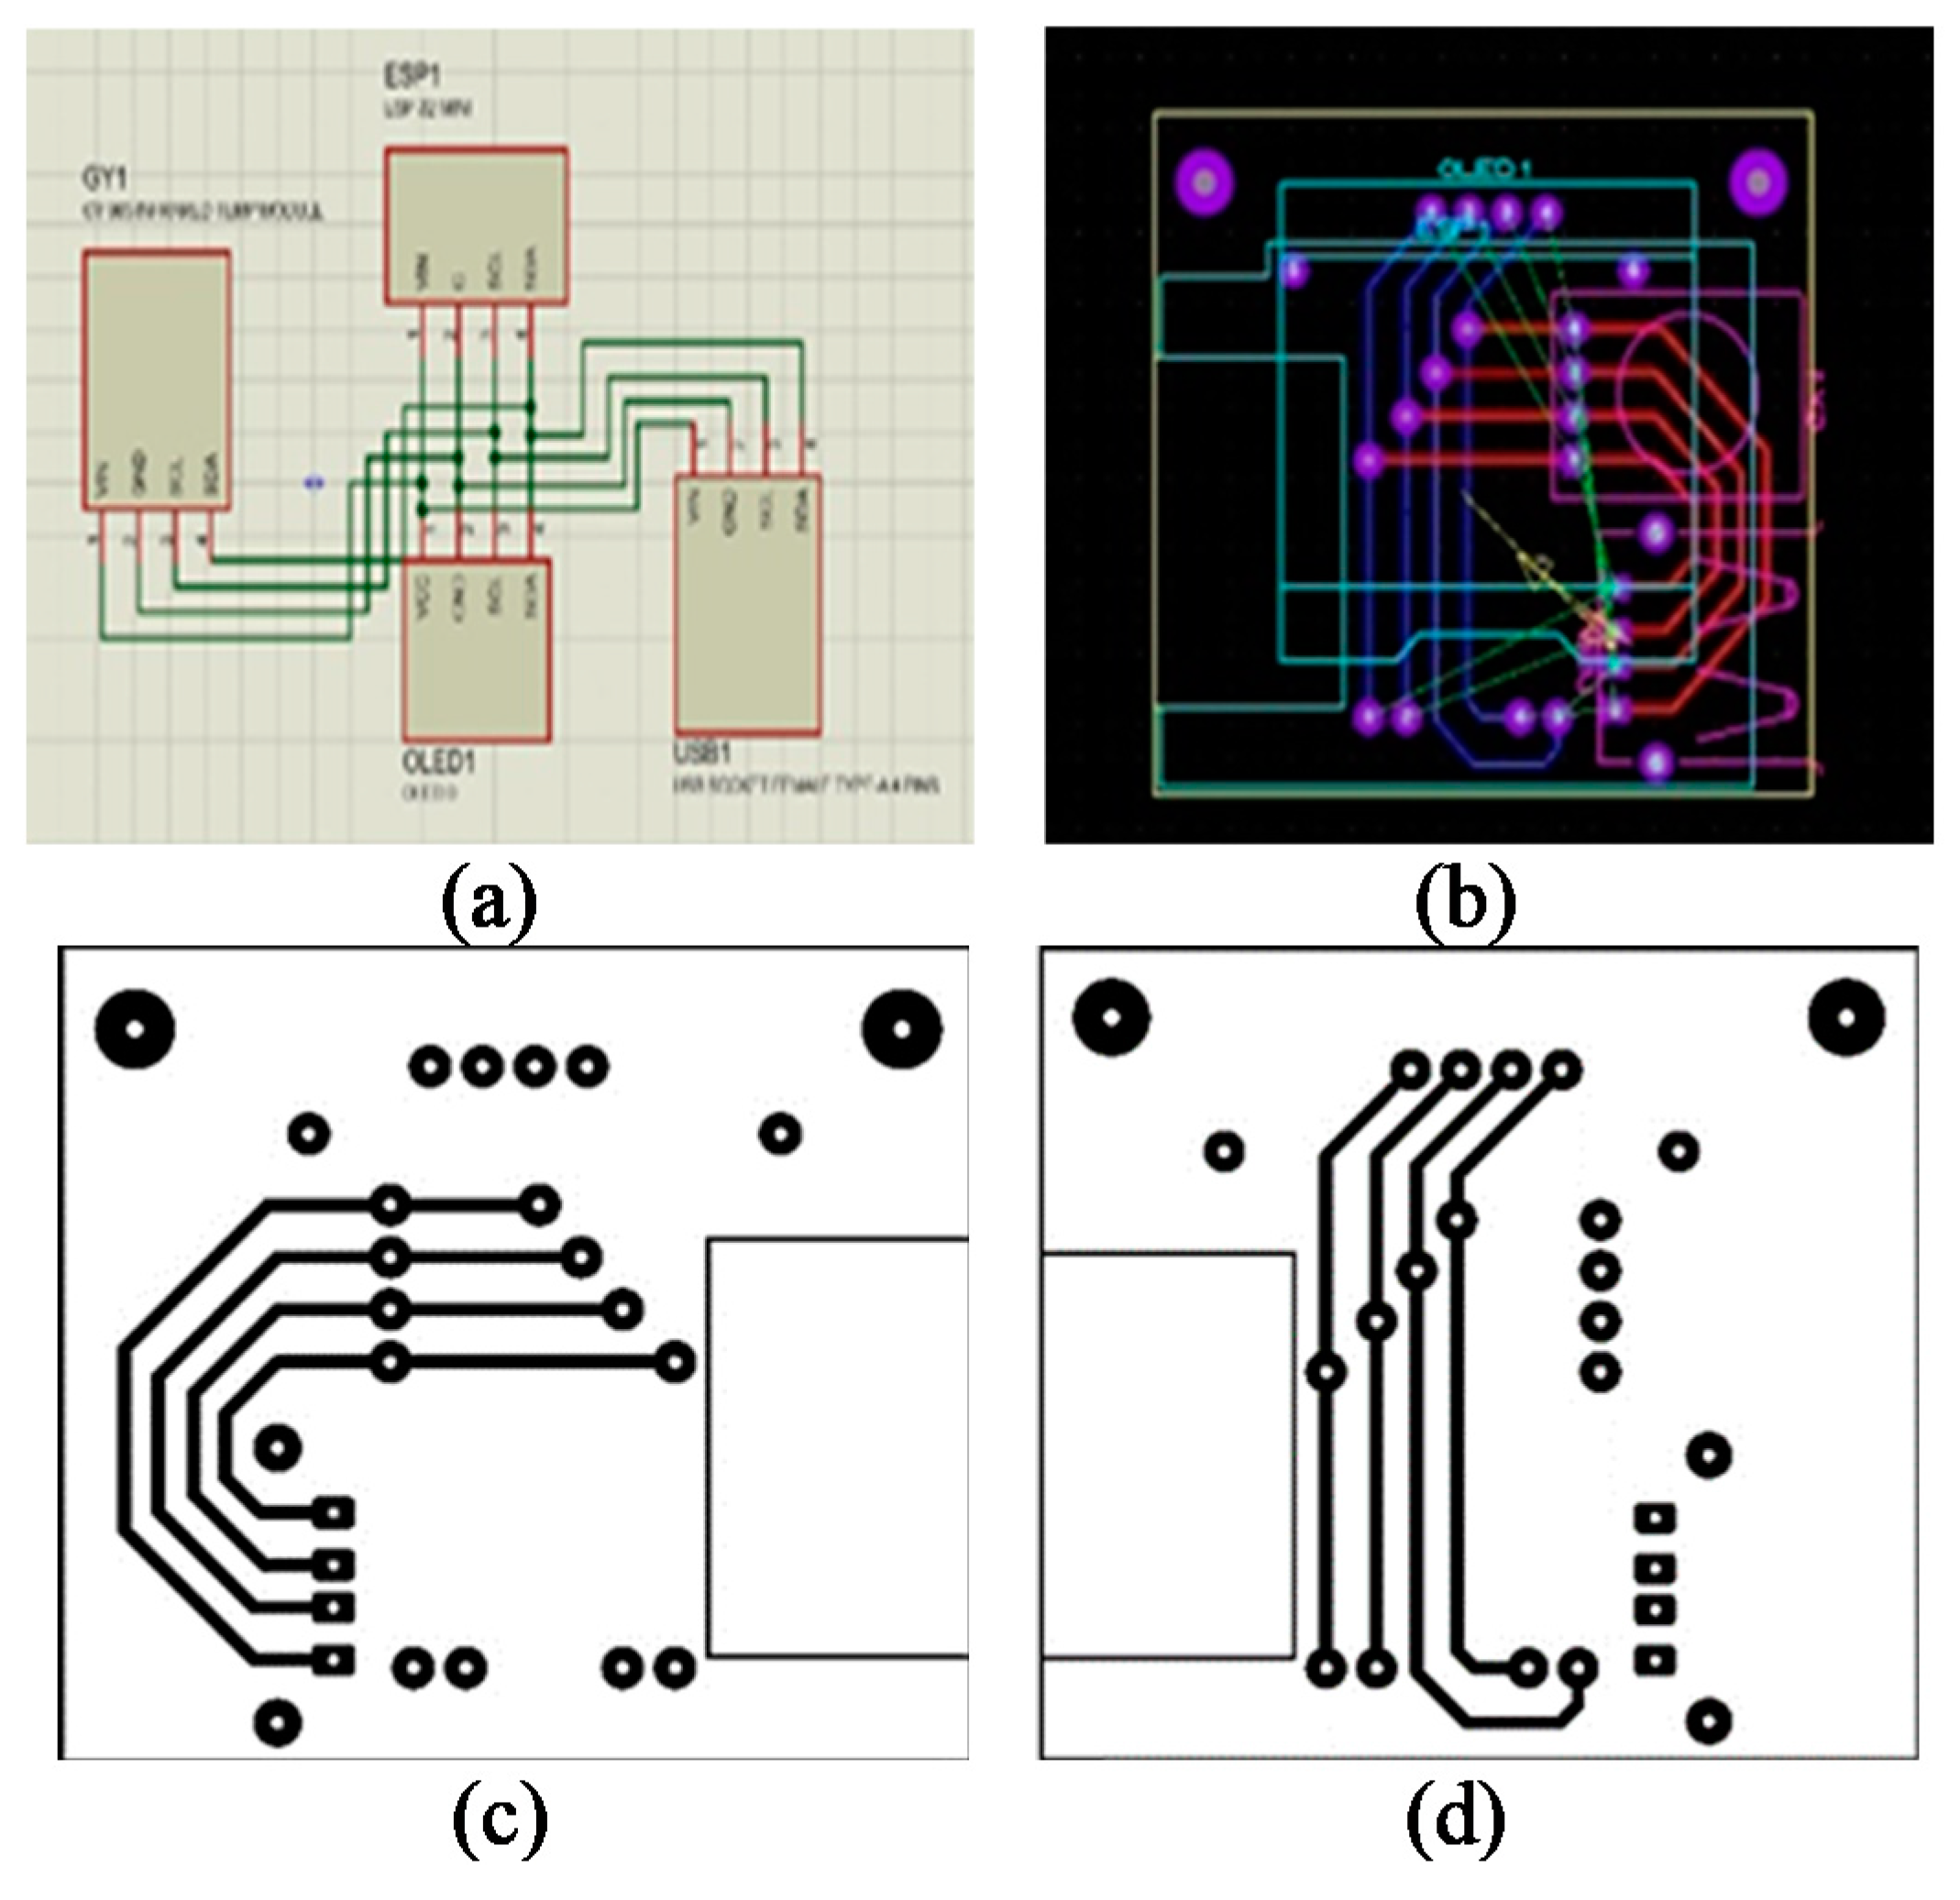
3.1. Designing of a Smart Device for a Wireless Body Area Sensor Network (WBSN)
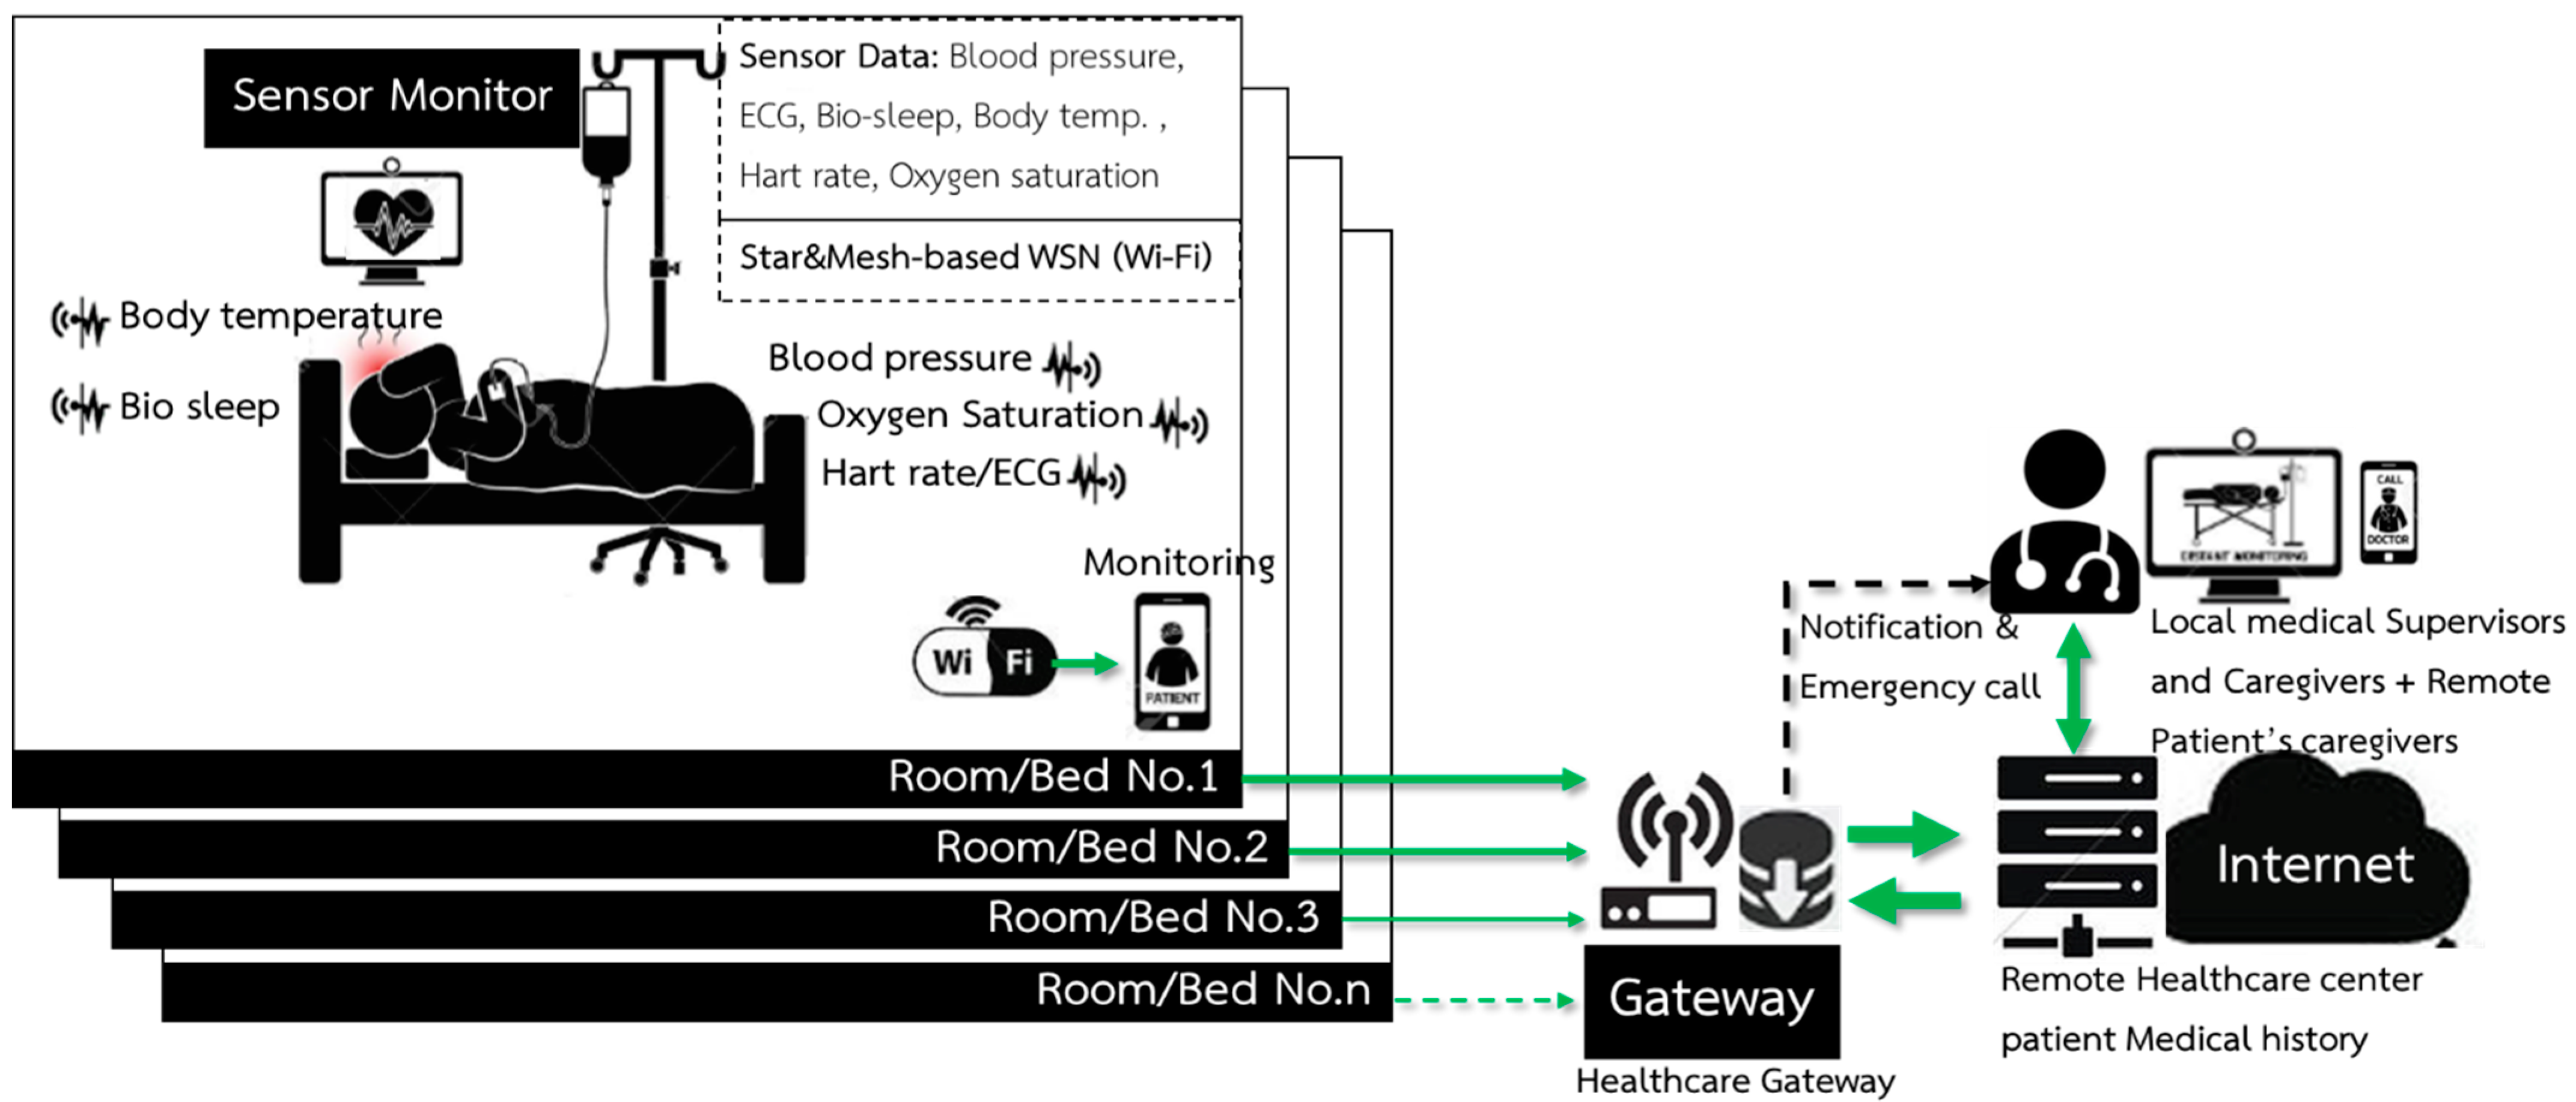
3.2. Design of the Intelligent Medical Monitoring System
- Data structure classification manages a large and complex data into categories ranging in order, which consists of an admin, a customer, an asset, and a device. A device, the smallest category, connects and receives data from the MCU, which sends pulse, body temperature, and blood pressure data to the system. To connect with the device, the MCU has to connect with the internet and have compatible communication standards and passwords as the device. An asset is like a box that supports data from devices that can categorize devices and access and modify all of the devices’ information. A customer manages multiple-user access where each user is able to access and modify data from asset, device, and dashboard authorized by customers. An admin is an administrator of the Things Board system and is able to access and modify all data including customer, asset, device, rule engine, and dashboard.
- Data processing is the part that analyzes data sent from devices where a term of conditions is set for a notification when errors occur. The data are also processed in controllers of the rule engine, a device in Things Board functions. The rule engine processes all data by using a workflow method that is the combinations of block instructions; thus, no coding is required. It includes data verification, notification, online or offline status detection, structure, and relationship modification, exporting data to an external platform and controlling the MCU. The compositions of the rule engine are: (1) Message serves as data management, which is sent to Things Board; (2) Rule Node, which is a function that has a wide range of actions such as editing, calculating, analyzing data into any condition, changing data relationships, and detection device status; (3) Rule Chain, which collects all function relationships such as an input, message, and rule node and combines them into one process. The purpose of the combination is for the convenience of data use, especially in a case when there is more than one process.
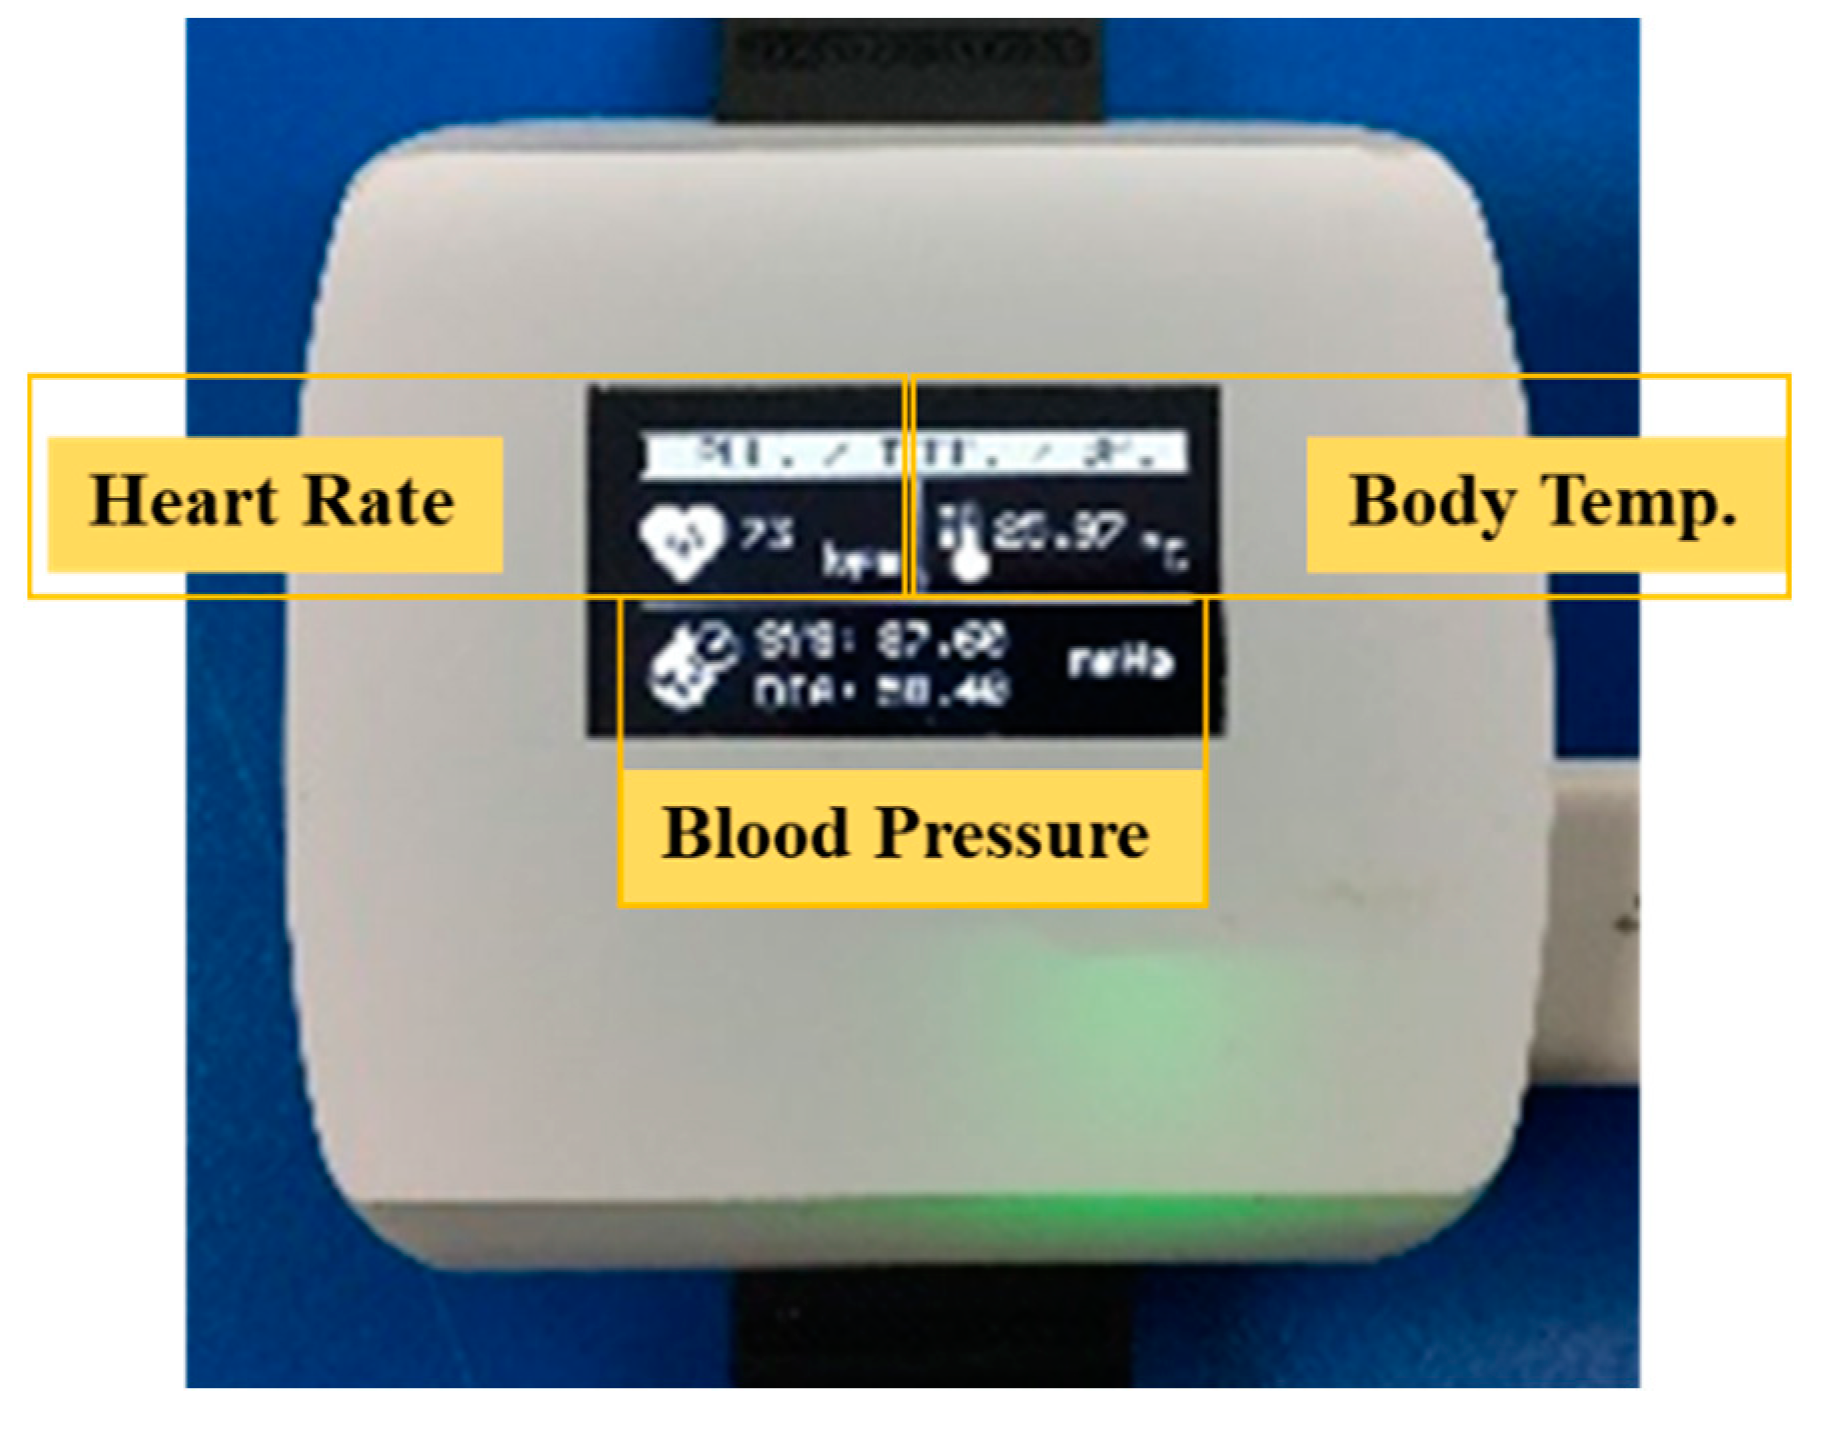
- The data display can adjust the dashboard screen in various actions such as notifications and status detection. Moreover, it can decide whether to display the data only on the device or the asset, which consists of many devices in the network. Widgets is a tool that has a wide range of actions—for example, digital and analog gauges, charts, maps, control GPIO, table, etc.
4. Essential Components and Validation Method
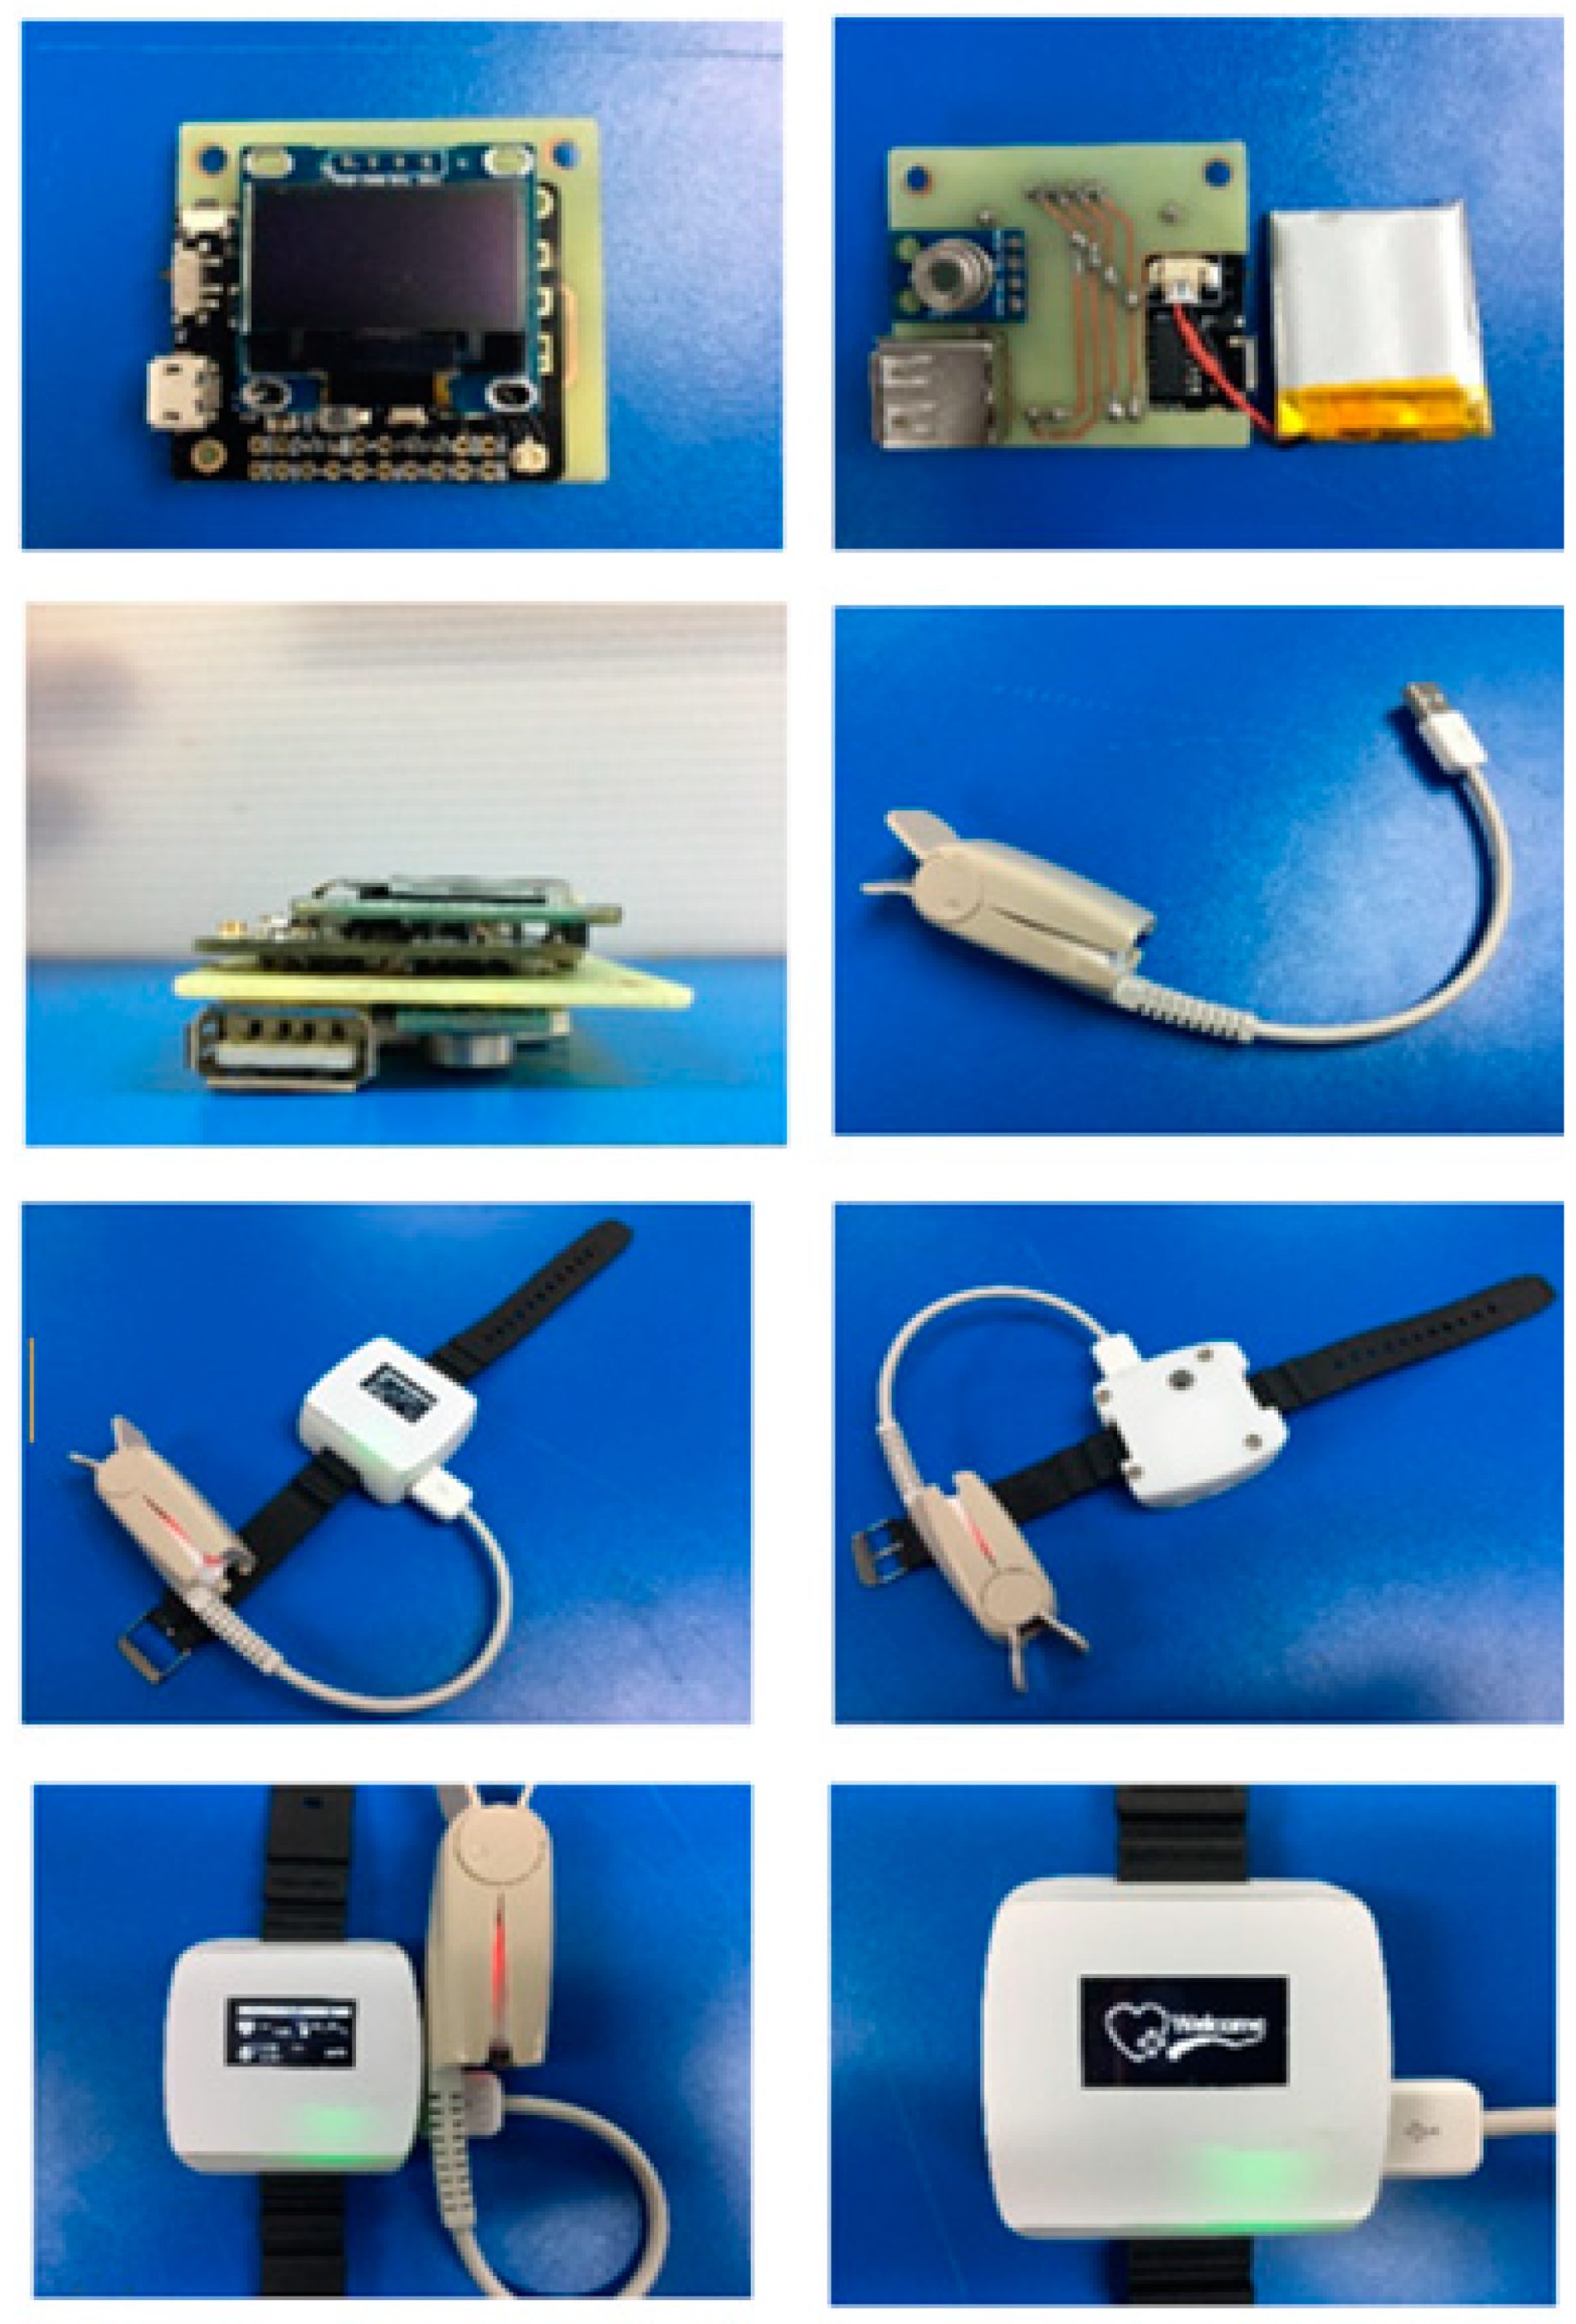
5. Results
6. Conclusions
Author Contributions
Funding
Data Availability Statement
Acknowledgments
Conflicts of Interest
References
- World Health Organization. COVID-19 Weekly Epidemiological Update as of 25 April 2021, 10 am CET; World Health Organization: Geneva, Switzerland, 2021. [Google Scholar]
- Zhao, D.; Yao, F.; Wang, L.; Zheng, L.; Gao, Y.; Ye, J.; Guo, F.; Zhao, H.; Gao, R. A Comparative Study on the Clinical Features of Coronavirus 2019 (COVID-19) Pneumonia with Other Pneumonias. Clin. Infect. Dis. 2020, 71, 756–761. [Google Scholar] [CrossRef] [PubMed] [Green Version]
- Huang, C.; Wang, Y.; Li, X.; Ren, L.; Zhao, J.; Hu, Y.; Zhang, L.; Fan, G.; Xu, J.; Gu, X.; et al. Clinical features of patients infected with 2019 novel coronavirus in Wuhan, China. Lancet 2020, 395, 497–506. [Google Scholar] [CrossRef] [Green Version]
- Kim, G.-U.; Kim, M.-J.; Ra, S.; Lee, J.; Bae, S.; Jung, J.; Kim, S.-H. Clinical characteristics of asymptomatic and symptomatic patients with mild COVID-19. Clin. Microbiol. Infect. 2020, 26, 948.e1–948.e3. [Google Scholar] [CrossRef] [PubMed]
- Chen, Z.; He, S.; Li, F.; Yin, J.; Chen, X. Mobile field hospitals, an effective way of dealing with COVID-19 in China: Sharing our experience. Biosci. Trends 2020, 14, 212–214. [Google Scholar] [CrossRef] [PubMed] [Green Version]
- Ranabhat, C.L.; Atkinson, J.; Park, M.-B.; Kim, C.-B.; Jakovljevic, M. The Influence of Universal Health Coverage on Life Expectancy at Birth (LEAB) and Healthy Life Expectancy (HALE): A Multi-Country Cross-Sectional Study. Front. Pharmacol. 2018, 9, 960. [Google Scholar] [CrossRef] [PubMed] [Green Version]
- Seoane, F.; Mohino-Herranz, I.; Ferreira, J.; Alvarez, L.; Buendia, R.; Ayllón, D.; Llerena, C.; Gil-Pita, R. Wearable Biomedical Measurement Systems for Assessment of Mental Stress of Combatants in Real Time. Sensors 2014, 14, 7120–7141. [Google Scholar] [CrossRef] [PubMed] [Green Version]
- Zheng, Q.; Shi, B.; Li, Z.; Wang, Z.L. Recent Progress on Piezoelectric and Triboelectric Energy Harvesters in Biomedical Systems. Adv. Sci. 2017, 4, 1700029. [Google Scholar] [CrossRef] [PubMed]
- Hinchet, R.; Kim, S.-W. Wearable and Implantable Mechanical Energy Harvesters for Self-Powered Biomedical Systems. ACS Nano 2015, 9, 7742–7745. [Google Scholar] [CrossRef] [PubMed]
- Tateno, T.; Nishikawa, J.; Tsuchioka, N.; Shintaku, H.; Kawano, S. A hardware model of the auditory periphery to transduce acoustic signals into neural activity. Front. Neuroeng. 2013, 6, 12. [Google Scholar] [CrossRef] [PubMed] [Green Version]
- Bergeles, C.; Yang, G.-Z. From Passive Tool Holders to Microsurgeons: Safer, Smaller, Smarter Surgical Robots. IEEE Trans. Biomed. Eng. 2014, 61, 1565–1576. [Google Scholar] [CrossRef] [PubMed] [Green Version]
- Ullah, I.; Amin, N.U.; Khan, M.A.; Khattak, H.; Kumari, S. An Efficient and Provable Secure Certificate-Based Combined Signature, Encryption and Signcryption Scheme for Internet of Things (IoT) in Mobile Health (M-Health) System. J. Med. Syst. 2021, 45, 4. [Google Scholar] [CrossRef] [PubMed]
- Sakphrom, S.; Khumsat, P. Low-cost short-range wireless sensing and control network. In Proceedings of the 28th Electrical Engineering Conference (EECON 28), Phuket, Thailand, 20–21 October 2005. [Google Scholar]
- Jovanov, E.; Milenkovic, A.; Otto, C.; De Groen, P.C. A wireless body area network of intelligent motion sensors for computer assisted physical rehabilitation. J. Neuroeng. Rehabil. 2005, 2, 6. [Google Scholar] [CrossRef] [Green Version]
- Chen, M.; Gonzalez, S.; Vasilakos, A.; Cao, H.; Leung, V. Body Area Networks: A Survey. Mob. Networks Appl. 2011, 16, 171–193. [Google Scholar] [CrossRef]
- Khan, J.Y.; Yuce, M.R.; Karami, F. Performance evaluation of a Wireless Body Area sensor network for remote patient monitoring. In Proceedings of the 30th Annual International Conference of the IEEE Engineering in Medicine and Biology Society, EMBS’08—Personalized Healthcare through Technology, Vancouver, BC, Canada, 20–25 August 2008. [Google Scholar]
- Zhen, B.; Li, H.B.; Kohno, R. Networking issues in medical implant communications. Int. J. Multimed. Ubiquitous Eng. 2009, 4, 23–38. [Google Scholar]
- Home—Caretaker Medical: Wireless Vital Sign Monitoring. Available online: https://caretakermedical.net/ (accessed on 25 July 2021).
- Al Bassam, N.; Hussain, S.A.; Al Qaraghuli, A.; Khan, J.; Sumesh, E.; Lavanya, V. IoT based wearable device to monitor the signs of quarantined remote patients of COVID-19. Inform. Med. Unlocked 2021, 24, 100588. [Google Scholar] [CrossRef] [PubMed]
- Wan, J.; Al-Awlaqi, M.A.A.H.; Li, M.; O’Grady, M.; Gu, X.; Wang, J.; Cao, N. Wearable IoT enabled real-time health monitoring system. EURASIP J. Wirel. Commun. Netw. 2018, 2018, 298. [Google Scholar] [CrossRef]
- Ru, L.; Zhang, B.; Duan, J.; Ru, G.; Sharma, A.; Dhiman, G.; Gaba, G.S.; Jaha, E.S.; Masud, M. A Detailed Research on Human Health Monitoring System Based on Internet of Things. Wirel. Commun. Mob. Comput. 2021, 2021, 5592454. [Google Scholar] [CrossRef]
- Marathe, S.; Zeeshan, D.; Thomas, T.; Vidhya, S. A Wireless Patient Monitoring System using Integrated ECG module, Pulse Oximeter, Blood Pressure and Temperature Sensor. In Proceedings of the 2019 International Conference on Vision towards Emerging Trends in Communication and Networking (ViTECoN), Vellore, India, 30–31 March 2019. [Google Scholar]
- Chowdary, K.C.; Krishna, L.; Prasad, K.L.; Thejesh, K. An Efficient Wireless Health Monitoring System. In Proceedings of the International Conference on I-SMAC (IoT in Social, Mobile, Analytics and Cloud), I-SMAC 2018, Palladam, India, 30–31 August 2018. [Google Scholar]
- Kumar, V.D.A.; Subramanian, M.; Gopalakrishnan, G.; Vengatesan, K.; Elangovan, D.; Chitra, B. Implementation of the pulse rhythmic rate for the efficient diagnosing of the heartbeat. Healthc. Technol. Lett. 2019, 6, 48–52. [Google Scholar] [CrossRef] [PubMed]
- Verma, D.; Bhasin, M. Real Time Optical Heart Rate Monitor. Int. J. Comput. Sci. Inf. Technol. 2014, 5, 7265–7269. [Google Scholar]
- MAX30102 High-Sensitivity Pulse Oximeter and Heart-Rate Sensor for Wearable Health | Maxim Integrated. Available online: https://www.maximintegrated.com/en/products/interface/sensor-interface/MAX30102.html (accessed on 21 July 2021).
- GY-906 MLX90614 Non-Contact Precision Thermometer Module—ProtoSupplies. Available online: https://protosupplies.com/product/gy-906-mlx90614-non-contact-precision-thermometer-module/ (accessed on 21 July 2021).
- The Internet of Things with ESP32. Available online: http://esp32.net/ (accessed on 21 July 2021).
- 1pcs 3.7V 360mAh 502530 Lithium Polymer Li Po Rechargeable Battery for DIY Mp3 GPS|Polymer Lithium Battery 3.7v|Polymer Lithium Batterybatteries 3.7v 360mah—AliExpress. Available online: https://www.aliexpress.com/item/2052889555.html (accessed on 21 July 2021).


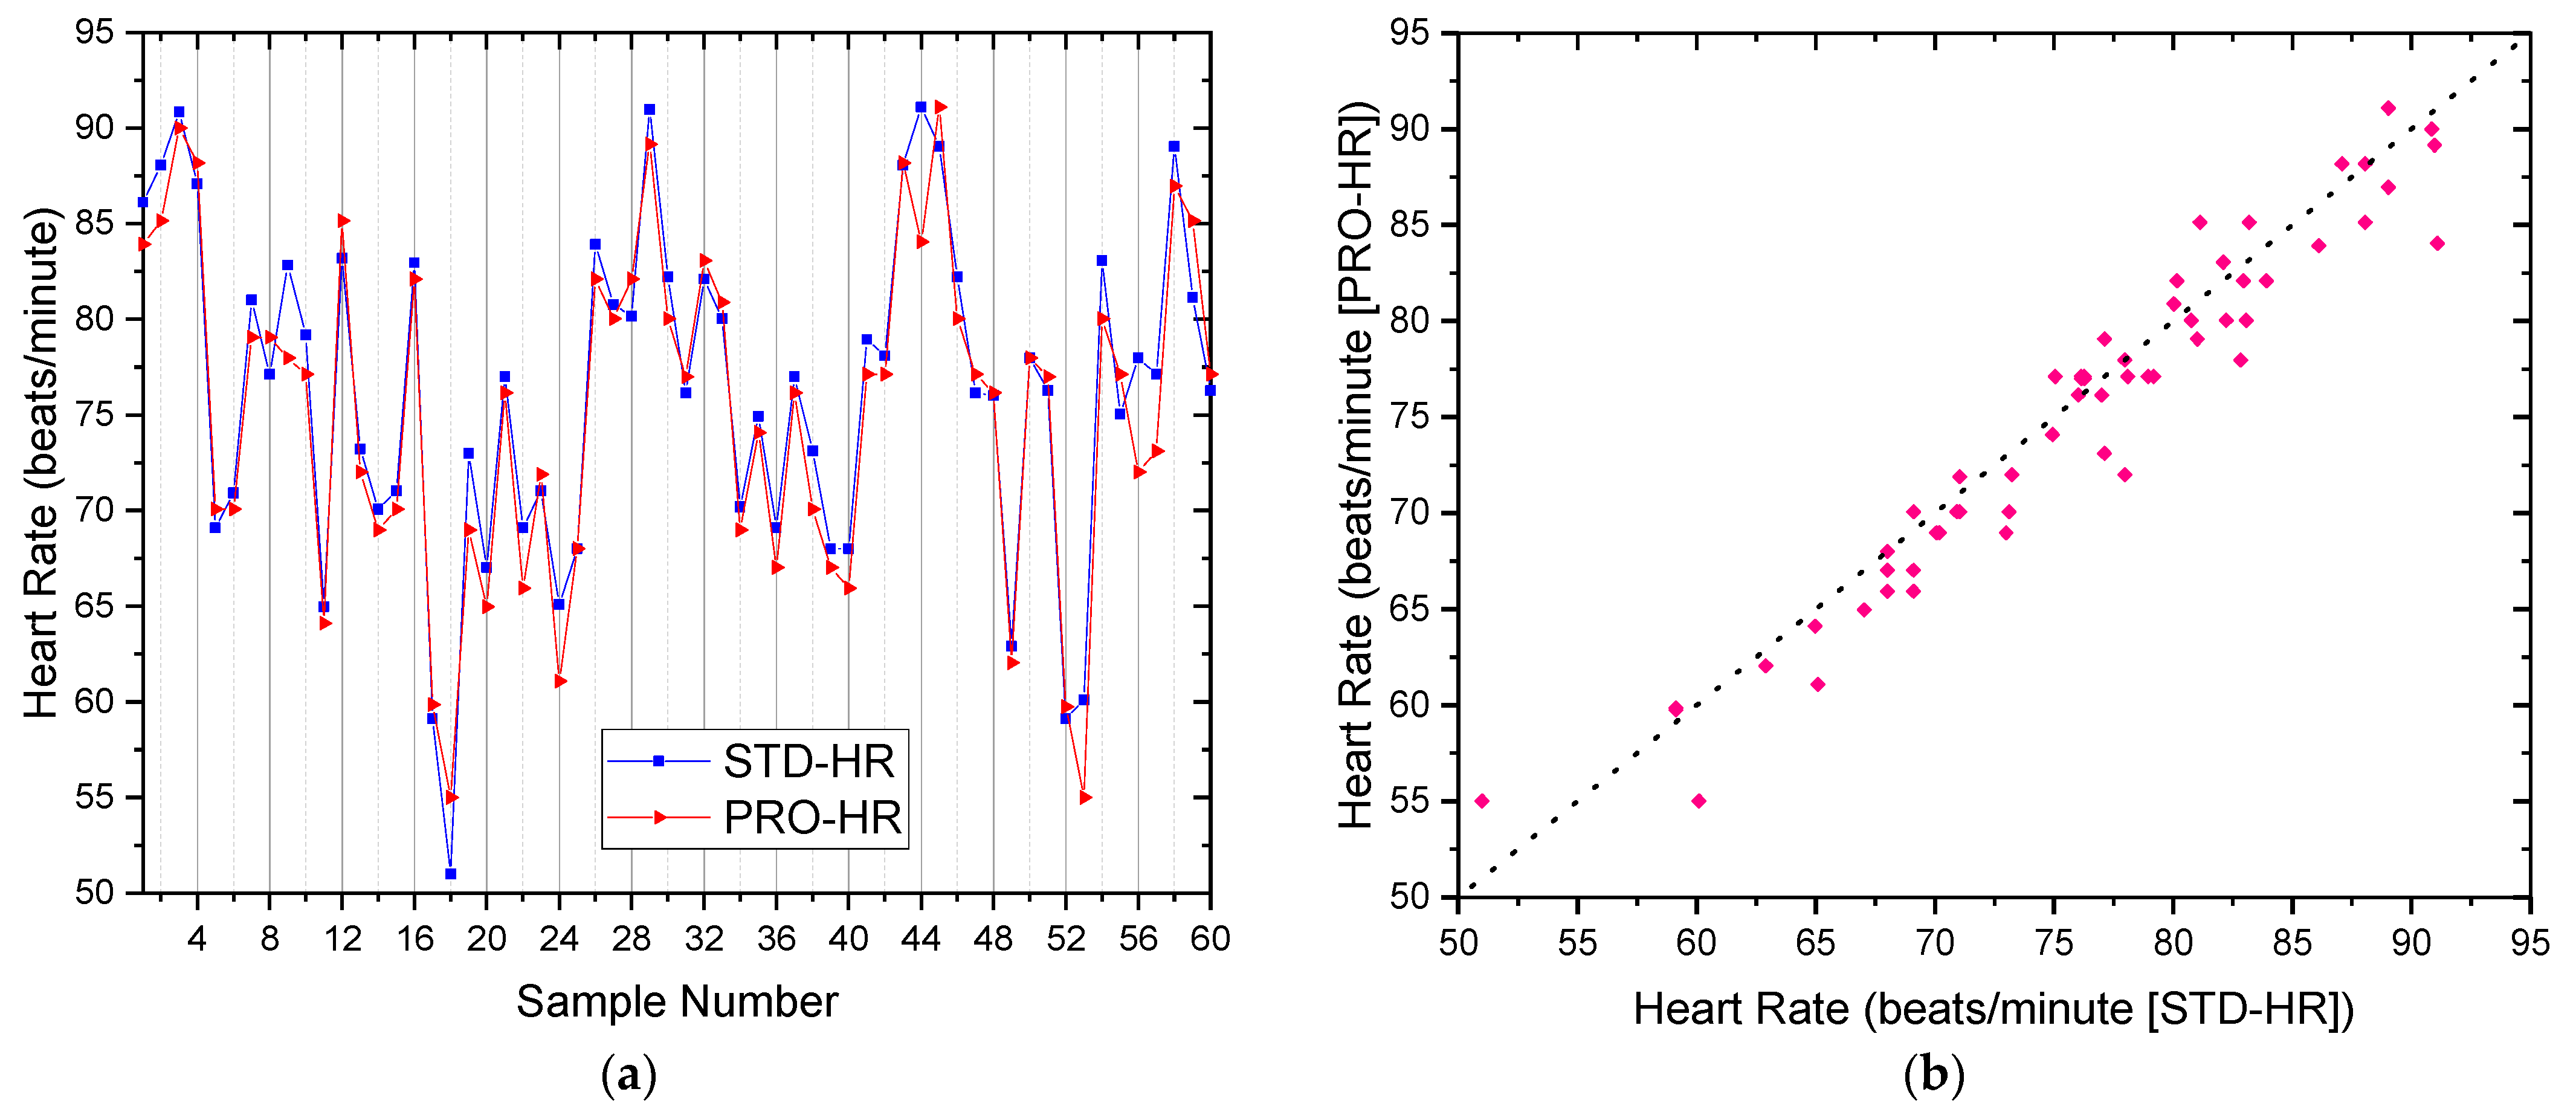
| Mean | Std Dev | Std Err | ||||
|---|---|---|---|---|---|---|
| N | STD-HR (Beat/m) | PRO-HR (Beat/m) | STD-HR (Beat/m) | PRO-HR (Beat/m) | STD-HR | PRO-HR |
| 60 | 76.12 | 75.17 | 8.73 | 8.70 | 1.23 | 1.12 |
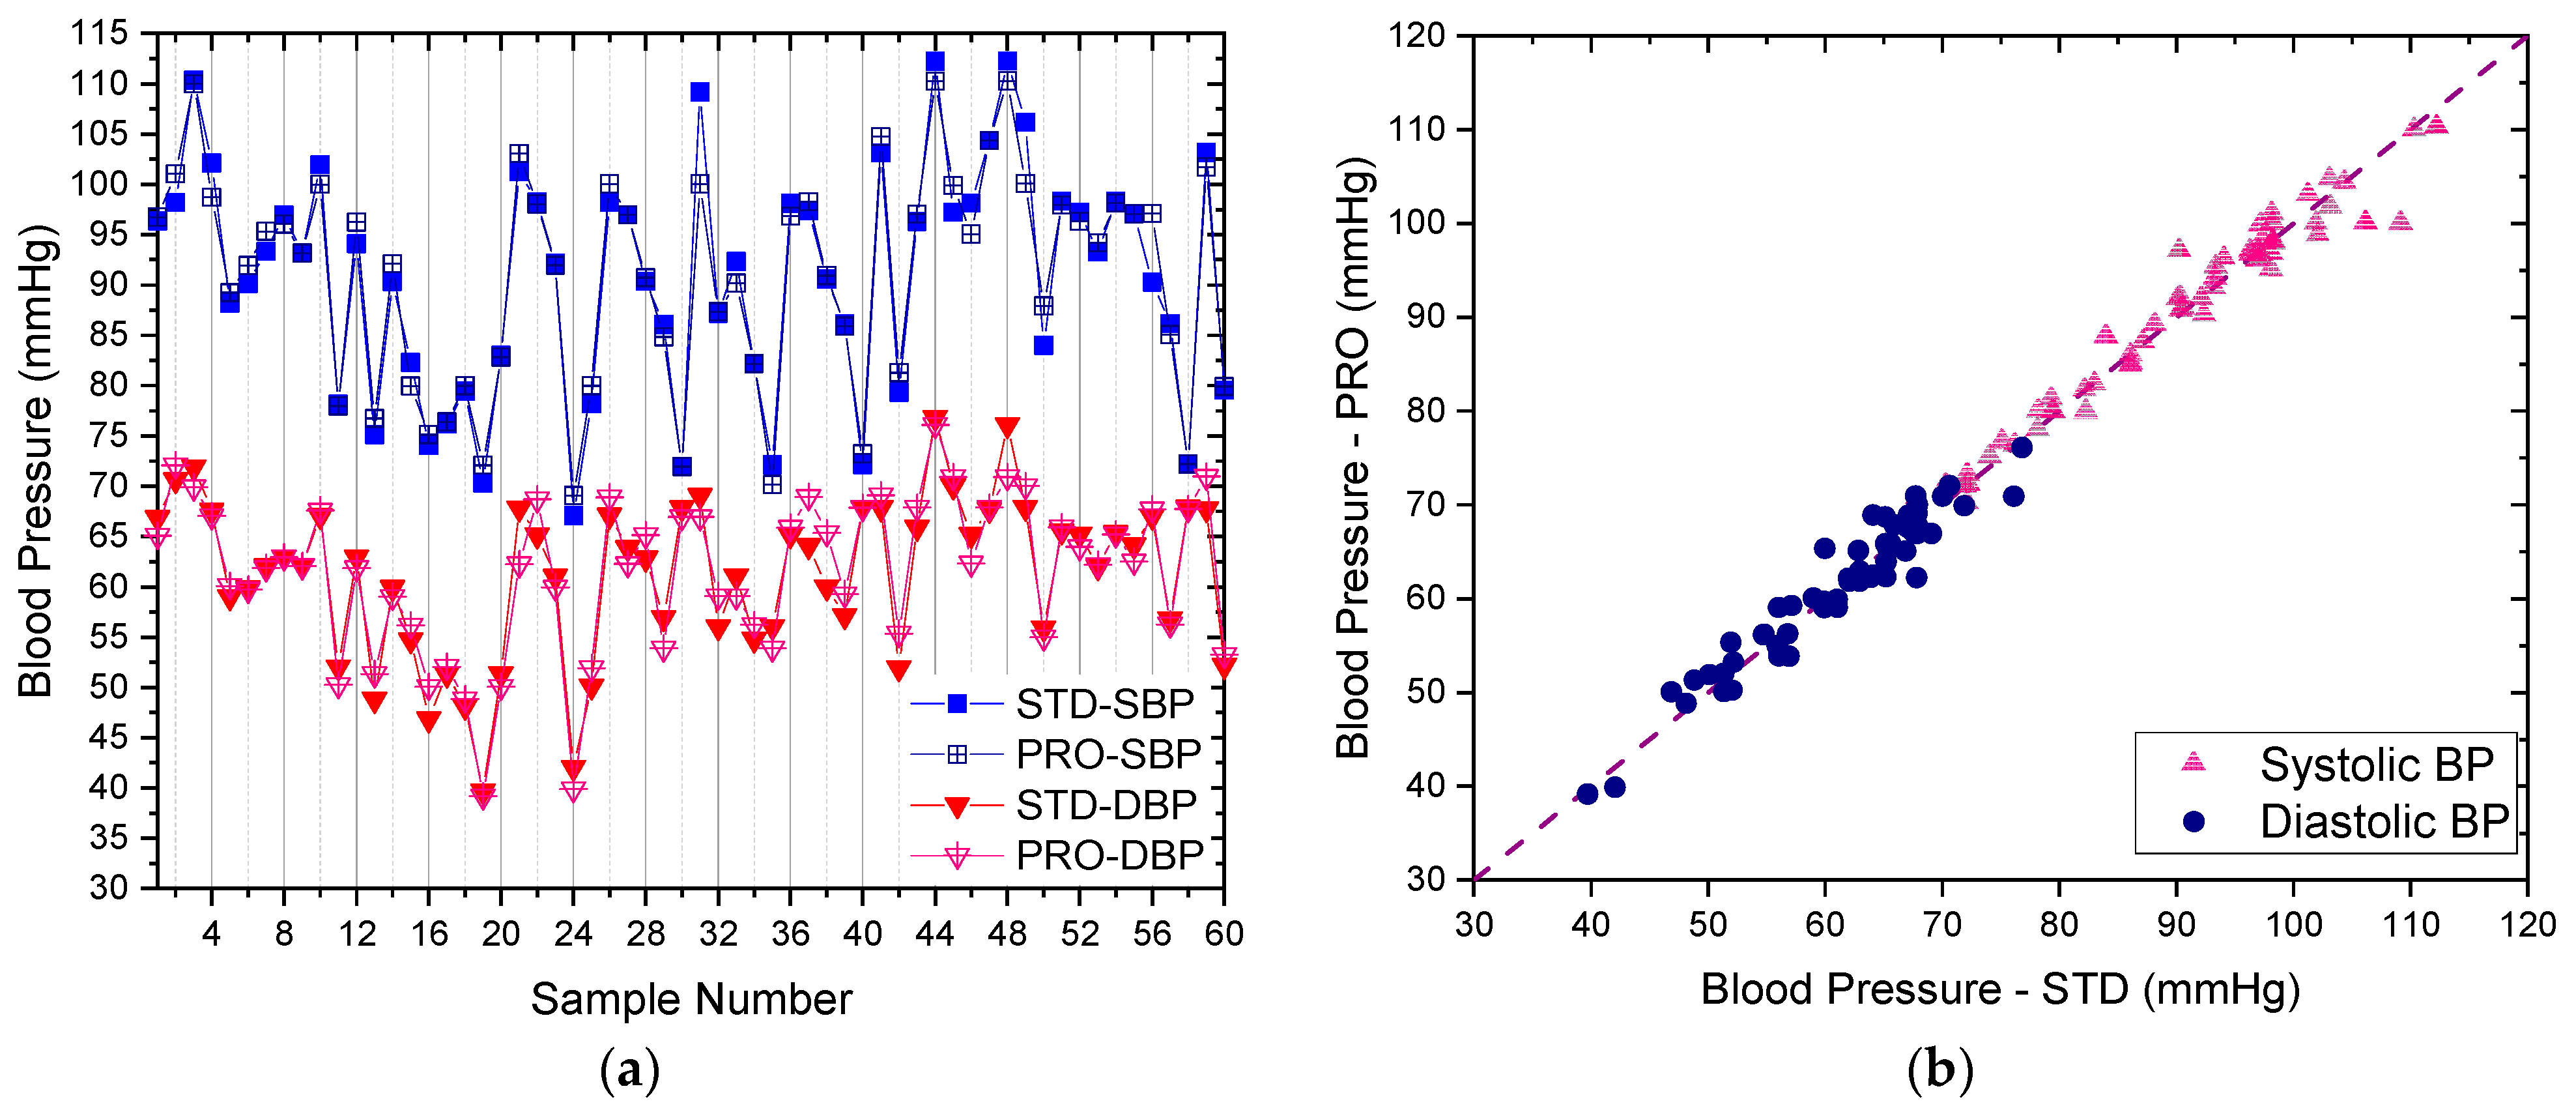
| Mean | Std Dev | Std Err | ||||||||||
|---|---|---|---|---|---|---|---|---|---|---|---|---|
| N | STD-SBP (mmHg) | PRO-SBP (mmHg) | STD-DBP (mmHg) | PRO-DBP (mmHg) | STD-SBP (mmHg) | PRO-SBP (mmHg) | STD-DBP (mmHg) | PRO-DBP (mmHg) | STD-SBP | PRO-SBP | STD-DBP | PRO-DBP |
| 60 | 90.63 | 90.85 | 61.37 | 61.48 | 11.35 | 10.77 | 7.88 | 7.82 | 1.46 | 1.39 | 1.02 | 1.01 |
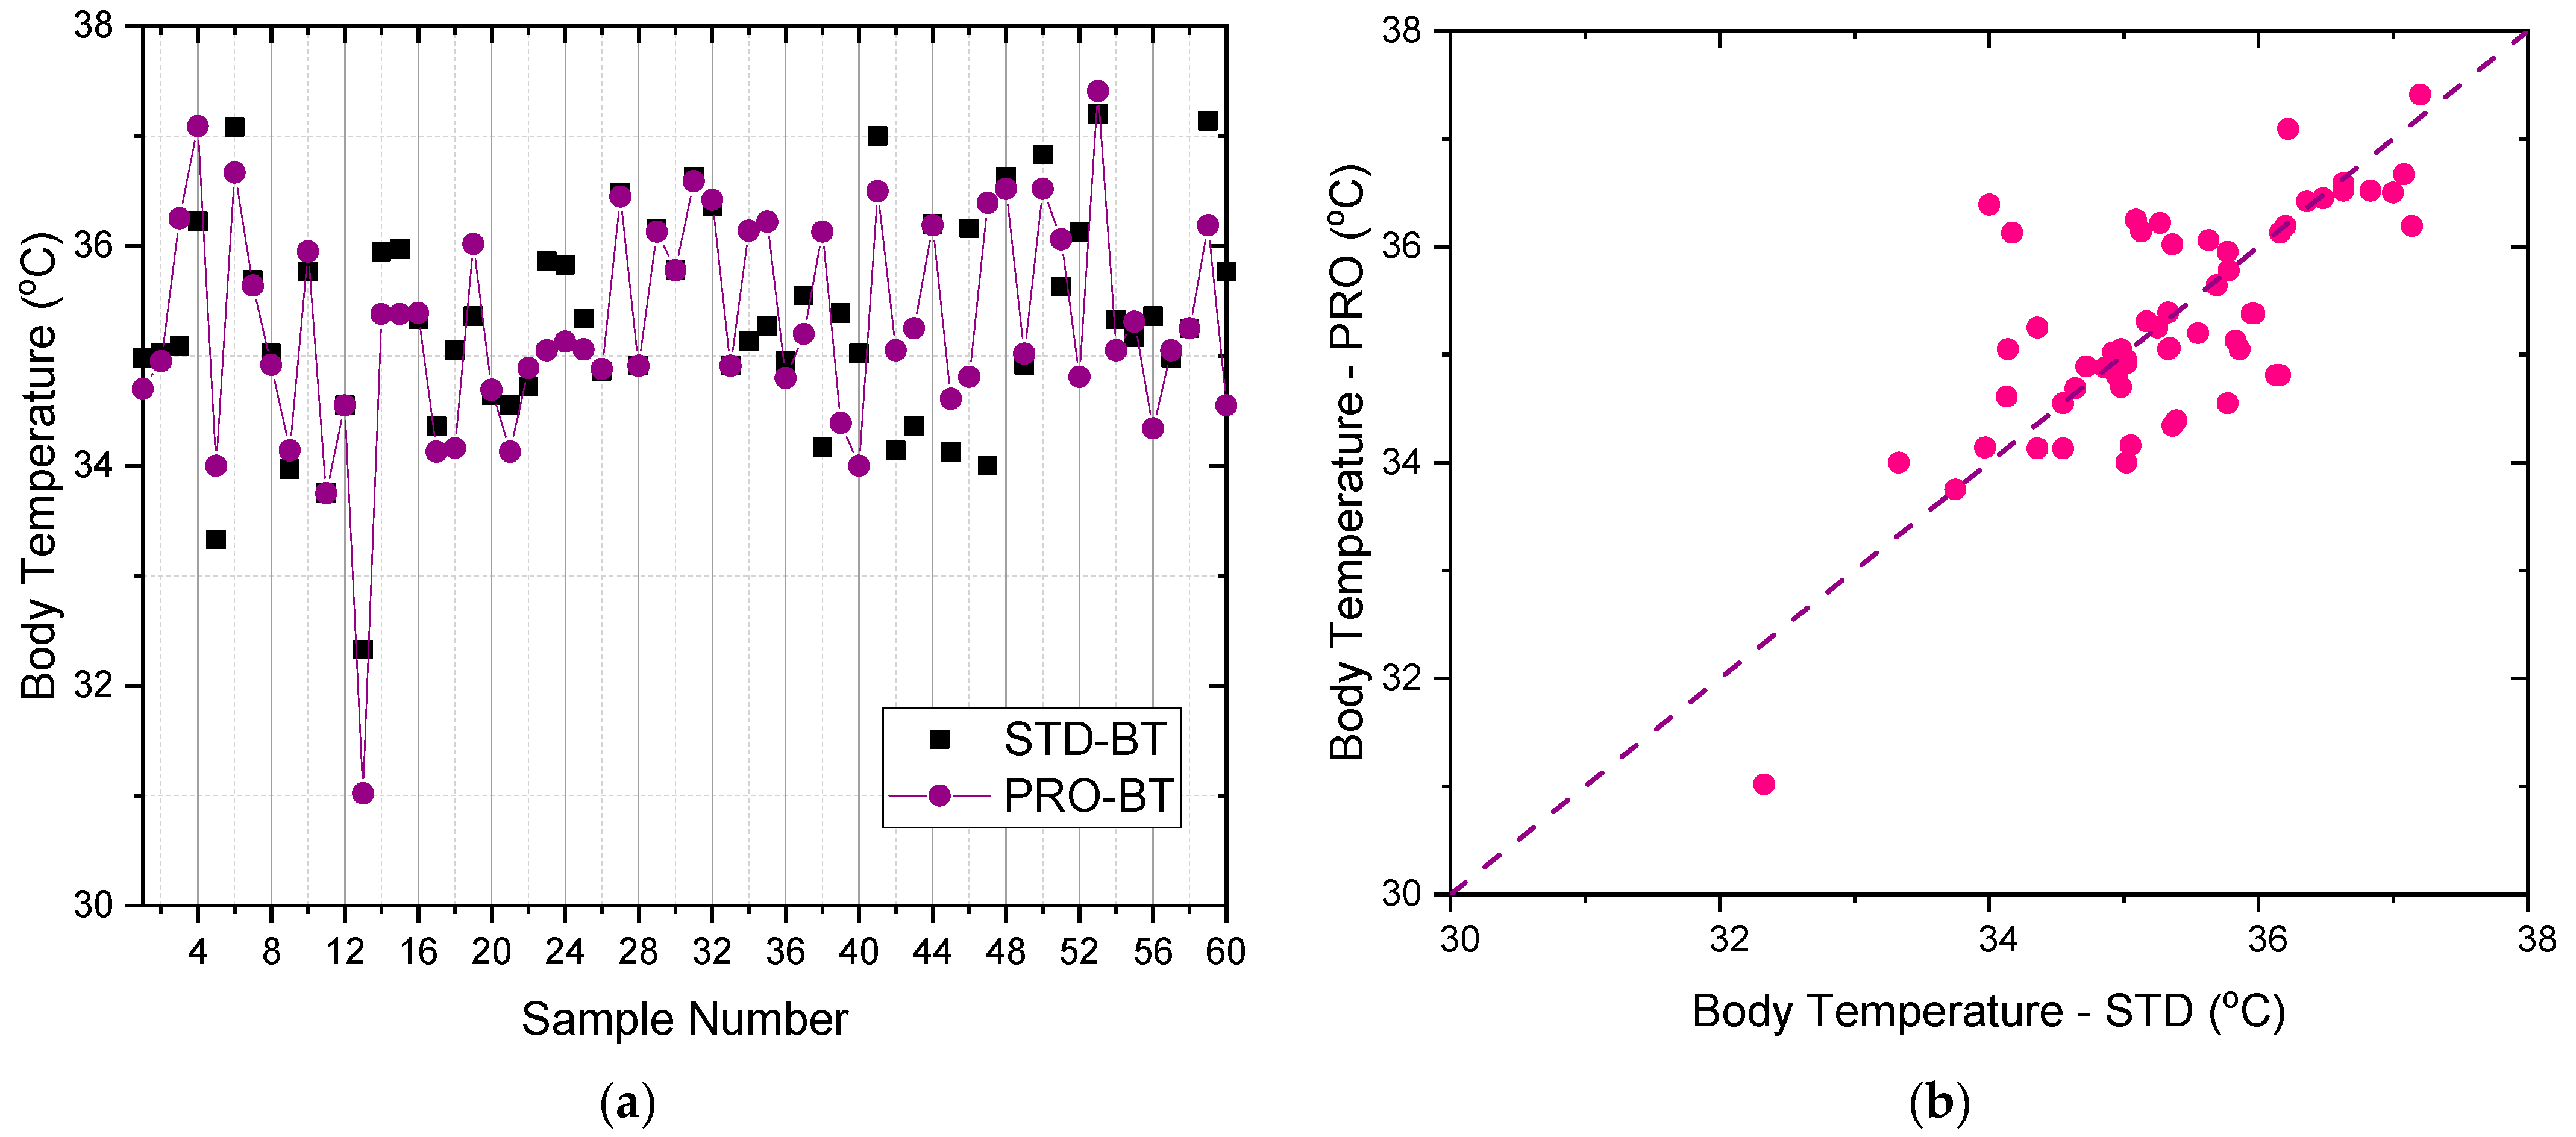
| Mean | Std Dev | Std Err | ||||
|---|---|---|---|---|---|---|
| N | STD-BT (°C) | PRO-BT (°C) | STD-BT (°C) | PRO-BT (°C) | STD-BT | PRO-BT |
| 60 | 35.31 | 35.27 | 0.96 | 1.03 | 0.12 | 0.13 |
| Healthcare Features | Apple Watch Series 6 | Apple Watch Series 5 | Proposed Watch |
|---|---|---|---|
| Size (mm) | 44/40 | 44/40 | 60 |
| Heart Rate | ✓ | ✓ | ✓ |
| Body Temperature | x | x | ✓ |
| Blood Pressure | x | x | ✓ |
| SpO2 | ✓ | x | x |
| Charging | Wireless | Wireless | USB |
| Battery Life | 18 h | 18 h | 15 h |
| Prices (USD) | Start +400 | Start +400 | 30 |
Publisher’s Note: MDPI stays neutral with regard to jurisdictional claims in published maps and institutional affiliations. |
© 2021 by the authors. Licensee MDPI, Basel, Switzerland. This article is an open access article distributed under the terms and conditions of the Creative Commons Attribution (CC BY) license (https://creativecommons.org/licenses/by/4.0/).
Share and Cite
Sakphrom, S.; Limpiti, T.; Funsian, K.; Chandhaket, S.; Haiges, R.; Thinsurat, K. Intelligent Medical System with Low-Cost Wearable Monitoring Devices to Measure Basic Vital Signals of Admitted Patients. Micromachines 2021, 12, 918. https://doi.org/10.3390/mi12080918
Sakphrom S, Limpiti T, Funsian K, Chandhaket S, Haiges R, Thinsurat K. Intelligent Medical System with Low-Cost Wearable Monitoring Devices to Measure Basic Vital Signals of Admitted Patients. Micromachines. 2021; 12(8):918. https://doi.org/10.3390/mi12080918
Chicago/Turabian StyleSakphrom, Siraporn, Thunyawat Limpiti, Krit Funsian, Srawouth Chandhaket, Rina Haiges, and Kamon Thinsurat. 2021. "Intelligent Medical System with Low-Cost Wearable Monitoring Devices to Measure Basic Vital Signals of Admitted Patients" Micromachines 12, no. 8: 918. https://doi.org/10.3390/mi12080918
APA StyleSakphrom, S., Limpiti, T., Funsian, K., Chandhaket, S., Haiges, R., & Thinsurat, K. (2021). Intelligent Medical System with Low-Cost Wearable Monitoring Devices to Measure Basic Vital Signals of Admitted Patients. Micromachines, 12(8), 918. https://doi.org/10.3390/mi12080918