
Microstructure Study of Pulsed Laser Beam Welded Oxide Dispersion-Strengthened (ODS) Eurofer Steel


Abstract
1. Introduction
2. Experimental Details
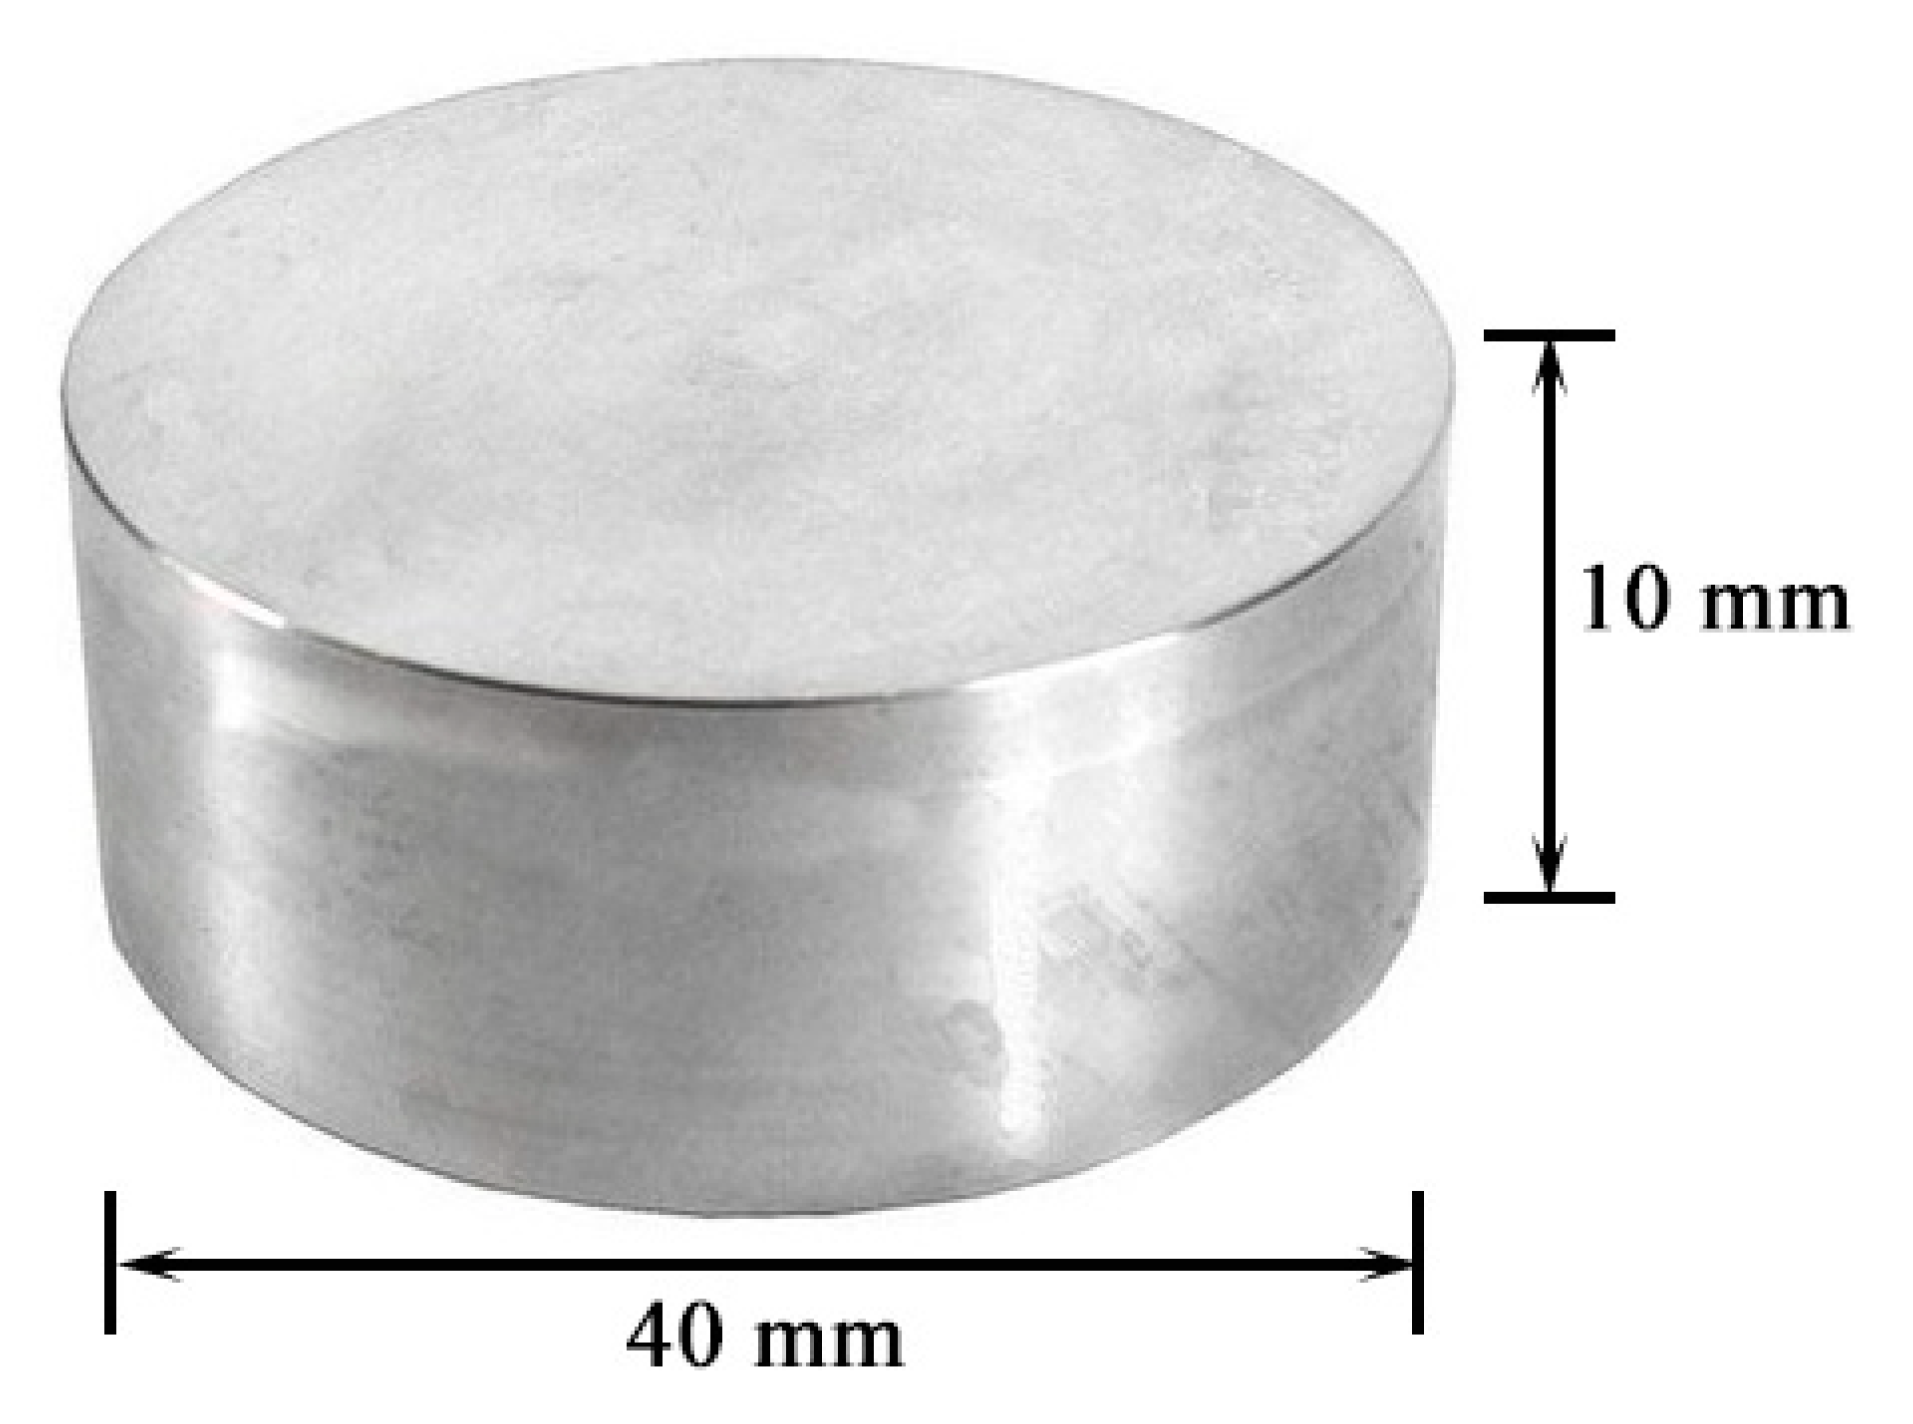
2.1. Materials
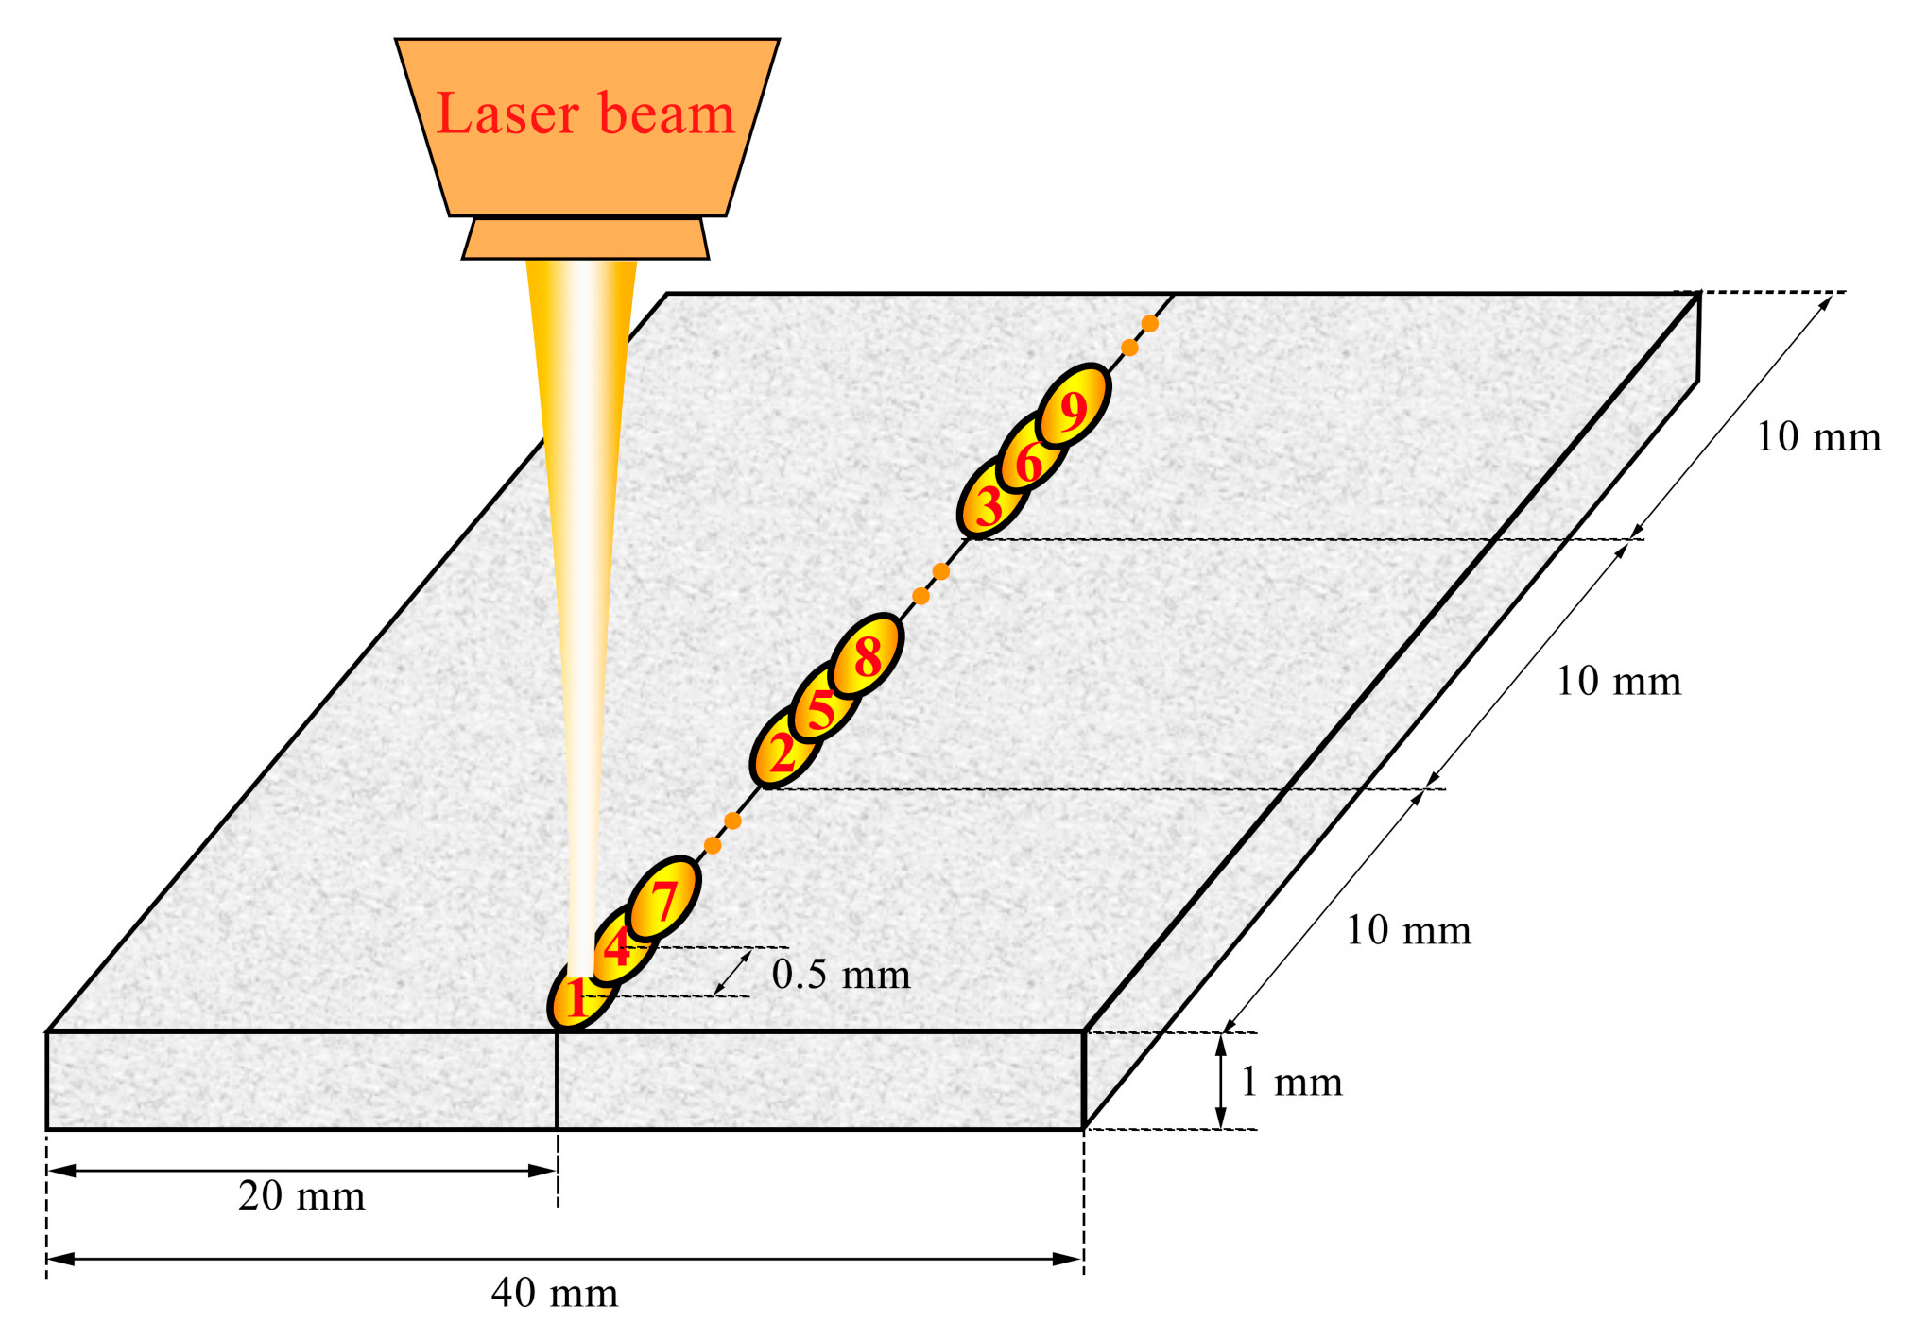
2.2. Methods
3. Results
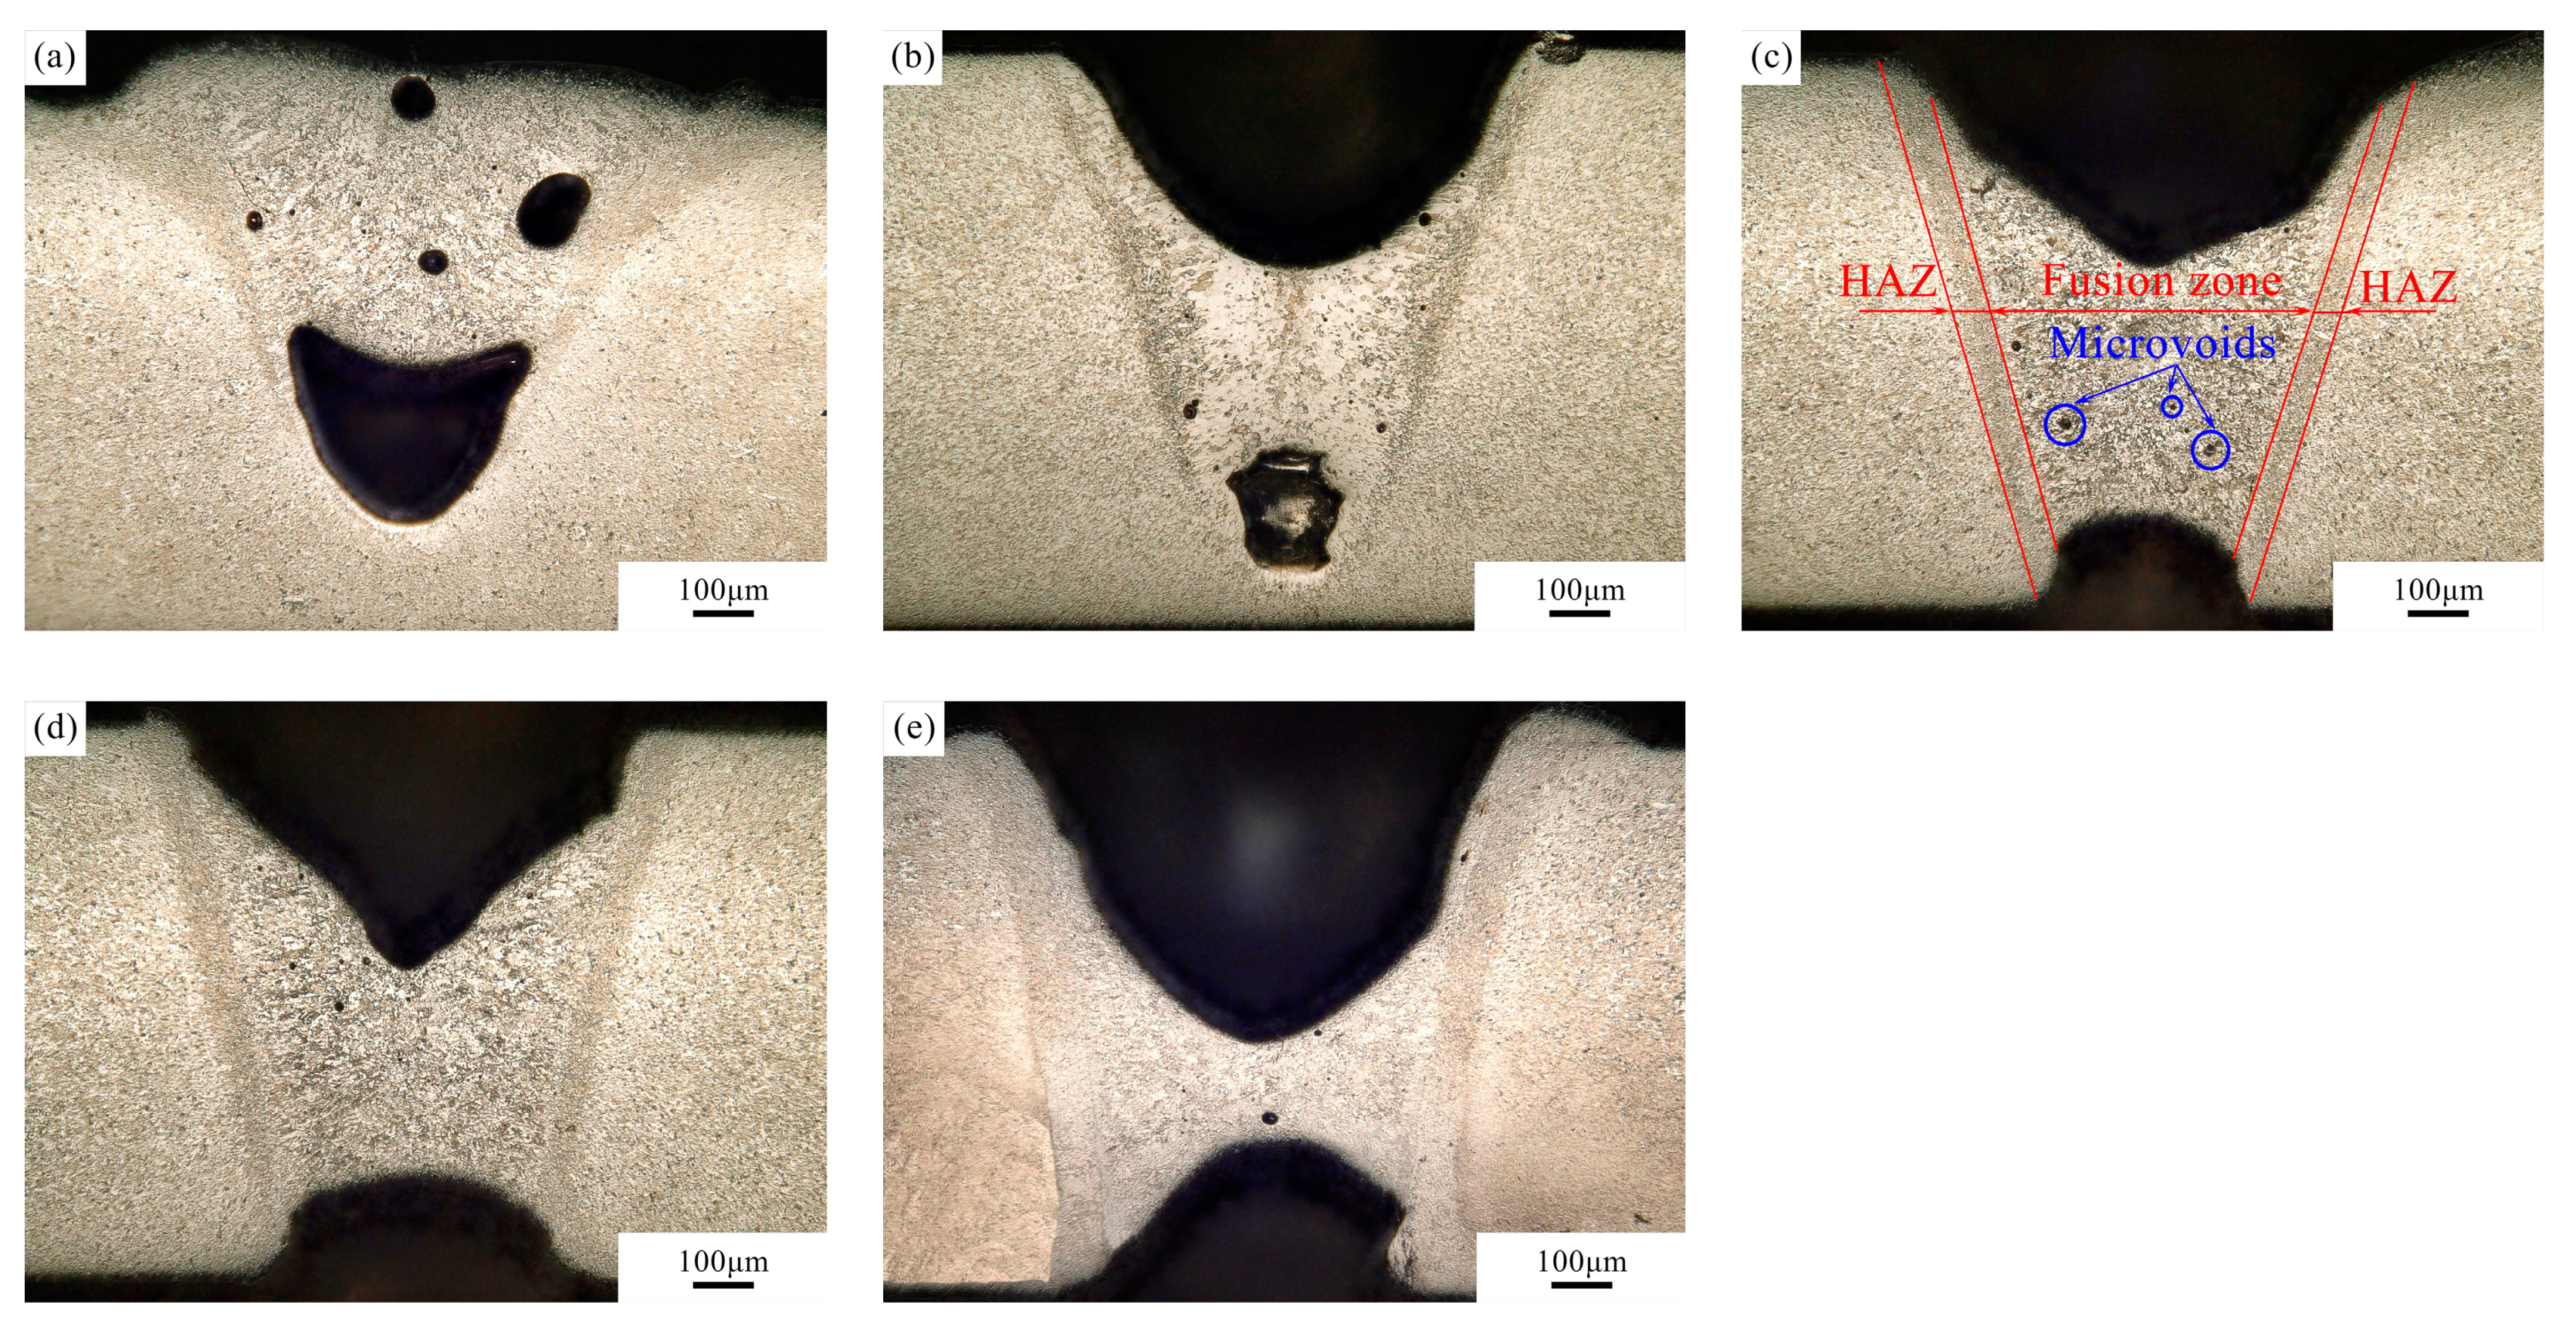
3.1. Parameter Optimisation
3.2. Microstructure Characterisation
4. Discussion
5. Conclusions
- A full penetration is necessary to obtain an open keyhole condition without trapped gas. With a laser power of 2500 W, a pulse duration of at least 3 ms is needed for a 1 mm thick sample. A longer duration may lead to excess material loss, which can be compensated by the addition of filler materials.
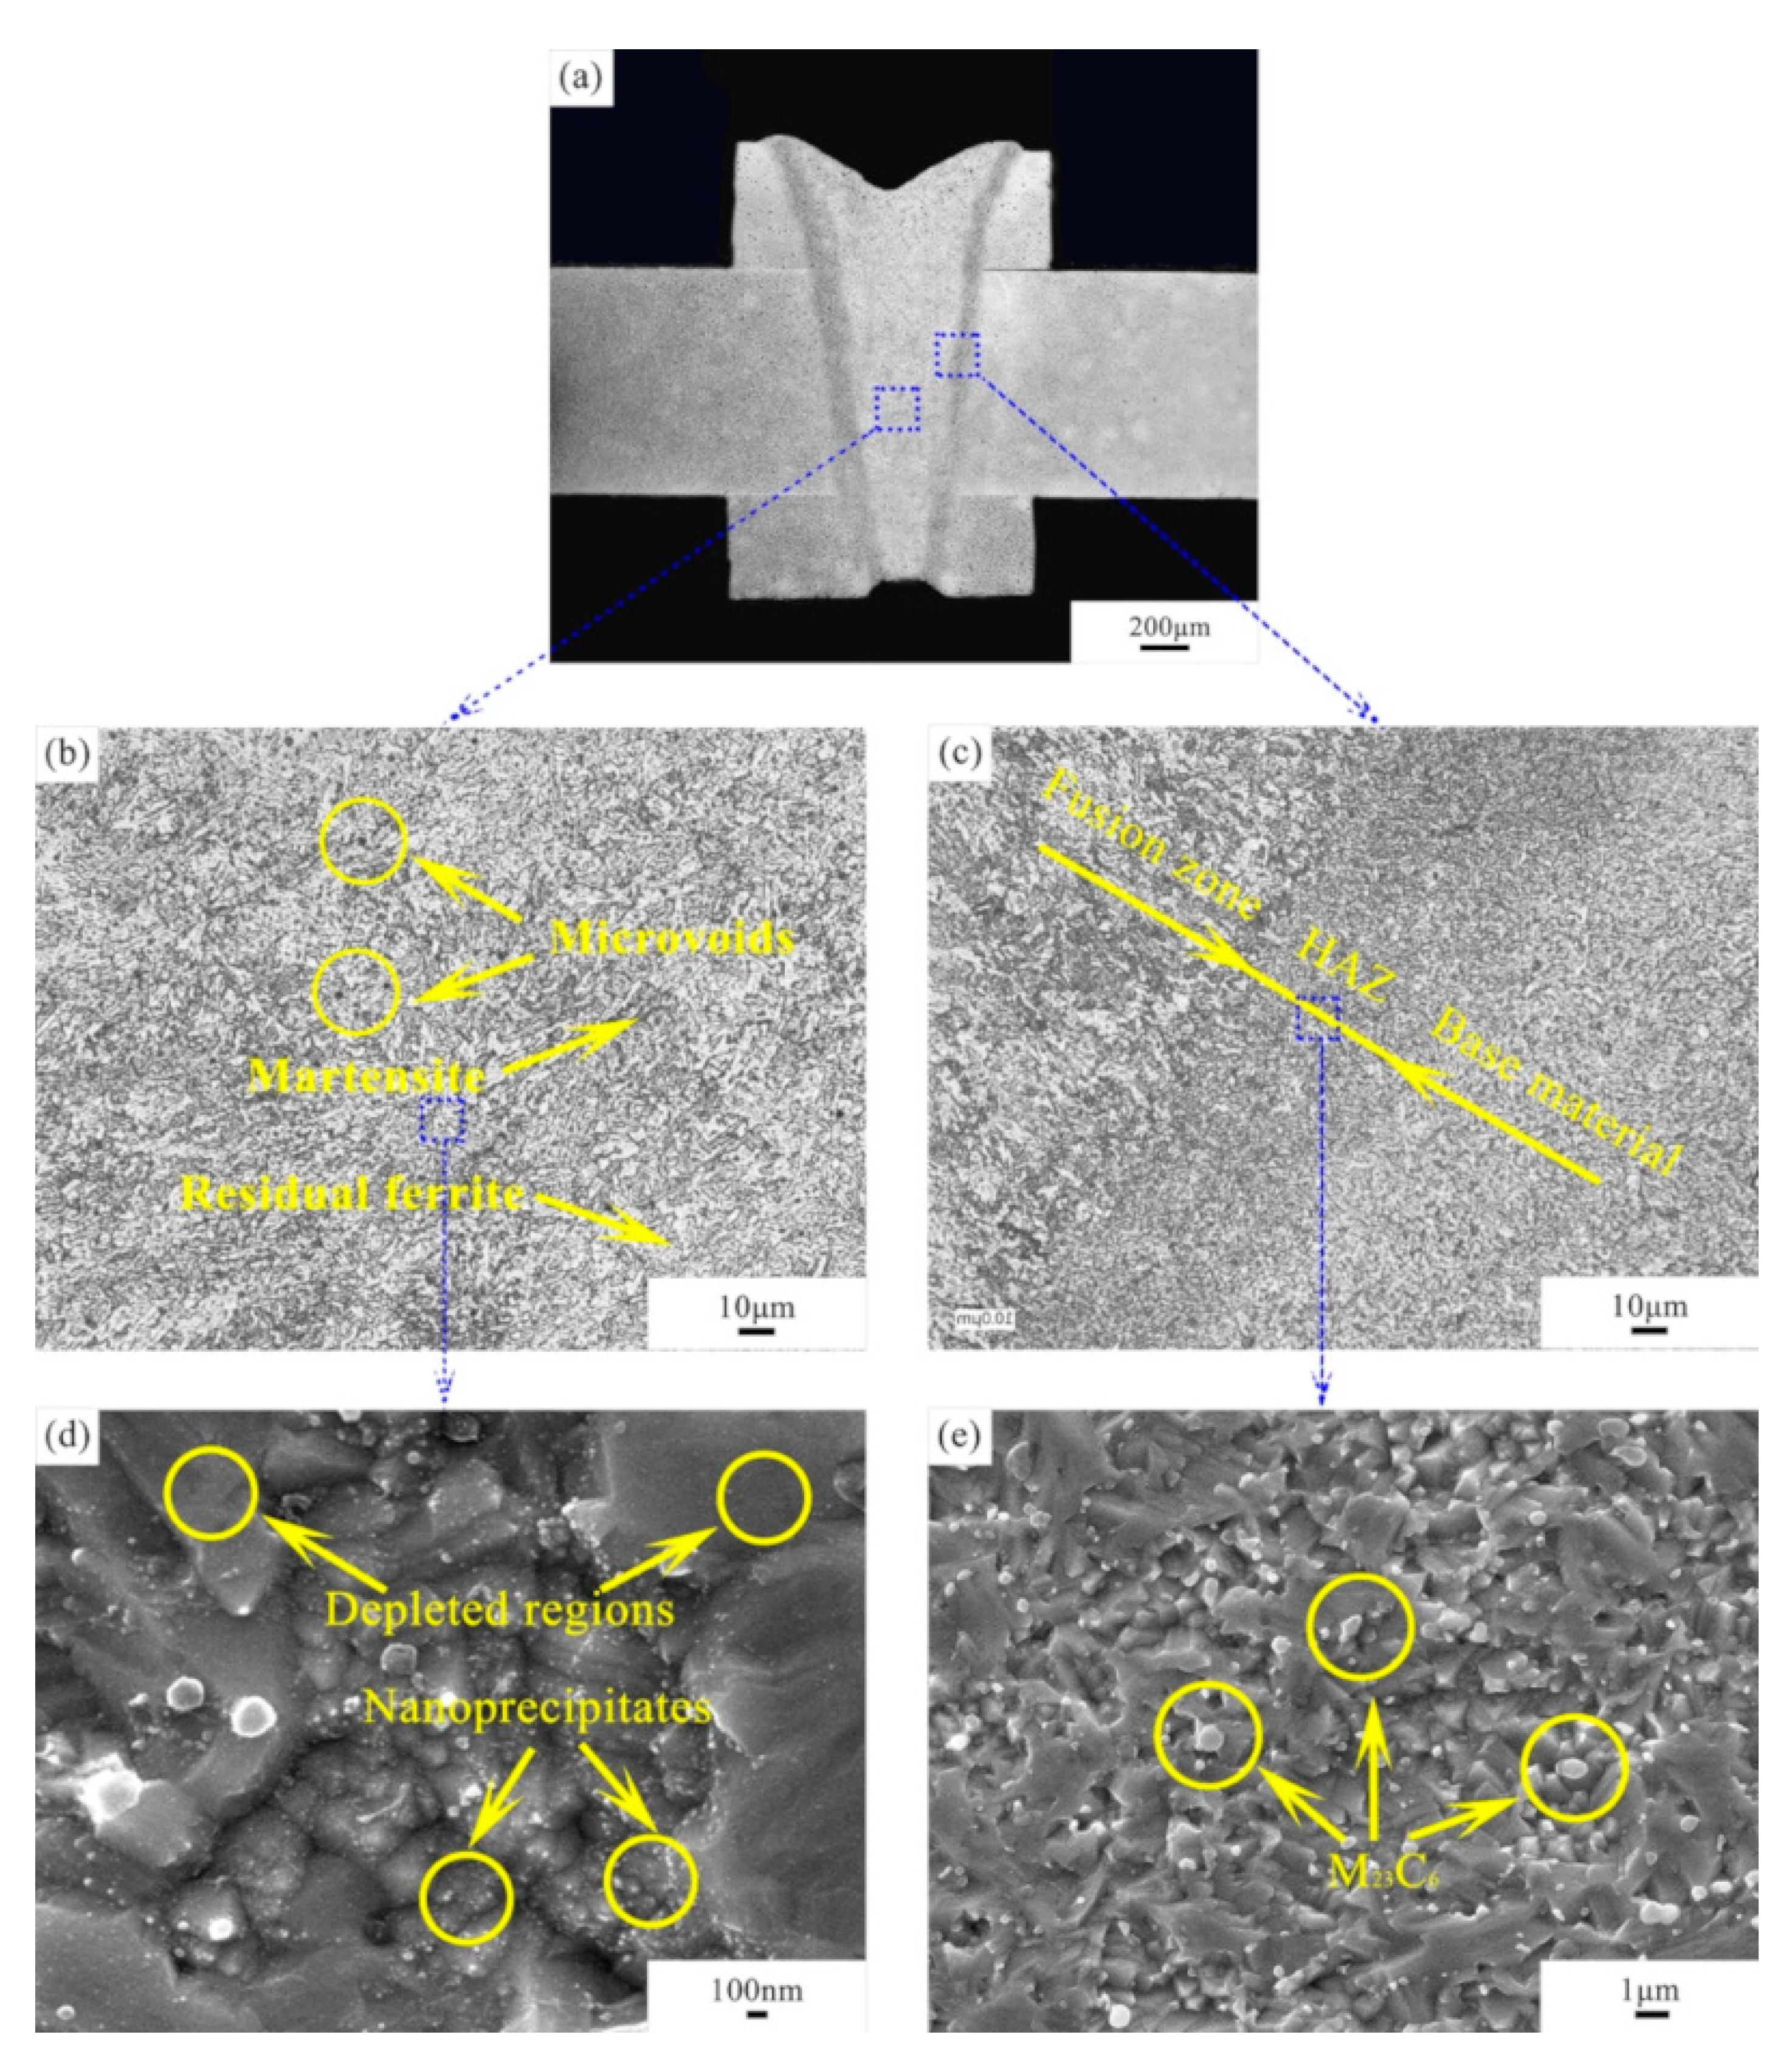
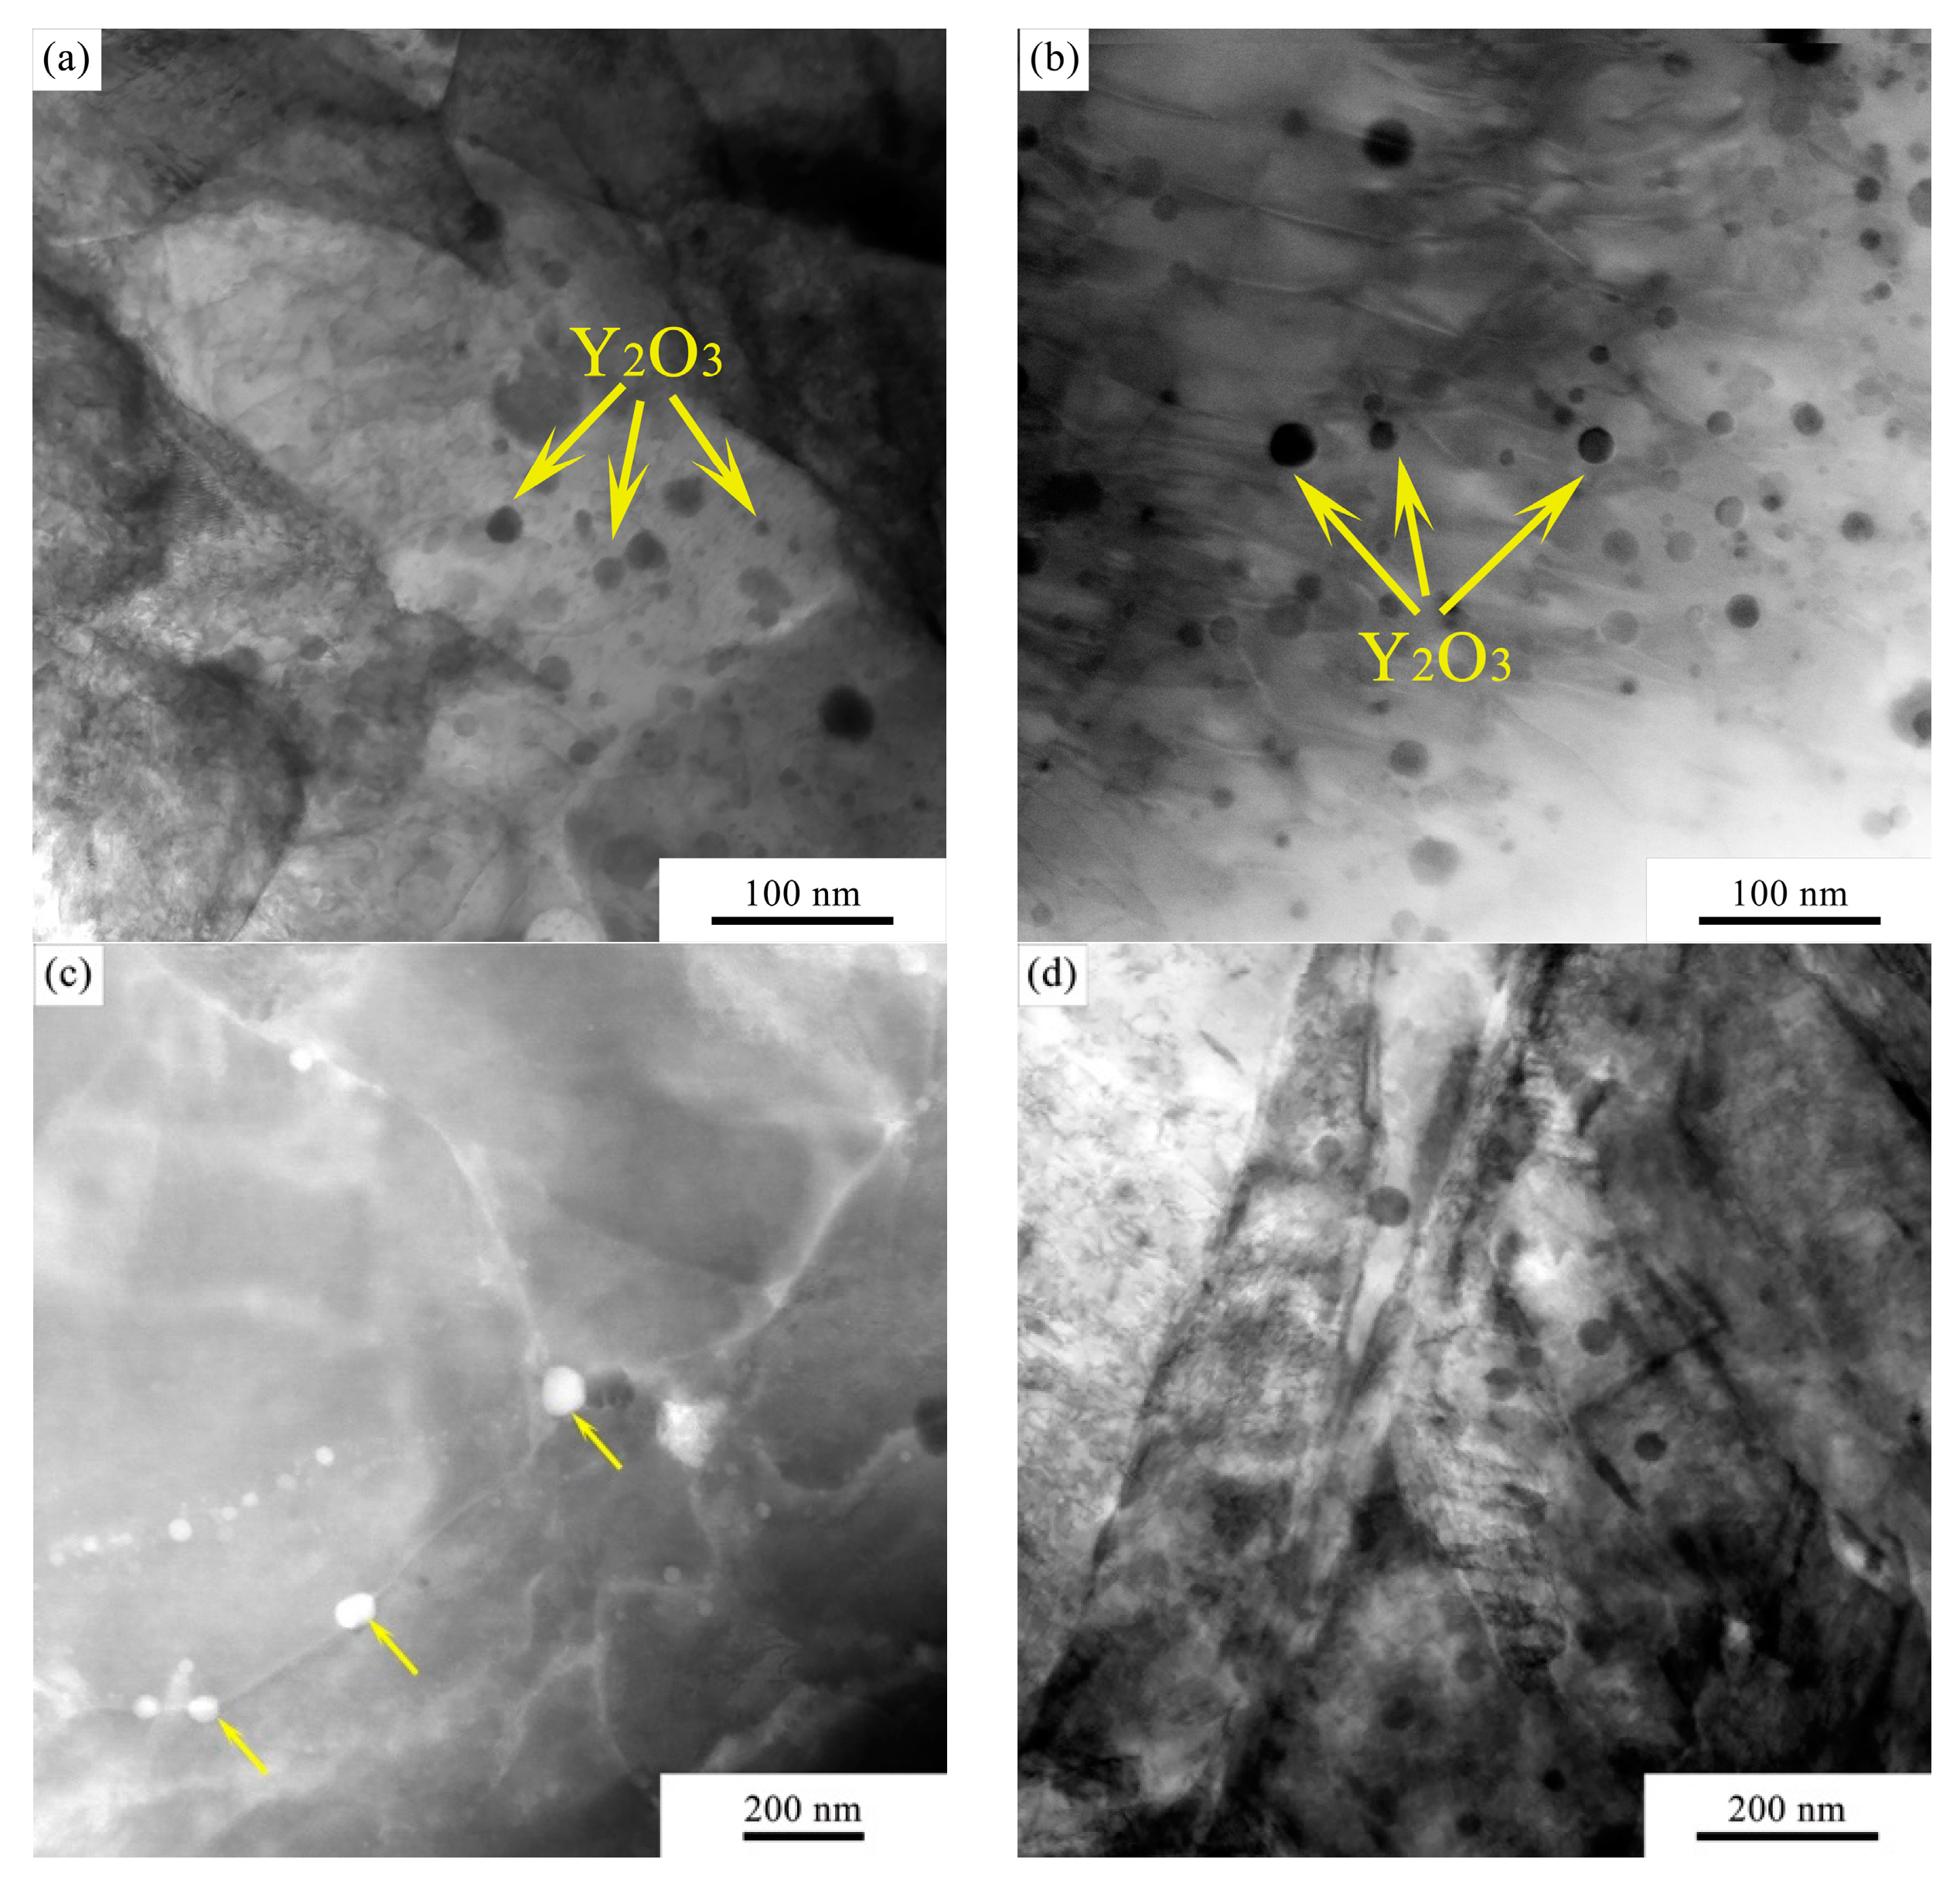
- In the as-joined condition, the fusion zone consists of elongated grains, while the HAZ has refined grains compared to the base material. M23C6 carbides are observed in the microstructure and found to be preferentially located at the grain boundaries. The nanoprecipitates are retained in the fusion zone, although they are not homogenously distributed in the steel matrix. Characterisations using small angle neutron scattering or small angle X-ray scattering could be carried out in the future to better understand the effect of laser beam welding on nanocluster behaviour.
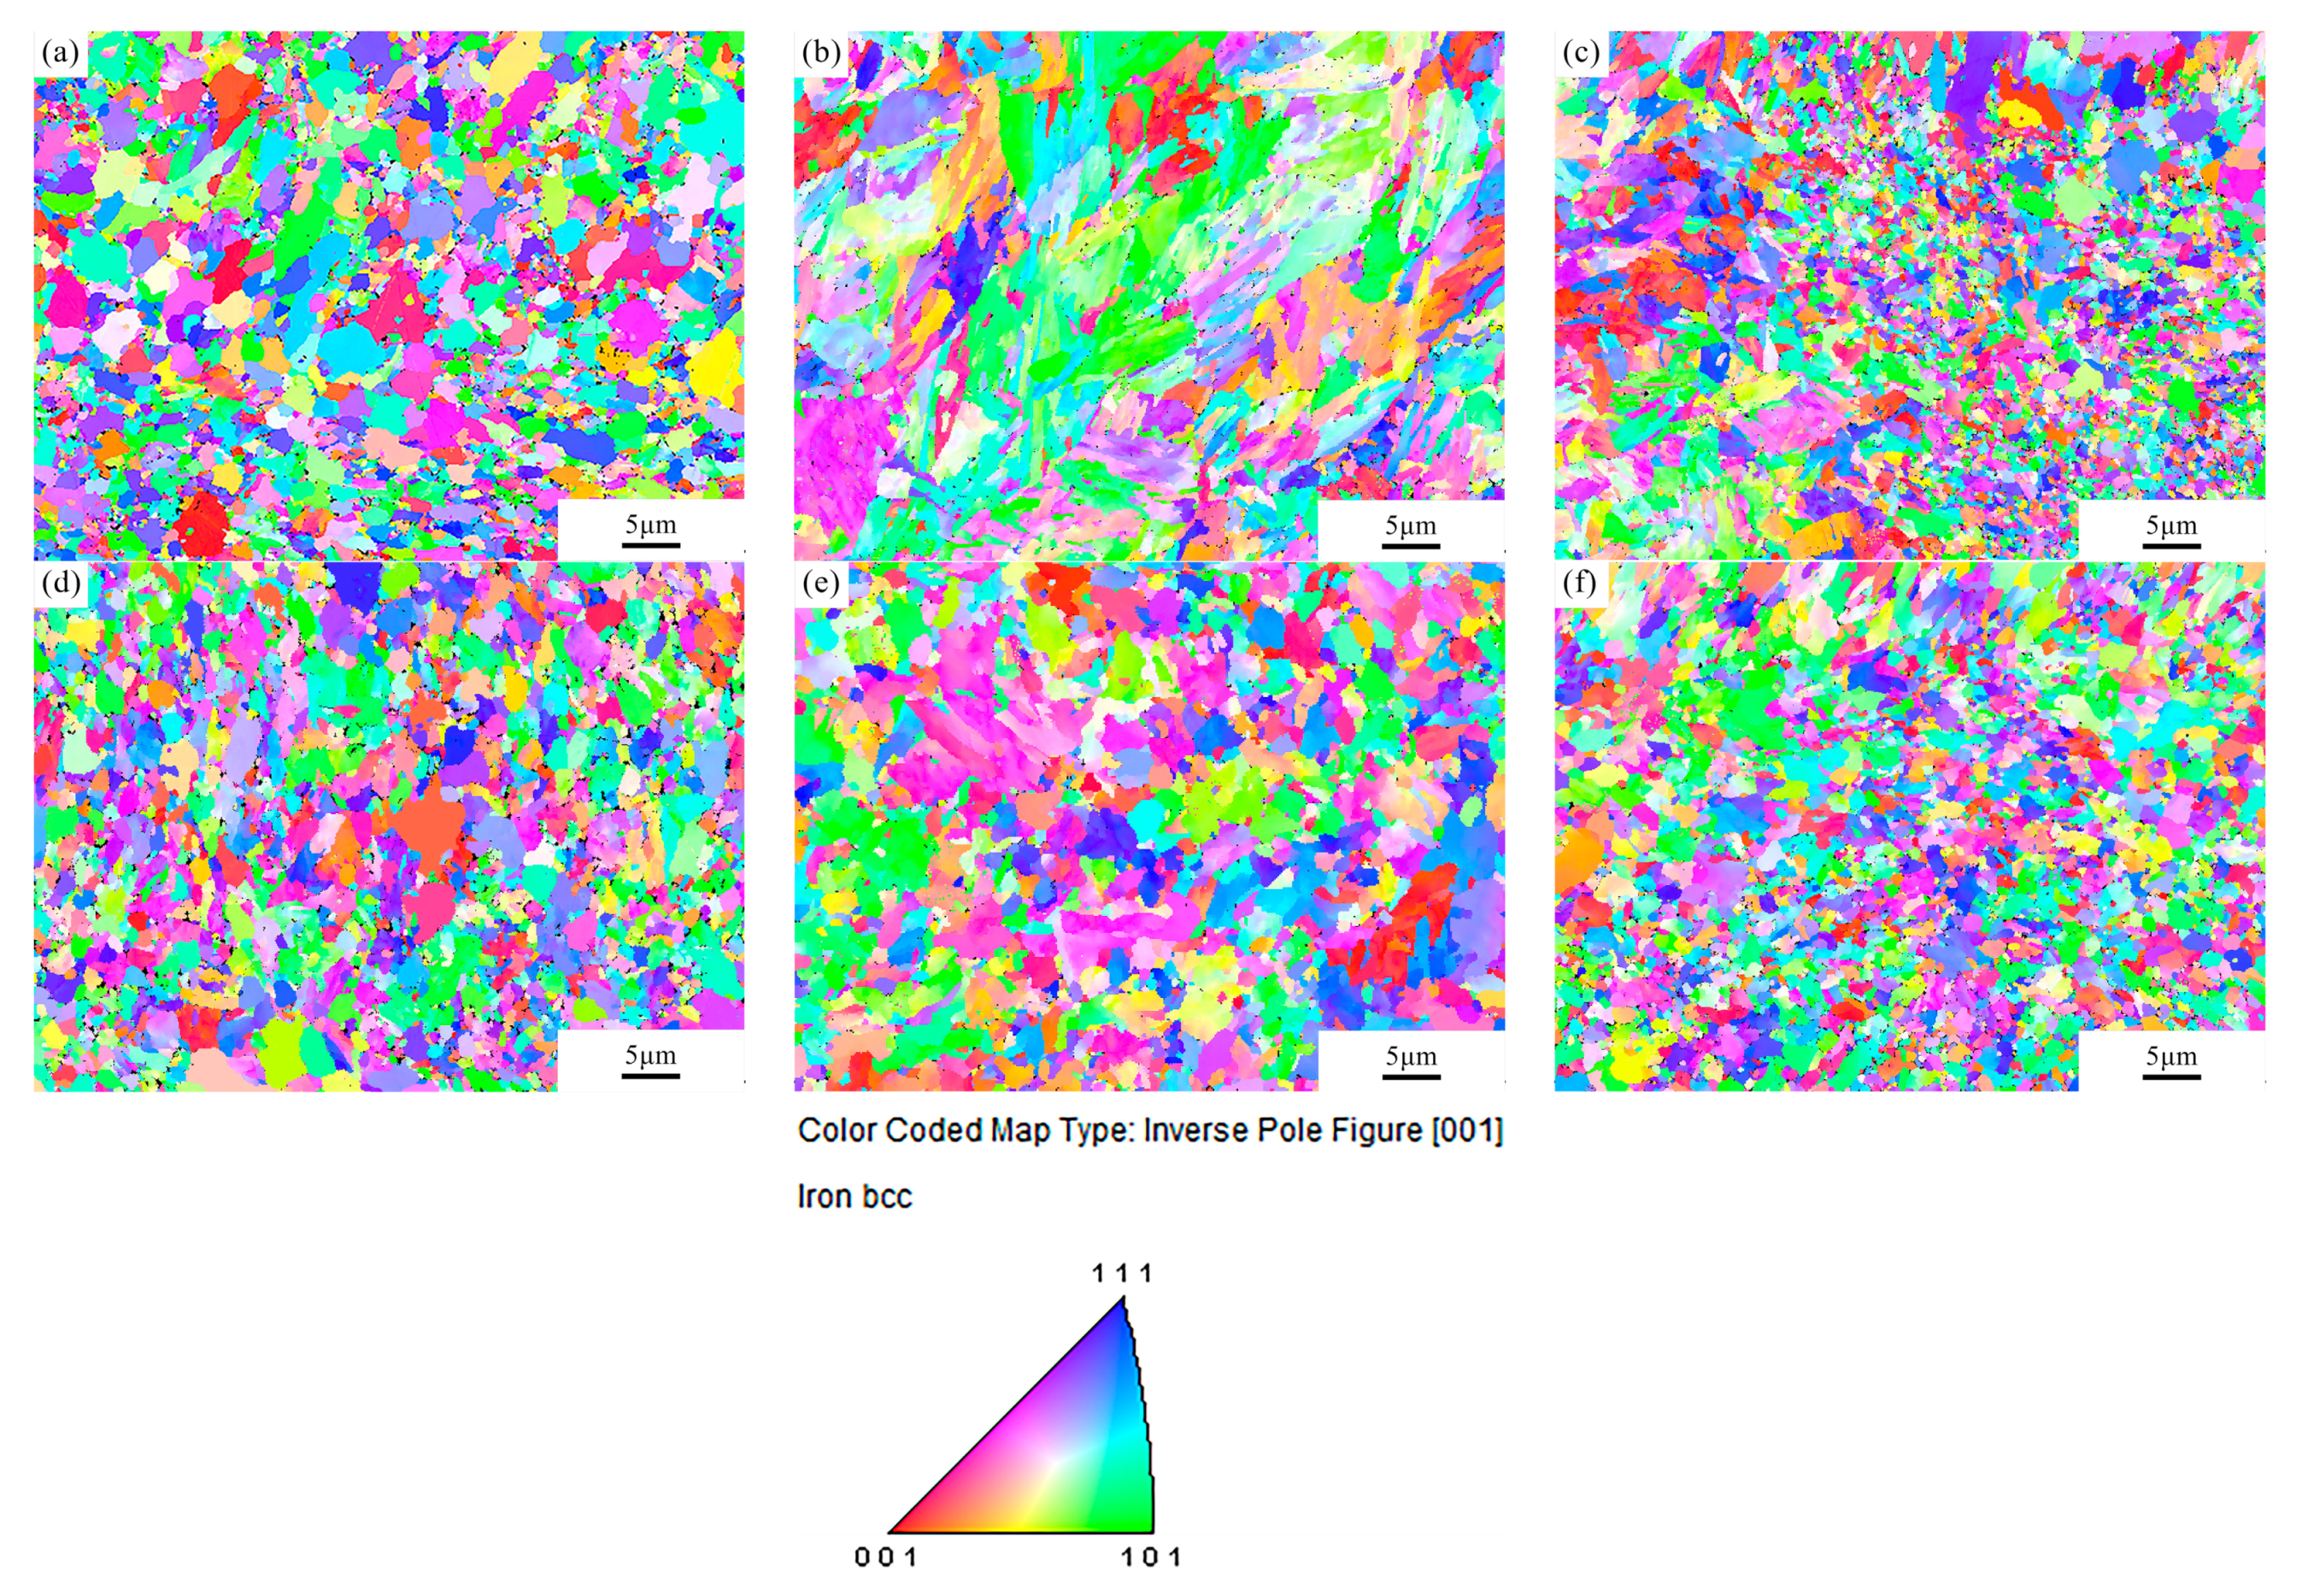
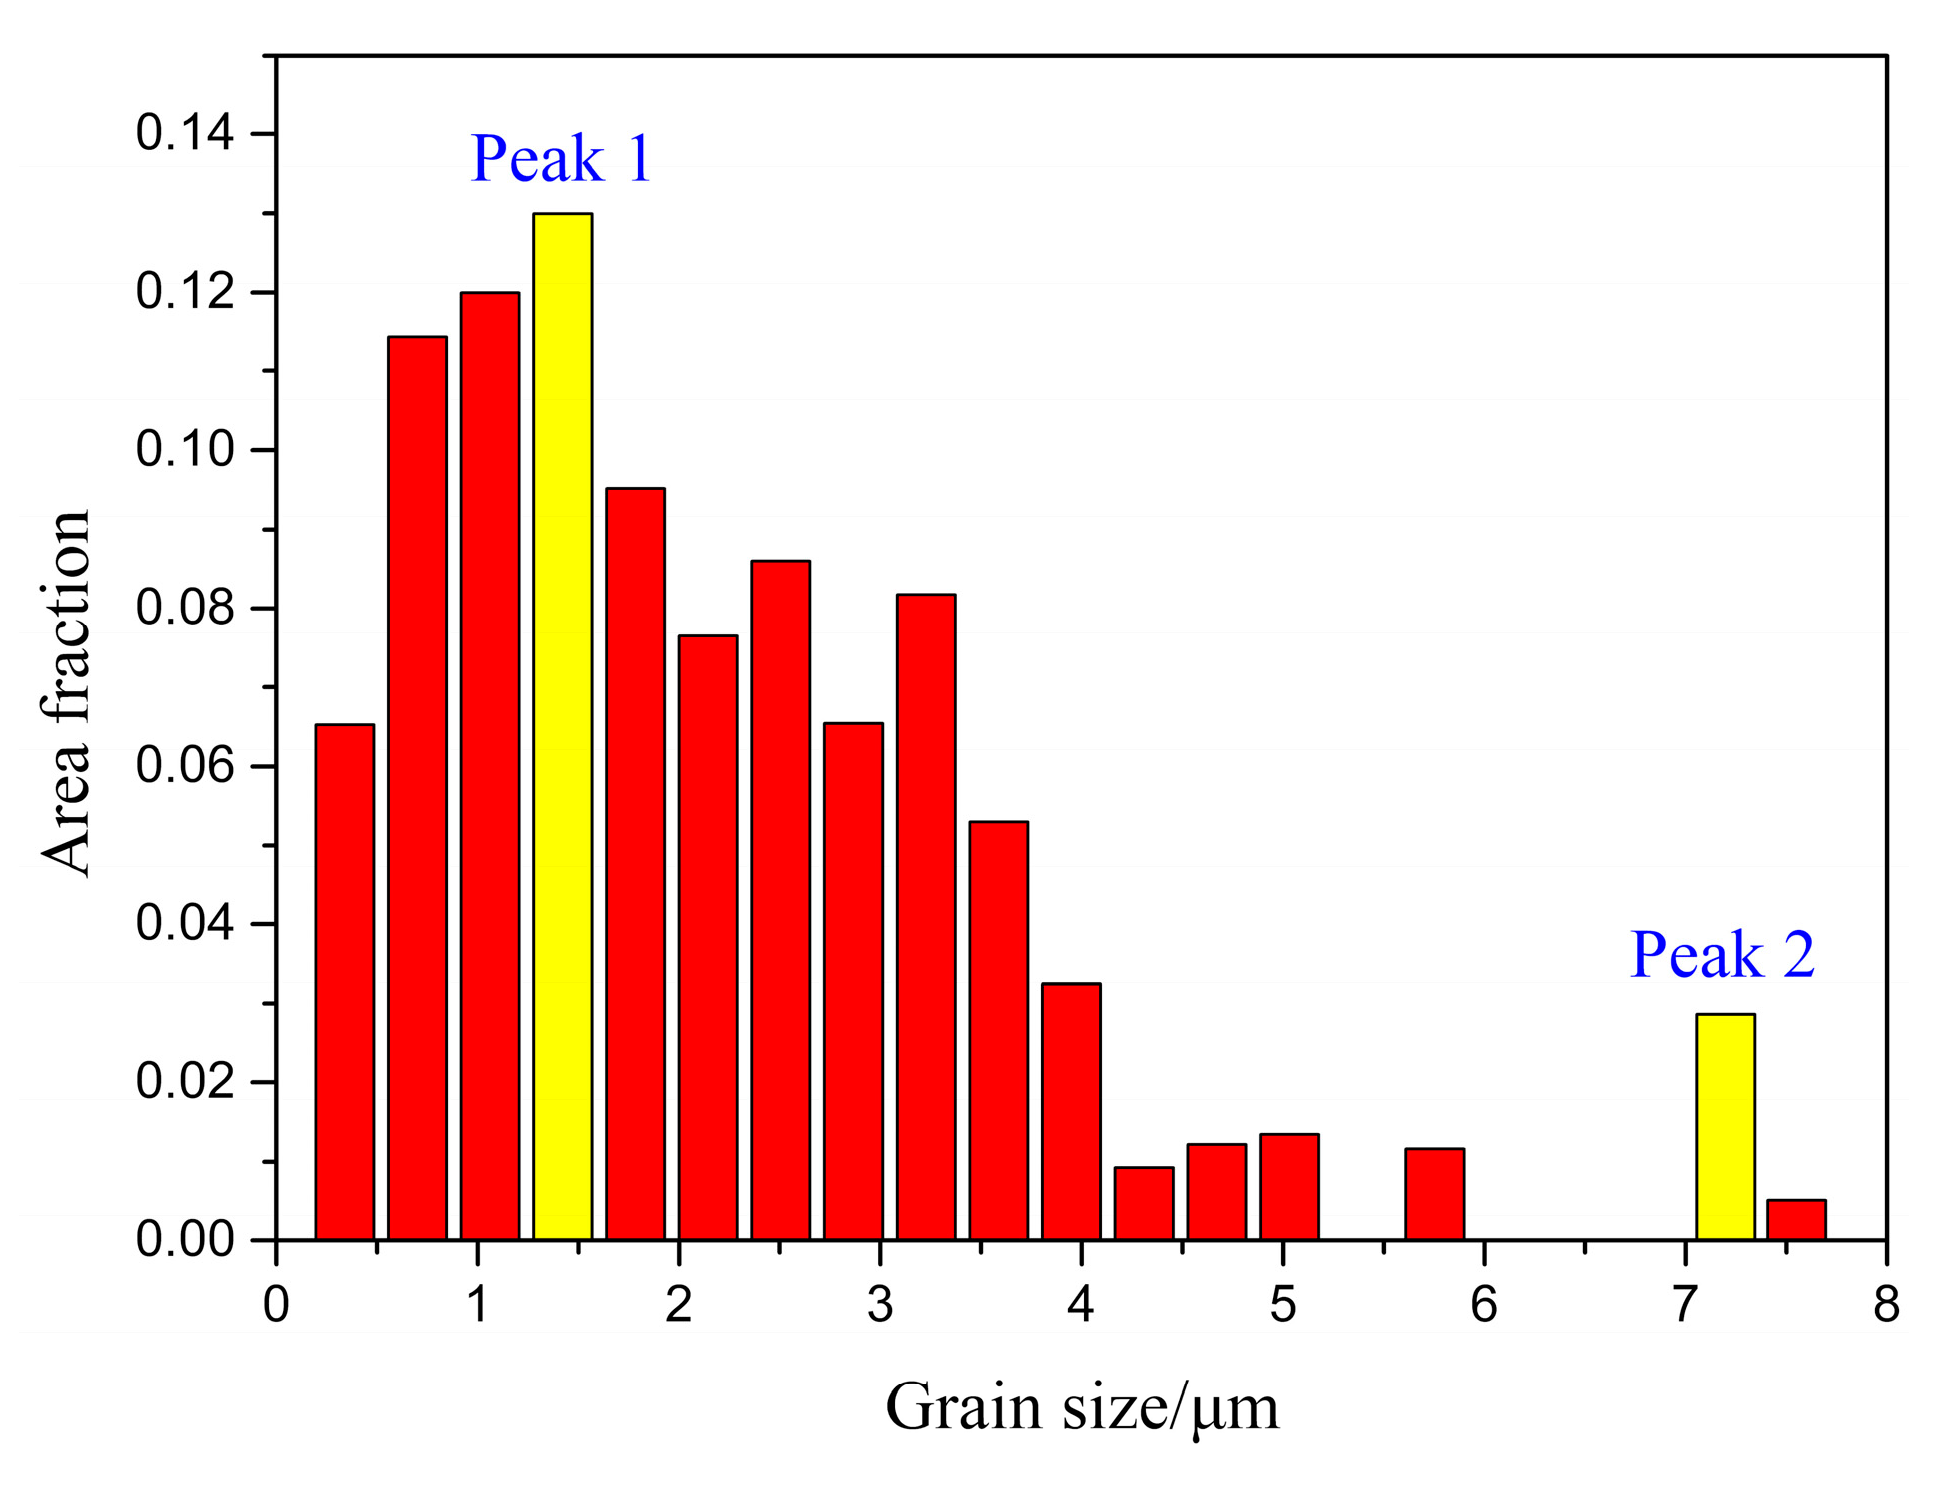
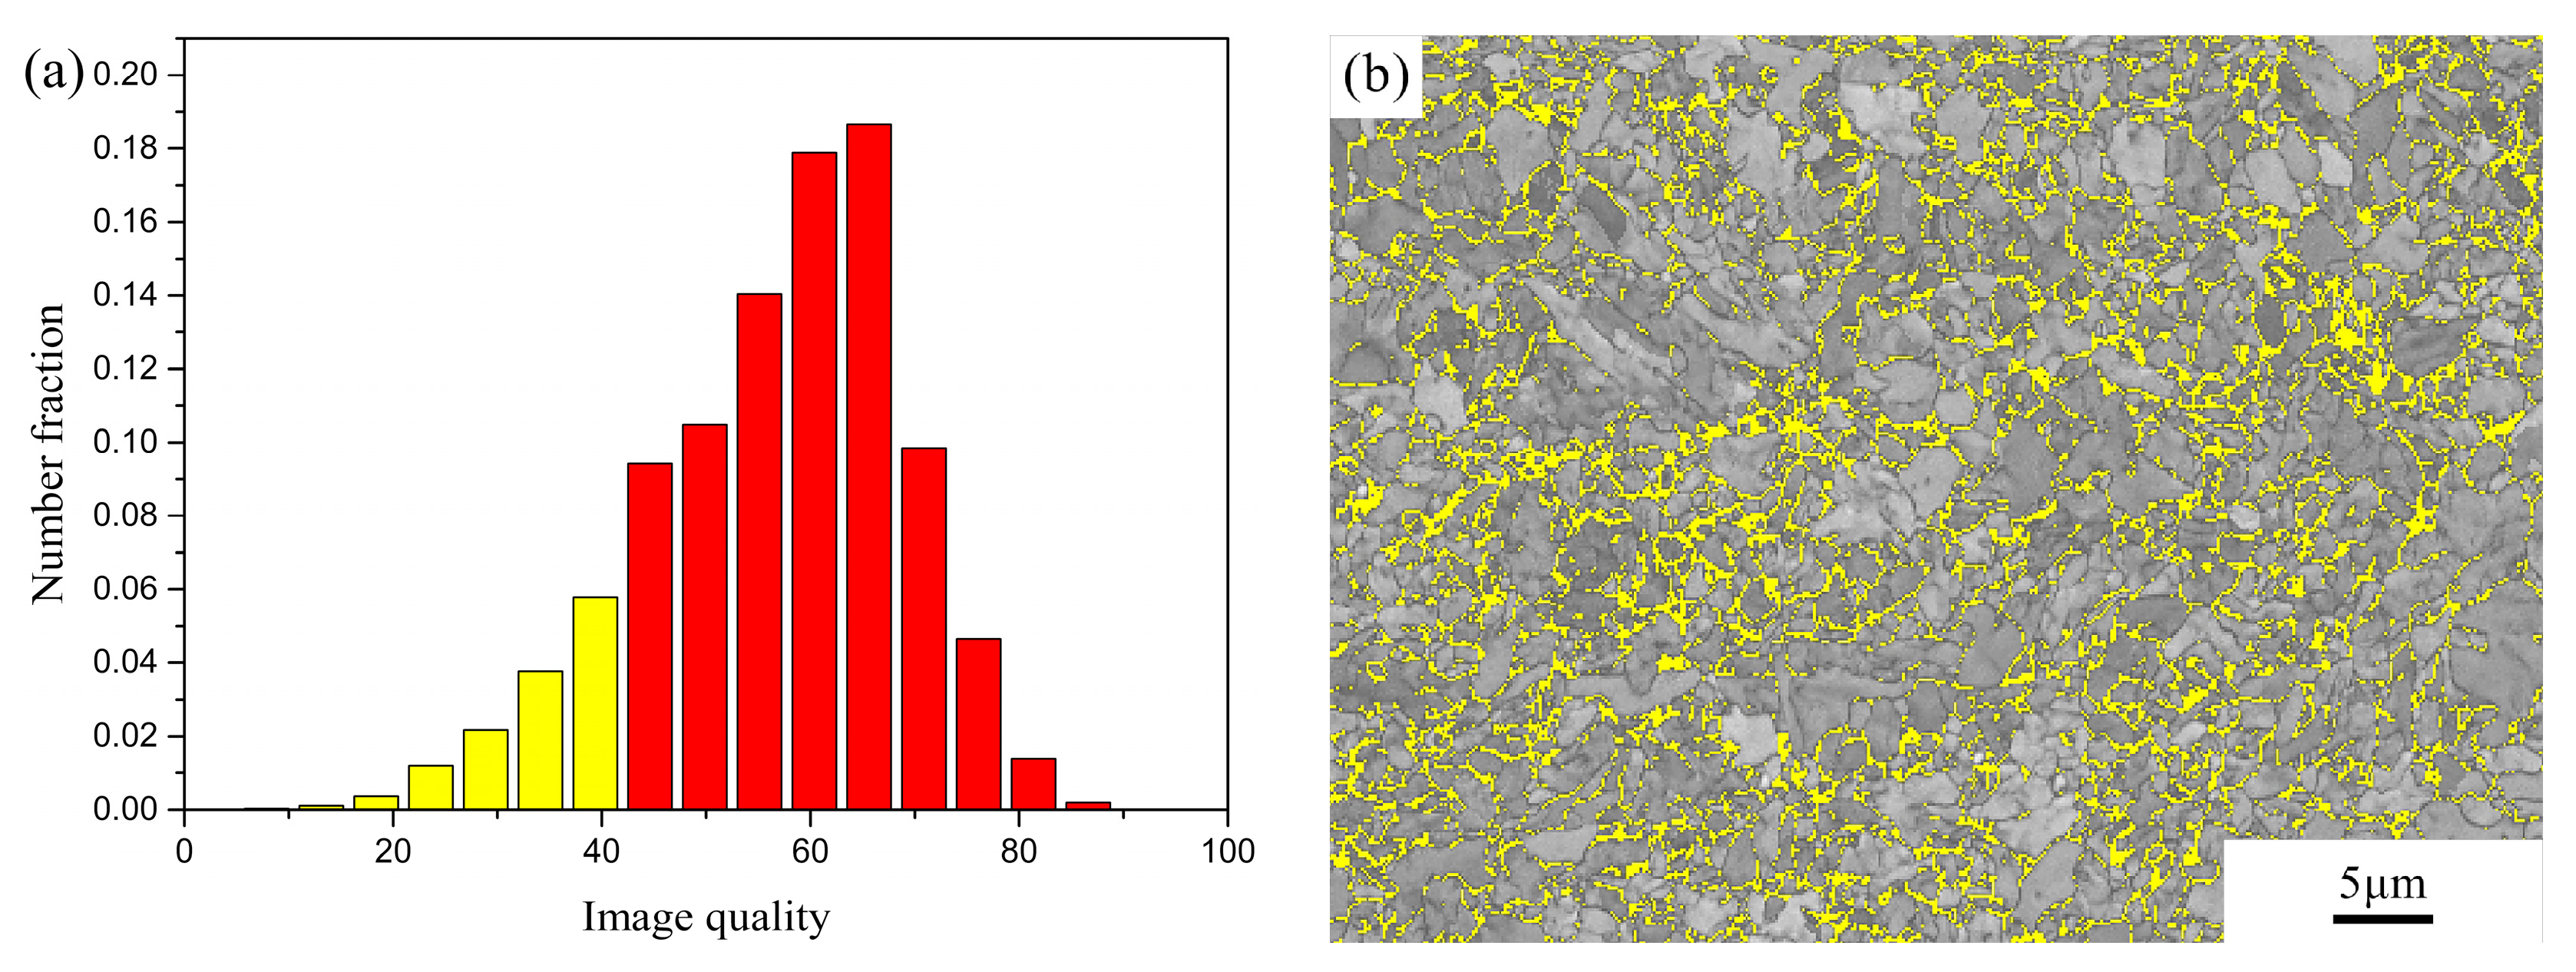
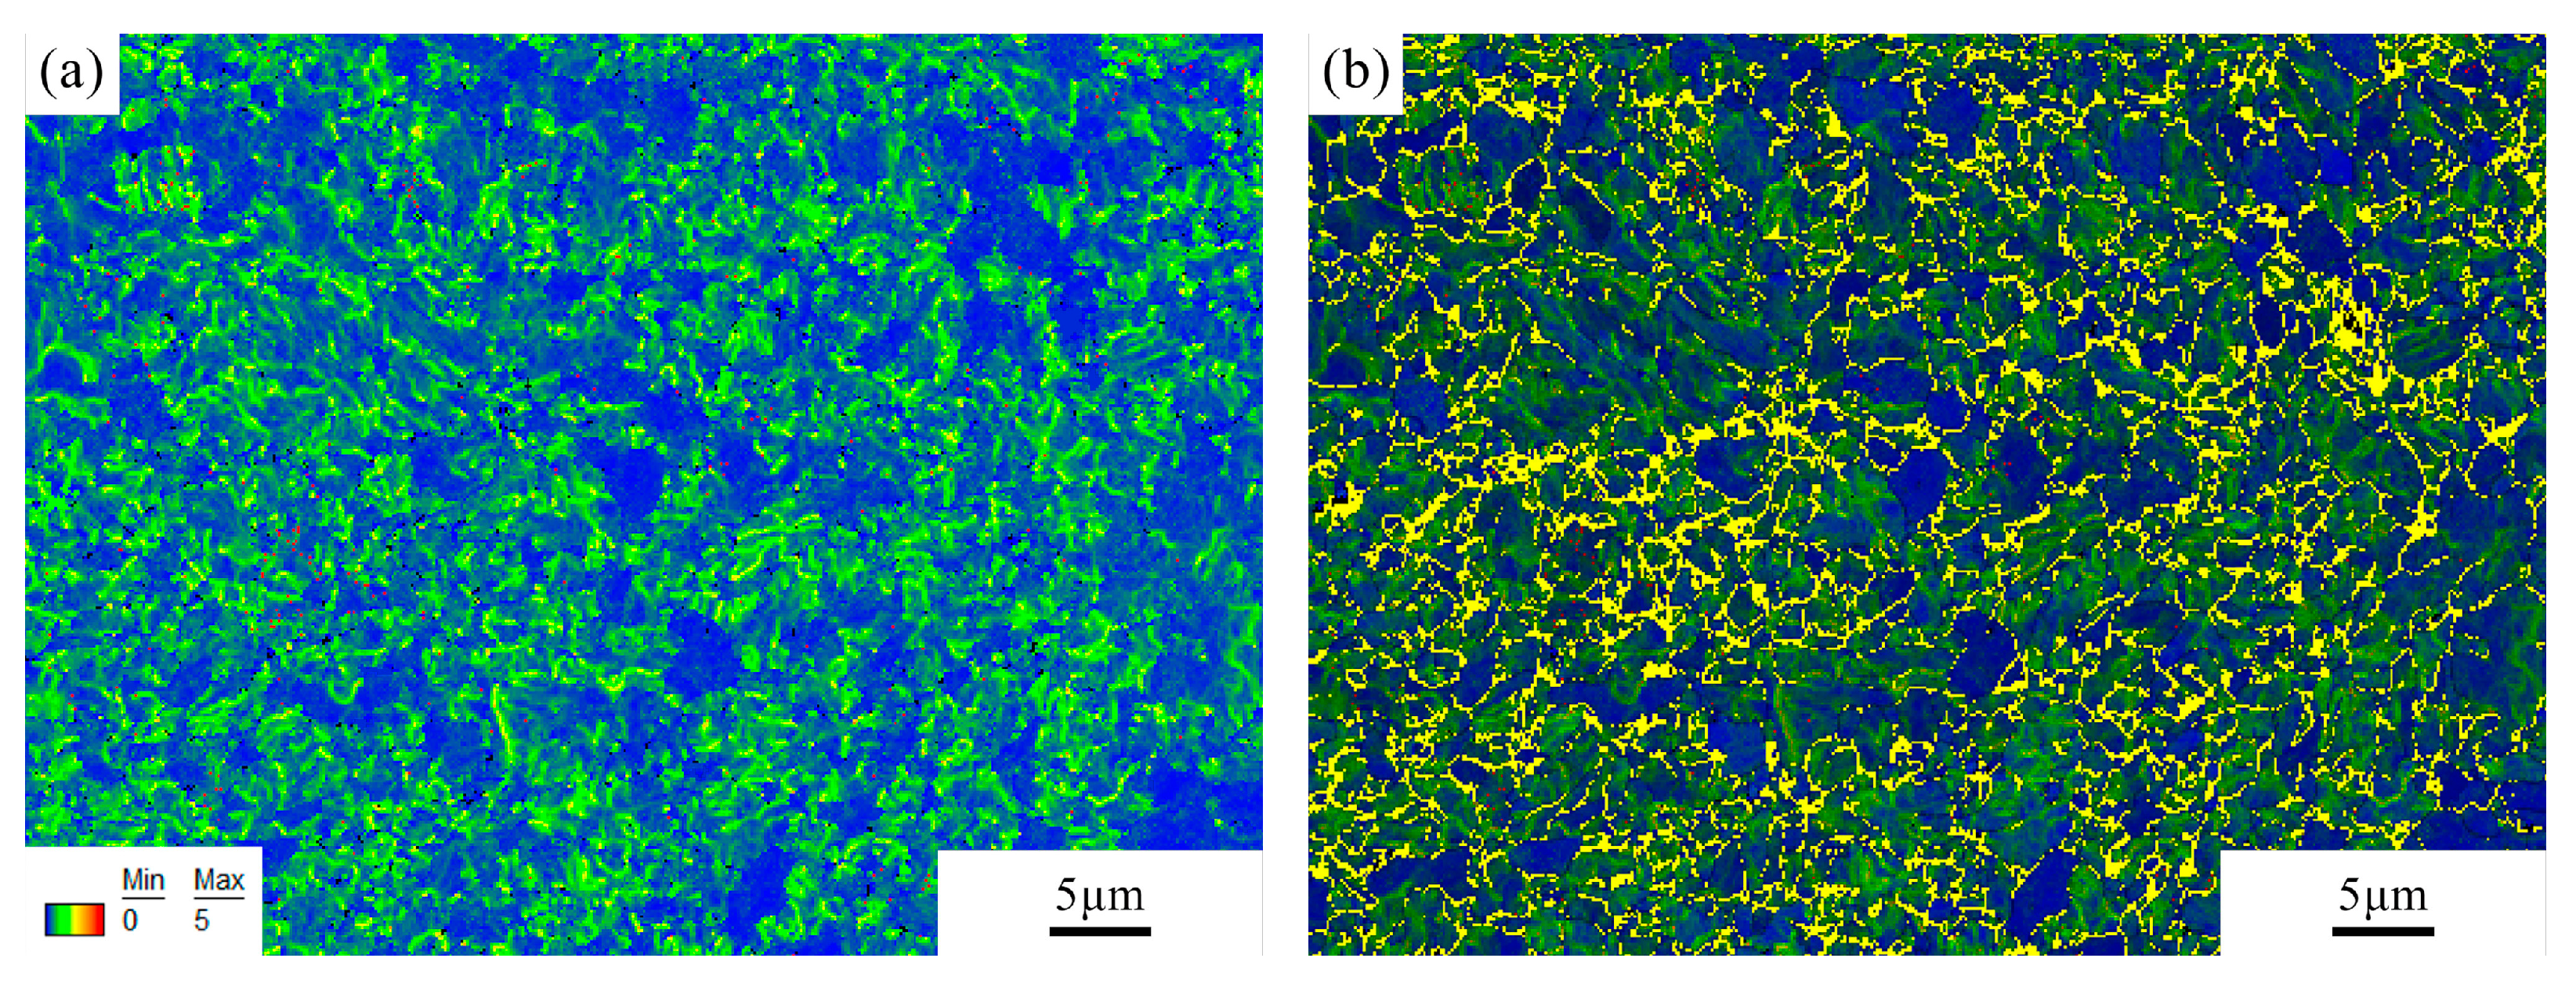
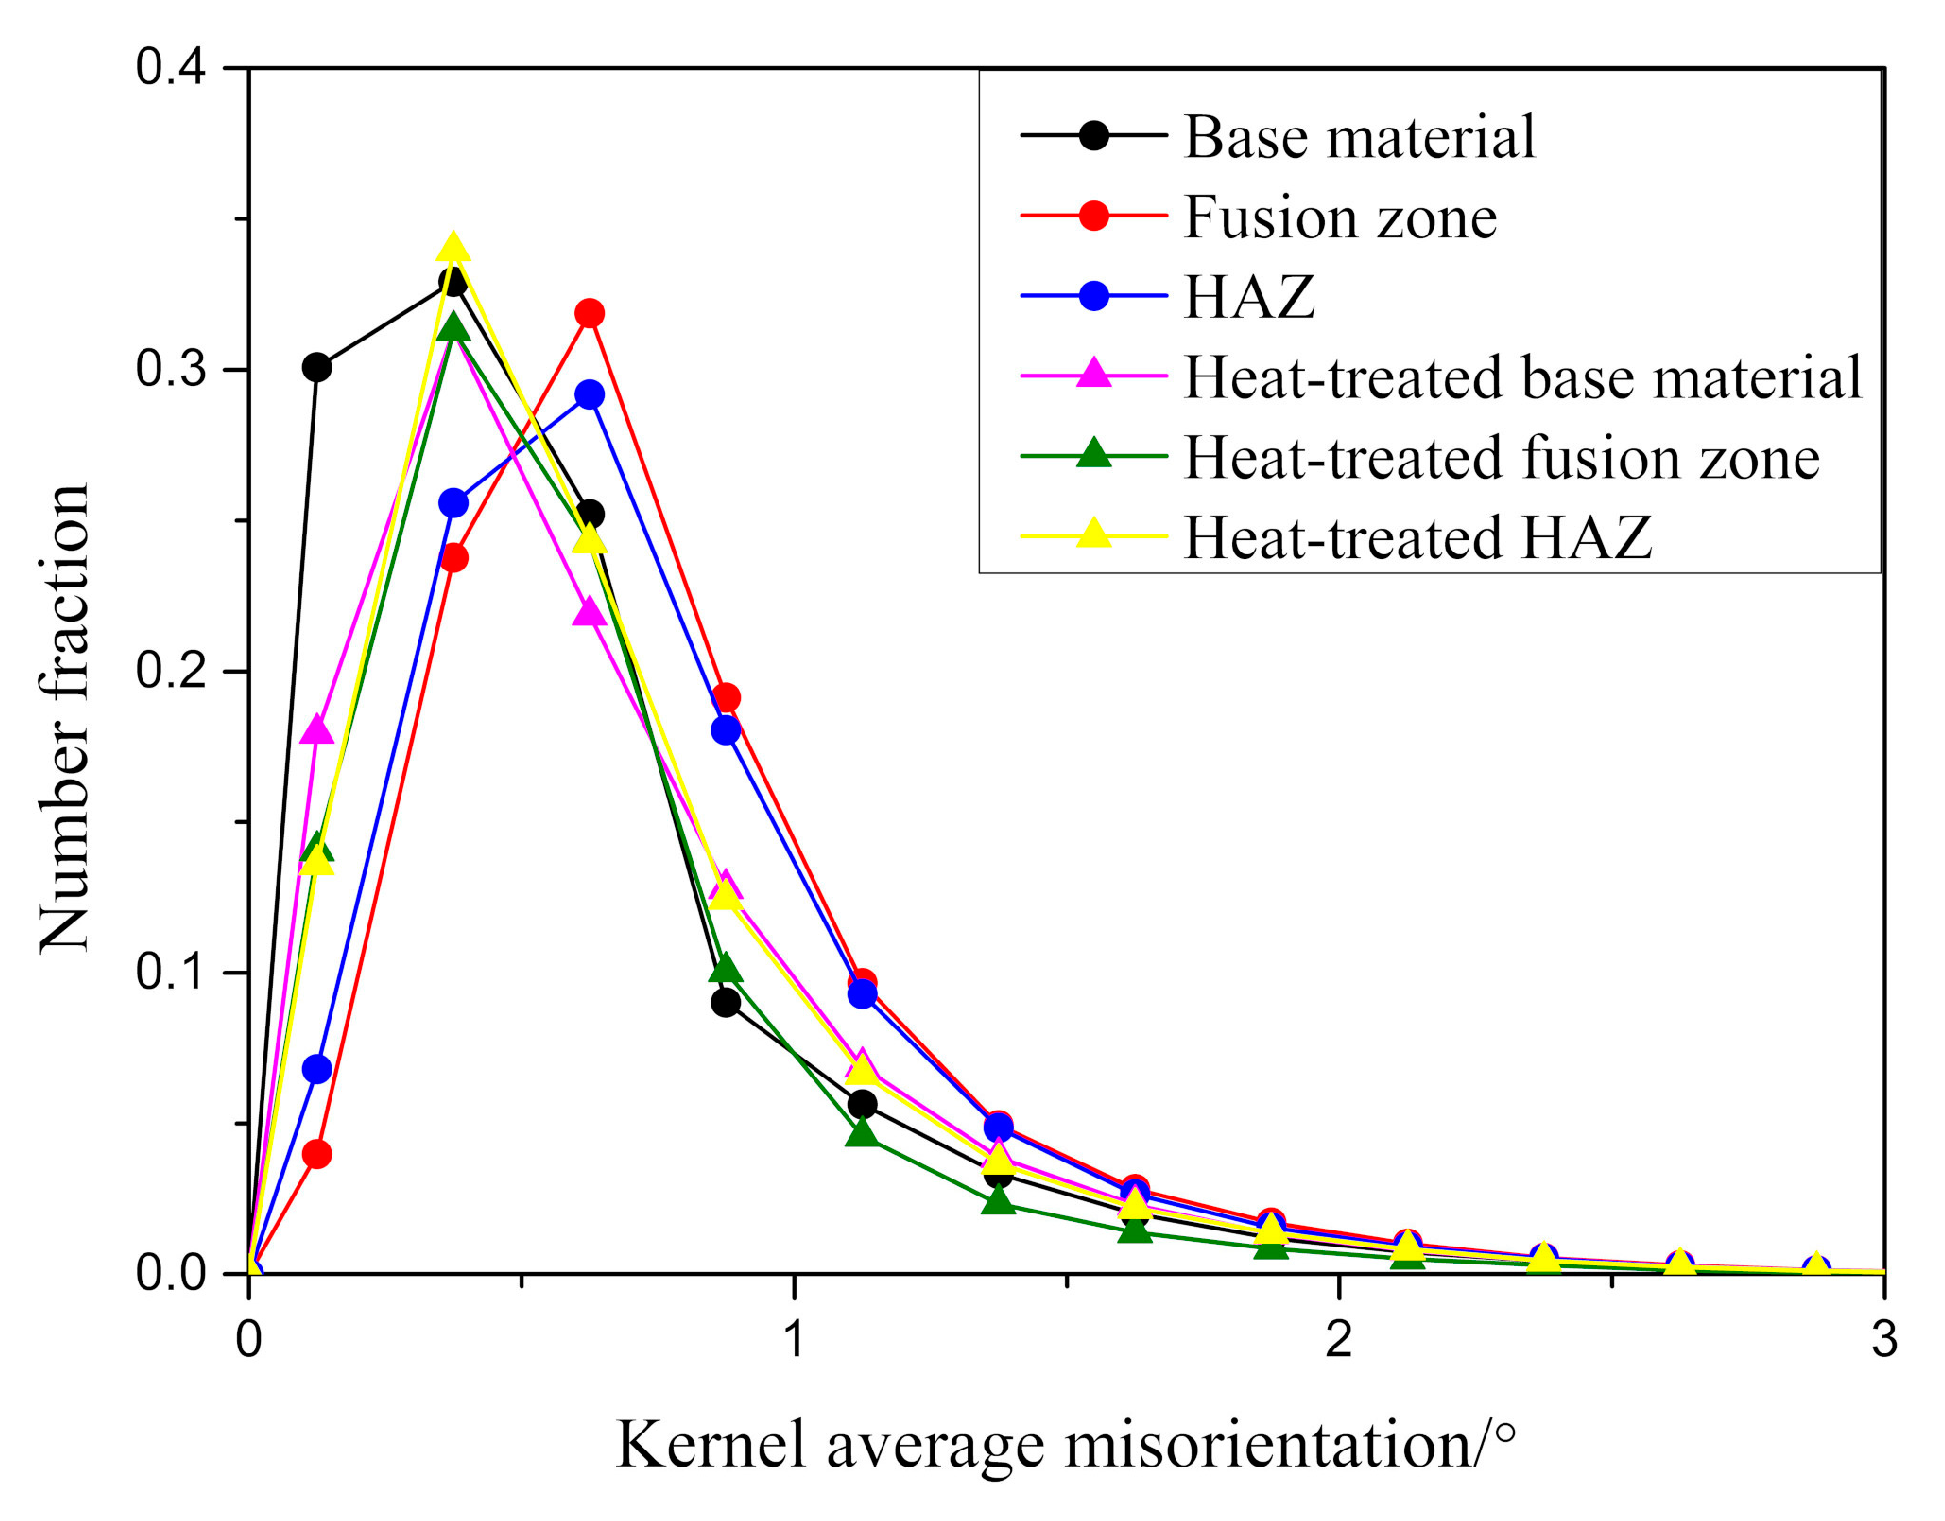
- EBSD results reveal that the joined material has a bimodal and dual phase microstructure. Martensite grains show a lower image quality and a higher misorientation compared to ferrite grains. The microstructure is generally recovered and homogenous after the heat treatment, which is beneficial for the mechanical properties. Our study shows that pulsed laser beam welding is an effective method for the joining of ODS Eurofer steel.
Author Contributions
Funding
Data Availability Statement
Conflicts of Interest
References
- Zinkle, S.; Boutard, J.; Hoelzer, D.; Kimura, A.; Lindau, R.; Odette, G.; Rieth, M.; Tan, L.; Tanigawa, H. Development of next generation tempered and ODS reduced activation ferritic/martensitic steels for fusion energy applications. Nucl. Fusion 2017, 57, 092005. [Google Scholar] [CrossRef]
- Dash, M.K.; Mythili, R.; Ravi, R.; Sakthivel, T.; Dasgupta, A.; Saroja, S.; Bakshi, S.R. Microstructure and mechanical properties of oxide dispersion strengthened 18Cr-ferritic steel consolidated by spark plasma sintering. Mater. Sci. Eng. A 2018, 736, 137–147. [Google Scholar] [CrossRef]
- Baker, B.; Brewer, L. Joining of oxide dispersion strengthened steels for advanced reactors. JOM 2014, 66, 2442–2457. [Google Scholar] [CrossRef]
- Fu, J.; Brouwer, J.; Richardson, I.; Hermans, M. Joining of oxide dispersion strengthened Eurofer steel via spark plasma sintering. Mater. Lett. 2019, 256, 126670. [Google Scholar] [CrossRef]
- Noh, S.; Kasada, R.; Kimura, A. Solid-state diffusion bonding of high-Cr ODS ferritic steel. Acta Mater. 2011, 59, 3196–3204. [Google Scholar] [CrossRef]
- Chen, C.-L.; Tatlock, G.; Jones, A. Microstructural evolution in friction stir welding of nanostructured ODS alloys. J. Alloys Compd. 2010, 504, S460–S466. [Google Scholar] [CrossRef]
- Zhao, K.; Liu, Y.; Huang, L.; Liu, B.; He, Y. Diffusion bonding of Ti-45Al-7Nb-0.3 W alloy by spark plasma sintering. J. Mater. Process. Technol. 2016, 230, 272–279. [Google Scholar] [CrossRef]
- Chen, Z.; Cui, S. On the forming mechanism of banded structures in aluminium alloy friction stir welds. Scripta Mater. 2008, 58, 417–420. [Google Scholar] [CrossRef]
- Lindau, R.; Klimenkov, M.; Jäntsch, U.; Möslang, A.; Commin, L. Mechanical and microstructural characterization of electron beam welded reduced activation oxide dispersion strengthened–Eurofer steel. J. Nucl. Mater. 2011, 416, 22–29. [Google Scholar] [CrossRef]
- Kelly, T. Pulsed YAG laser welding of ODS alloys. In AIP Conference Proceedings; American Institute of Physics: College Park, MD, USA, 1979; pp. 215–220. [Google Scholar]
- Molian, P.; Yang, Y.; Patnaik, P. Laser welding of oxide dispersion-strengthened alloy MA754. J. Mater. Sci. 1992, 27, 2687–2694. [Google Scholar] [CrossRef]
- Lemmen, H.; Sudmeijer, K.; Richardson, I.; Van der Zwaag, S. Laser beam welding of an Oxide Dispersion Strengthened super alloy. J. Mater. Sci. 2007, 42, 5286–5295. [Google Scholar] [CrossRef][Green Version]
- Liang, S.; Lei, Y.; Zhu, Q. The filler powders laser welding of ODS ferritic steels. J. Nucl. Mater. 2015, 456, 206–210. [Google Scholar] [CrossRef]
- Fu, J.; Brouwer, J.; Richardson, I.; Hermans, M. Effect of mechanical alloying and spark plasma sintering on the microstructure and mechanical properties of ODS Eurofer. Mater. Des. 2019, 177, 107849. [Google Scholar] [CrossRef]
- De, A.; Walsh, C.; Maiti, S.; Bhadeshia, H. Prediction of cooling rate and microstructure in laser spot welds. Sci. Technol. Weld. Join. 2003, 8, 391–399. [Google Scholar] [CrossRef]
- Yamamoto, M.; Ukai, S.; Hayashi, S.; Kaito, T.; Ohtsuka, S. Formation of residual ferrite in 9Cr-ODS ferritic steels. Mater. Sci. Eng. A 2010, 527, 4418–4423. [Google Scholar] [CrossRef]
- Zilnyk, K.D.; Sandim, H.R.Z.; Bolmaro, R.E.; Lindau, R.; Möslang, A.; Kostka, A.; Raabe, D. Long-term microstructural stability of oxide-dispersion strengthened Eurofer steel annealed at 800 °C. J. Nucl. Mater. 2014, 448, 33–42. [Google Scholar] [CrossRef]
- Sallez, N.; Donnadieu, P.; Courtois-Manara, E.; Chassaing, D.; Kübel, C.; Delabrouille, F.; Blat-Yrieix, M.; de Carlan, Y.; Bréchet, Y. On ball-milled ODS ferritic steel recrystallization: From as-milled powder particles to consolidated state. J. Mater. Sci. 2015, 50, 2202–2217. [Google Scholar] [CrossRef]
- Sallez, N.; Boulnat, X.; Borbély, A.; Béchade, J.L.; Fabrègue, D.; Perez, M.; de Carlan, Y.; Hennet, L.; Mocuta, C.; Thiaudière, D.; et al. In situ characterization of microstructural instabilities: Recovery, recrystallization and abnormal growth in nanoreinforced steel powder. Acta Mater. 2015, 87, 377–389. [Google Scholar] [CrossRef]
- Hilger, I.; Bergner, F.; Weißgärber, T. Bimodal Grain Size Distribution of Nanostructured Ferritic ODS Fe-Cr Alloys. J. Am. Ceram. Soc. 2015, 98, 3576–3581. [Google Scholar] [CrossRef]
- Odette, G.; Alinger, M.; Wirth, B. Recent developments in irradiation-resistant steels. Annu. Rev. Mater. Res. 2008, 38, 471–503. [Google Scholar] [CrossRef]
- Tarasiuk, J.; Gerber, P.; Bacroix, B. Estimation of recrystallized volume fraction from EBSD data. Acta Mater. 2002, 50, 1467–1477. [Google Scholar] [CrossRef]
- Laureys, A.; Pinson, M.; Depover, T.; Petrov, R.; Verbeken, K. EBSD characterization of hydrogen induced blisters and internal cracks in TRIP-assisted steel. Mater. Charact. 2020, 159, 110029. [Google Scholar] [CrossRef]
- Kawahito, Y.; Nakada, K.; Uemura, Y.; Mizutani, M.; Nishimoto, K.; Kawakami, H.; Katayama, S. Relationship between melt flows based on three-dimensional X-ray transmission in situ observation and spatter reduction by angle of incidence and defocussing distance in high-power laser welding of stainless steel. Weld. Int. 2018, 32, 485–496. [Google Scholar] [CrossRef]
- Weberpals, J.-P.; Krueger, P.; Berger, P.; Graf, T. Understanding the influence of the focal position in laser welding on spatter reduction. In Proceedings of the International Congress on Applications of Lasers & Electro-Optics, Orlando, FL, USA, 23–27 October 2011; pp. 159–168. [Google Scholar]
- Dowden, J.; Kapadia, P. A mathematical investigation of the penetration depth in keyhole welding with continuous CO2 lasers. J. Phys. D Appl. Phys. 1995, 28, 2252. [Google Scholar] [CrossRef]
- Matsunawa, A.; Mizutani, M.; Katayama, S.; Seto, N. Porosity formation mechanism and its prevention in laser welding. Weld. Int. 2003, 17, 431–437. [Google Scholar] [CrossRef]
- Zhou, X.; Liu, Y.; Yu, L.; Ma, Z.; Guo, Q.; Huang, Y.; Li, H. Microstructure characteristic and mechanical property of transformable 9Cr-ODS steel fabricated by spark plasma sintering. Mater. Des. 2017, 132, 158–169. [Google Scholar] [CrossRef]


| Conditions | Regions | Grain Size/μm |
|---|---|---|
| Base material | 2.08 ± 1.31 | |
| As-joined | Fusion zone | 4.33 ± 2.89 |
| HAZ | 1.64 ± 1.25 | |
| Base material | 1.92 ± 1.10 | |
| Heat treated | Fusion zone | 2.20 ± 1.50 |
| HAZ | 1.72 ± 1.07 |
Publisher’s Note: MDPI stays neutral with regard to jurisdictional claims in published maps and institutional affiliations. |
© 2021 by the authors. Licensee MDPI, Basel, Switzerland. This article is an open access article distributed under the terms and conditions of the Creative Commons Attribution (CC BY) license (https://creativecommons.org/licenses/by/4.0/).
Share and Cite
Fu, J.; Richardson, I.; Hermans, M. Microstructure Study of Pulsed Laser Beam Welded Oxide Dispersion-Strengthened (ODS) Eurofer Steel. Micromachines 2021, 12, 629. https://doi.org/10.3390/mi12060629
Fu J, Richardson I, Hermans M. Microstructure Study of Pulsed Laser Beam Welded Oxide Dispersion-Strengthened (ODS) Eurofer Steel. Micromachines. 2021; 12(6):629. https://doi.org/10.3390/mi12060629
Chicago/Turabian StyleFu, Jia, Ian Richardson, and Marcel Hermans. 2021. "Microstructure Study of Pulsed Laser Beam Welded Oxide Dispersion-Strengthened (ODS) Eurofer Steel" Micromachines 12, no. 6: 629. https://doi.org/10.3390/mi12060629
APA StyleFu, J., Richardson, I., & Hermans, M. (2021). Microstructure Study of Pulsed Laser Beam Welded Oxide Dispersion-Strengthened (ODS) Eurofer Steel. Micromachines, 12(6), 629. https://doi.org/10.3390/mi12060629