Effects of Bonding Parameters on Free Air Ball Properties and Bonded Strength of Ag-10Au-3.6Pd Alloy Bonding Wire


Abstract
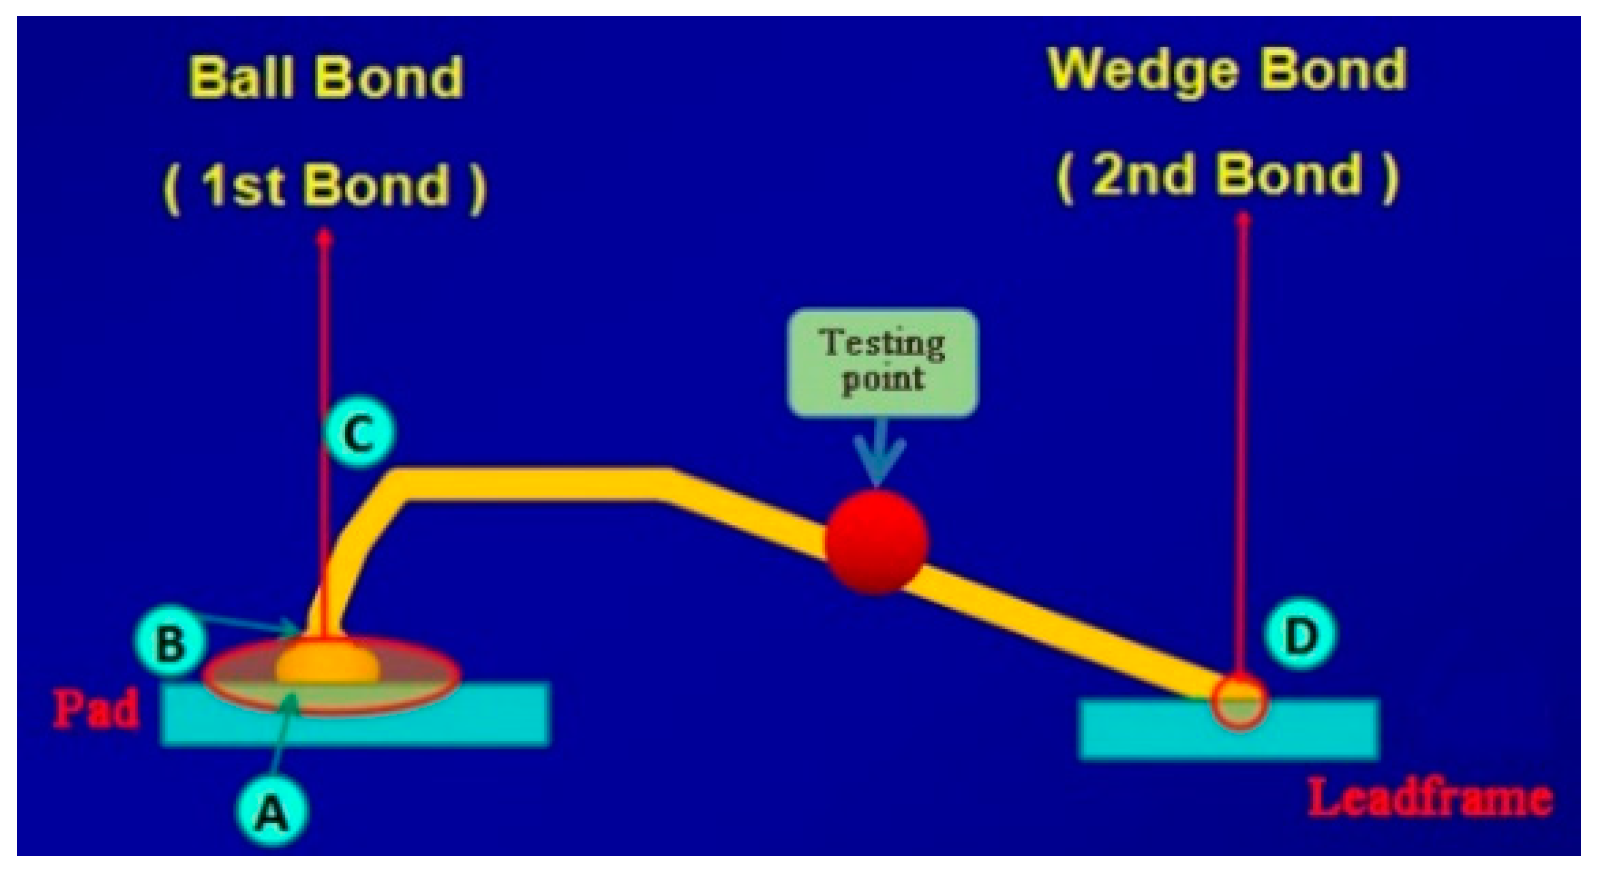
:1. Introduction
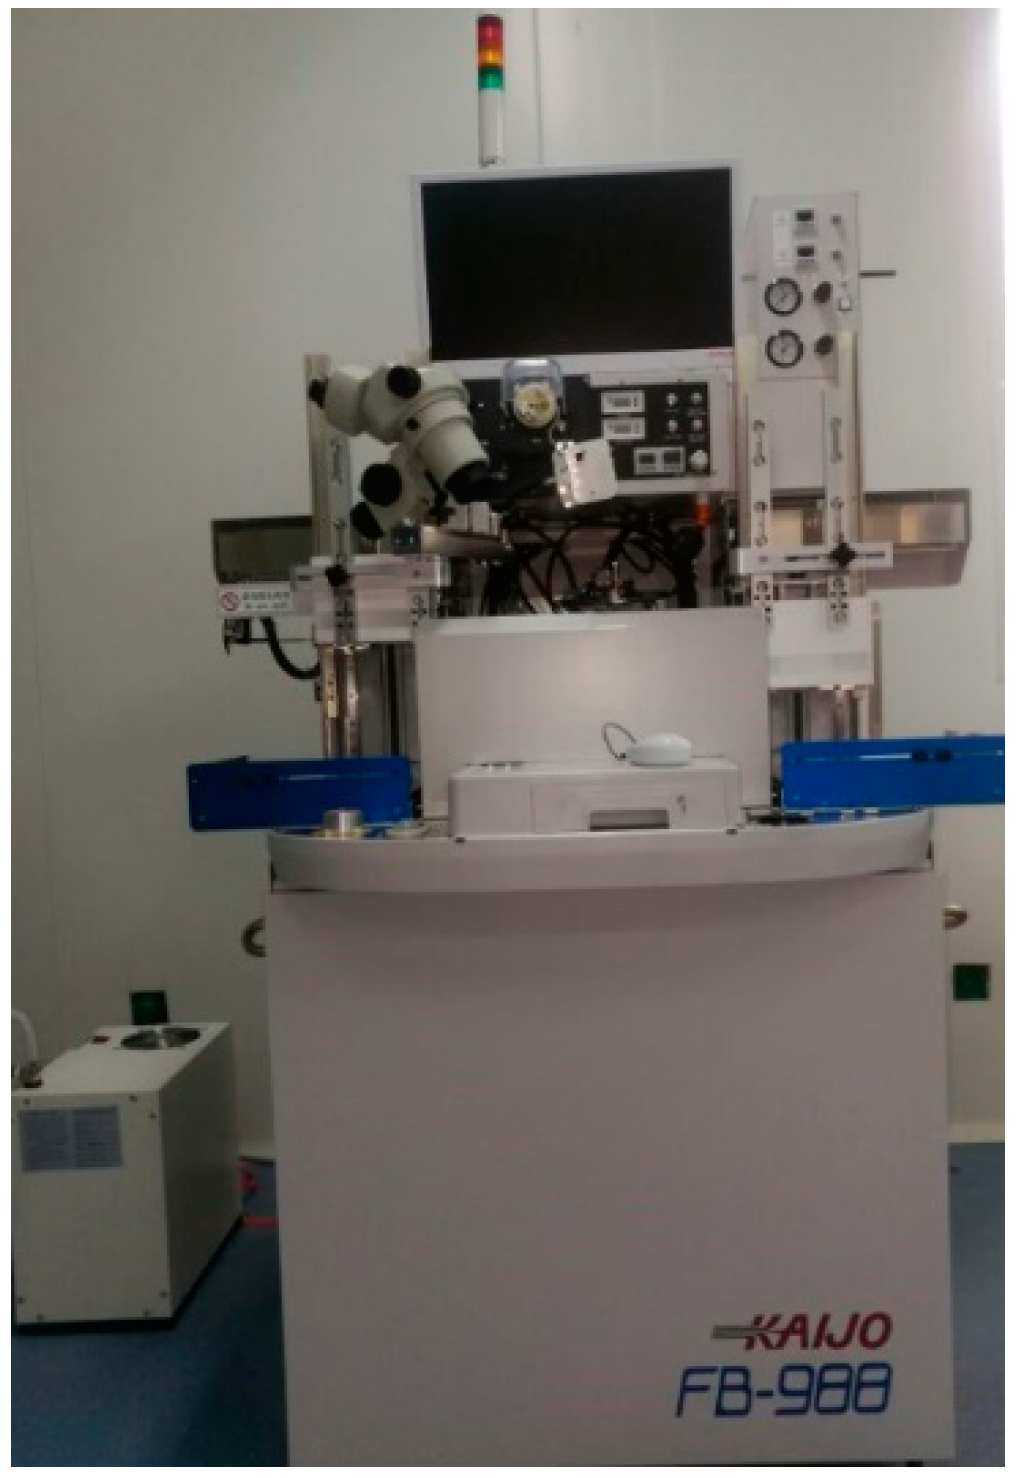
2. Materials and Methods
3. Results
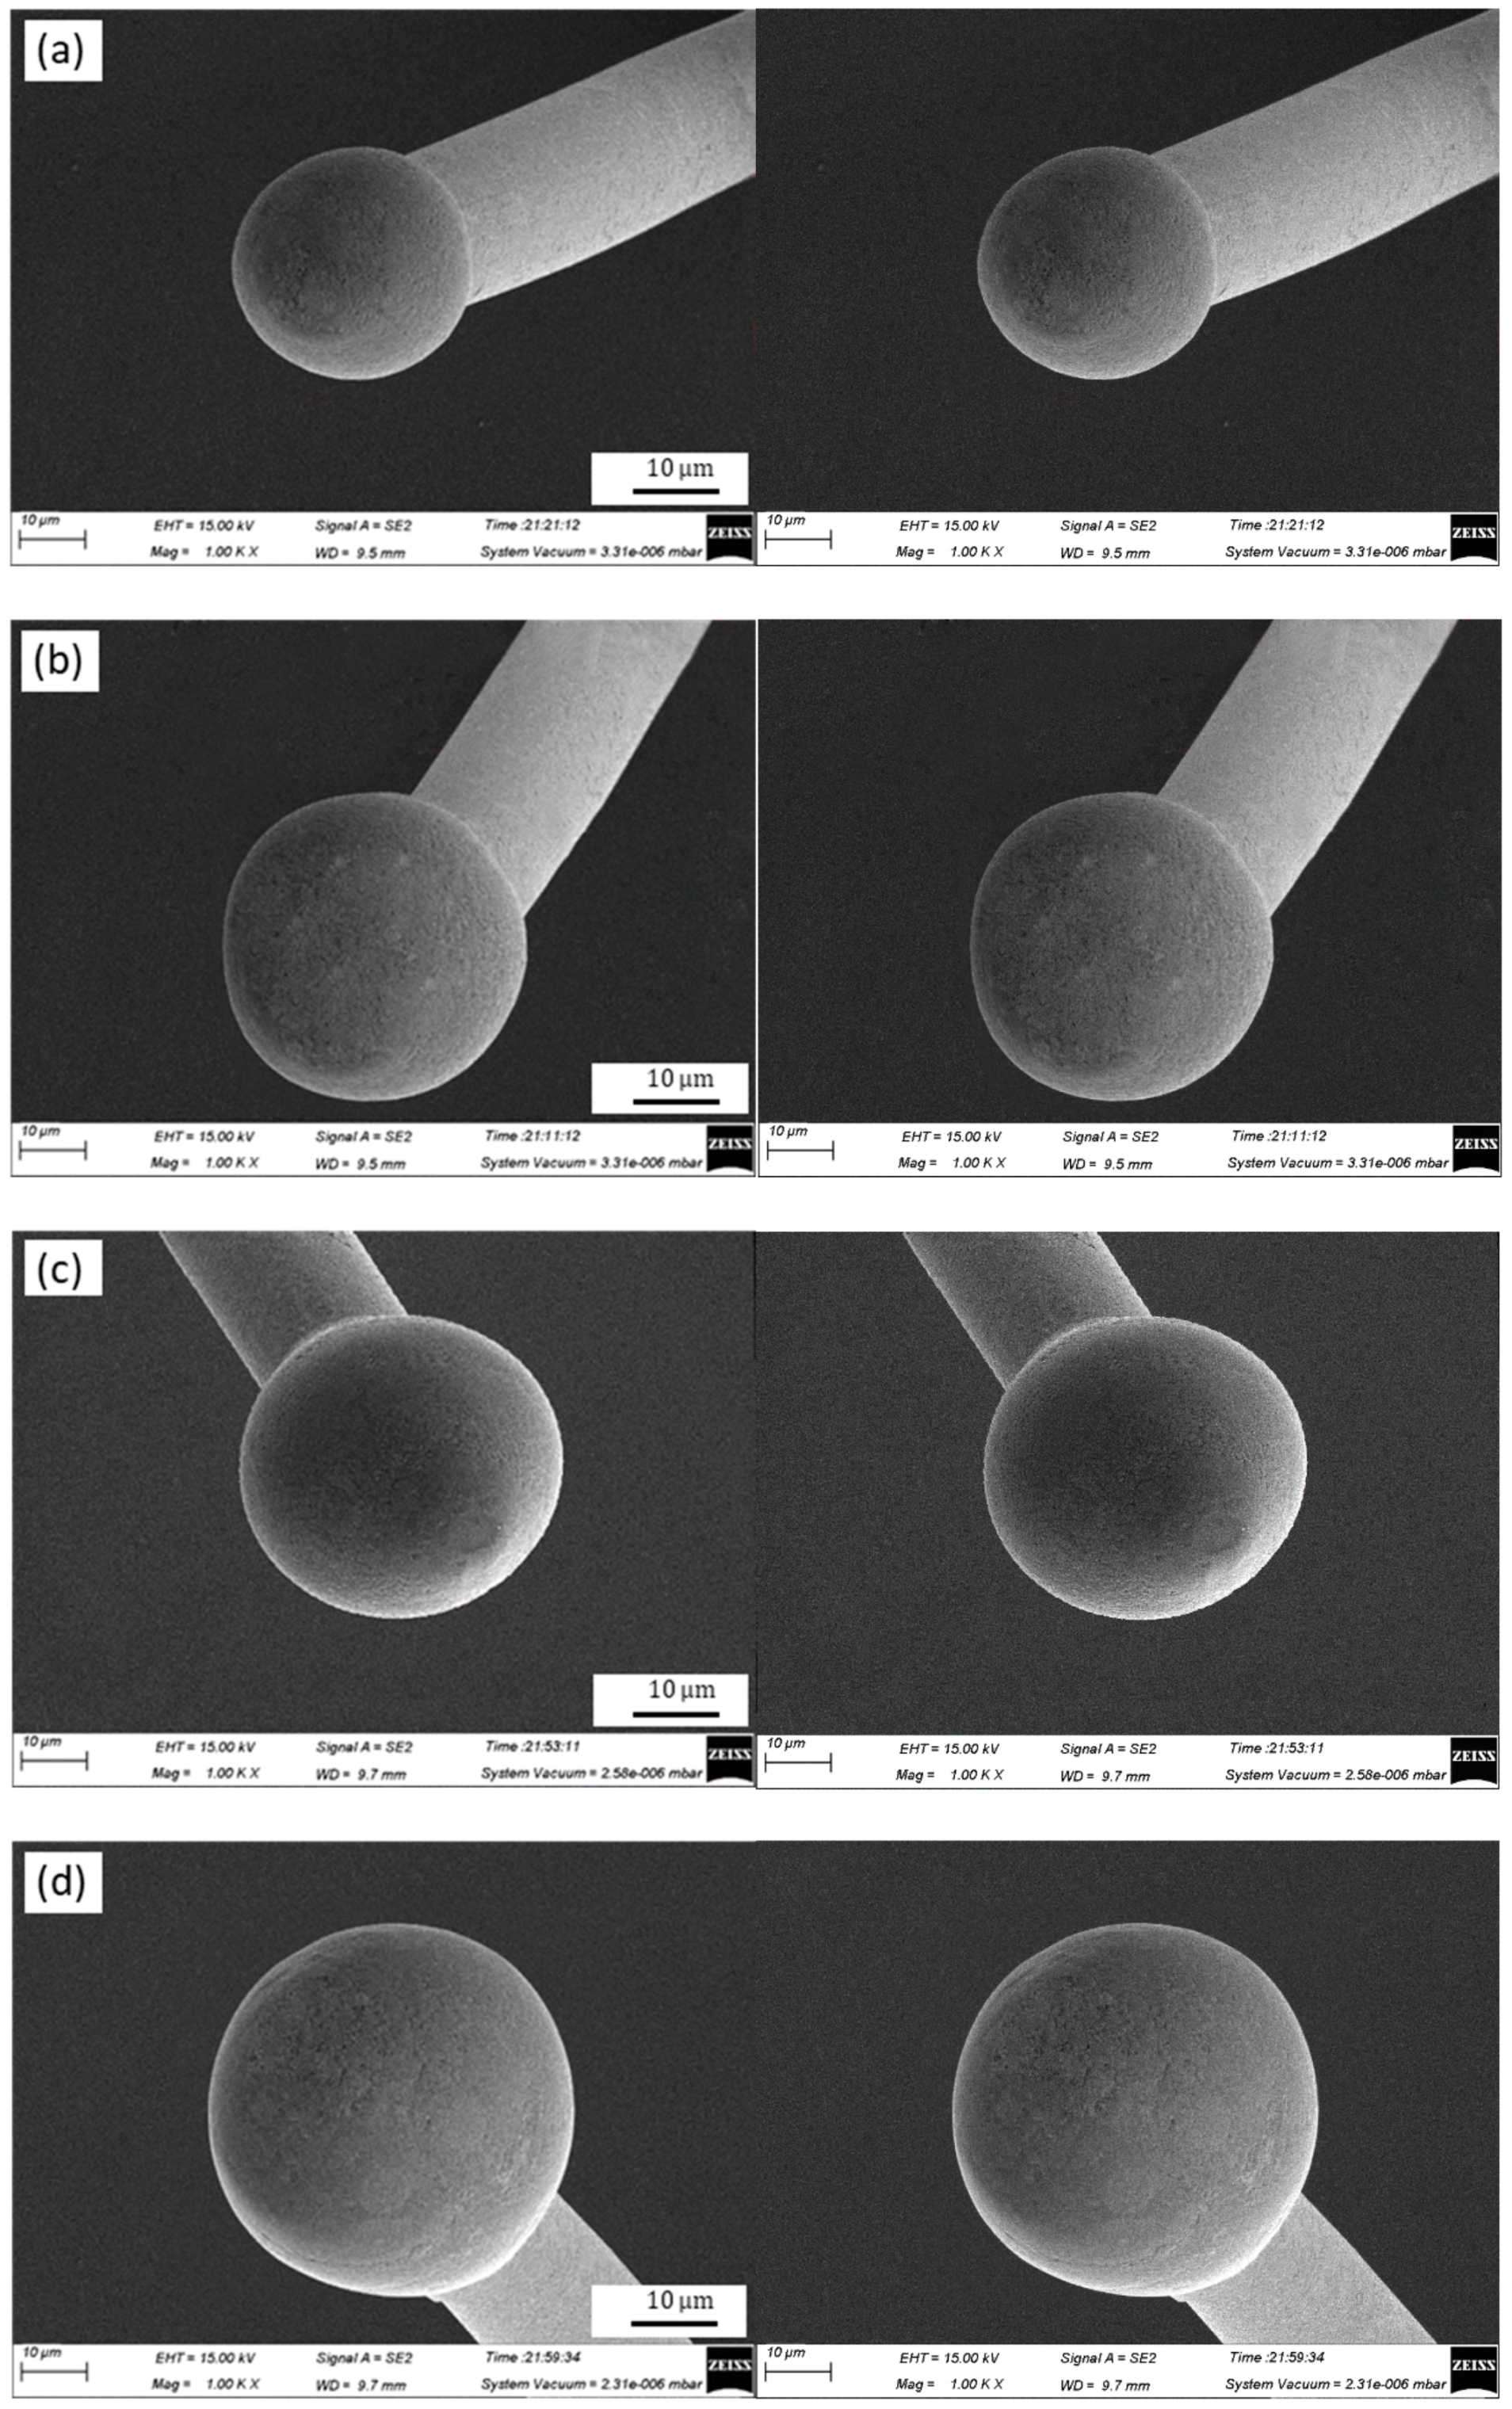
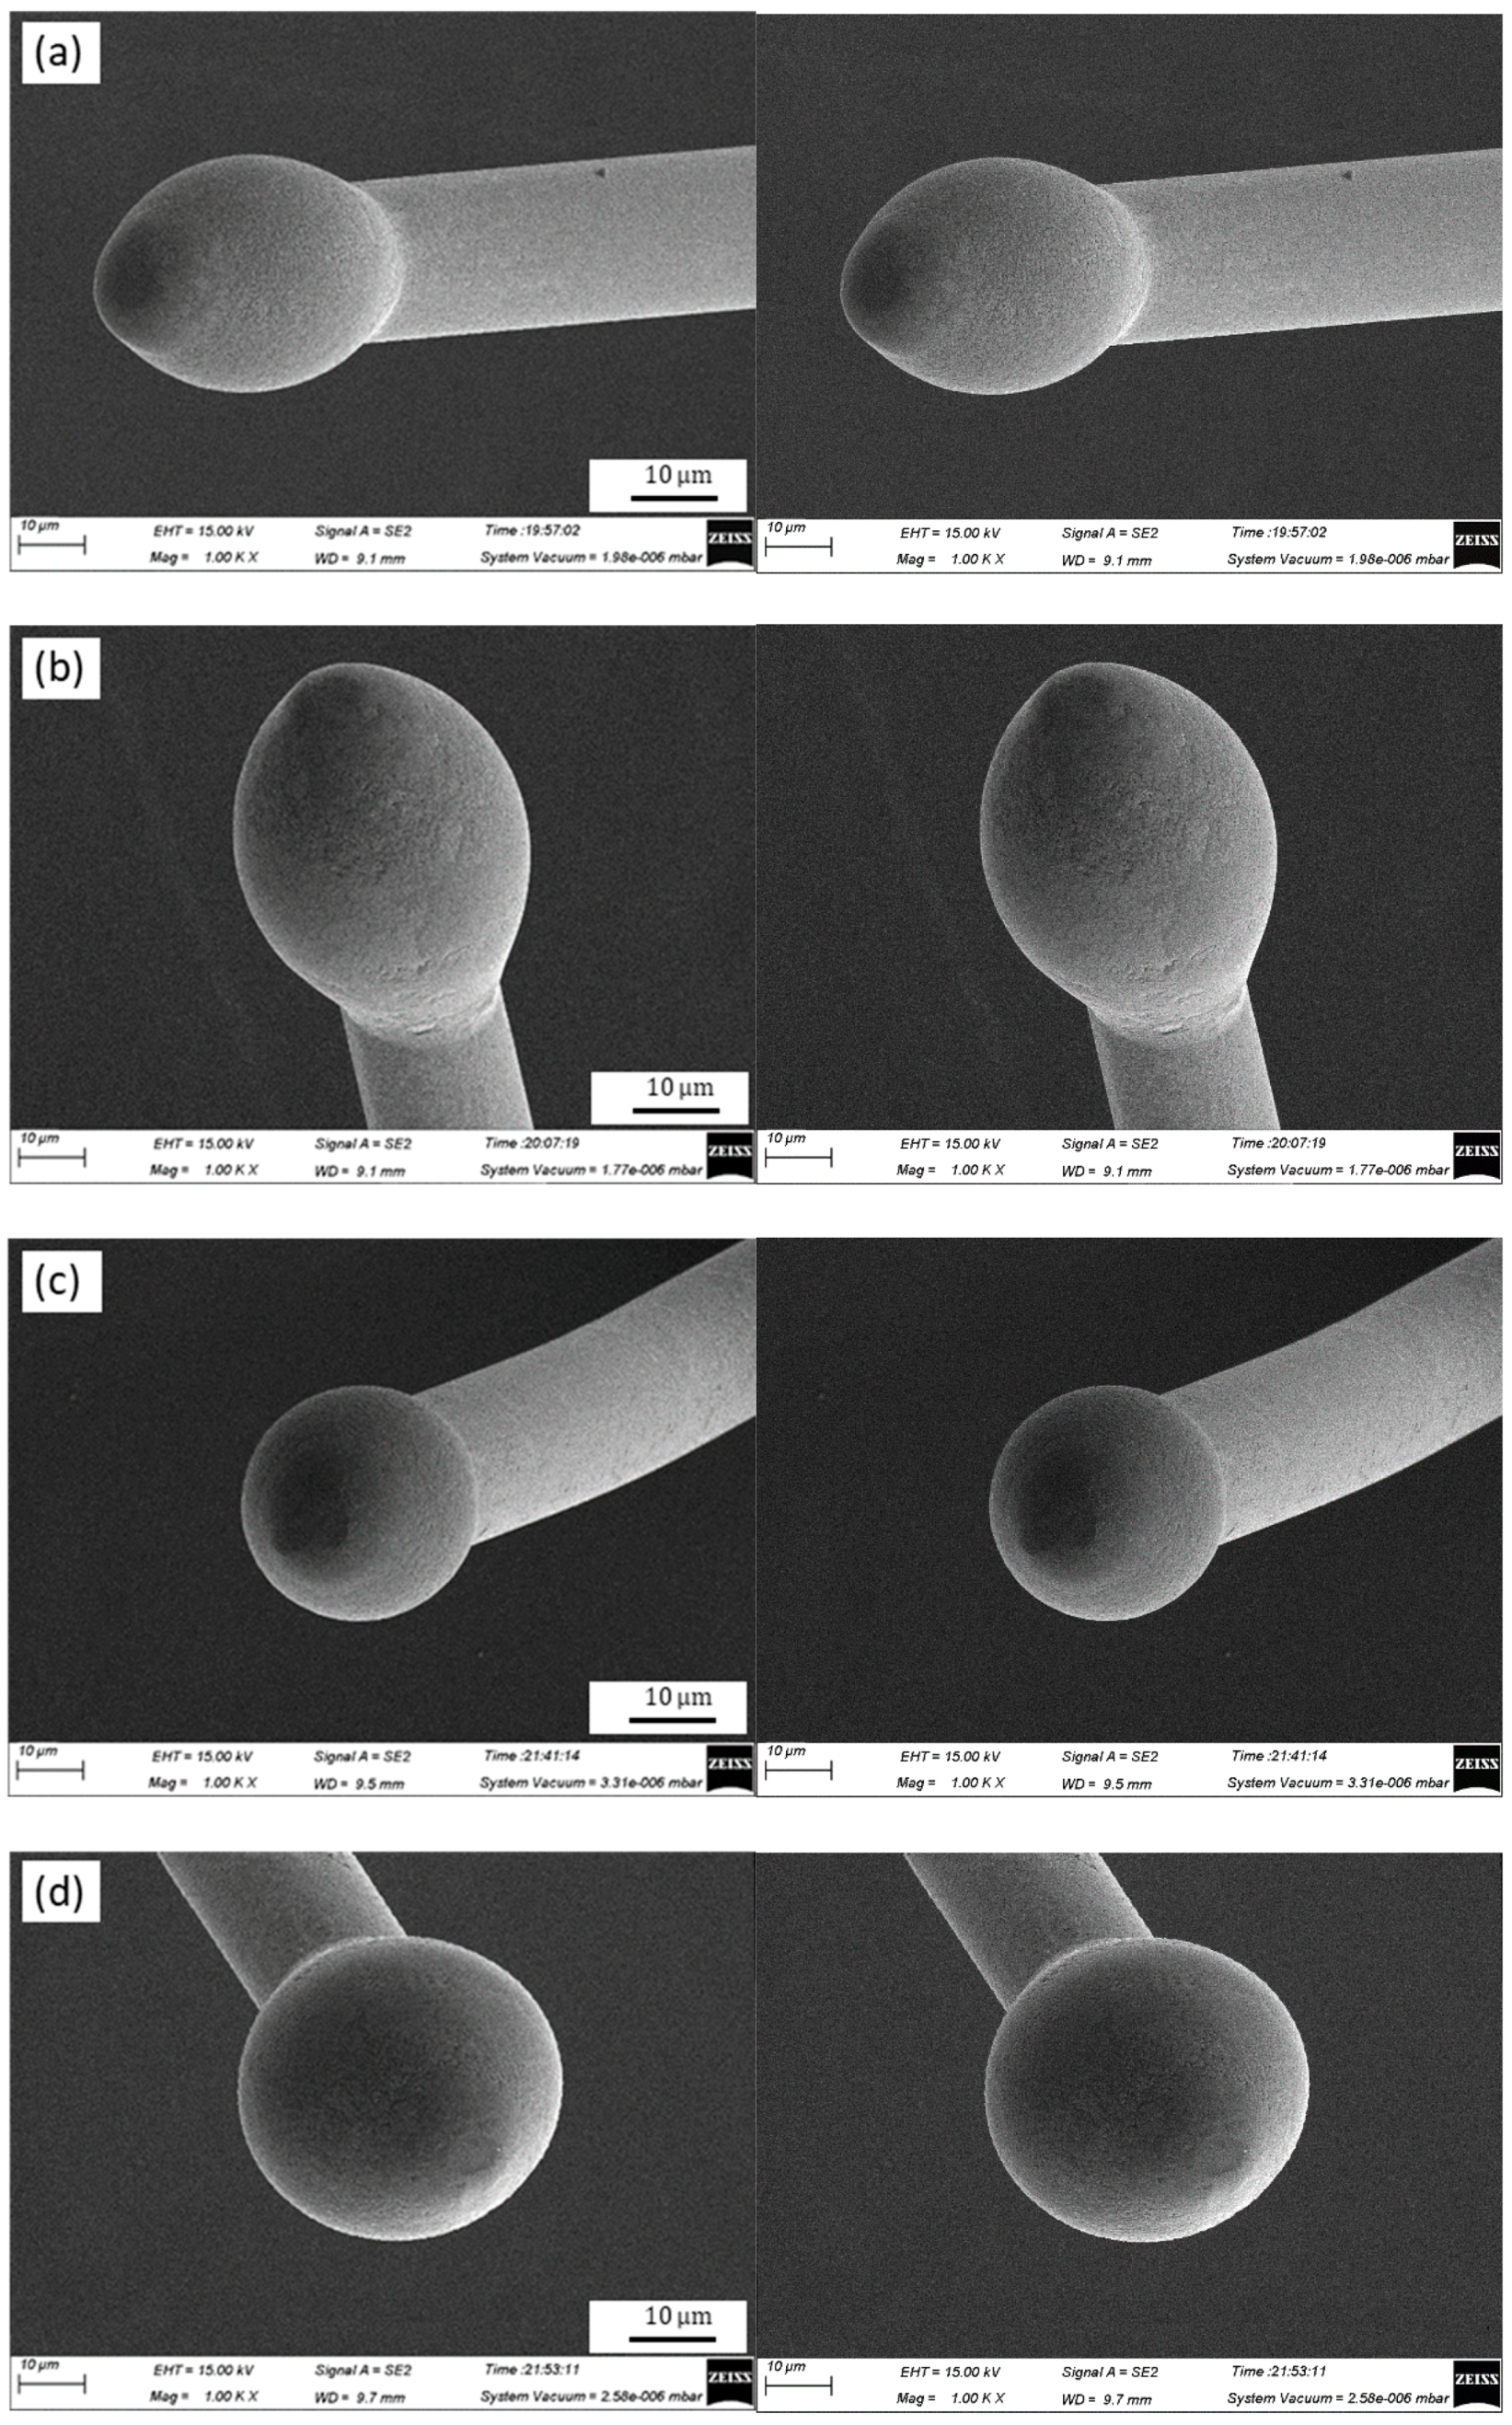
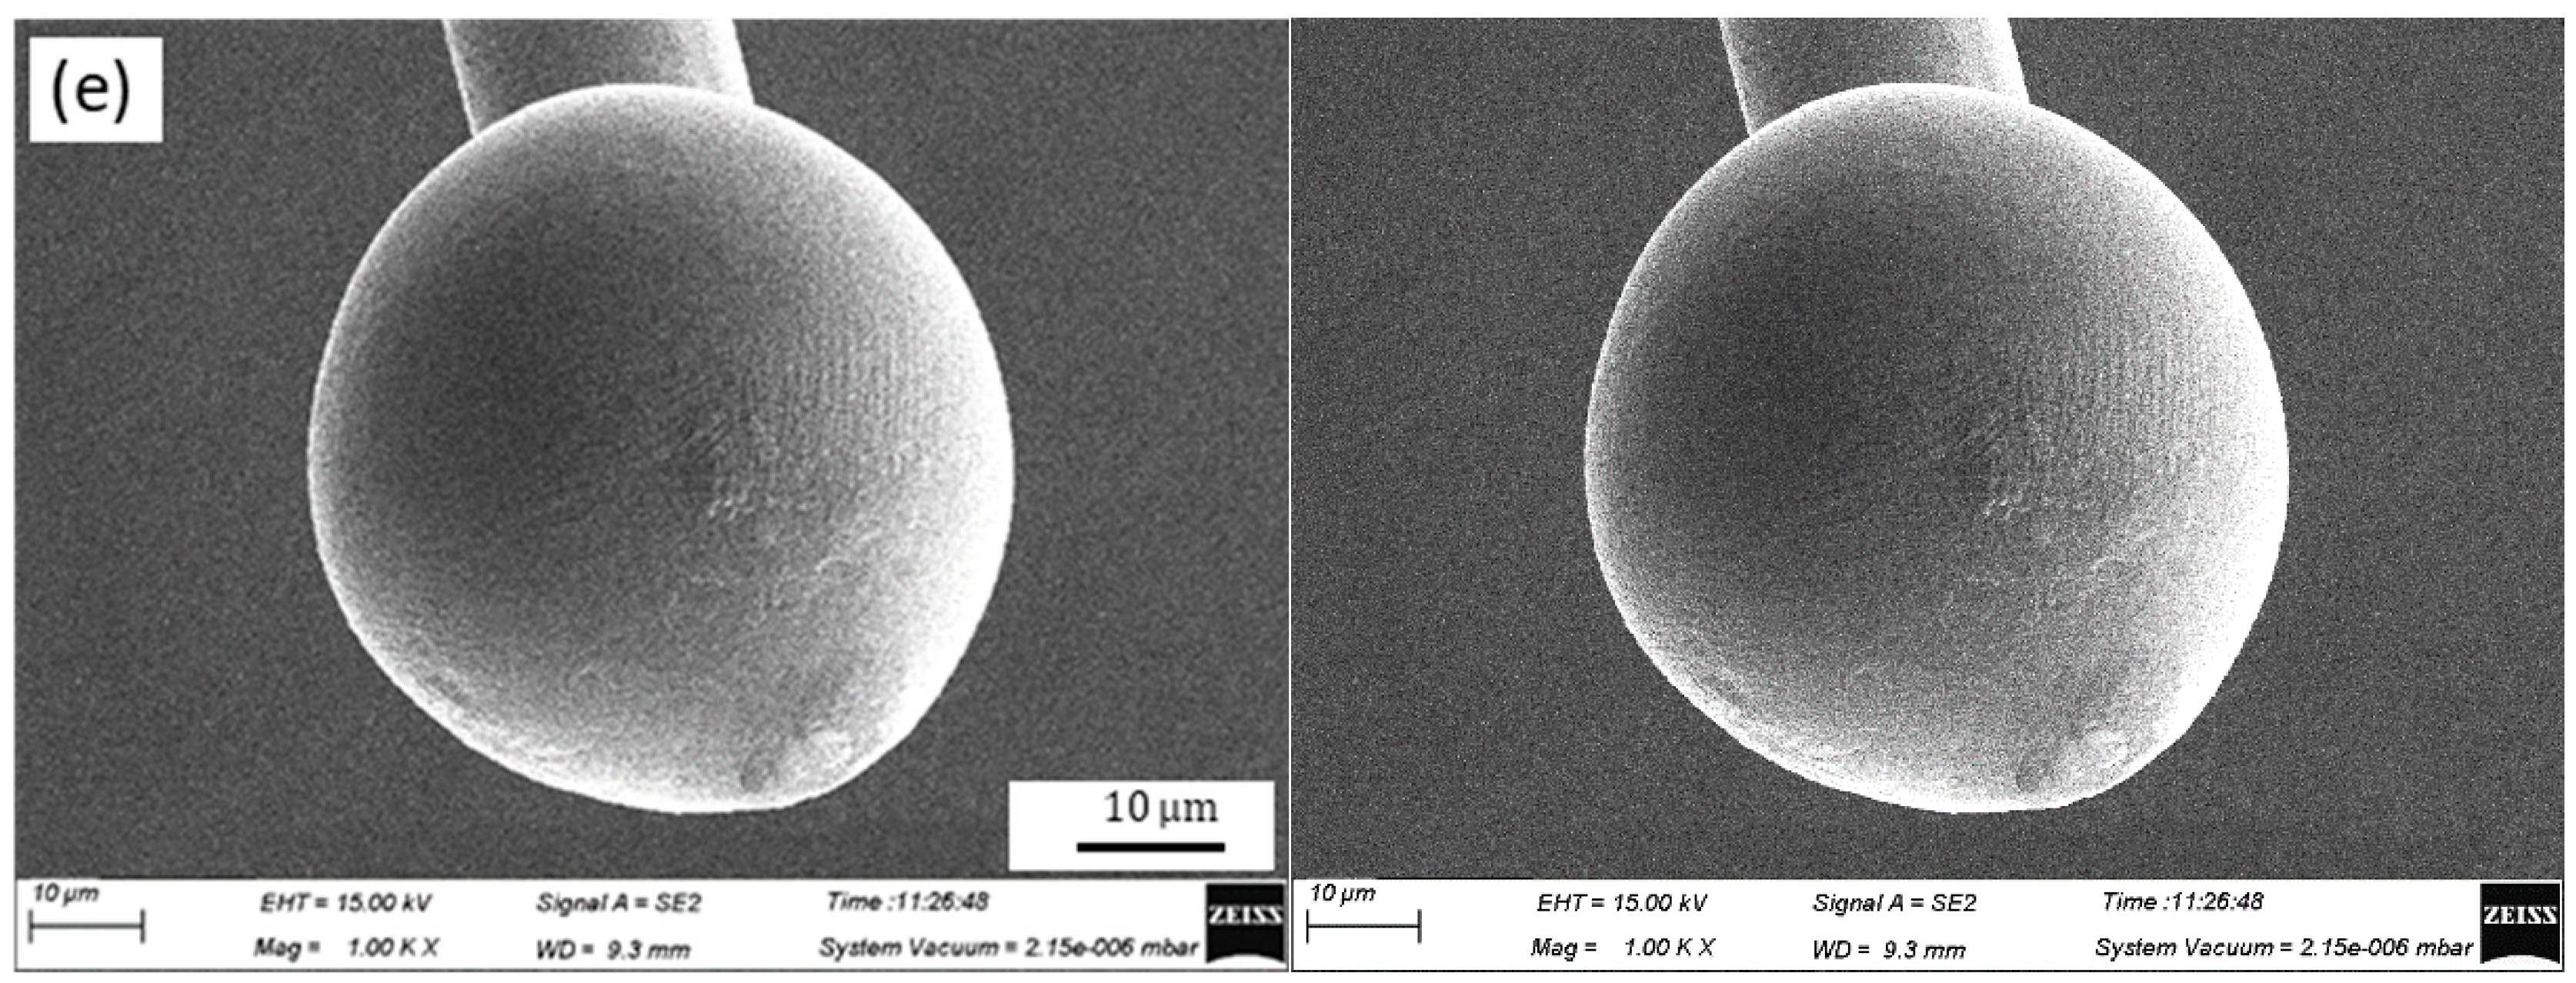
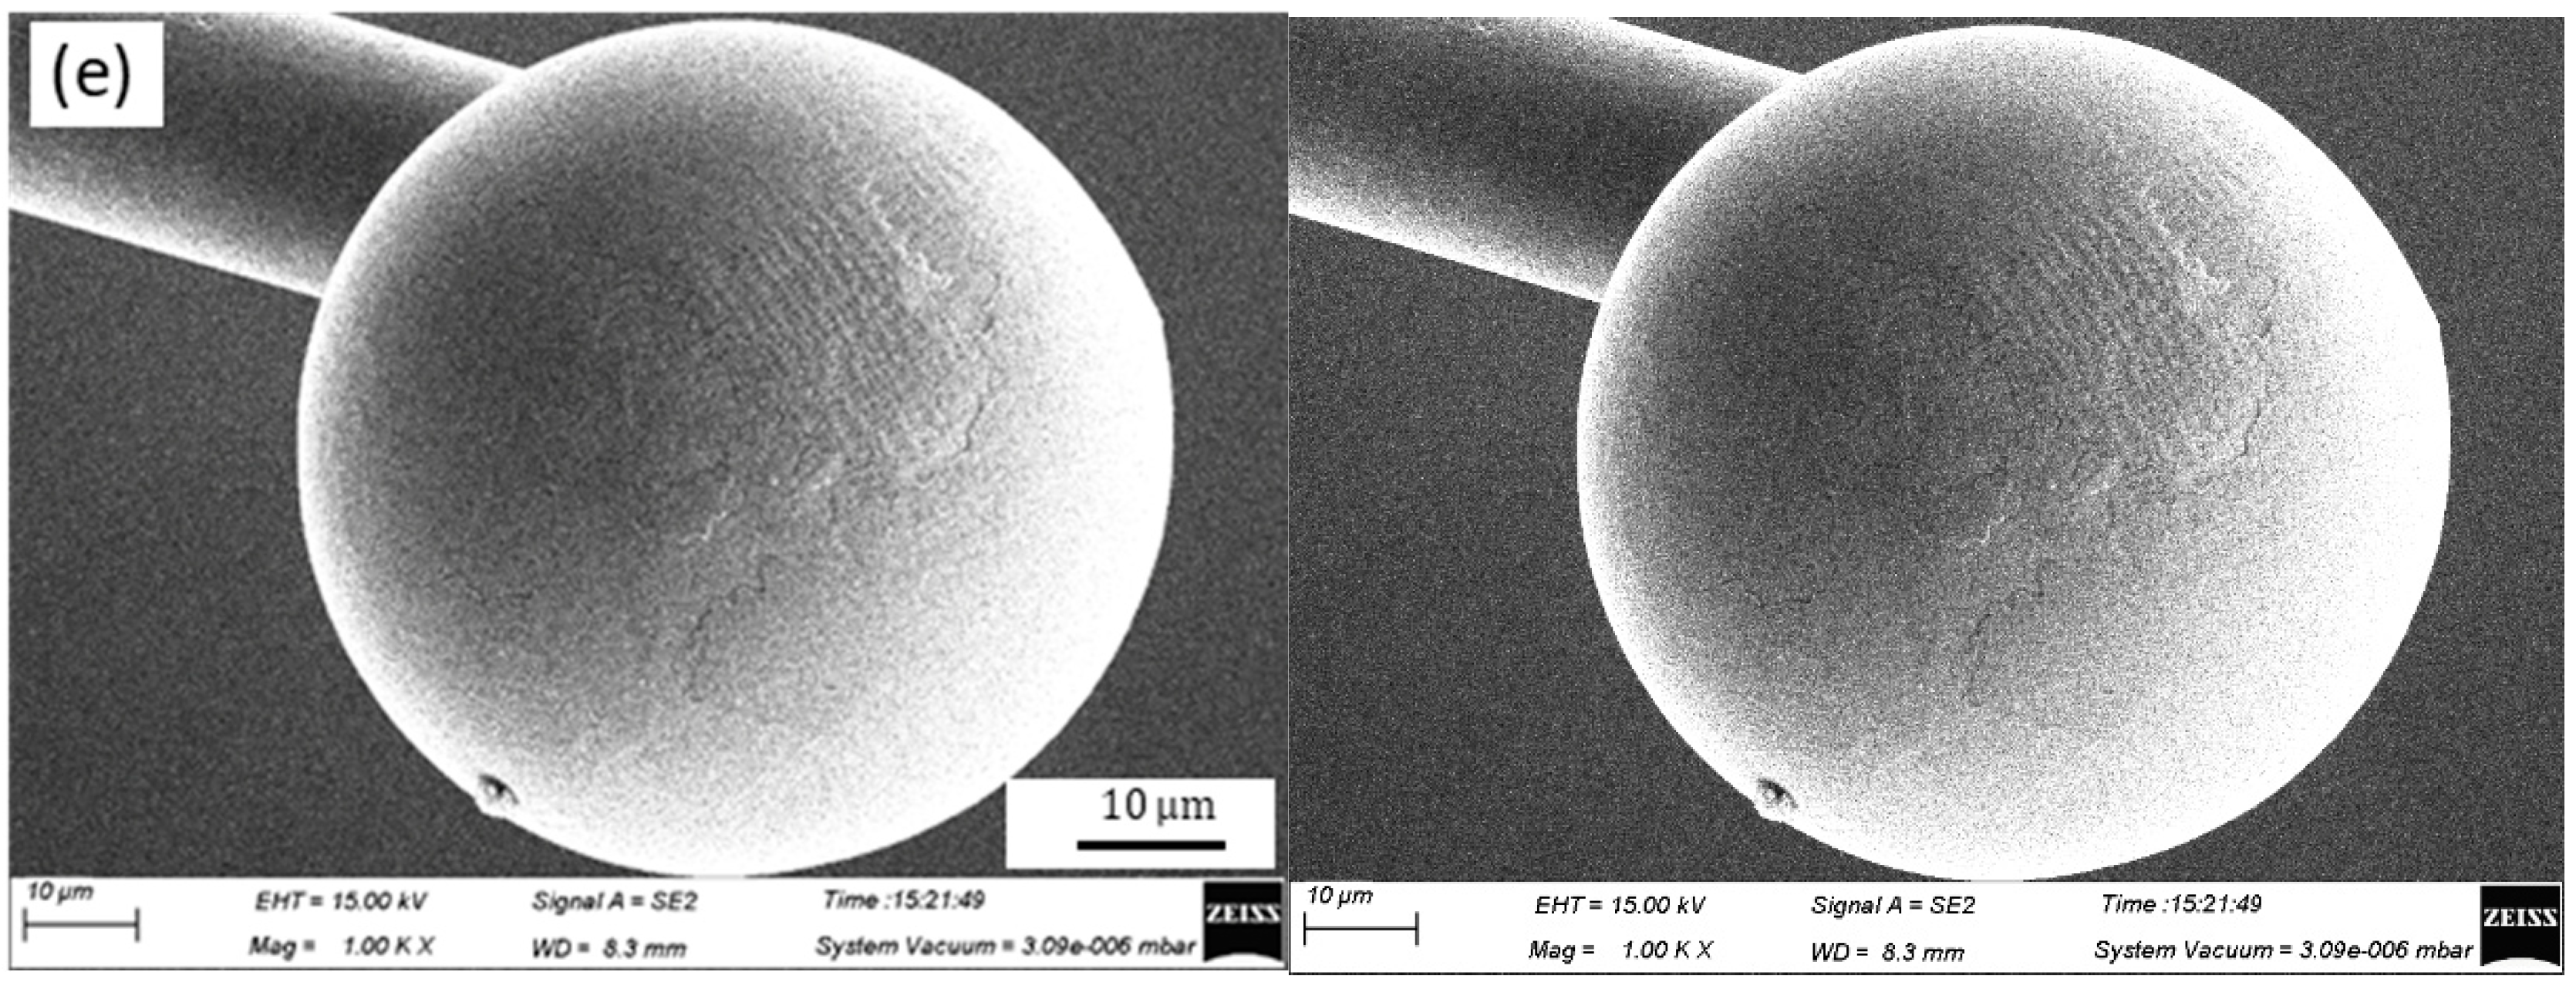
3.1. Effects of EFO Current on Geometry of FAB of Ag-10Au-3.6Pd Alloy Bonding Wire
3.2. Effects of EFO Time on Geometry of FAB of Ag-10Au-3.6Pd Alloy Bonding Wire
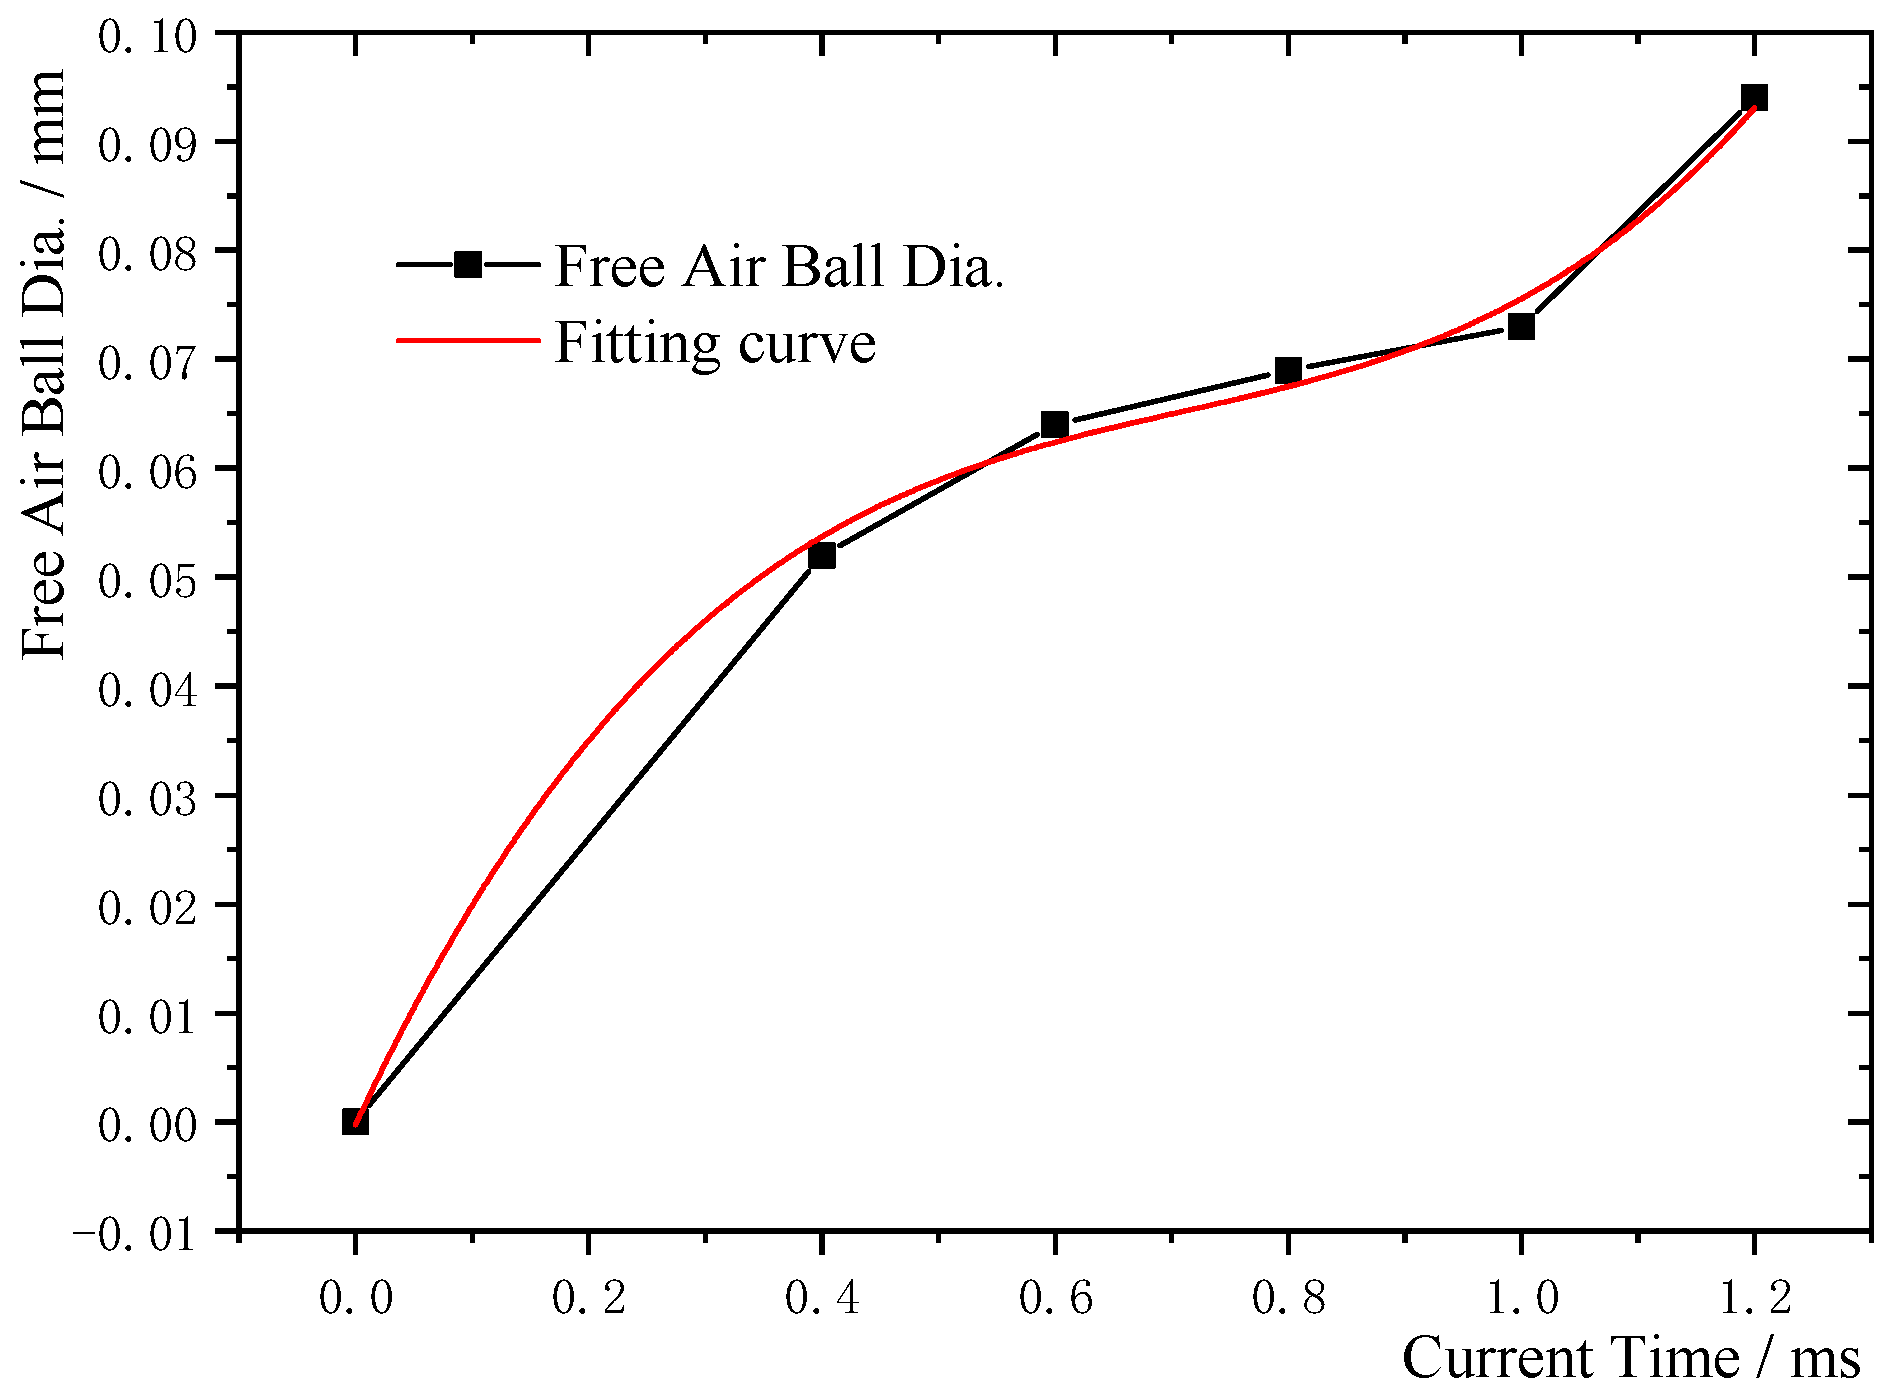
3.3. Relationship between Diameter of FAB of Ag-10Au-3.6Pd and EFO Time
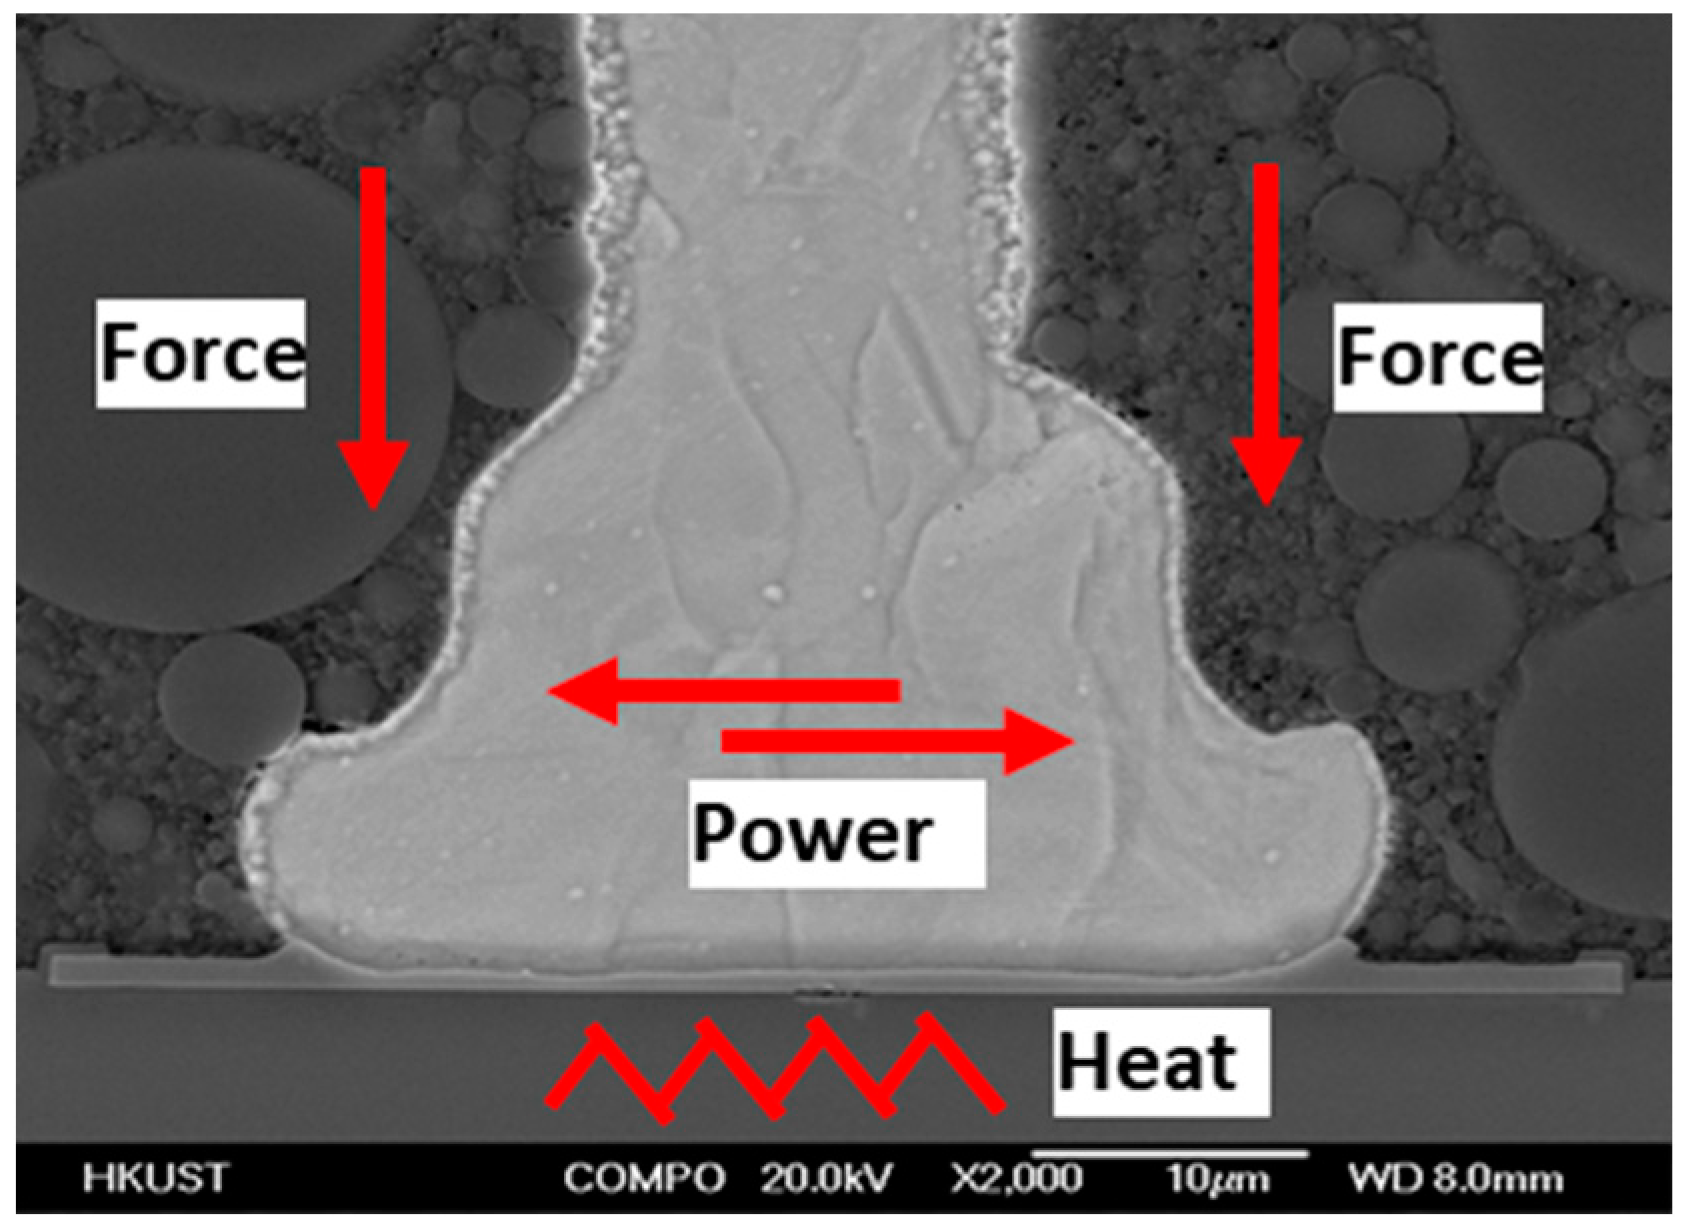
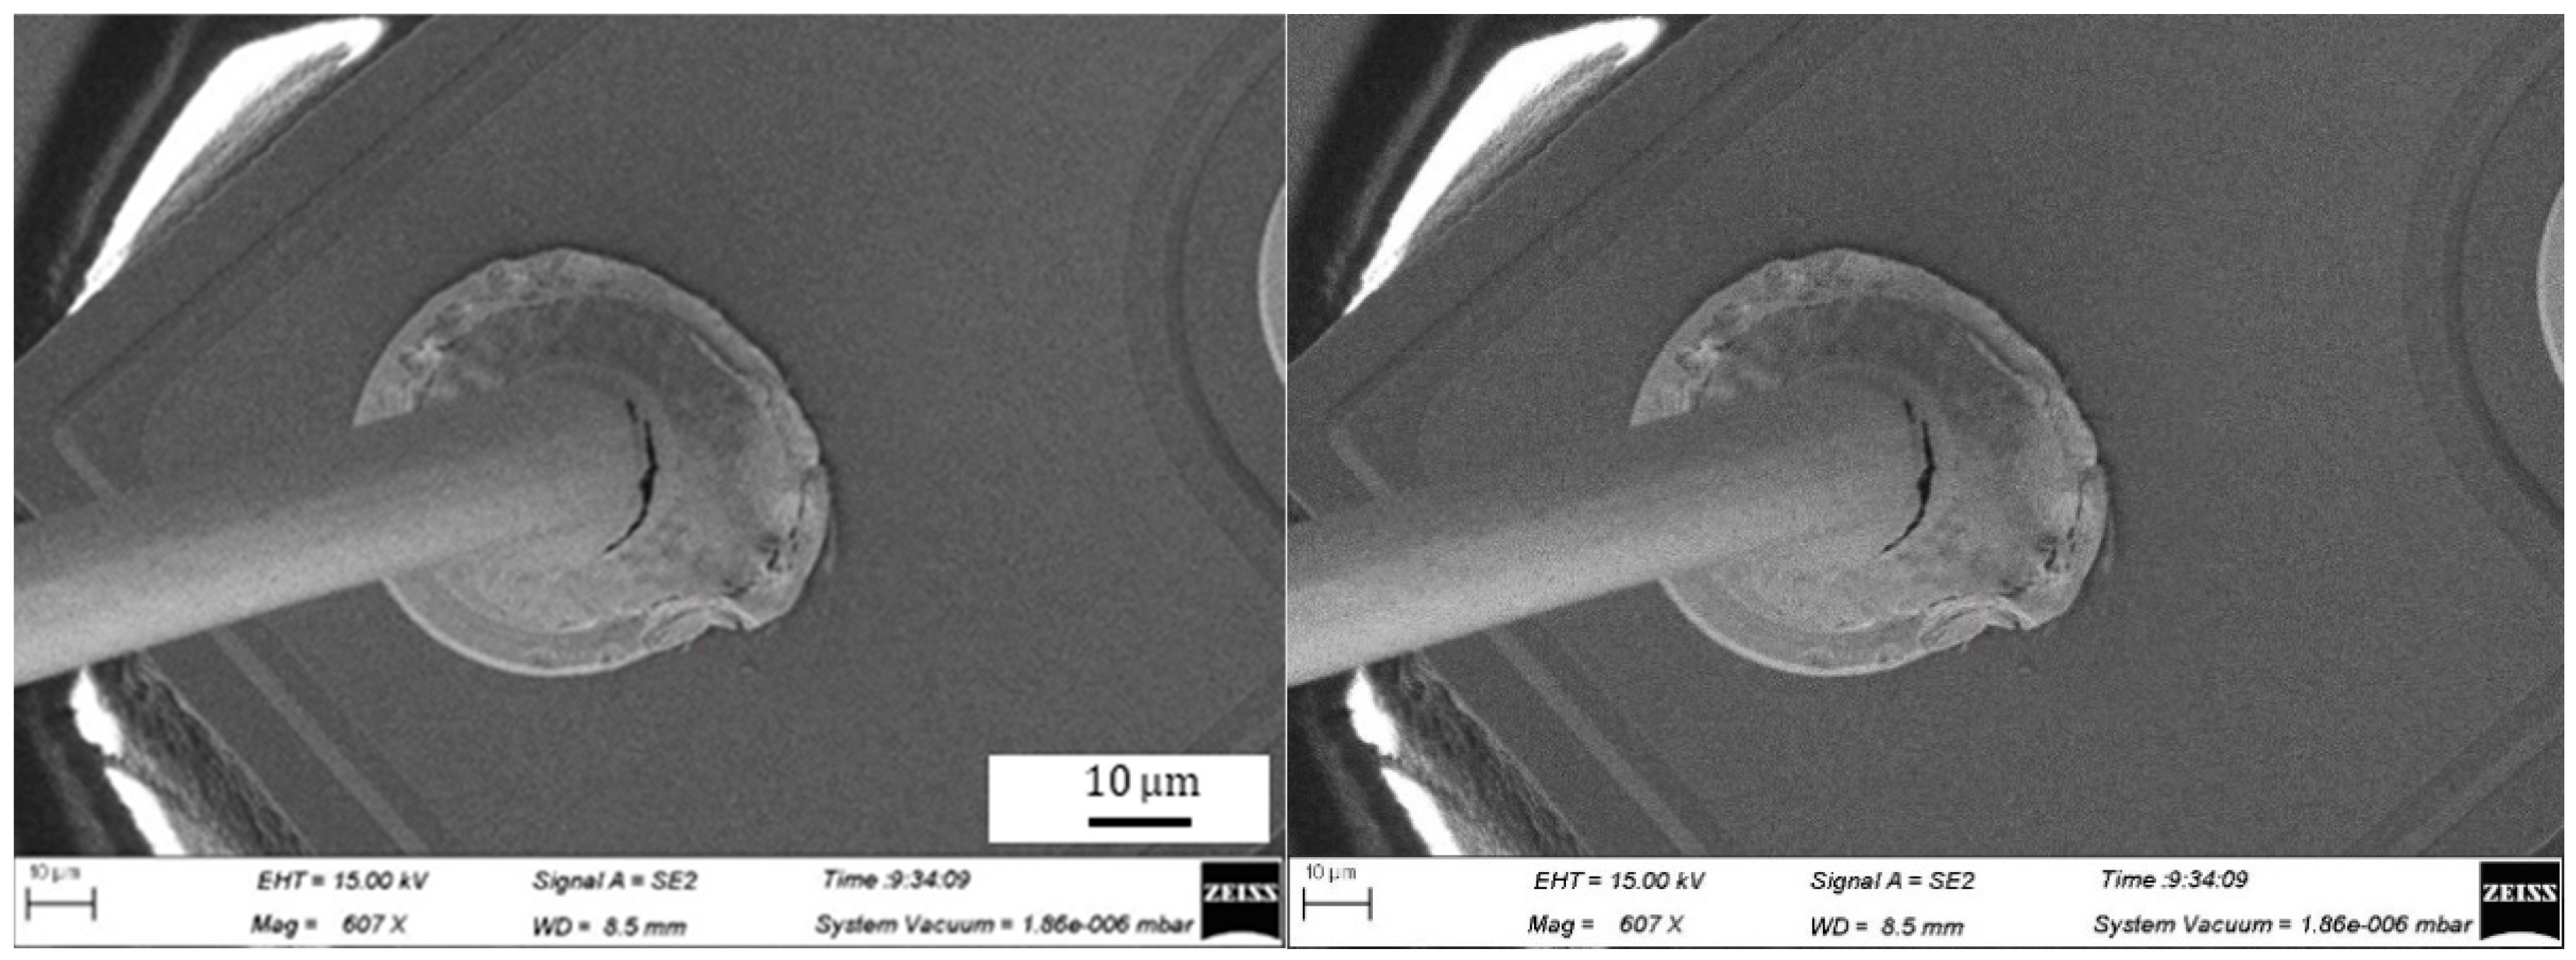
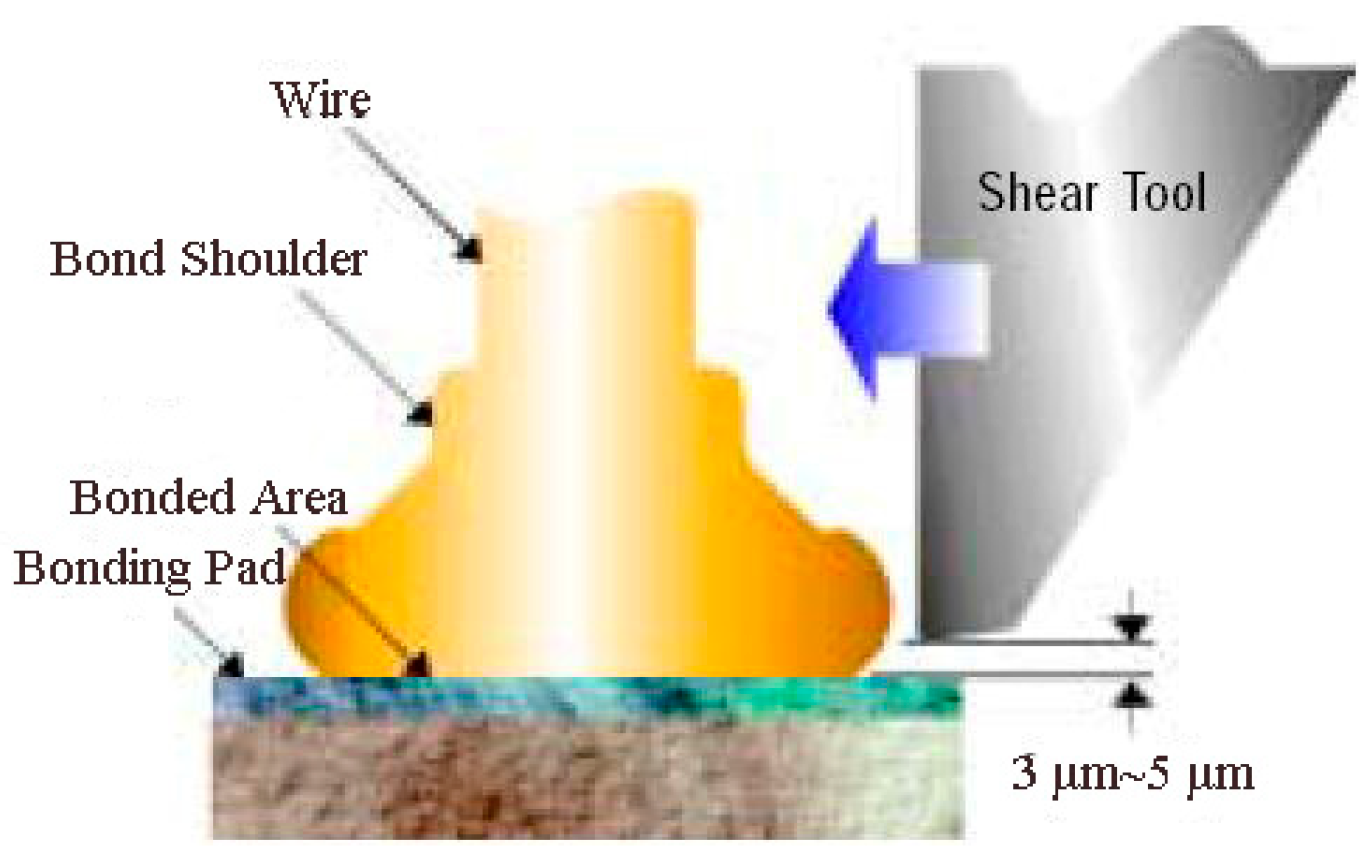
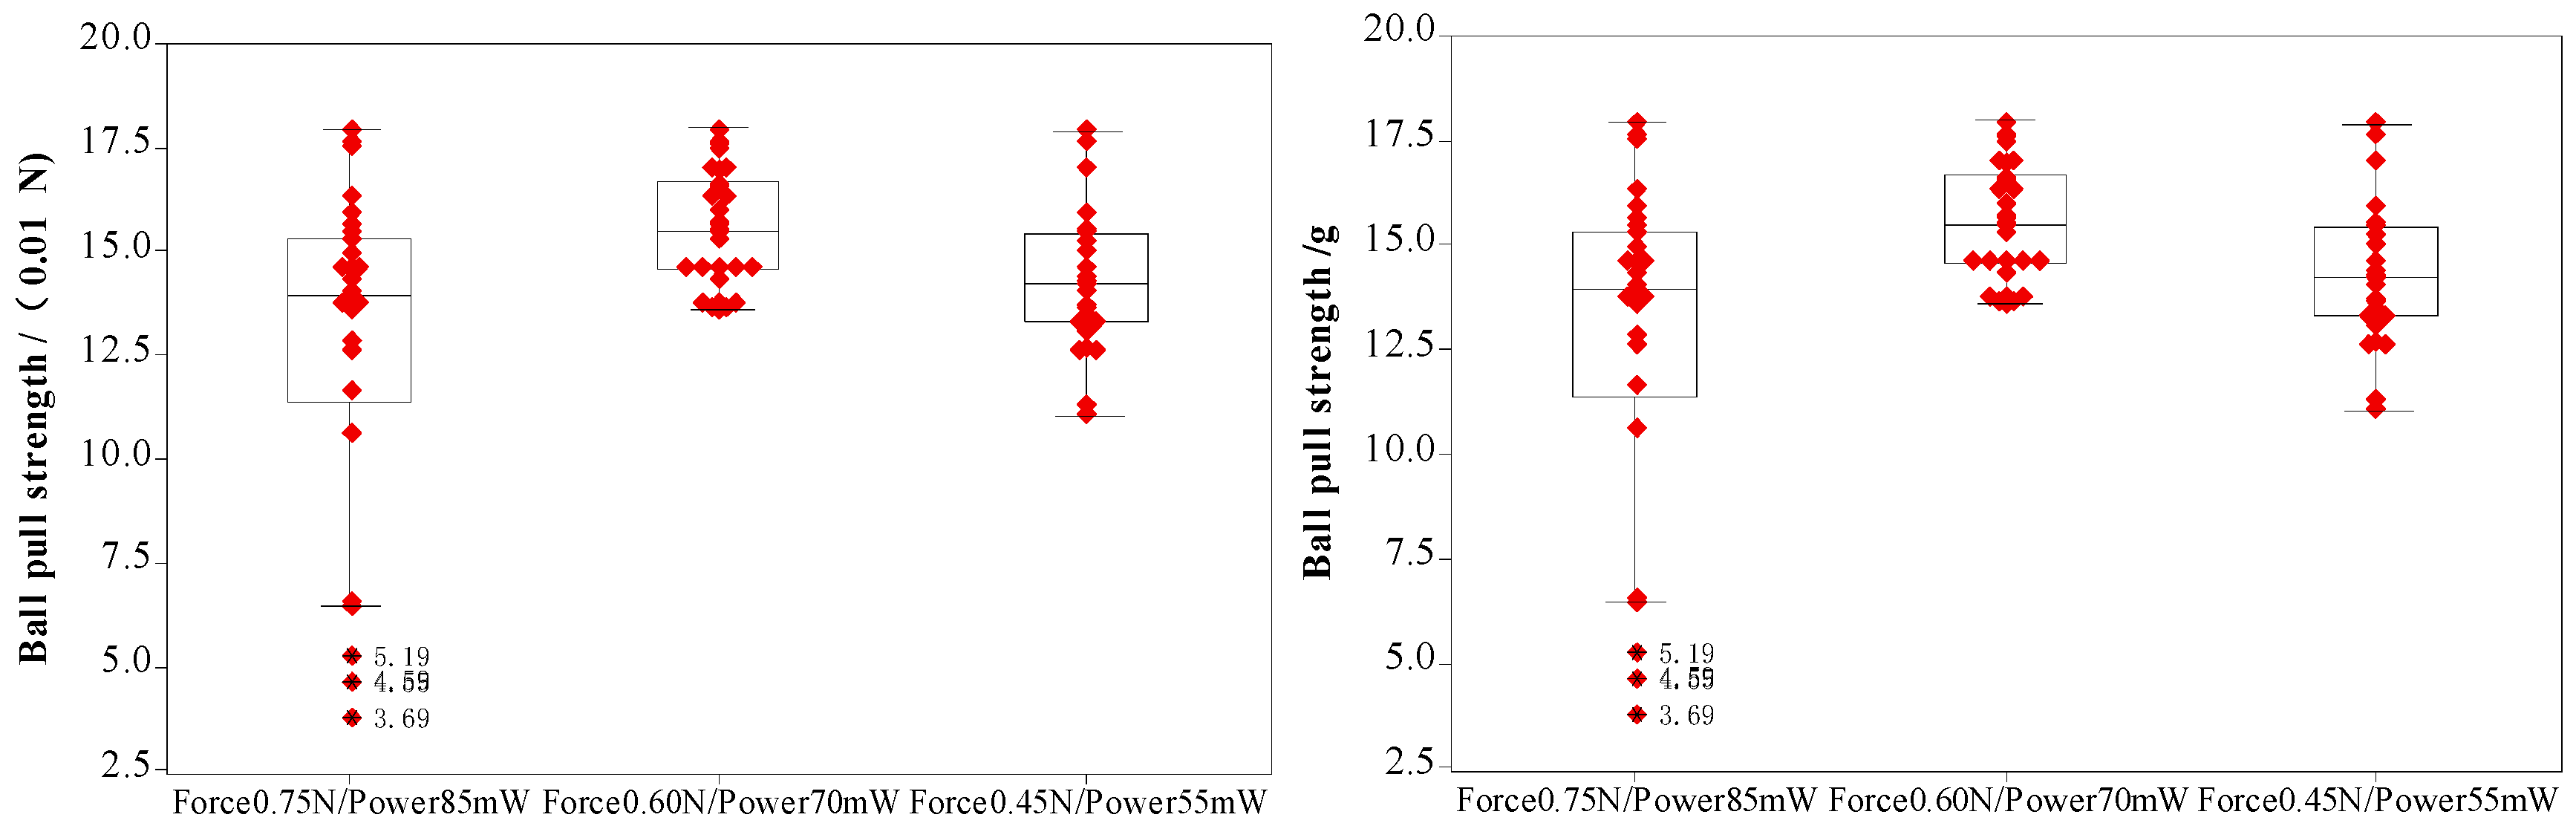
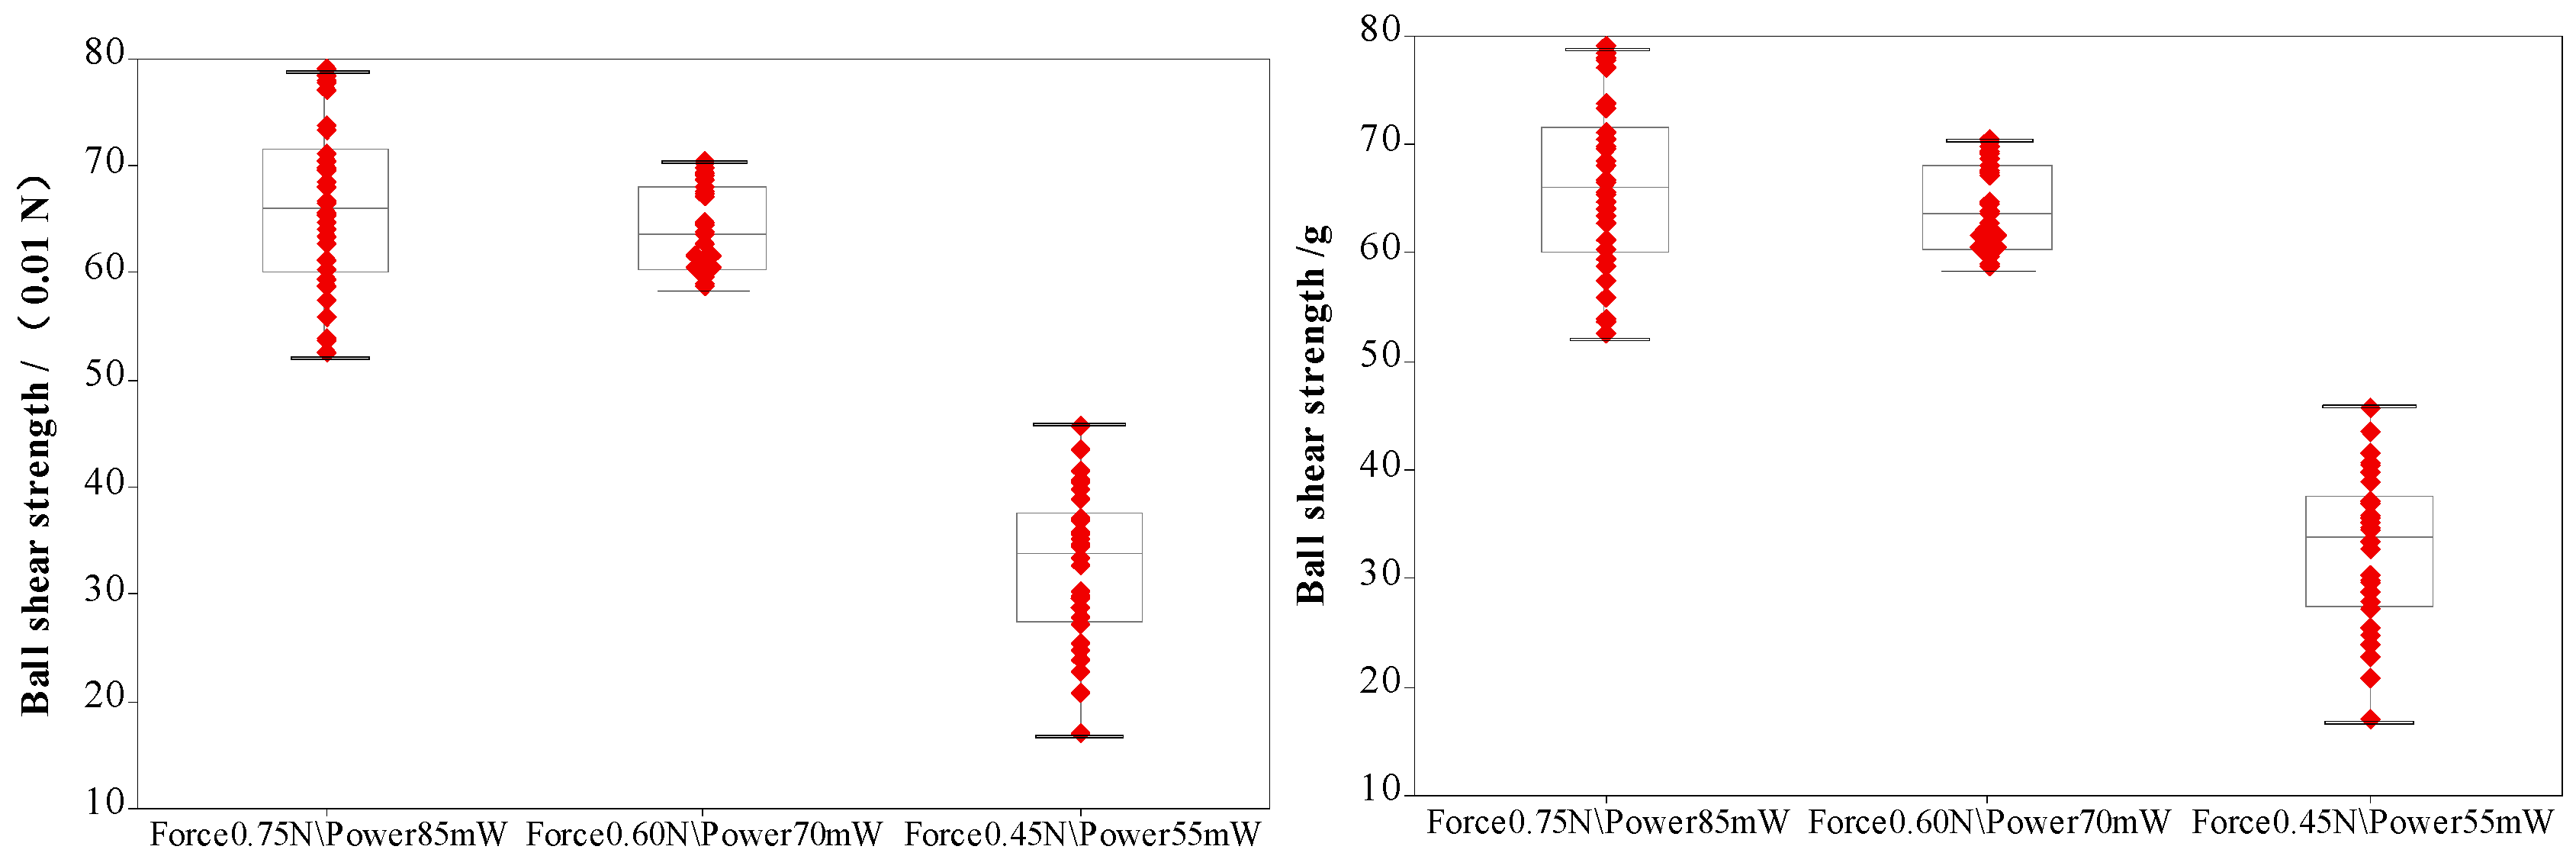
3.4. Effects of Bonding Power and Force on Ball Bonded Strength of Ag-10Au-3.6Pd Alloy Wire
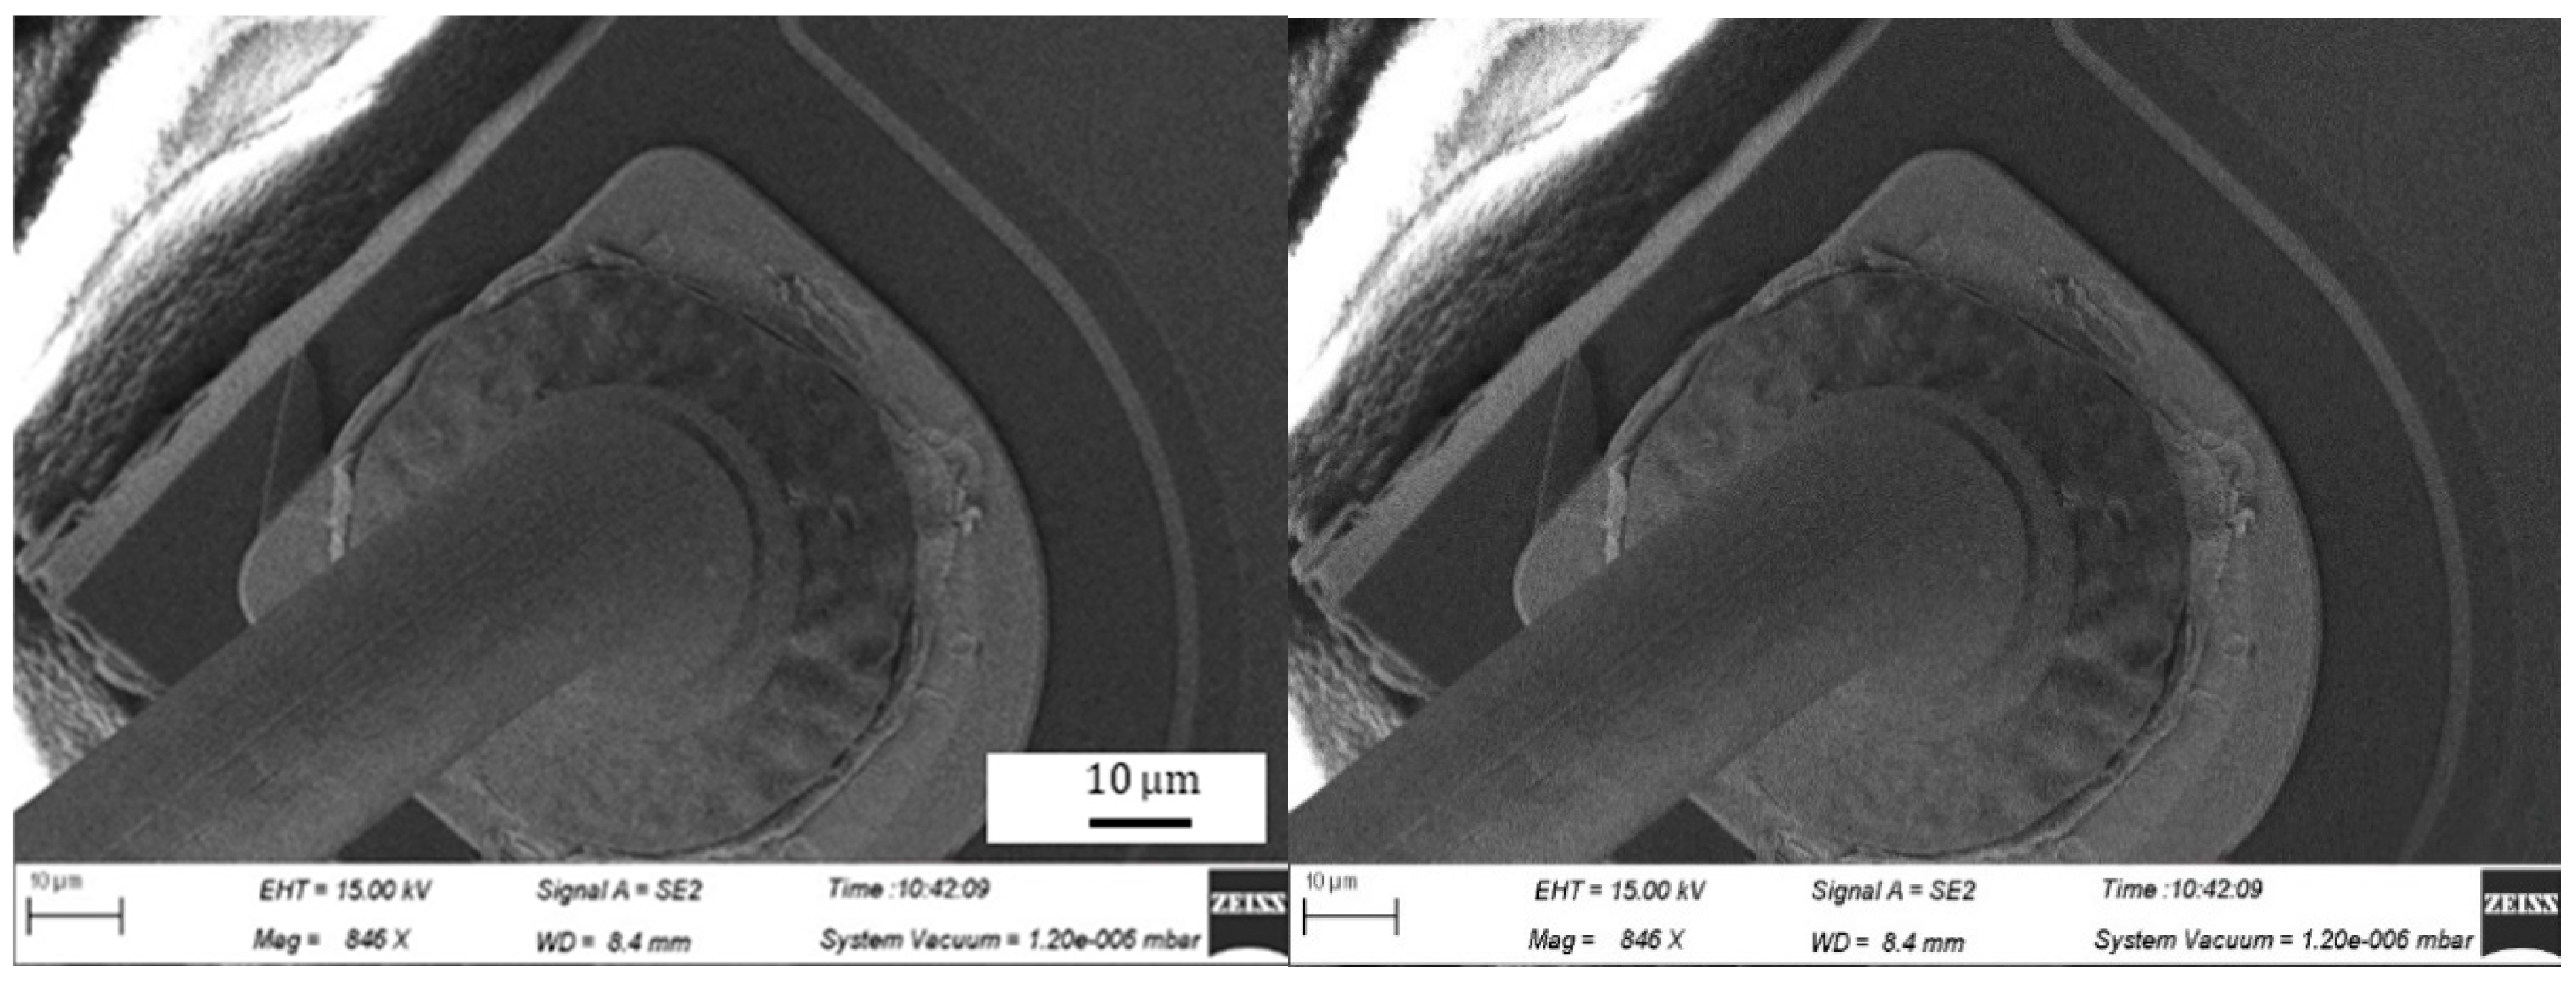
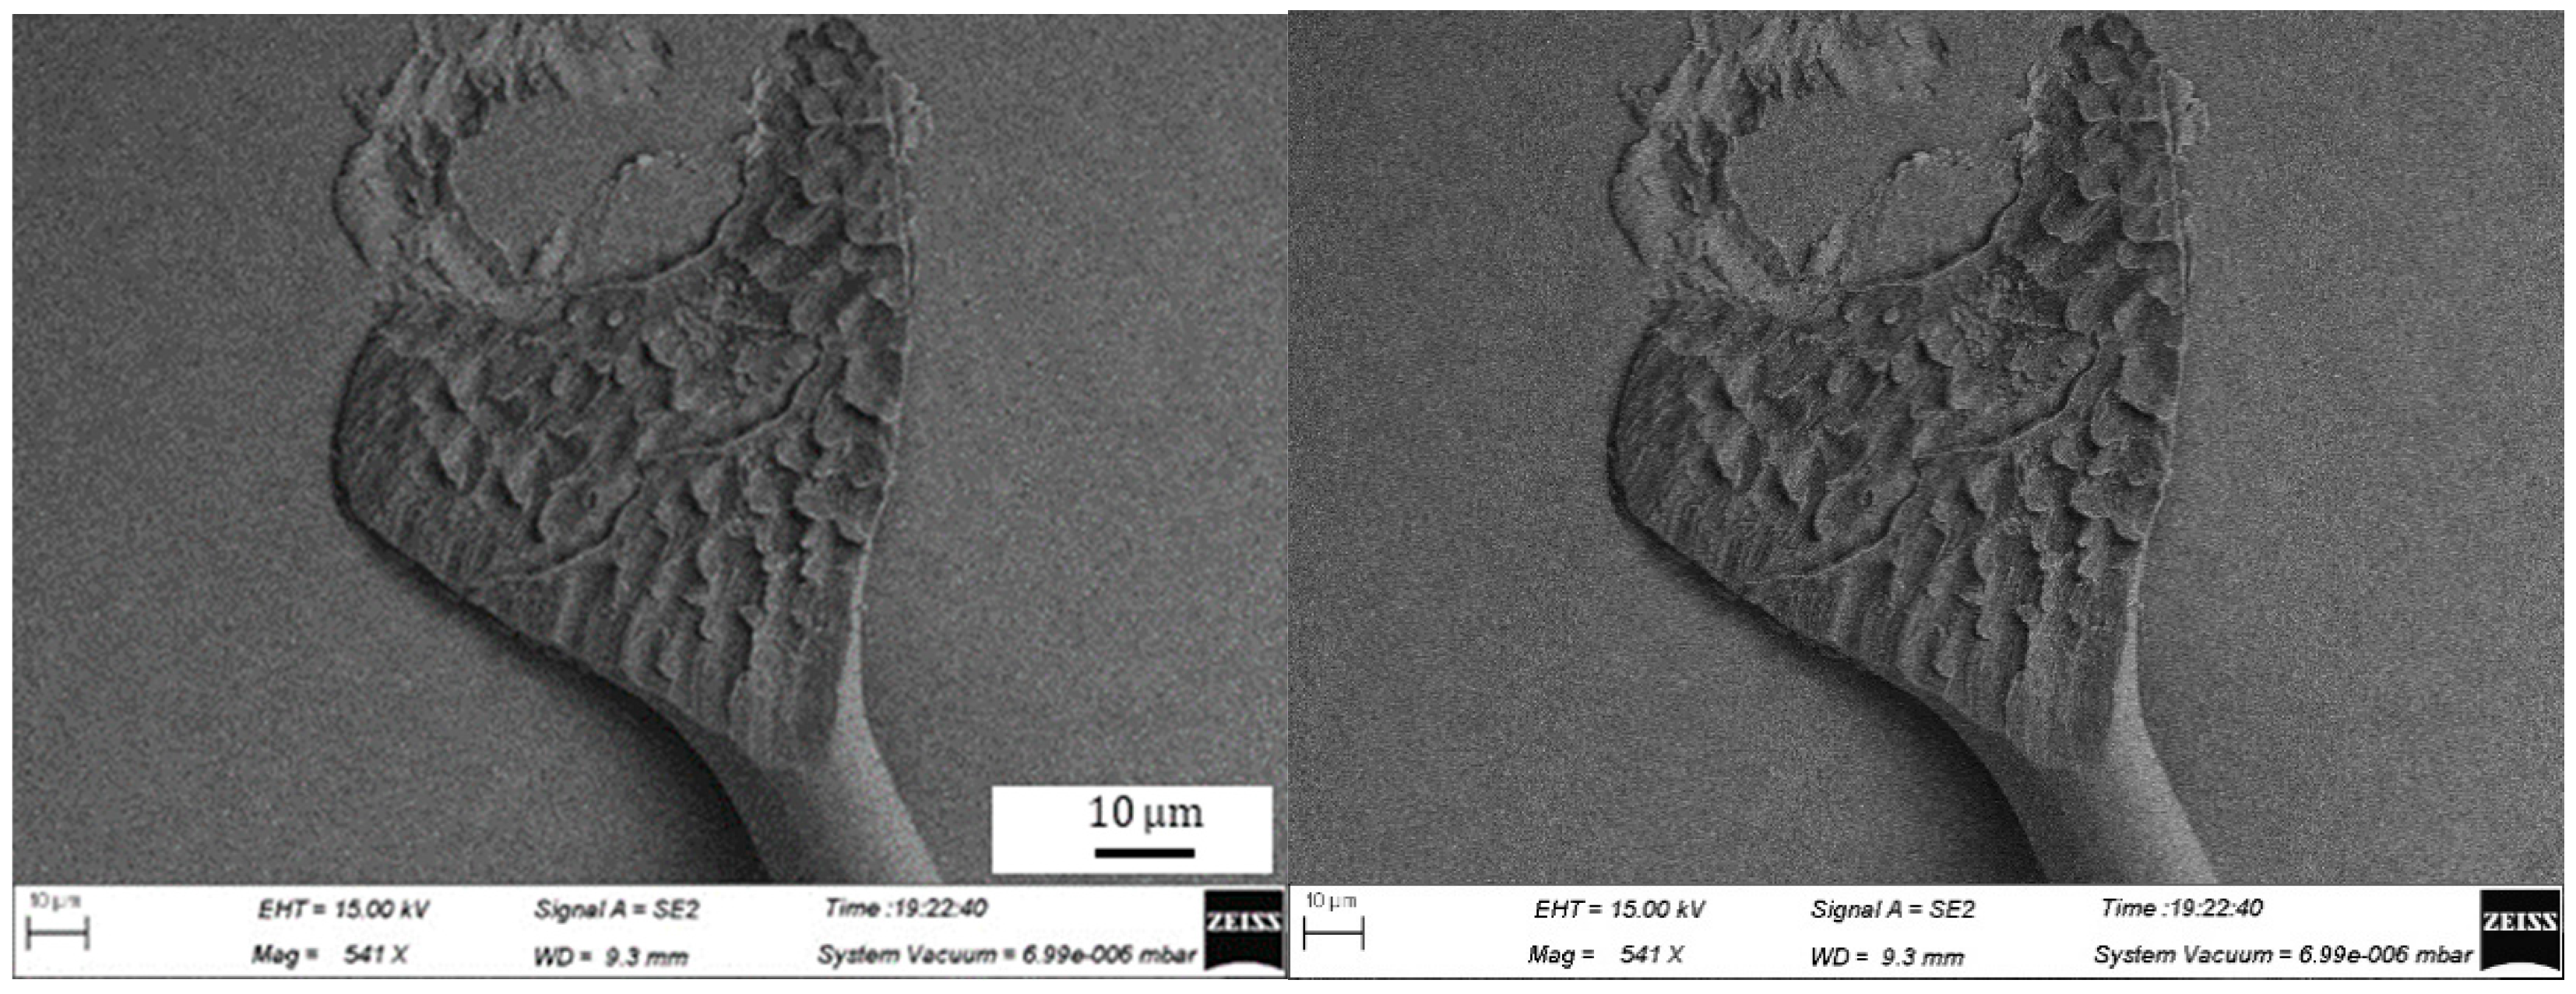
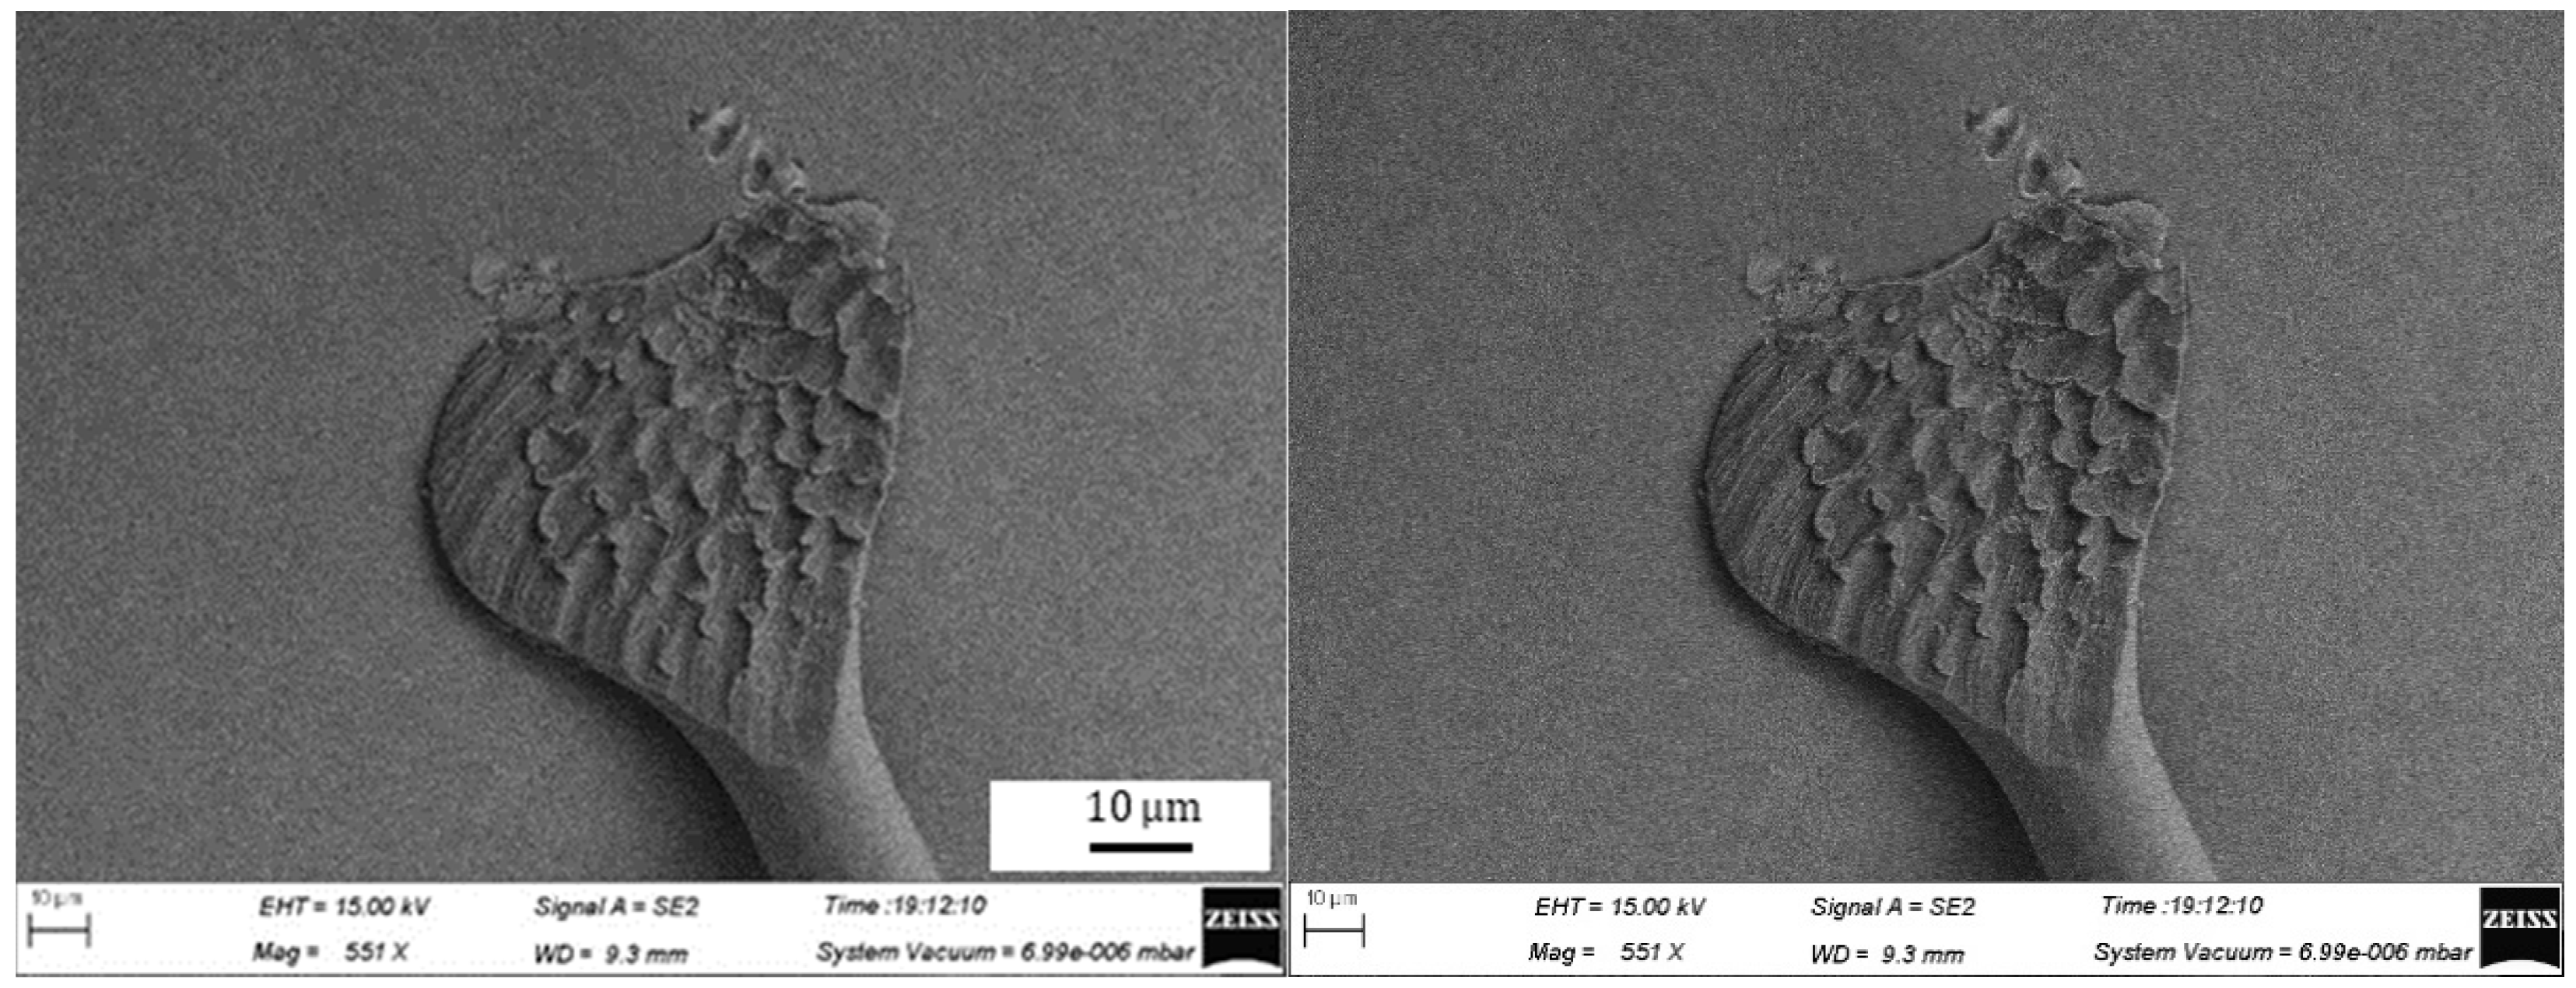
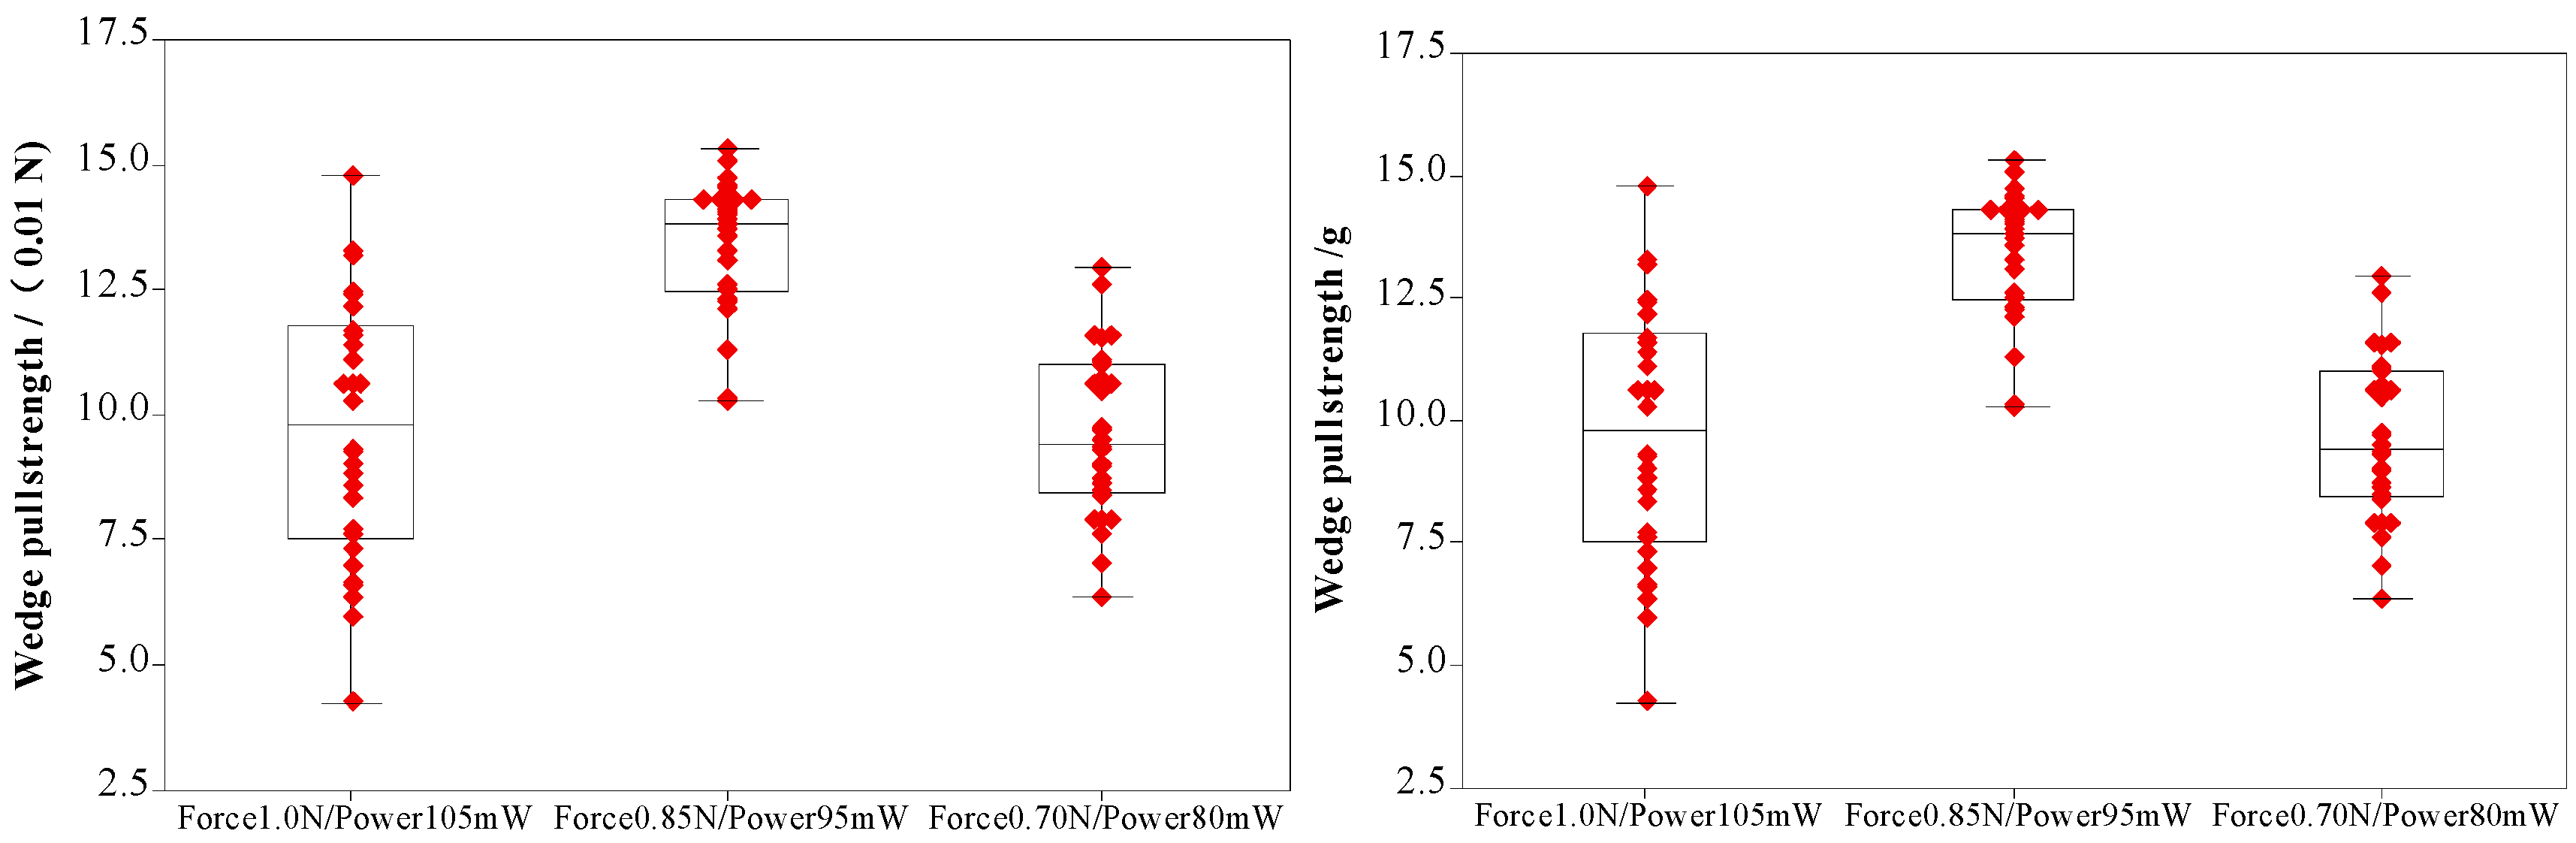
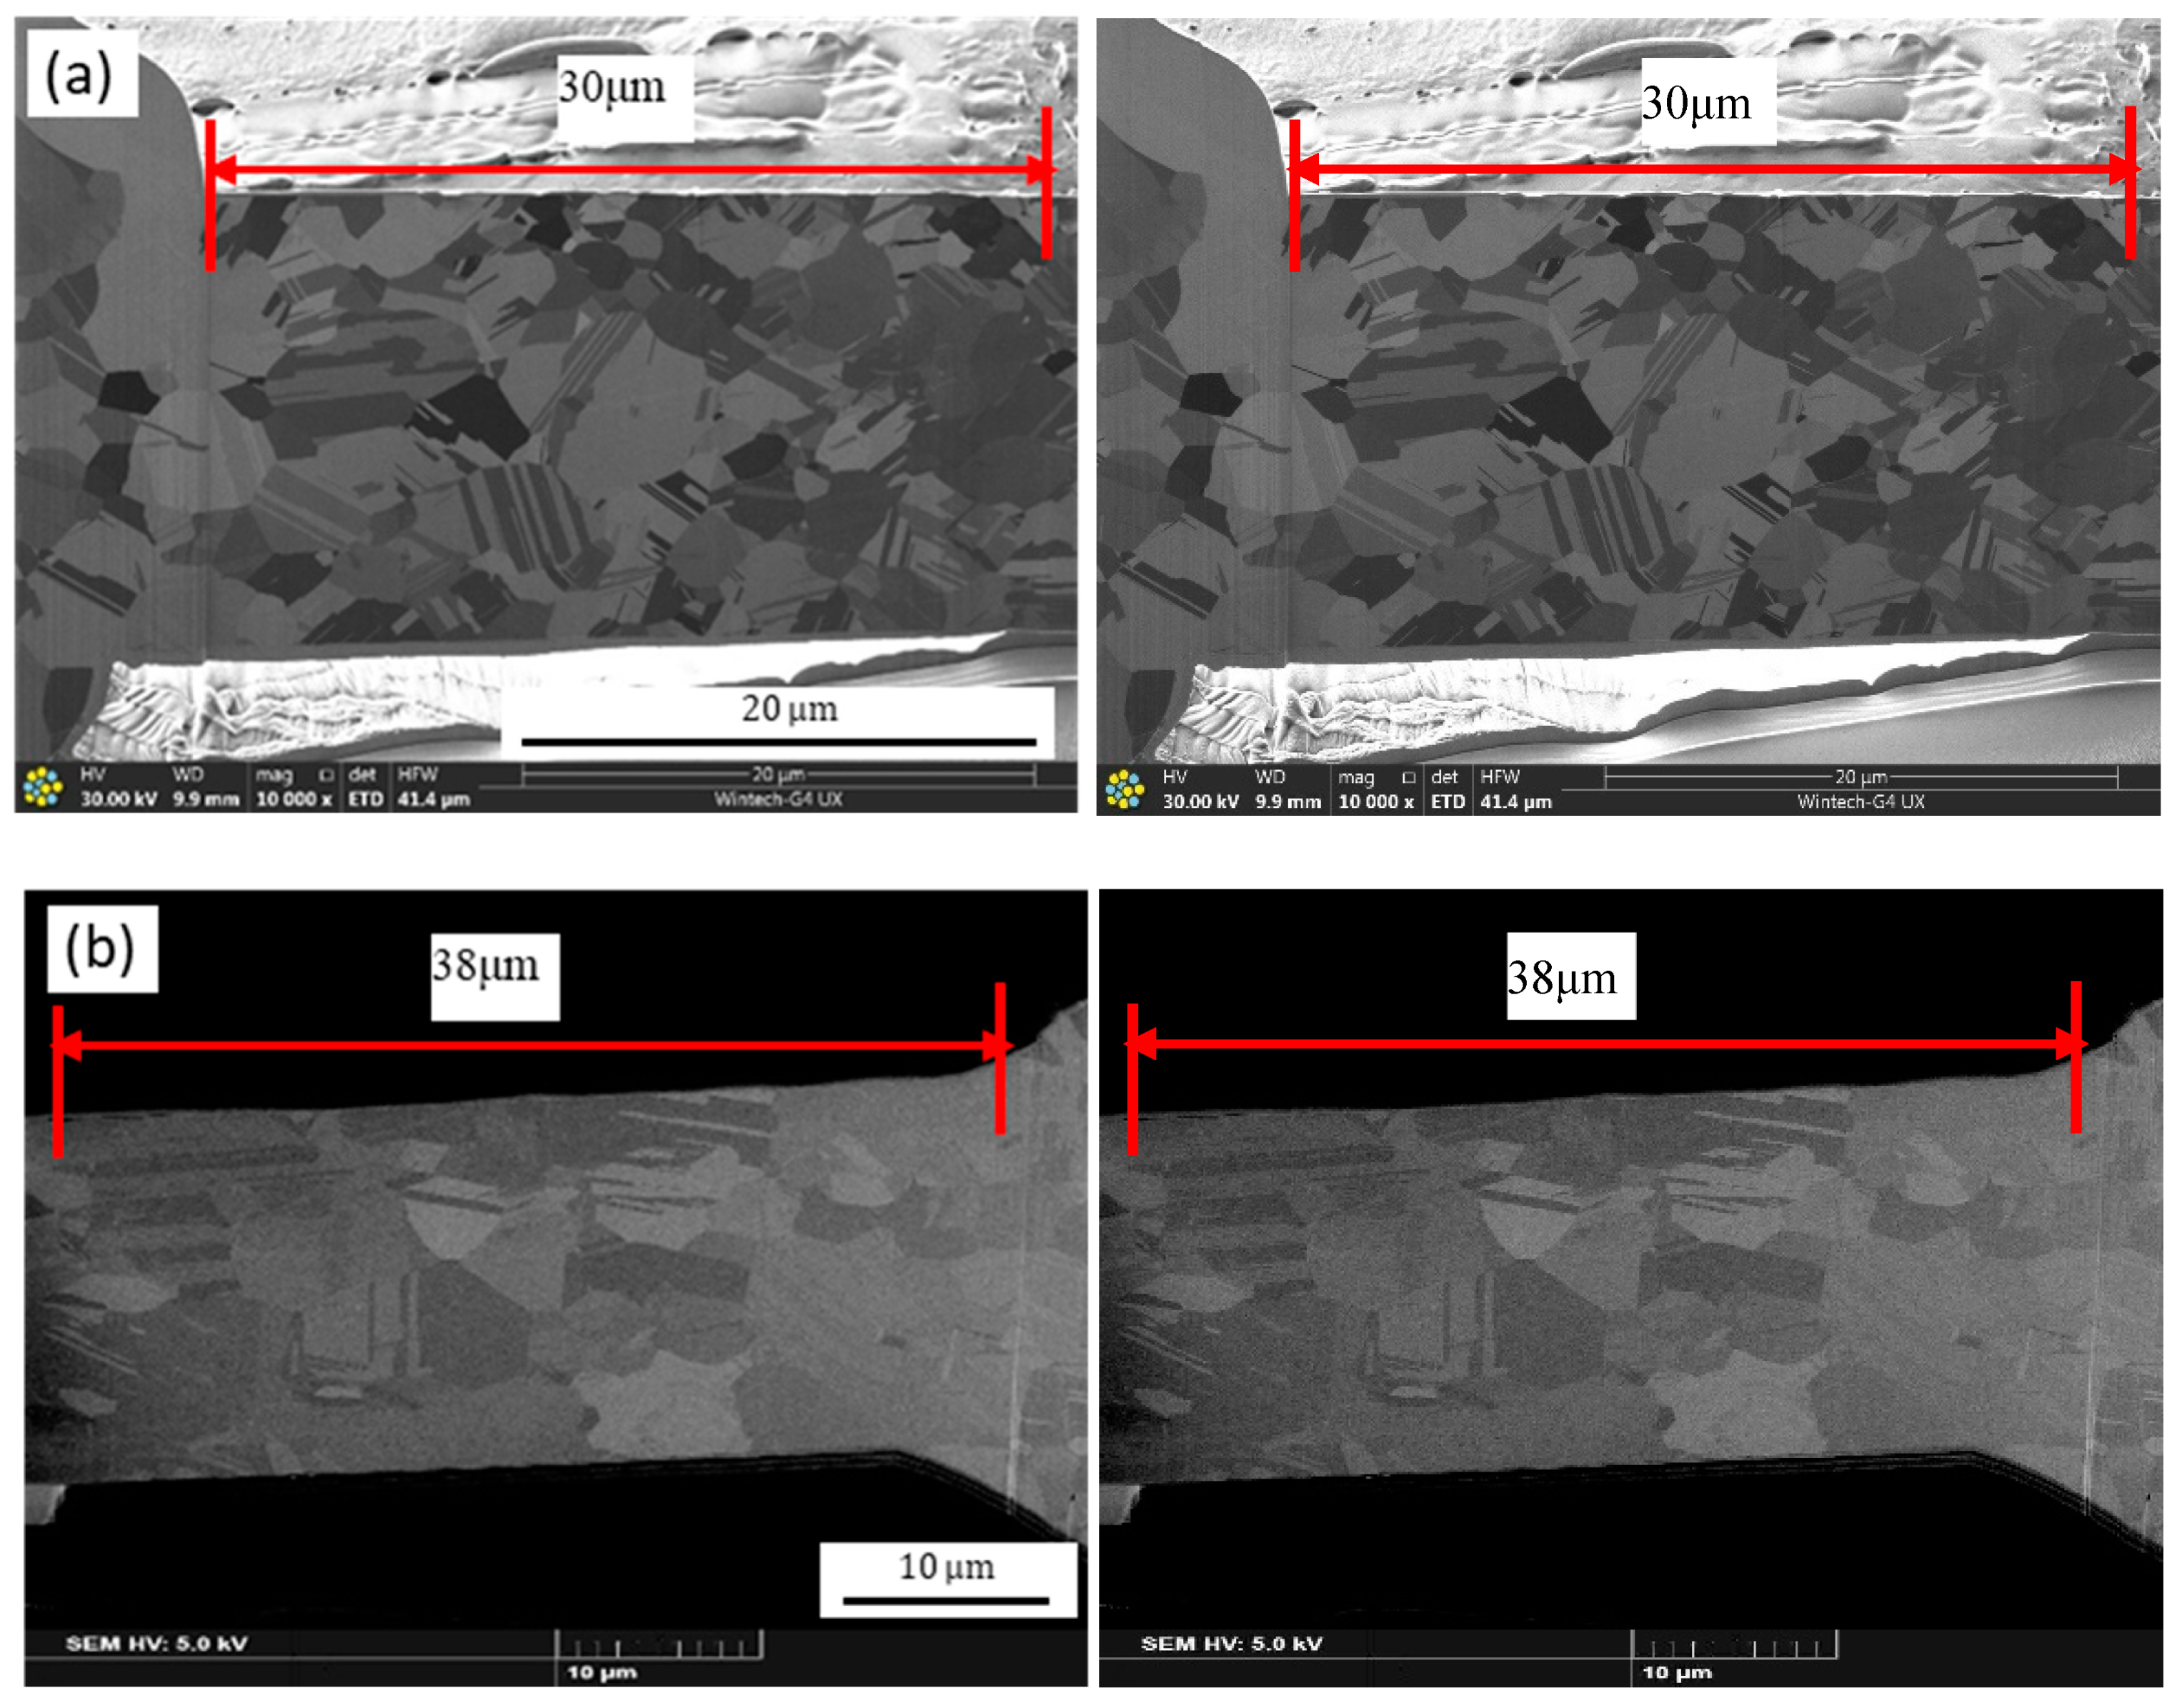
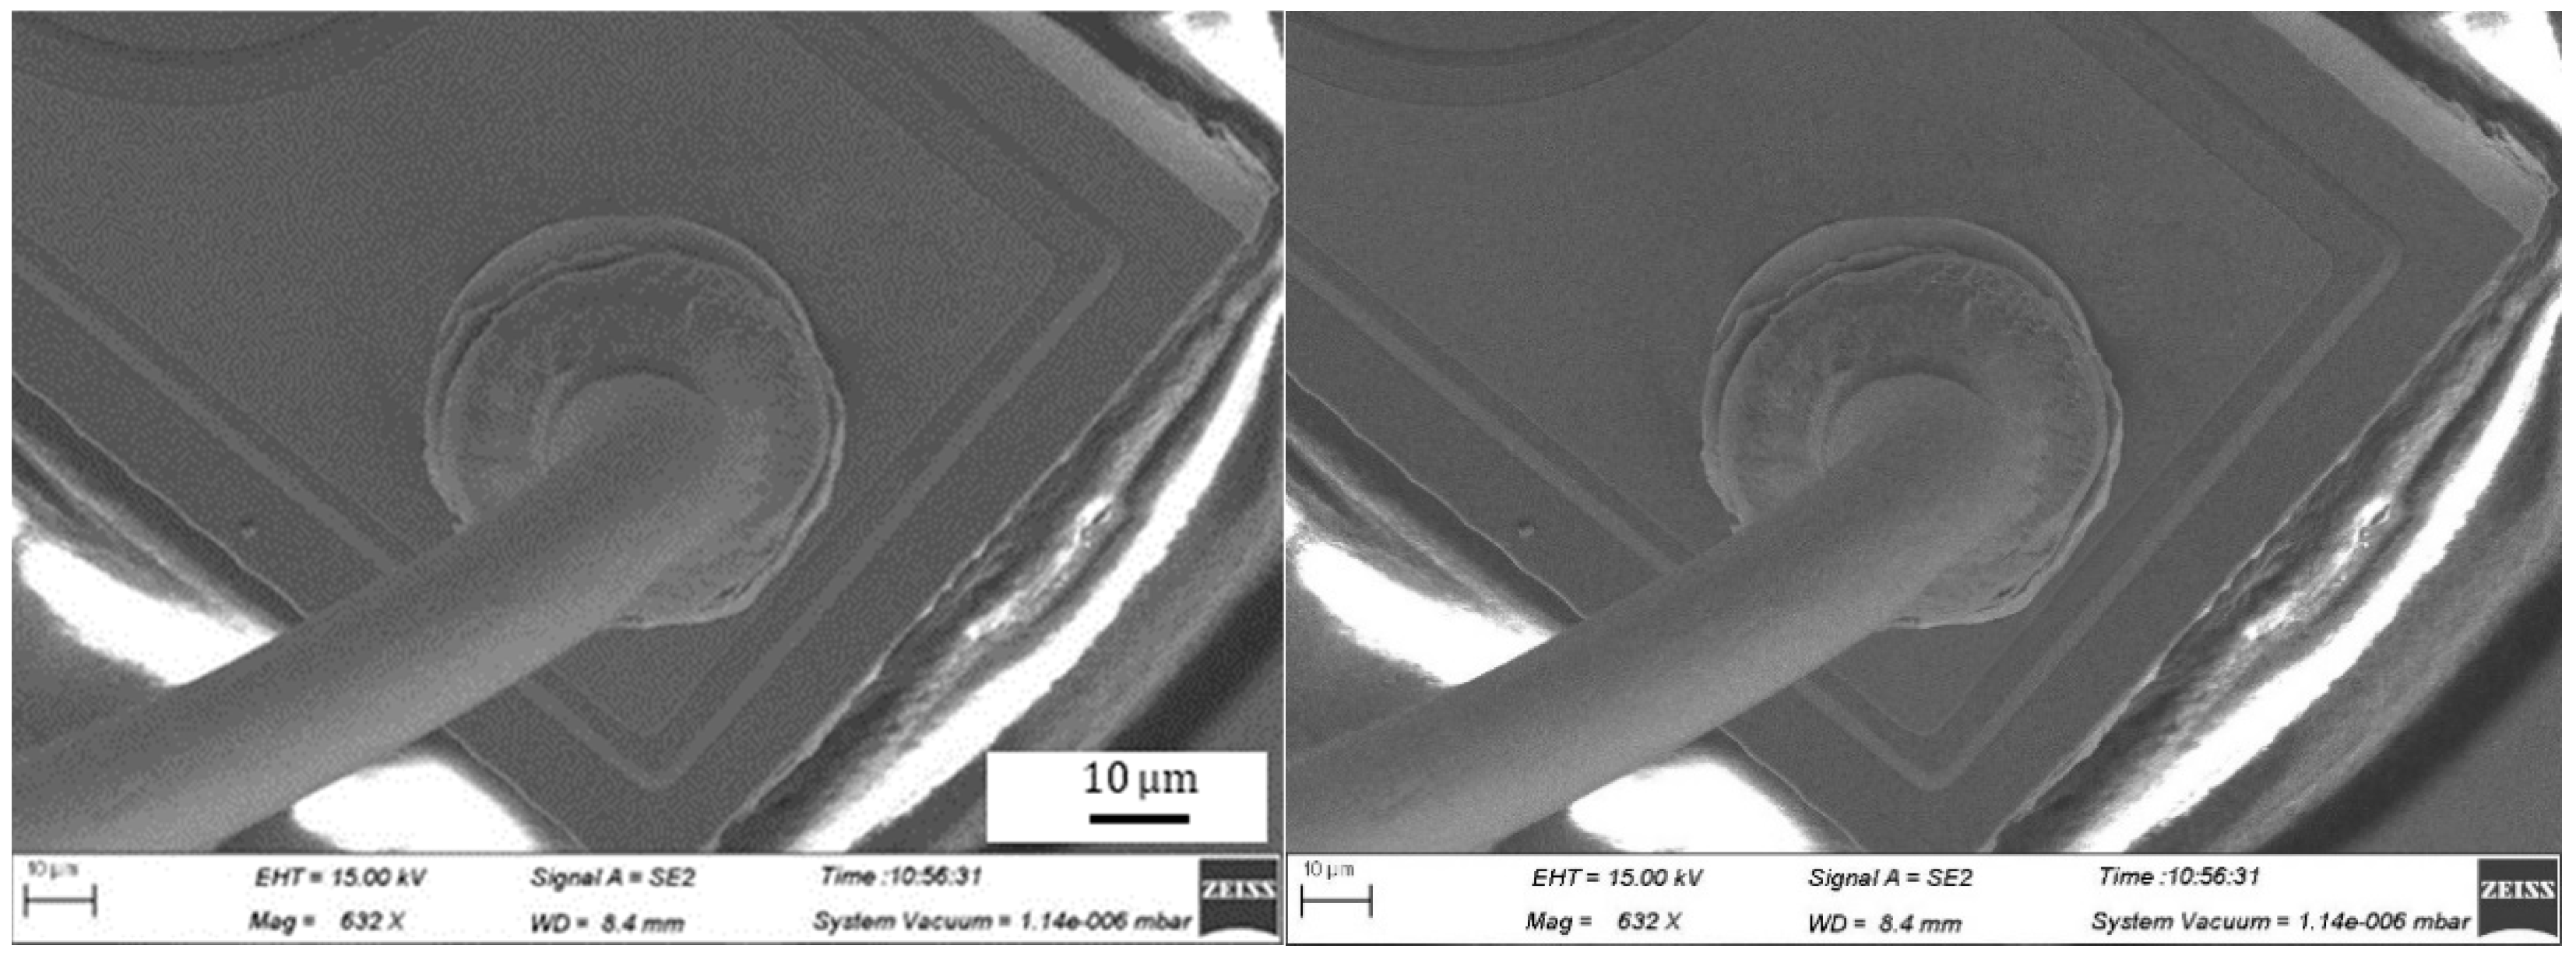
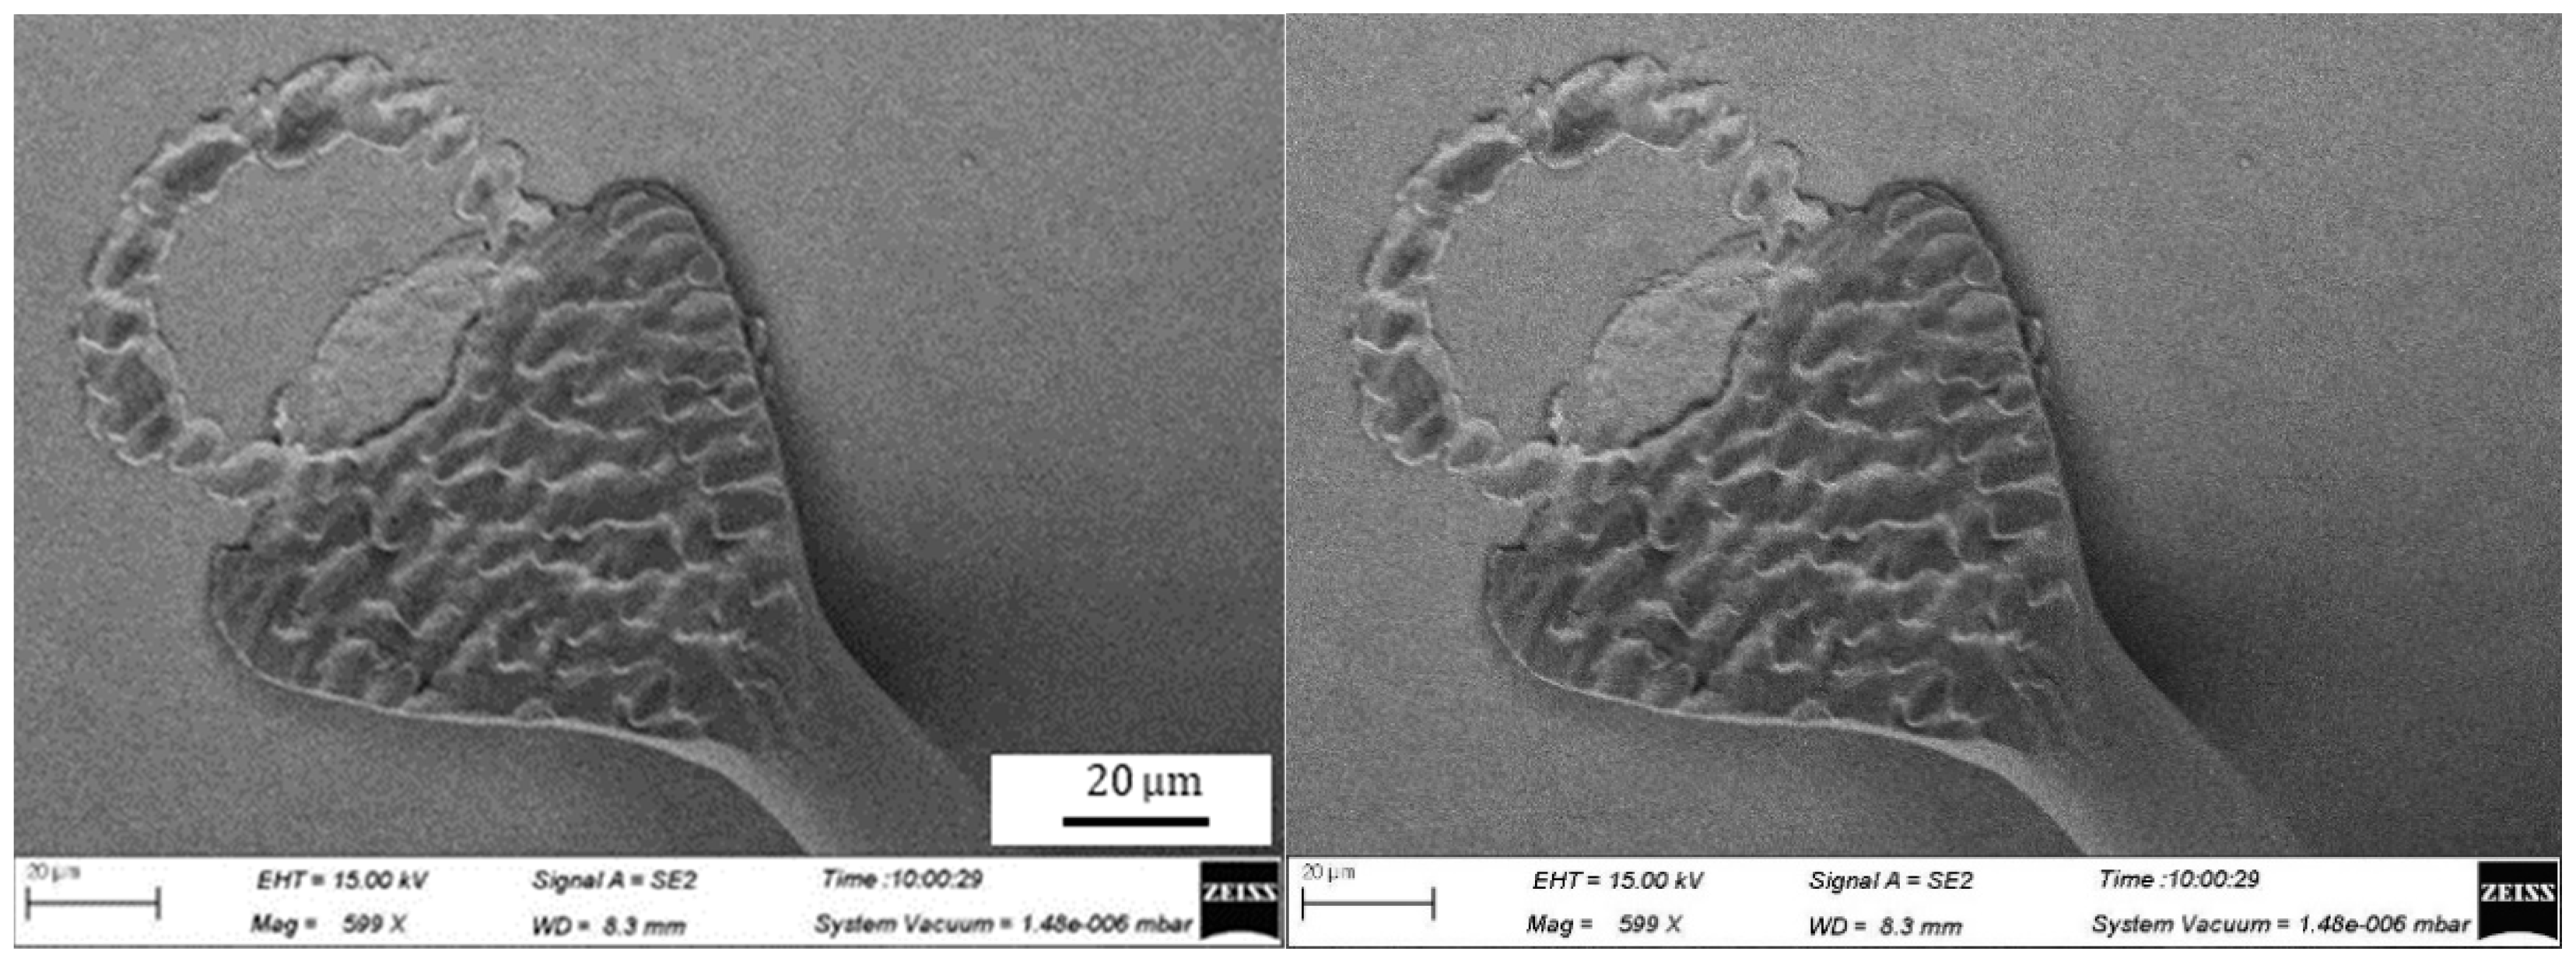
3.5. Effects of Bonding Power and Force on Wedge Bonded Strength of Ag-10Au-3.6Pd Alloy Wire
4. Conclusions
- (1)
- For the Ag-10Au-3.6Pd alloy bonding wire (diameter of 0.025 mm), for a constant EFO time, the geometry of the FAB changes from a pointed ball to an oval ball, round ball and golf ball when EFO current is increased. On the other hand, for a constant EFO current, the FAB geometry changes from a small round ball to a regular round ball and finally to a golf ball. The FAB was a regular round ball when the EFO time was 0.80 ms and EFO current was 0.030 A.
- (2)
- For the investigated bonding wire, at an EFO current of 0.030 A, the FAB diameter and EFO time exhibited a nonlinear relationship, which could be expressed by a quadratic function.
- (3)
- For the Ag-10Au-3.6Pd alloy bonding wire, the ball bonded is regular and the ball shear strength meets the requirements when the bonding power is 70 mW and the bonding force is 0.60 N. On the other hand, the geometry of the wedge bonded is excellent when the bonding power is 95 mW and the bonding force is 0.85 N.
Author Contributions
Funding
Conflicts of Interest
References
- Li, C. Analysis on the countermeasures of high-end electronic information industry in China. Econ. Probl. 2019, 1, 12. [Google Scholar]
- Sun, Y. Development status and Prospect of electronic information engineering. Commun. World 2018, 25, 65. [Google Scholar]
- Minbo, T. Electronic Packaging Engineering Beijing; Tsinghua University Press: Beijing, China, 2003; Volume 2. [Google Scholar]
- Chao, Y.; Yang, Z.; Qiao, H. Progress in wire bonding technology. Electron. Technol. 2007, 28, 205–210. [Google Scholar]
- Tian, H.E. Current situation and development trend of wire bonding technology. Spec. Equip. Electron. Ind. 2004, 33, 12–14. [Google Scholar]
- Guo, R.; Gao, L.; Mao, D.; Li, M.; Wang, X.; Lv, Z.; Chiu, H. Study of free air ball formation in Ag-8Au-3Pd alloy wire bonding. Microelectron. Reliab. 2014, 54, 2550–2554. [Google Scholar] [CrossRef]
- Zhang, J.; Yang, L.J.; Xu, L.C.; Han, S.L. Development of microelectronic bonding technology. Weld. Technol. 2007, 36, 5–8. [Google Scholar]
- Zhou, W.-Y.; Pei, H.-Y.; Luo, J.-Q.; Wu, Y.-J.; Chen, J.-L.; Kang, F.-F.; Kong, J.-W.; Ji, X.-Q.; Yang, G.-X.; Yang, A.-H. Influence of Pd content on microstructure and performance of Au-coated Ag alloy wire. Chin. J. Mech. Eng. 2020, 31, 6241–6247. [Google Scholar]
- Cao, J.; Ding, Y.T.; Guo, T.B. Effect of copper properties and bonding parameters on bonding quality. Mater. Sci. Technol. 2012, 20, 76–79. [Google Scholar]
- Cao, J.; Wu, W.X. Effects of Au coated Ag bonding wire properties on bonded quality. Mater. Sci. Technol. 2018, 26, 96–100. [Google Scholar]
- Czerny, B.; Mazloum-Nejadari, A.; Khatibi, G.; Weiss, L.; Zehetbauer, M. Fatigue testing method for fine bond wires in an LQFP package. Microelectron. Reliab. 2016, 64, 270–275. [Google Scholar] [CrossRef]
- Gross, D.; Haag, S.; Reinold, M.; Schneider-Ramelow, M.; Lang, K.D. Heavy copper wire-bonding on silicon chips with aluminum-passivated Cu bond-pads. Microelectron. Eng. 2016, 156, 41–45. [Google Scholar] [CrossRef]
- Martin, S.R.; Christian, E. The reliability of wire bonding using Ag and Al. Microelectron. Reliab. 2016, 63, 336–341. [Google Scholar]
- Qin, W.; Cohen, I.M.; Ayyaswamy, P.S. Ball size and HAZ as Functions of EFO parameters for gold Bonding wire. Adv. Electron. Packag. 1997, 1, 391–398. [Google Scholar]
- Cao, J.; Fan, J.; Gao, W. Effect of Ag-10Au-3.6Pd alloy bonding wire properties and structure on bond strengths and reliability. Intern. Conf. Electron. Packag. 2016, 4, 82–87. [Google Scholar]
- Hang, C.J.; Song, W.H.; Lum, I.; Mayer, M.; Zhou, Y.; Wang, C.Q.; Moon, J.T.; Persic, J. Effect of electronic flame off parameters on copper bonding wire: Free-air Ball deformability, heat affected zone length, heat affected zone breaking force. Microelectron. Eng. 2009, 86, 2094–2103. [Google Scholar] [CrossRef]
- Wu, J.; Rockey, T.; Yauw, O.; Shen, L.; Chylak, B. Bonding of Ag-alloy wire in LED packages. In Proceedings of the 35th IEEE/CPMT International Electronic Manufacturing Technology Symposium (IEMT), Ipoh, Perak, Malaysia, 6–8 November 2012; pp. 1–4. [Google Scholar]
- Gu, L.; Chen, Q.; Li, J.; Chen, Z.; Zhou, J.; Du, M.; Chung, M. Comparison of Ag wire and Cu wire in memory package. J. Funct. Mater. Devices 2013, 19, 240–244. [Google Scholar] [CrossRef]
- Yu, Z. Process Research on Improving Bonding Strength of Hot-Pressed Ultrasonic Ball Solder Joint. Master’s Thesis, Southwest Jiaotong University, Chengdu, China, 2010. [Google Scholar]
- Xue, R. Research on the Influence of Ultrasonic Power and Bonding Pressure on the Bonding Quality of Gold Wire. University of Electronic Science and Technology of China: Chengdu, China, 2016. [Google Scholar]
- Tseng, Y.W.; Hung, F.Y.; Lui, T.S.; Chen, M.Y.; Hsueh, H.W. Effect of annealing on the microstructure and bonding interface properties of Ag-2Pd alloy wire. Microelectron. Reliab. 2015, 55, 1256–1261. [Google Scholar] [CrossRef]
- Tseng, Y.W.; Hung, F.Y.; Lui, T.S. Tensile and electrical properties of gold-coated silver bonding wire. Microelectron. Reliab. 2015, 55, 608–612. [Google Scholar] [CrossRef]
- Tanna, S.; Pisigan, J.L.; Song, W.H.; Halmo, C.; Persic, J.; Mayer, M. Low cost Pd coated Ag bonding wire for high quality FAB in air. In Proceedings of the IEEE Electronic Components & Technology Conference, San Diego, CA, USA; 2012; Volume 282, pp. 1103–1109. [Google Scholar]
- Chen, J.L.; Lin, Y.C. A New approach in Free Air ball formation process parameters analysis. In Proceedings of the IEEE Transom Electronic Packaging Manufacturing, Las Vegas, NV, USA; 2000; Volume 23, pp. 116–122. [Google Scholar]
- Tan, J.; Toh, B.H.; Ho, H.M. Modeling of free air ball for copper wire bonding. In Proceedings of the 6th Electronics Packaging Technology Conference, Singapore; 2004; pp. 711–717. [Google Scholar]
- Xu, H.; Liu, C.; Silberschmidt, V.V.; Pramana, S.S.; White, T.J.; Chen, Z.; Acoff, V.L. New mechanisms of void growth in Au–Al wire bonds: Volumetric shrinkage and intermetallic oxidation. Scr. Mater. 2011, 65, 642–645. [Google Scholar] [CrossRef]
- Xu, X. Effect of Geometric Parameters of Ceramic Capillary on Bonding Strength and Reliability; HeNan Polytechnic University, Jiaozuo: China, 2020; pp. 16–20. [Google Scholar]
- Langenecker, B. Effect of sonic and ultrasonic radiation on safety factors of rockets and missiles. AIAA J. 1963, 1, 80–83. [Google Scholar] [CrossRef]
- Wang, F.; Han, L.; Zhong, J. Effect of ultrasonic power on the wire bonding strength. Chin. J. Mech. Eng. 2007, 43, 107–111. [Google Scholar]
- Mayer, M. Microelectronic Bonding Process Monitoring by Integrated Sensors; ETH Zurich: Zürich, Switzerland, 2000. [Google Scholar]
- Liang, Z.N.; Kuper, F.G.; Chen, M.S. Concept to relate wire bonding parameters to bondability and ball bond reliability. Microelectron. Reliab. 1998, 38, 1287–1291. [Google Scholar] [CrossRef]


| Ball Bond | Wedge Bond | Free Air Ball | |||
|---|---|---|---|---|---|
| Impact Force Ff/N | 0.65 | Bond Force F1/N | 0.75 | Spark Voltage/V | 5000 |
| Bond Force F/N | 0.45/0.60/0.75 | US Power P1/mW | 60 | Electronic Flame Off (EFO) Current/A | 0.015/0.020/0.025/0.030/0.035 |
| US Power P/mW | 55/70/85 | Bond Time t1/ms | 6 | EFO Time/ms | 1.00/0.90/0.80/0.70/0.60 |
| Bond Time t/ms | 8 | Bond Force F2/N | 0.70/0.85/1.00 | Tail Length/mm | 0.15 |
| US Power P2/mW | 80/95/105 | Bonding Temperature/°C | 220 | ||
| Bond Time t2/ms | 6 | ||||
© 2020 by the authors. Licensee MDPI, Basel, Switzerland. This article is an open access article distributed under the terms and conditions of the Creative Commons Attribution (CC BY) license (http://creativecommons.org/licenses/by/4.0/).
Share and Cite
Cao, J.; Zhang, J.; Persic, J.; Song, K. Effects of Bonding Parameters on Free Air Ball Properties and Bonded Strength of Ag-10Au-3.6Pd Alloy Bonding Wire. Micromachines 2020, 11, 777. https://doi.org/10.3390/mi11080777
Cao J, Zhang J, Persic J, Song K. Effects of Bonding Parameters on Free Air Ball Properties and Bonded Strength of Ag-10Au-3.6Pd Alloy Bonding Wire. Micromachines. 2020; 11(8):777. https://doi.org/10.3390/mi11080777
Chicago/Turabian StyleCao, Jun, Junchao Zhang, John Persic, and Kexing Song. 2020. "Effects of Bonding Parameters on Free Air Ball Properties and Bonded Strength of Ag-10Au-3.6Pd Alloy Bonding Wire" Micromachines 11, no. 8: 777. https://doi.org/10.3390/mi11080777
APA StyleCao, J., Zhang, J., Persic, J., & Song, K. (2020). Effects of Bonding Parameters on Free Air Ball Properties and Bonded Strength of Ag-10Au-3.6Pd Alloy Bonding Wire. Micromachines, 11(8), 777. https://doi.org/10.3390/mi11080777