Article

Analysis of the Binding of Analyte-Receptor in a Micro-Fluidic Channel for a Biosensor Based on Brownian Motion

1
School of Mechanical and Aerospace Engineering, Seoul National University, 1 Gwanak-ro, Gwanak-gu, Seoul 08826, Korea
2
Department of Nano Manufacturing Technology, Korea Institute of Machinery and Materials, 156 Gajeongbuk-Ro, Yusung-Gu, Daejeon 34103, Korea
*
Author to whom correspondence should be addressed.
Micromachines 2020, 11(6), 570; https://doi.org/10.3390/mi11060570
Submission received: 6 May 2020 / Revised: 29 May 2020 / Accepted: 2 June 2020 / Published: 3 June 2020

Abstract

:
This study experimentally analyses the binding characteristics of analytes mixed in liquid samples flowing along a micro-channel to the receptor fixed on the wall of the micro-channel to provide design tools and data for a microfluidic-based biosensor. The binding or detection characteristics are analyzed experimentally by counting the number of analytes bound to the receptor, with sample analyte concentration, sample flow rate, and the position of the receptor along the micro-channel length as the main variables. A mathematical model is also proposed to predict the number of analytes transported and bound to the receptor based on a probability density function for Brownian motion. The coefficient in the mathematical model is obtained by using a dimensionless mathematical model and the experimental results. The coefficient remains valid for all different conditions of the sample analyte concentration, flow rate, and the position of the receptor, which implies the possibility of deriving a generalized model. Based on the mathematical model derived from mathematical and experimental analysis on the detection characteristics of the microfluidic-based biosensor depending on previously mentioned variables and the height of the micro-channel, this study suggests a design for a microfluidic-based biosensor by predicting the binding efficiency according to the channel height. The results show the binding efficiency increases as the flow rate decreases and as the receptor is placed closer to the sample-injecting inlet, but is unaffected by sample concentration.

1. Introduction

Biosensors are devices used to detect specific analytes based on antigen-antibody reactions [1]. Detection using biosensors is achieved through a process in which measurable optical or electrical signals are derived from the binding of an analyte and a receptor specific to this analyte (Figure 1a) [2,3,4,5]. Biosensors are used in various fields, including medical diagnostics, which require highly sensitive detecting of low-concentration analytes below ng/mL for early diagnosis or precise analysis [1,6,7,8]. To achieve this, a wide variety of studies are being conducted on improving the binding efficiency between analytes and receptors, or the signal efficiency and intensity from the analyte-receptor binding [9,10,11,12,13]. In terms of binding efficiency, it is important to bring the analyte within a distance where binding is possible in addition to improving the binding affinity between receptors and analytes. Adapting micro/nano-channels or beads for higher surface-to-volume ratio is an effective method to increase the binding probability between low concentration of analytes in liquid samples and receptors fixed on the surface of the channels or beads such as micro-fluidic biosensor [1,14,15,16,17].
In the case of microfluidic-based biosensors, despite adapting micro-channel for higher chance of analyte-receptor binding, it may be hard to place the analytes close enough, for example within 20 nm [18], to the receptors while flowing through the micro-channel, considering the channel size, analyte size, and the strong laminar flow in the micro-channel. The probability decreases for lower concentration of analytes mixed in the sample, which results in poor detection ability of biosensors. Therefore, in addition to research on improving analyte-receptor binding kinetics or the characteristics of optical or electrical signals derived from bound analyte-receptor, quantitative analysis on the behavior of analytes flowing along a micro-channel is required to improve the detection characteristics of microfluidic-based biosensors.
As mentioned above, in the case of microfluidic-based biosensors with receptors fixed to the wall of the micro-channel, the binding between the analyte and receptor occurs on the wall of the channel as shown in Figure 1b. Therefore, the analytes should move toward the micro-channel wall during the flow for sensing. However, it is usually difficult to generate a lateral flow to the wall. Various studies have been performed to enhance transportation of analytes towards the wall by external fields [19,20,21] or vortices caused by mixing structures on the surface [22,23,24], but using external energy or fabricating additional surface structures may not always be practical due to cost, user environments or manufacturing issues. When no external field or mixing surface structure is present for lateral flow, the movement of analytes such as enzymes, proteins, viruses, or bacteria is mainly driven by Brownian motion [25,26,27]. Therefore, analyzing the binding properties between the analyte and receptor by considering the Brownian motion of the analyte is critical for developing highly sensitive microfluidic biosensors.
Transport of analytes inside microfluidic channel is usually described by the reaction-diffusion model and it is widely accepted. Numerical simulation for a rectangular channel with micro-pillar was performed [28] and diffusion-convection model for flat plates was described considering the standard entrance effect [29]. Moreover, the transport of analytes and surface reaction was numerically modeled for the electro-osmotic flow [30]. However, it is difficult to reflect the individual motion of analyte such as shear induced lift force movement because it is described in the perspective of concentration, which is regarded as important effect in a micro-sized channel. Thus, a transport model needs to be presented in the individual analyte perspective, especially for the low-concentration case in which continuum hypothesis may not be valid. This study suggests a model for the transport of analytes to receptors fixed on the micro-channel in a microfluidic-based biosensor using a mathematical model by calculating the number of analytes capable of colliding on the wall based on Brownian motion. This study also experimentally examines the number of bound particles according to the design parameters of the device, such as the size of the channel or the position of the receptor, and the parameters for the diagnostic process, such as the concentration and flow rate of the sample. The findings are compared with the results calculated by the model, and a design for the main structure of the microfluidic-based biosensor is presented using the mathematical model.

2. Experiments

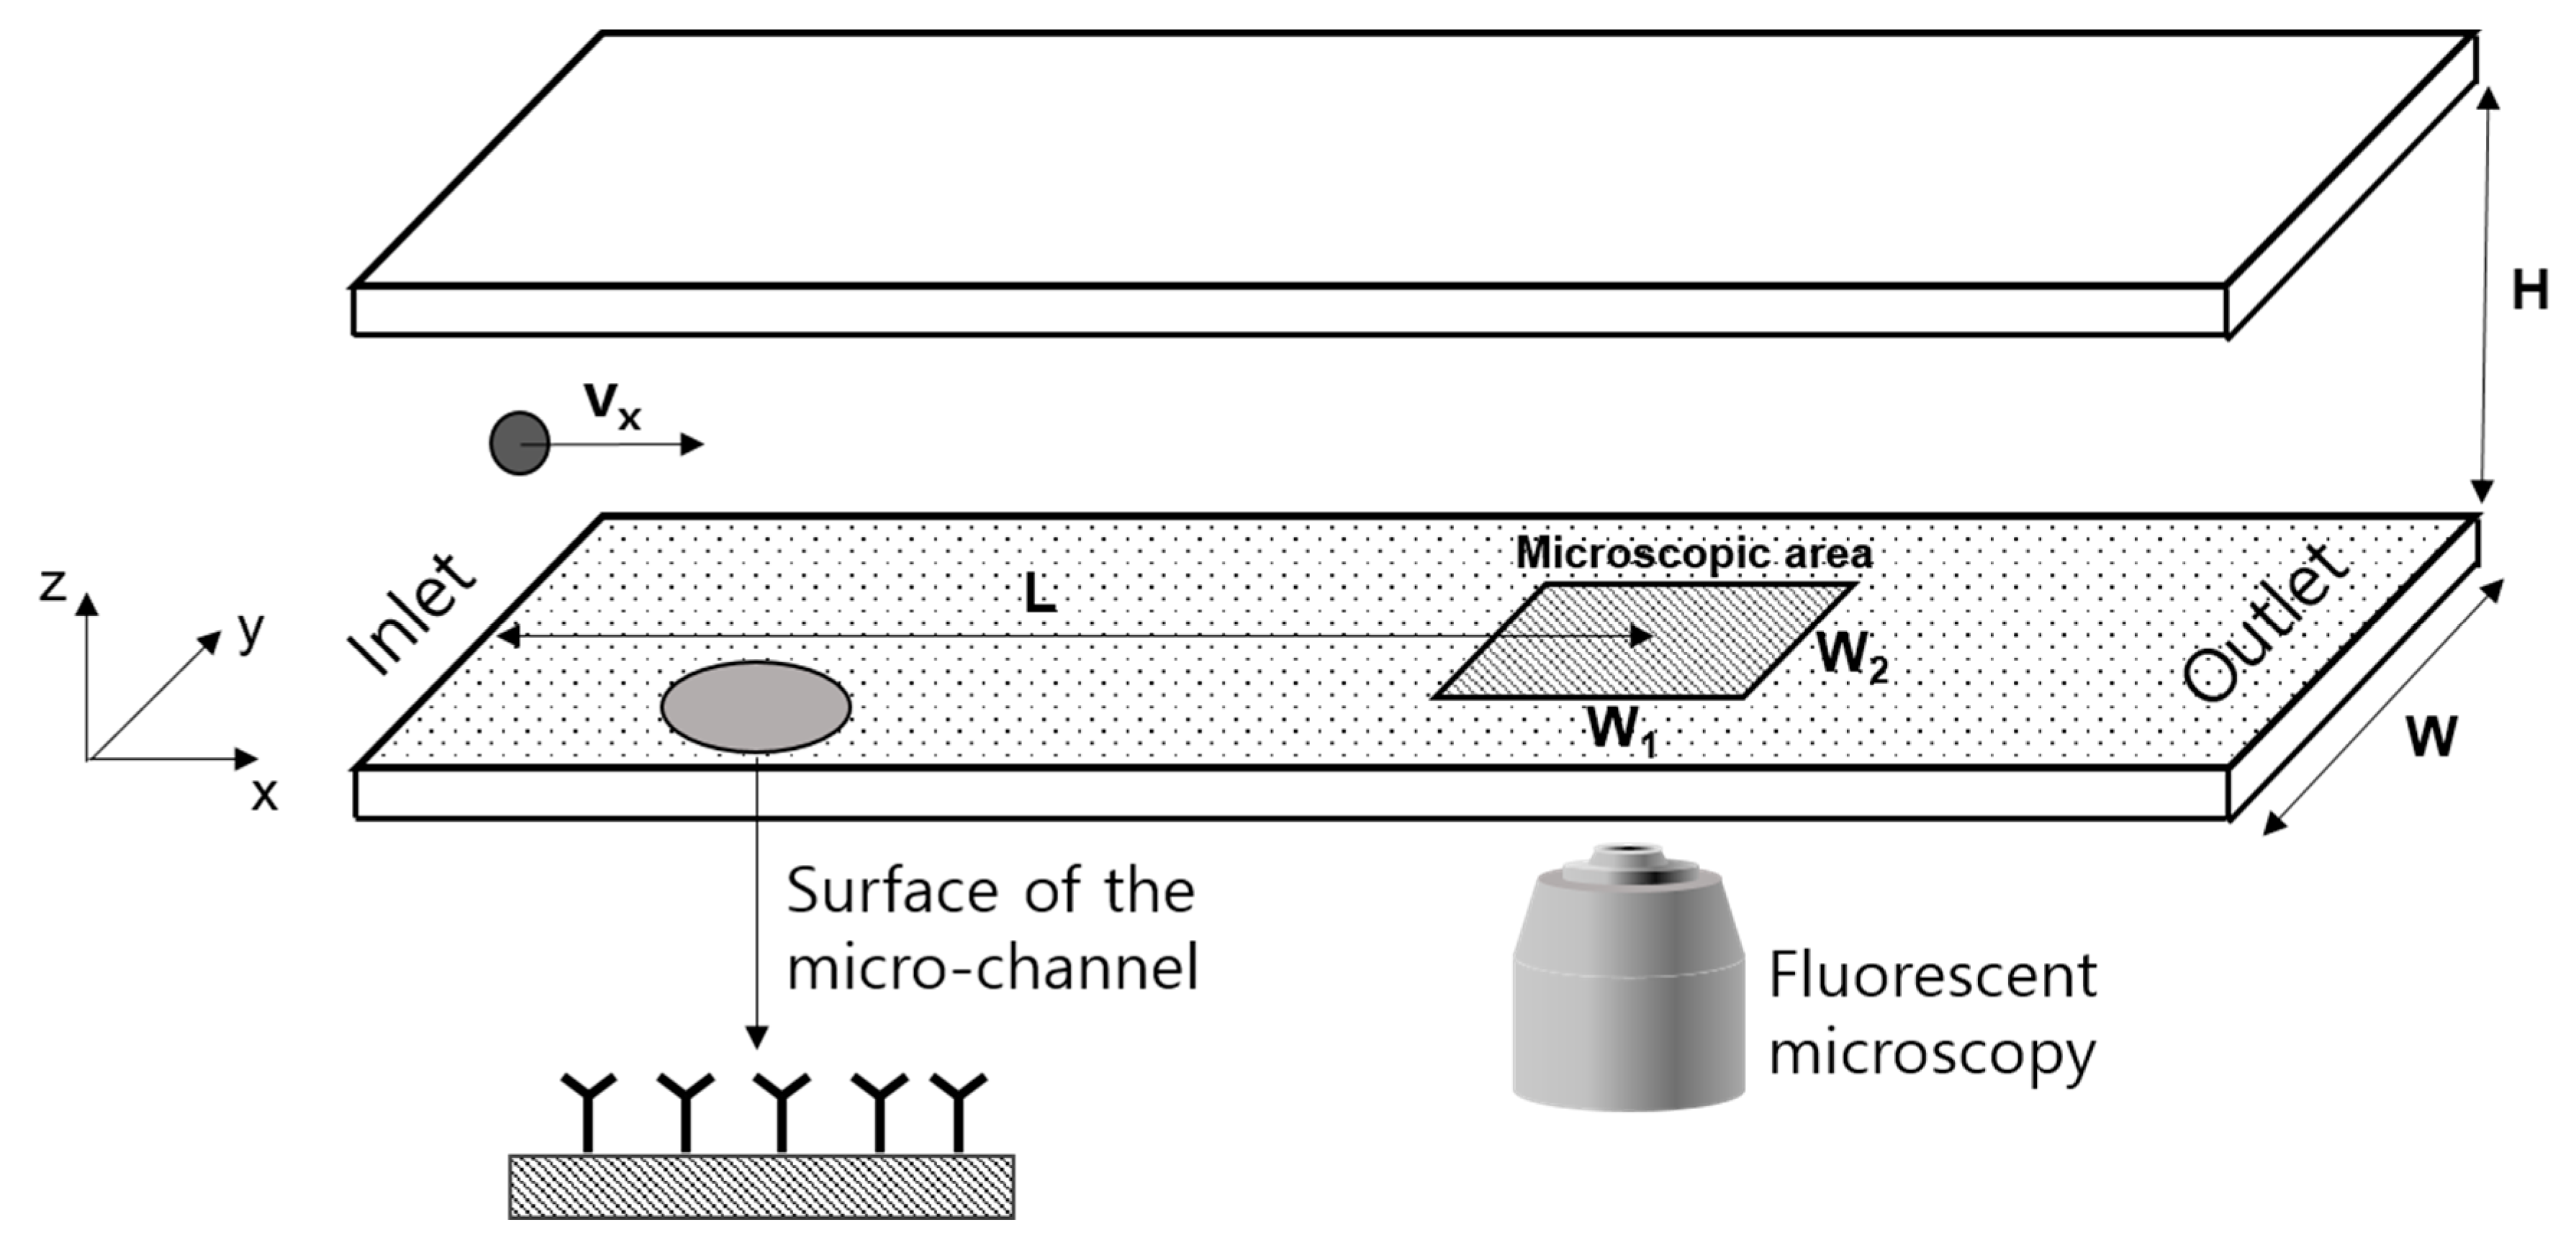
To examine the analyte-receptor binding efficiency depending on the detection conditions such as the concentration of the sample, flow rate, and the receptor-analyte binding measurement position, this study counted the number of bound particles while the sample including analytes flowed through a microchannel (height: 100 µm) as shown in Figure 2. In terms of the model receptor, streptavidin was immobilized on the micro-channel surface. As for the analyte, this study used fluorescent biotinylated Polystyrene beads (FluoSpheres™ Biotin-Labeled Microspheres, diameter: 200 nm) with excellent binding properties with streptavidin [31,32]. The binding between streptavidin-biotin was confirmed by measuring the fluorescence of fluorescent polystyrene beads. Also, by using engineering particles uniform in size and density as a model analyte, the number of analytes used in the experiment was able to be estimated for each condition, which enabled more accurate measurement and analysis of receptor-analyte binding properties according to the concentration. The next section describes the experimental method and conditions including surface treatment for streptavidin immobilization.

2.1. Microfluidic Channel and Surface Modification

A micro-fluidic channel was designed to be 100 µm in depth (H = 100 µm) and 5 mm in width (W = 5 mm) to reduce the effect of the side wall of the channel on the flow. The length of the channel was set to 70 mm. A transparent micro-fluidic channel substrate was injection molded using PMMA (Poly methyl methacrylate) to observe the behavior of the particles and fluorescent image of the Polystyrene (PS) particles bound to the streptavidin.
For biotinylated beads-streptavidin binding, streptavidin is required to be coated previously on the PMMA micro-channel wall, which consists of several processes as follows. After sonication in iso-propanol (IPA) for 15 min, PMMA substrates were washed with IPA and DI water in turn [33]. The surface of the micro-channel was carboxylated by exposing to UV light for 30 min for effective streptavidin coating. Streptavidin was immobilized onto the PMMA surface by dipping in coating solution, a mixture of 50 µL of streptavidin, 25 mg of EDC (1-ethyl-3-(3-dimethylaminopropyl) carbodiimide) reagent, and 5 mL of MES buffer. EDC was used for facilitating binding of the amino part of streptavidin with carboxyl groups on the PMMA surface. After incubation for 2 h 30 min, the PMMA substrates were washed and dried with nitrogen gas [34].

2.2. Investigation for Bound Particles

The experiment was performed by flowing the samples during each detection time. After injecting the solution containing beads, the microchannel was washed three times by 10 mL of deionized water for each washing. DI water was injected at flow rate 10 mL/h in order to exclude non-intended adsorption of beads. Non-specific binding of biotinylated PS beads was investigated through bare PMMA surface. Because the experiments were performed under flow and the bead solution used for the experiments contained Tween20, none of the particles were bound to bare PMMA after washing.
Images of the particles bound to a specific area (W1 = 1362 µm, W2 = 1021 µm) of the channel wall were obtained with a fluorescence microscope. As shown in Figure 3, after setting a binary threshold to remove the noise and image processing for the uniform size of the fluorescence image of the particle, the number of particles bound in the microscopic area shown in Figure 2 were counted discretely using distributed fluorescent signals. Every experiment used different channel plate with same micro-channel in dimension, material and surface conditions.

2.3. Experimental Conditions

The experiments were repeated five times each per the conditions shown in Table 1 below. The flow rate conditions were 0.3 mL·h−1, 1.2 mL·h−1, and 2.4 mL·h−1. In the case of 1.2 mL·h−1, the average velocity of the flow ( v x ¯ ) is equivalent to about 0.67 mm·s−1. In addition, the bound particles were observed at different observation positions from the inlet to 10 mm, 35 mm, and 60 mm, respectively, to investigate the effect according to the sample flow distance in the micro-channel.

3. Mathematical Model and Analysis

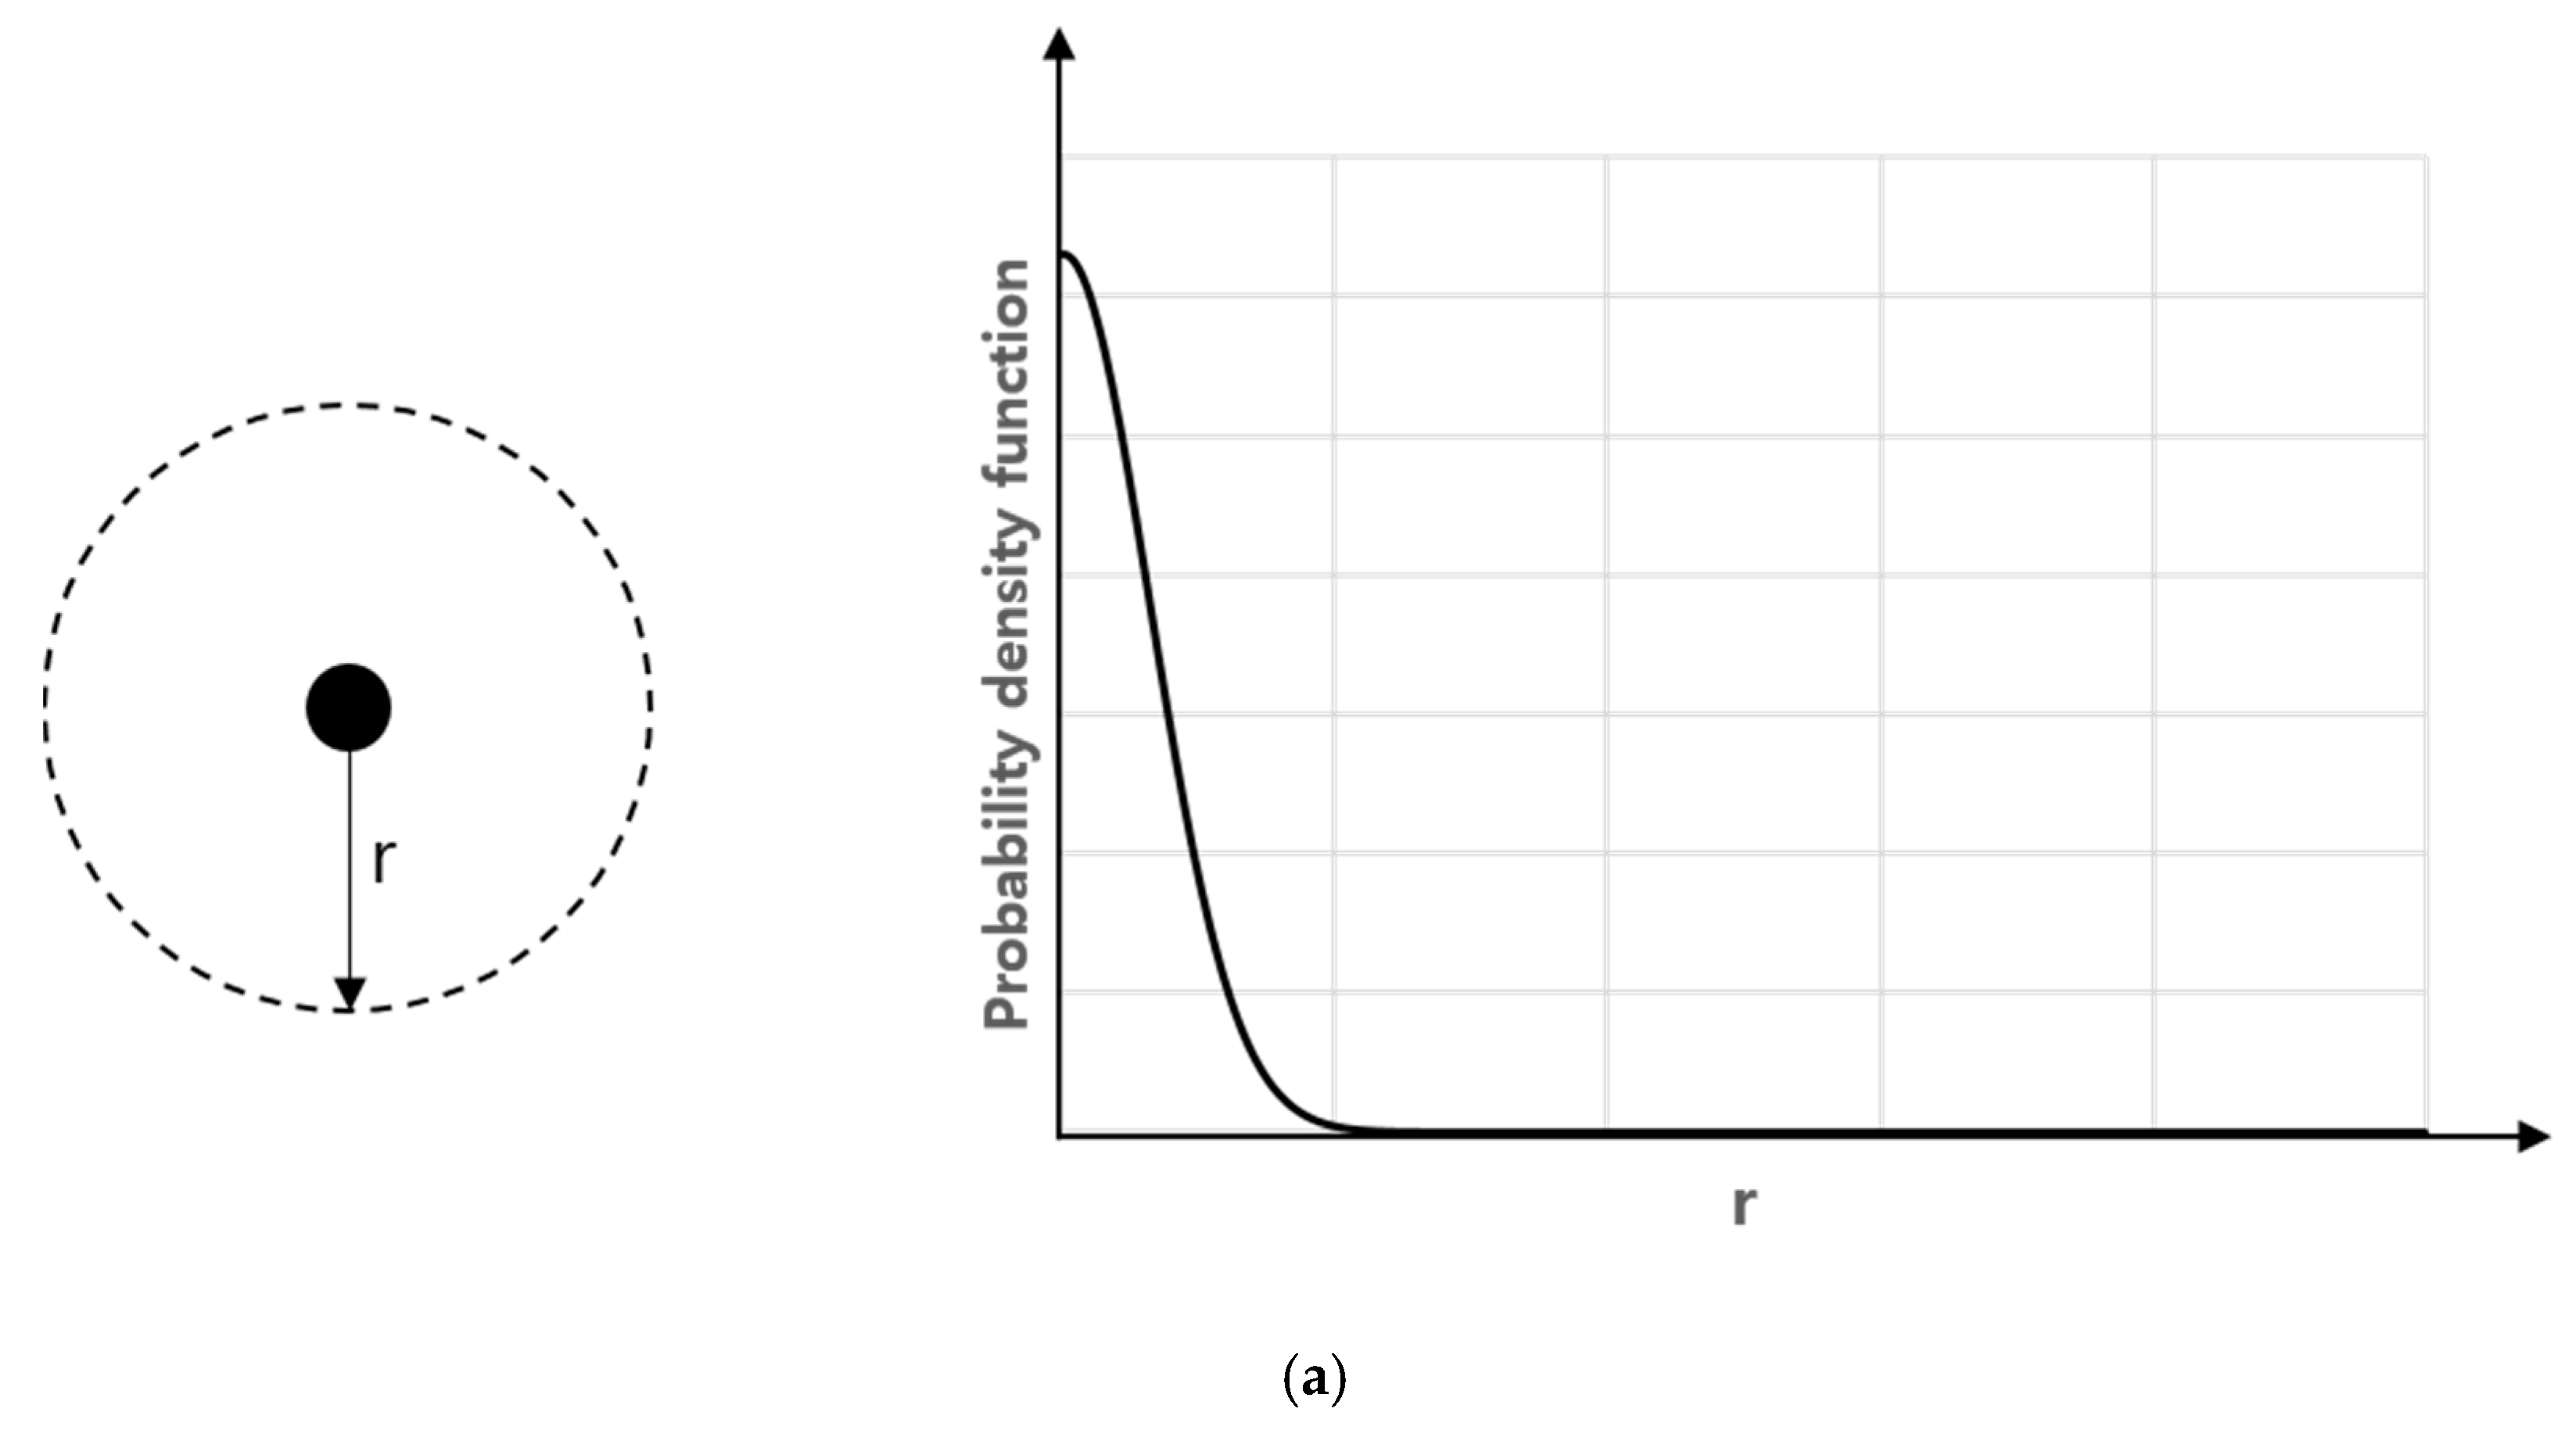
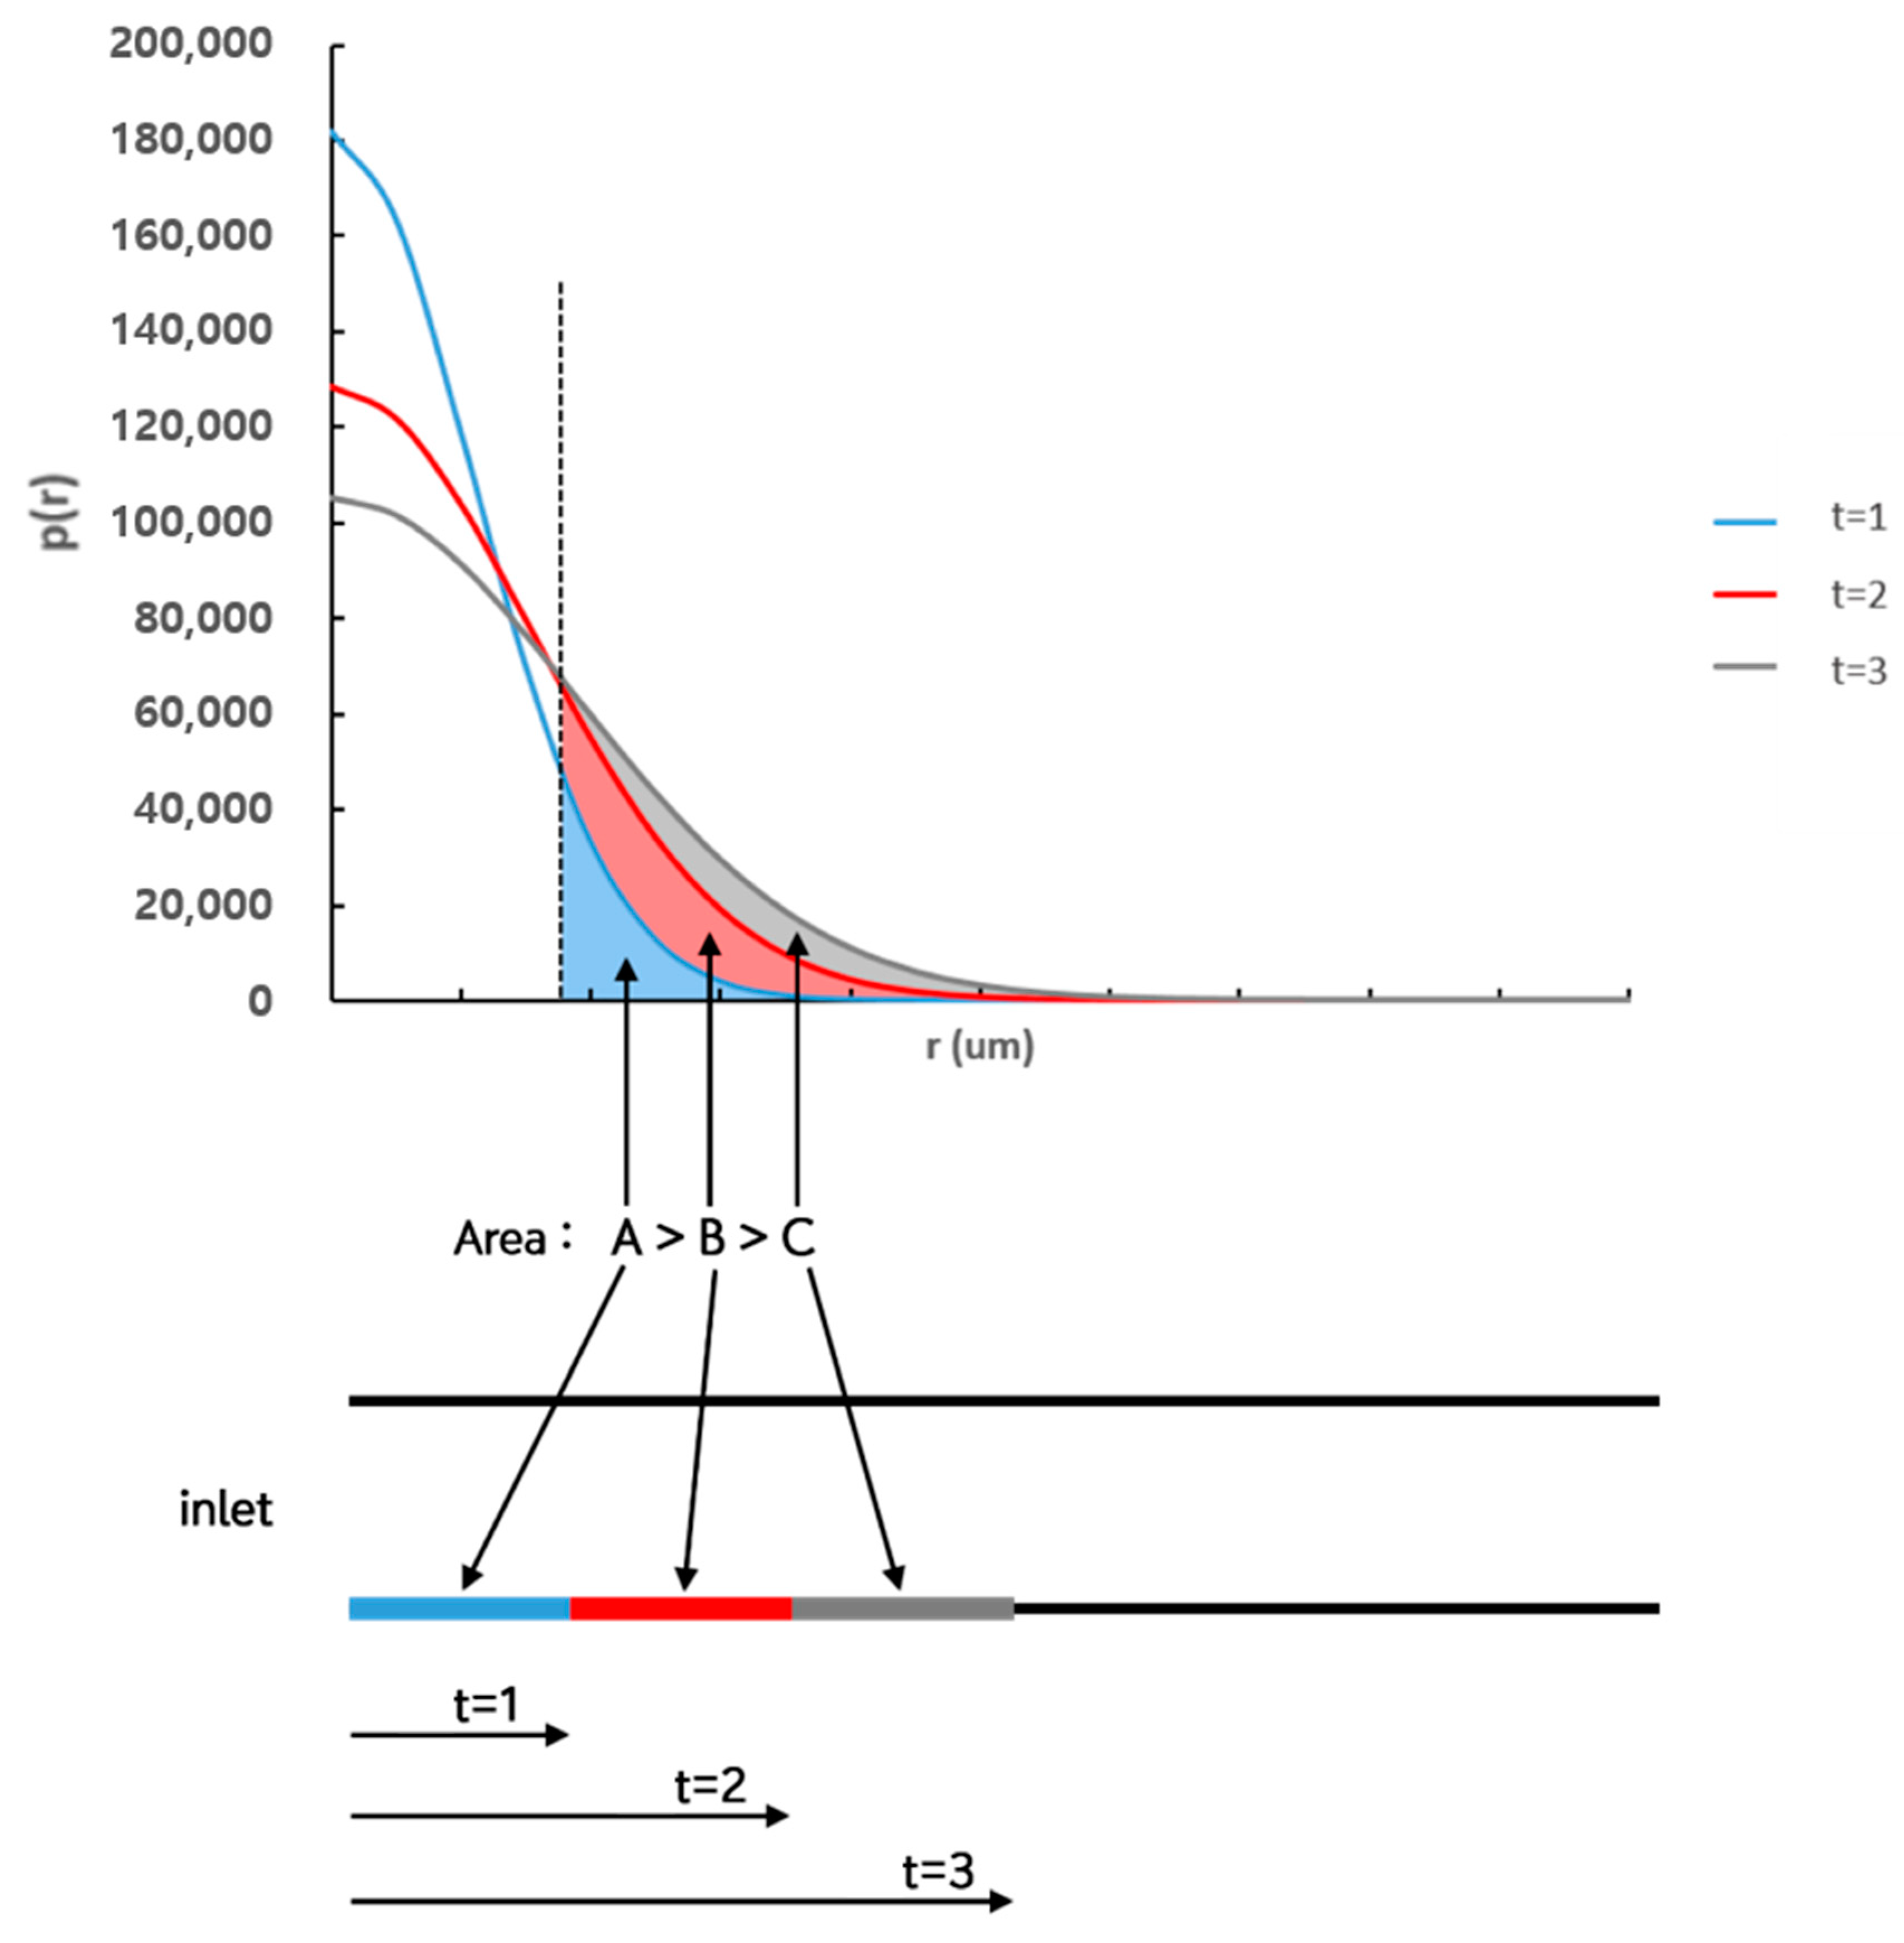
As shown in Figure 4a, the probability density function that a particle may exist at a distance (r) from the initial position after a certain time (t) is shown in Equation (1) by Einstein’s Brownian motion [26]. Therefore, as shown in Figure 4b, the probability P(z) of a particle at a distance (z) from the channel wall to collide with the wall by Brownian motion during a certain time (t) can be expressed as an integral form of Equation (1) for positions farther than z, as shown in Equation (3). A correction factor C1 is introduced considering a microscopic area limited only to a specific direction towards wall (Figure 5).
p ( r ) = 1 4 π D t e r 2 4 D t
where D is the diffusion coefficient ( m 2 · s 1 ), t is the elapsed time (s), r is the distance from the initial position of the particle (m).
Brownian motion is affected by the temperature, the viscosity, and the radius of analyte. In this study, these properties are fixed so that the diffusion coefficient is constant. The diffusion coefficient D is calculated (D = 2.4 × 10 12   m 2 · s 1 ) from the Stokes-Einstein relation as shown in Equation (2):
D = k B T 6 π η r
where k B is the Boltzmann constant, T is the absolute temperature, η is the viscosity, r is the radius of analyte.
P ( z ) = C 1 z d r 1 4 π D t e r 2 4 D t
If the density function for the spatial distribution of particles is f(x,y,z), the total number of particles colliding with the wall during t is as below.
N H , total = C 1 f ( x , y , z ) P ( z )   d V
The density function may be considered as a constant assuming that the particles are distributed uniformly in the channel, and expressed as f(x,y,z) = n by using number density n.
Since not all the particles that collide with the wall are bound to the receptor, the number of particles bound to the microscopic area can be expressed as follows by introducing coefficient C2 to reflect the collide-to-bound ratio and integrating it with C1 above into coefficient C = C1C2.
N bound = C 2 N H , total
If there is a flow, the total amount of particles involved during the detection time (τ) is calculated by using the number of particles that passed through the channel cross-section. When the x-direction velocity of the particle is vx, as shown in Figure 5, the volume of the space where the injected particles are distributed is W 2 0 H v x ( z ) τ d z . Therefore, the total number of injected particles can be expressed using number density n as follows.
n W 2 0 H v x ( z ) τ d z
In addition, t varies depending on the distance (L) from the inlet. As shown in Figure 5, t during the transport of particles from the inlet to points LW1/2 and L + W2/2 by the flow are L W 1 / 2 v x   and L + W 2 / 2 v x , respectively. Therefore, the number of particles bound to the microscopic area (dA) with a distance of L from the inlet can be expressed as the difference between when t is L + W 1 / 2 v x and L W 1 / 2 v x as shown below.
N bound = C n W 2 [ 0 H P ( z ) | t = L + W 1 / 2 v x   v x ( z ) τ   d z 0 H P ( z ) | t = L W 1 / 2 v x   v x ( z ) τ   d z ]
where n is number density (m−3), L is the distance from inlet of microscopic area (m), H is the height of channel (m), τ is detection time (s), v x is the x-directional speed of flow (m·s−1), W1 and W2 are the length and width of microscopic area dA, respectively (m).
Equation (7) predicts the number of bound particles by using the displacement of individual particles being diffused independently by Brownian motion and the total number of injected particles, in which the Brownian motion is not affected by the flow.

4. Results and Discussion

4.1. The Number of Bound Particles

Figure 6 shows the results of measuring the number of bound particles according to the detection time under the conditions of number density n = 1.93 × 10 15   m 3 , flow rate = 1.2 mL·h−1, and observation position = 35 mm. The number of bound particles increased linearly over time, which is consistent with Nbound being linear to the detection time (τ) in Equation (7).
Under the conditions of flow rate = 1.2 mL·h−1 and observation position = 35 mm, Figure 7 shows the results of the number of bound particles normalized by number density n according to the detection time for each concentration. As shown in the graph, the normalized values approximate to a single linear curve.
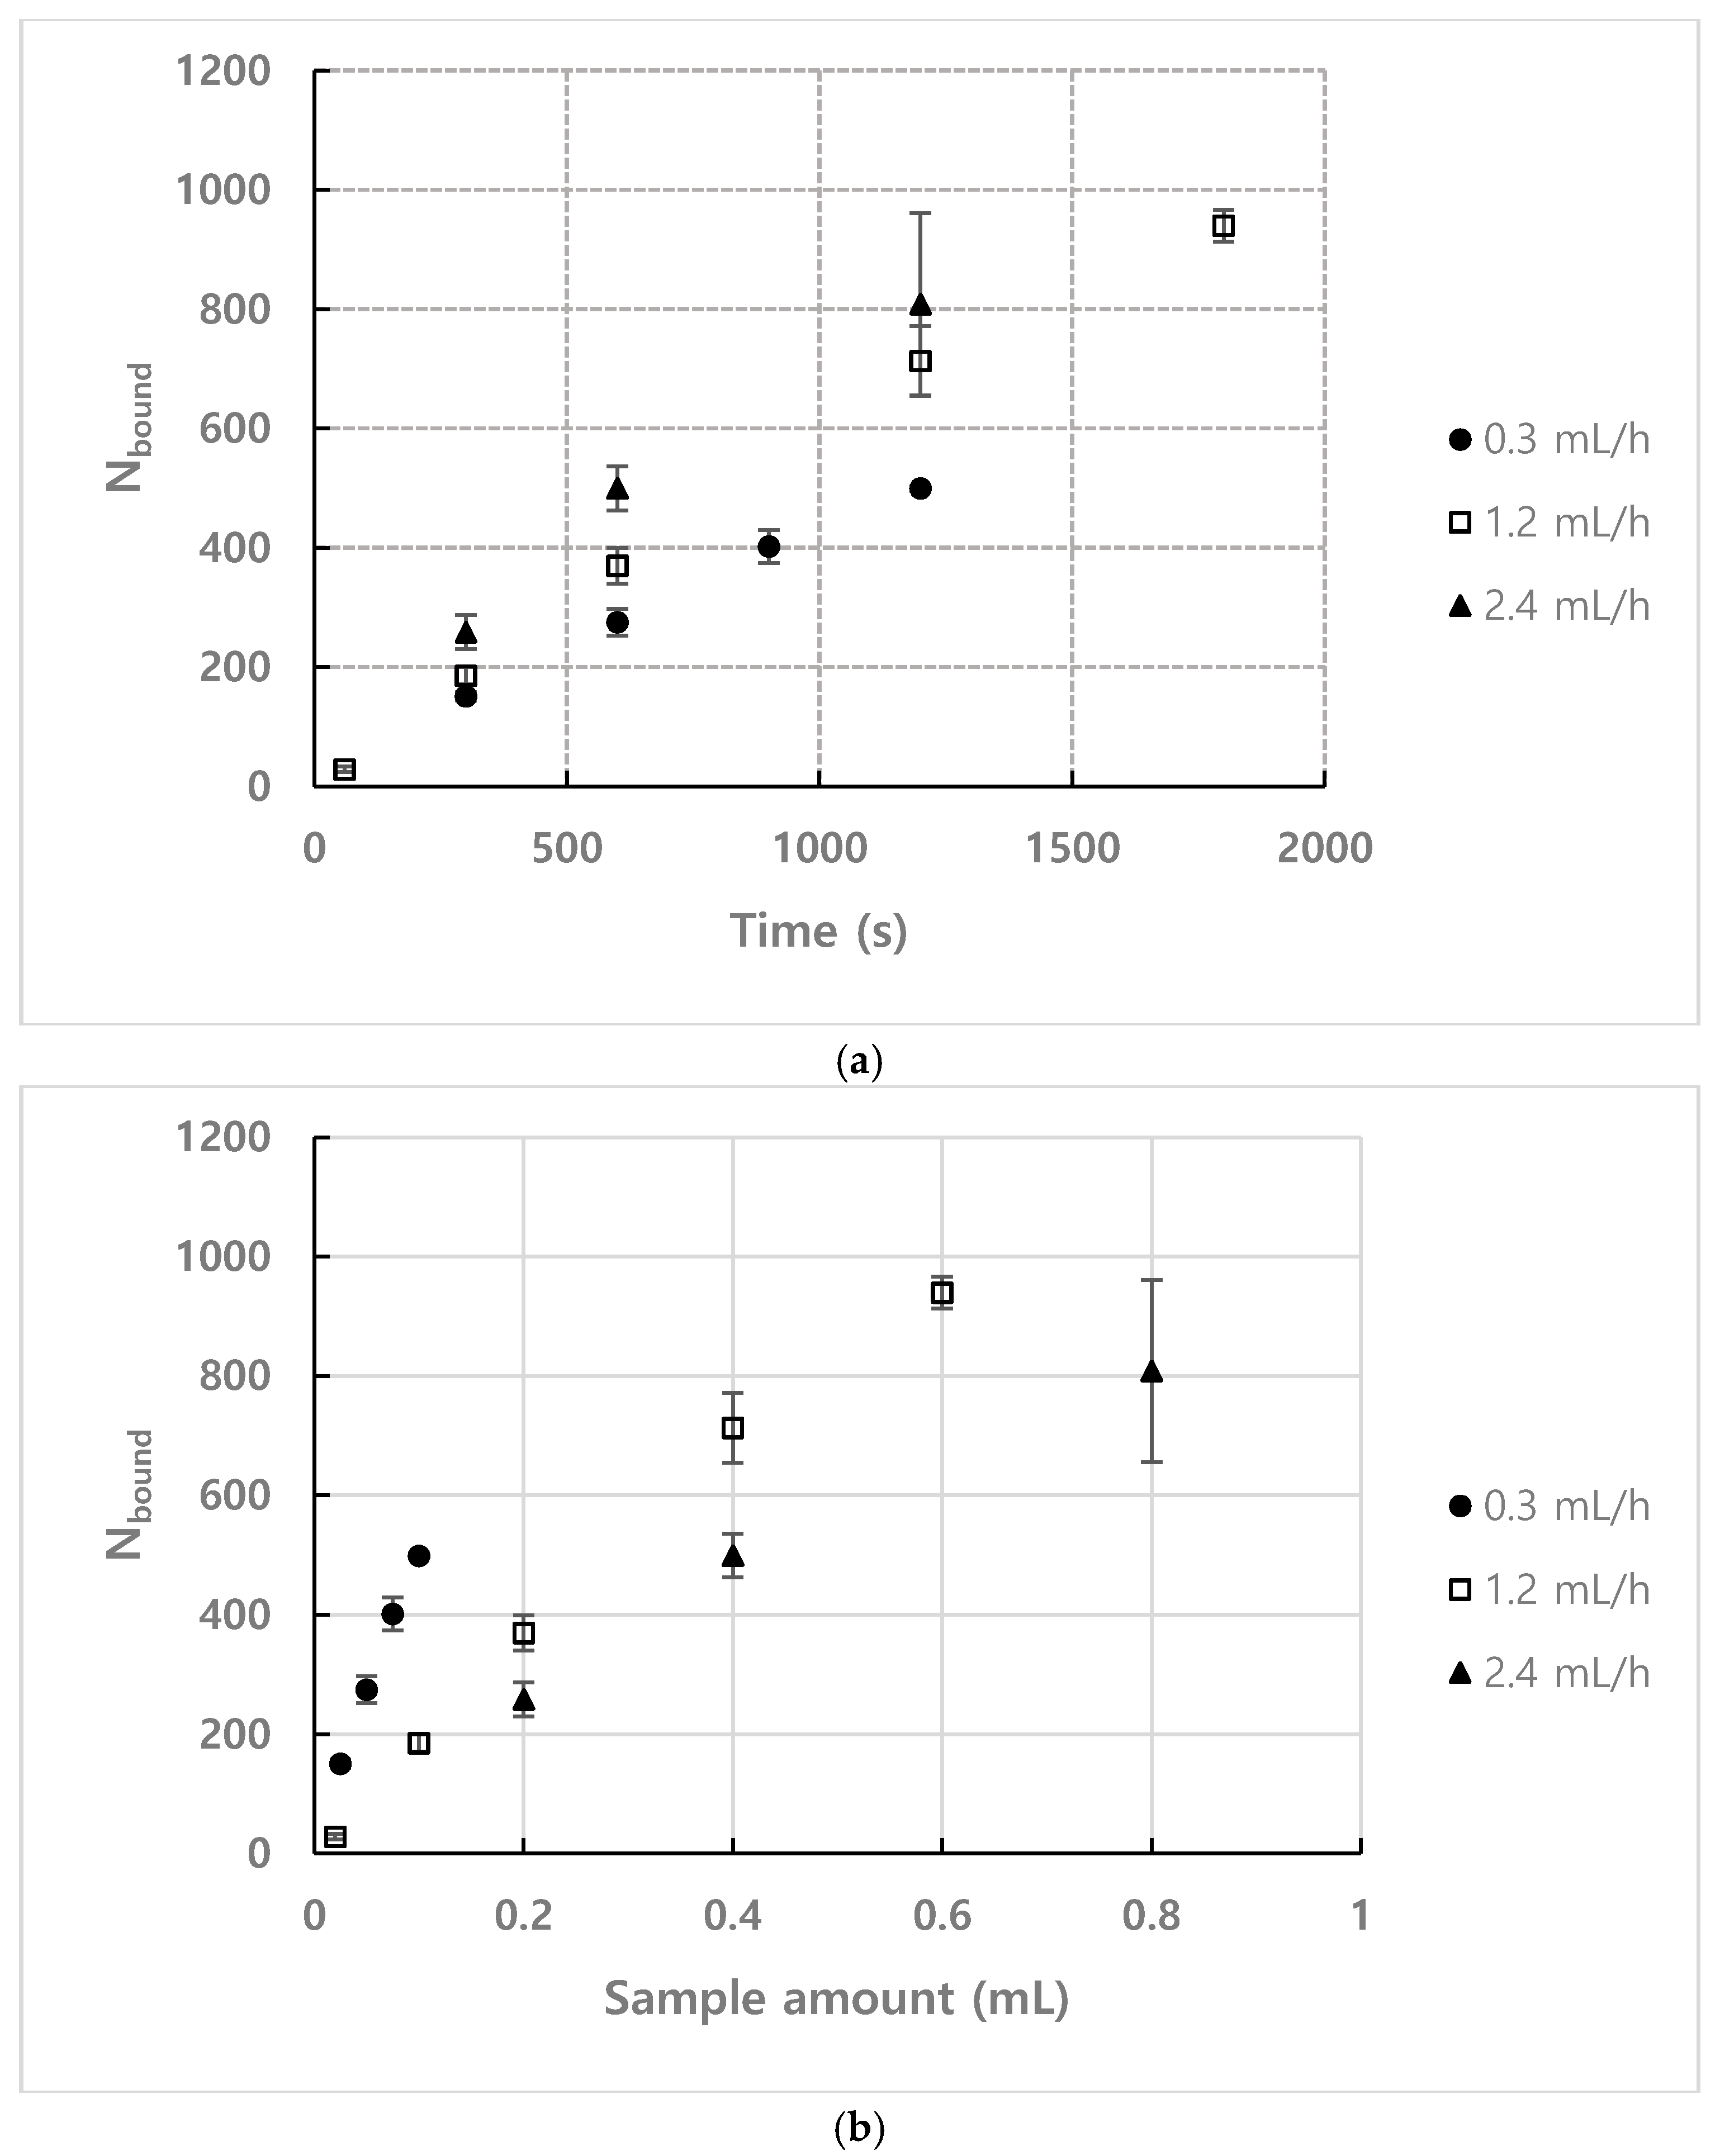
Figure 8a shows the result of plotting the number of bound particles for each flow rate over time under the conditions of n = 1.93 × 10 14   m 3 and observation position = 35 mm. Figure 8b shows the number of bound particles compared to the quantity of the sample injected to directly compare the binding efficiency. Since the number density of the sample used in the experiment was 1.93 × 10 14   m 3 , 0.1 mL of the sample contains approximately 1.93 × 10 7 analytes. As shown in Figure 8b, the binding efficiency increases as the flow rate decreases. This is because the traveling time for particles to be bound to the microscopic area by Brownian motion increases for lower flow rate. Considering these results, lower flow rate is better to improve detection efficiency when using the same quantity of samples.
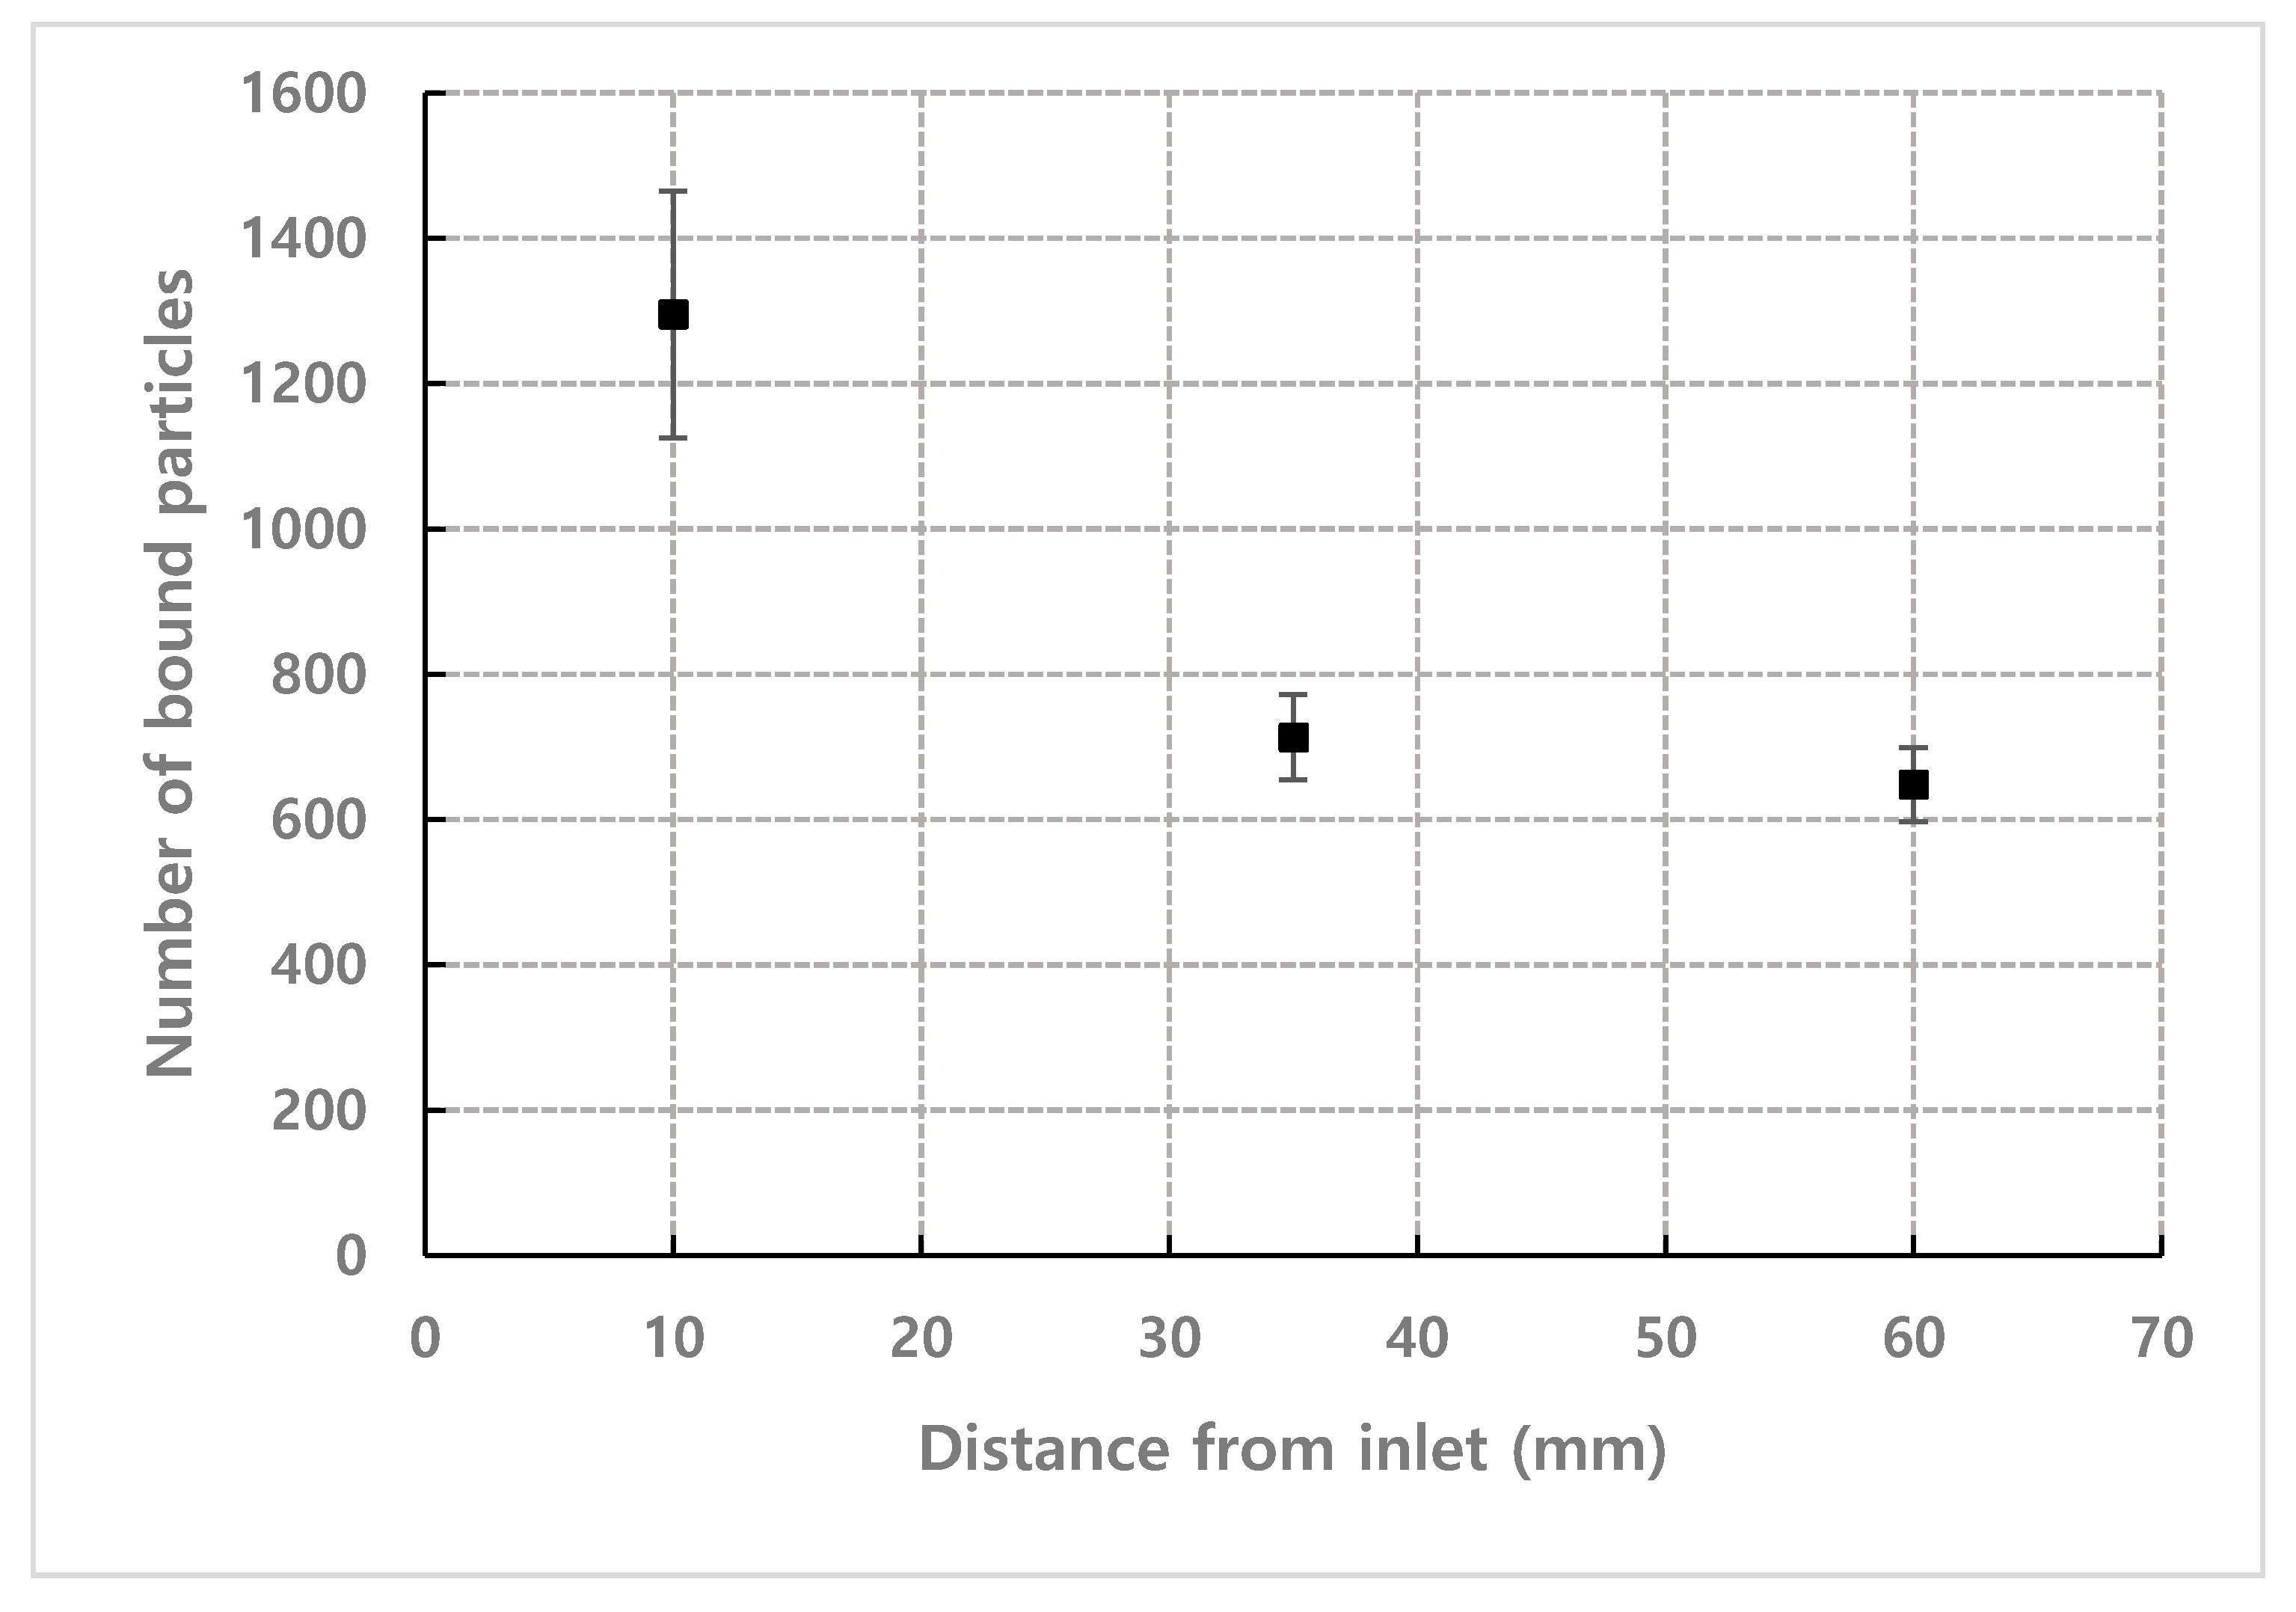
Figure 9 shows the result of counting the number of bound particles at the different observation positions under the conditions of n = 1.93 × 10 14   m 3 , τ = 1200 s and flow rate = 1.2 mL·h−1. The number of bound particles tended to decrease exponentially as the distance from the inlet increased. Therefore, it is favorable to place the receptor in microfluidic-based biosensors as close as possible to the inlet where samples are injected.

4.2. Numerical Estimation for the Number of Bound Particles based on Mathematical Model

The particles mixed with the liquid sample are injected into the inlet flow along the micro-channel and pass through the microscopic area if they do not be bound to the receptor after hitting the channel wall by Brownian motion during time (tL) to reach observation position (L). Therefore, t = tL in the probability density function Equation (1), which is the basic equation for calculating the number of particles bound to the channel surface from the inlet to the microscopic area. When limiting the area to count the bound particles to a microscopic area with a distance of L from the inlet, the number of bound particles can be calculated as follows. The value is calculated by the difference between the number of particles bound to the surface of the channel during time t L + W 1 2 required to transport to the position where the microscopic area ends and the number of particles bound to the surface of the channel during time t L W 1 2 required to transport to the position where the microscopic area starts. In this calculation, the time required for the particles to pass through the microscopic area is ( W 1 v x ) , which is the time it takes for the particles to pass through W1, regardless of the position of the microscopic area (L). As the traveling time increases as the observation position (L) moves further away from the inlet, the probability density function (Equation (1)) for the position of the particles becomes broad as shown in the graph in Figure 10. Thus, the integral value of the probability density function, which is the probability a particle exists over a certain distance from the initial position of the particle increases and the number of particles bound to the channel surface from the inlet is thereby increased. However, although the integral value of the probability density function over a certain distance increases as t increases, the increase rate decreases. Therefore, as t increases, the integral value for the increment Δt of the same time, that is, the number of bound particles decreases. Therefore, as the microscopic area moves further away from the inlet, the transport time (t) of the particles to the corresponding position increases, while the time required to pass through the microscopic area of the same size (Δt) is the same, resulting in a decrease in the number of particles bound to the microscopic area.

4.3. Empirical Coefficient of Mathematical Model for Bound Particles

The experimental results for the number of bound particles normalized by number density under various particle concentration conditions (Figure 7) was used to obtain the empirical coefficient C of the mathematical model to calculate the number of bound particles of Equation (5) or Equation (7). Therefore, Equation (7) can be rewritten as below.
N bound / n τ = C W 2 [ 0 H P ( z ) | t = L + W 1 / 2 v x   v x ( z )   d z 0 H P ( z ) | t = L W 1 / 2 v x   v x ( z )   d z ]
In Figure 7, the number of normalized bound particles shows results that change linearly with respect to τ, so the slope of the linear curve corresponds to N bound / n τ of Equation (8), and the value of the empirical coefficient C can be obtained by using the slope of this curve. The slope of the curve was 3.09 × 10 15 using the least square method, and therefore C = 0.0395. This empirical coefficient C for mathematical model for behavior of the analytes is estimated based on experimental results as explained above. Comparing works in this paper, it can be seen that some previous researchers, however, studied the binding kinetics near the receptors [28,29,30]. As shown in Equation (9), the binding rate of the analyte can be estimated based on the association-dissociation coefficient, analyte concentration near the wall or receptor, density of the receptors on the surface.
C s t = k on C wall ( C s 0 C s ) k off C s
where C s is the density of the analytes bound to receptor on the surface of the micro-channel, C w a l l is the analyte concentration near wall, C s 0 is the density of the receptors on the micro-channel surface, k on and k off are the association and dissociation rate constants, respectively.
Equation (9) can be expressed as below with the assumptions that the streptavidin has high affinity for biotin and is immobilized with high surface density onto PMMA surface ( k on k off , C s 0 C s ).
C s t = k on C wall C s 0
Here, C wall corresponds to the number of analytes transported to the wall, N H , total in Equation (5). Thus, C 2 corresponds to the k on C s 0 , semantically, but direct comparison is difficult because the model in this study describes transport of analytes in individual analytes perspective and focuses on the low-concentration case in which the density of the receptors outweighs the analyte concentration.
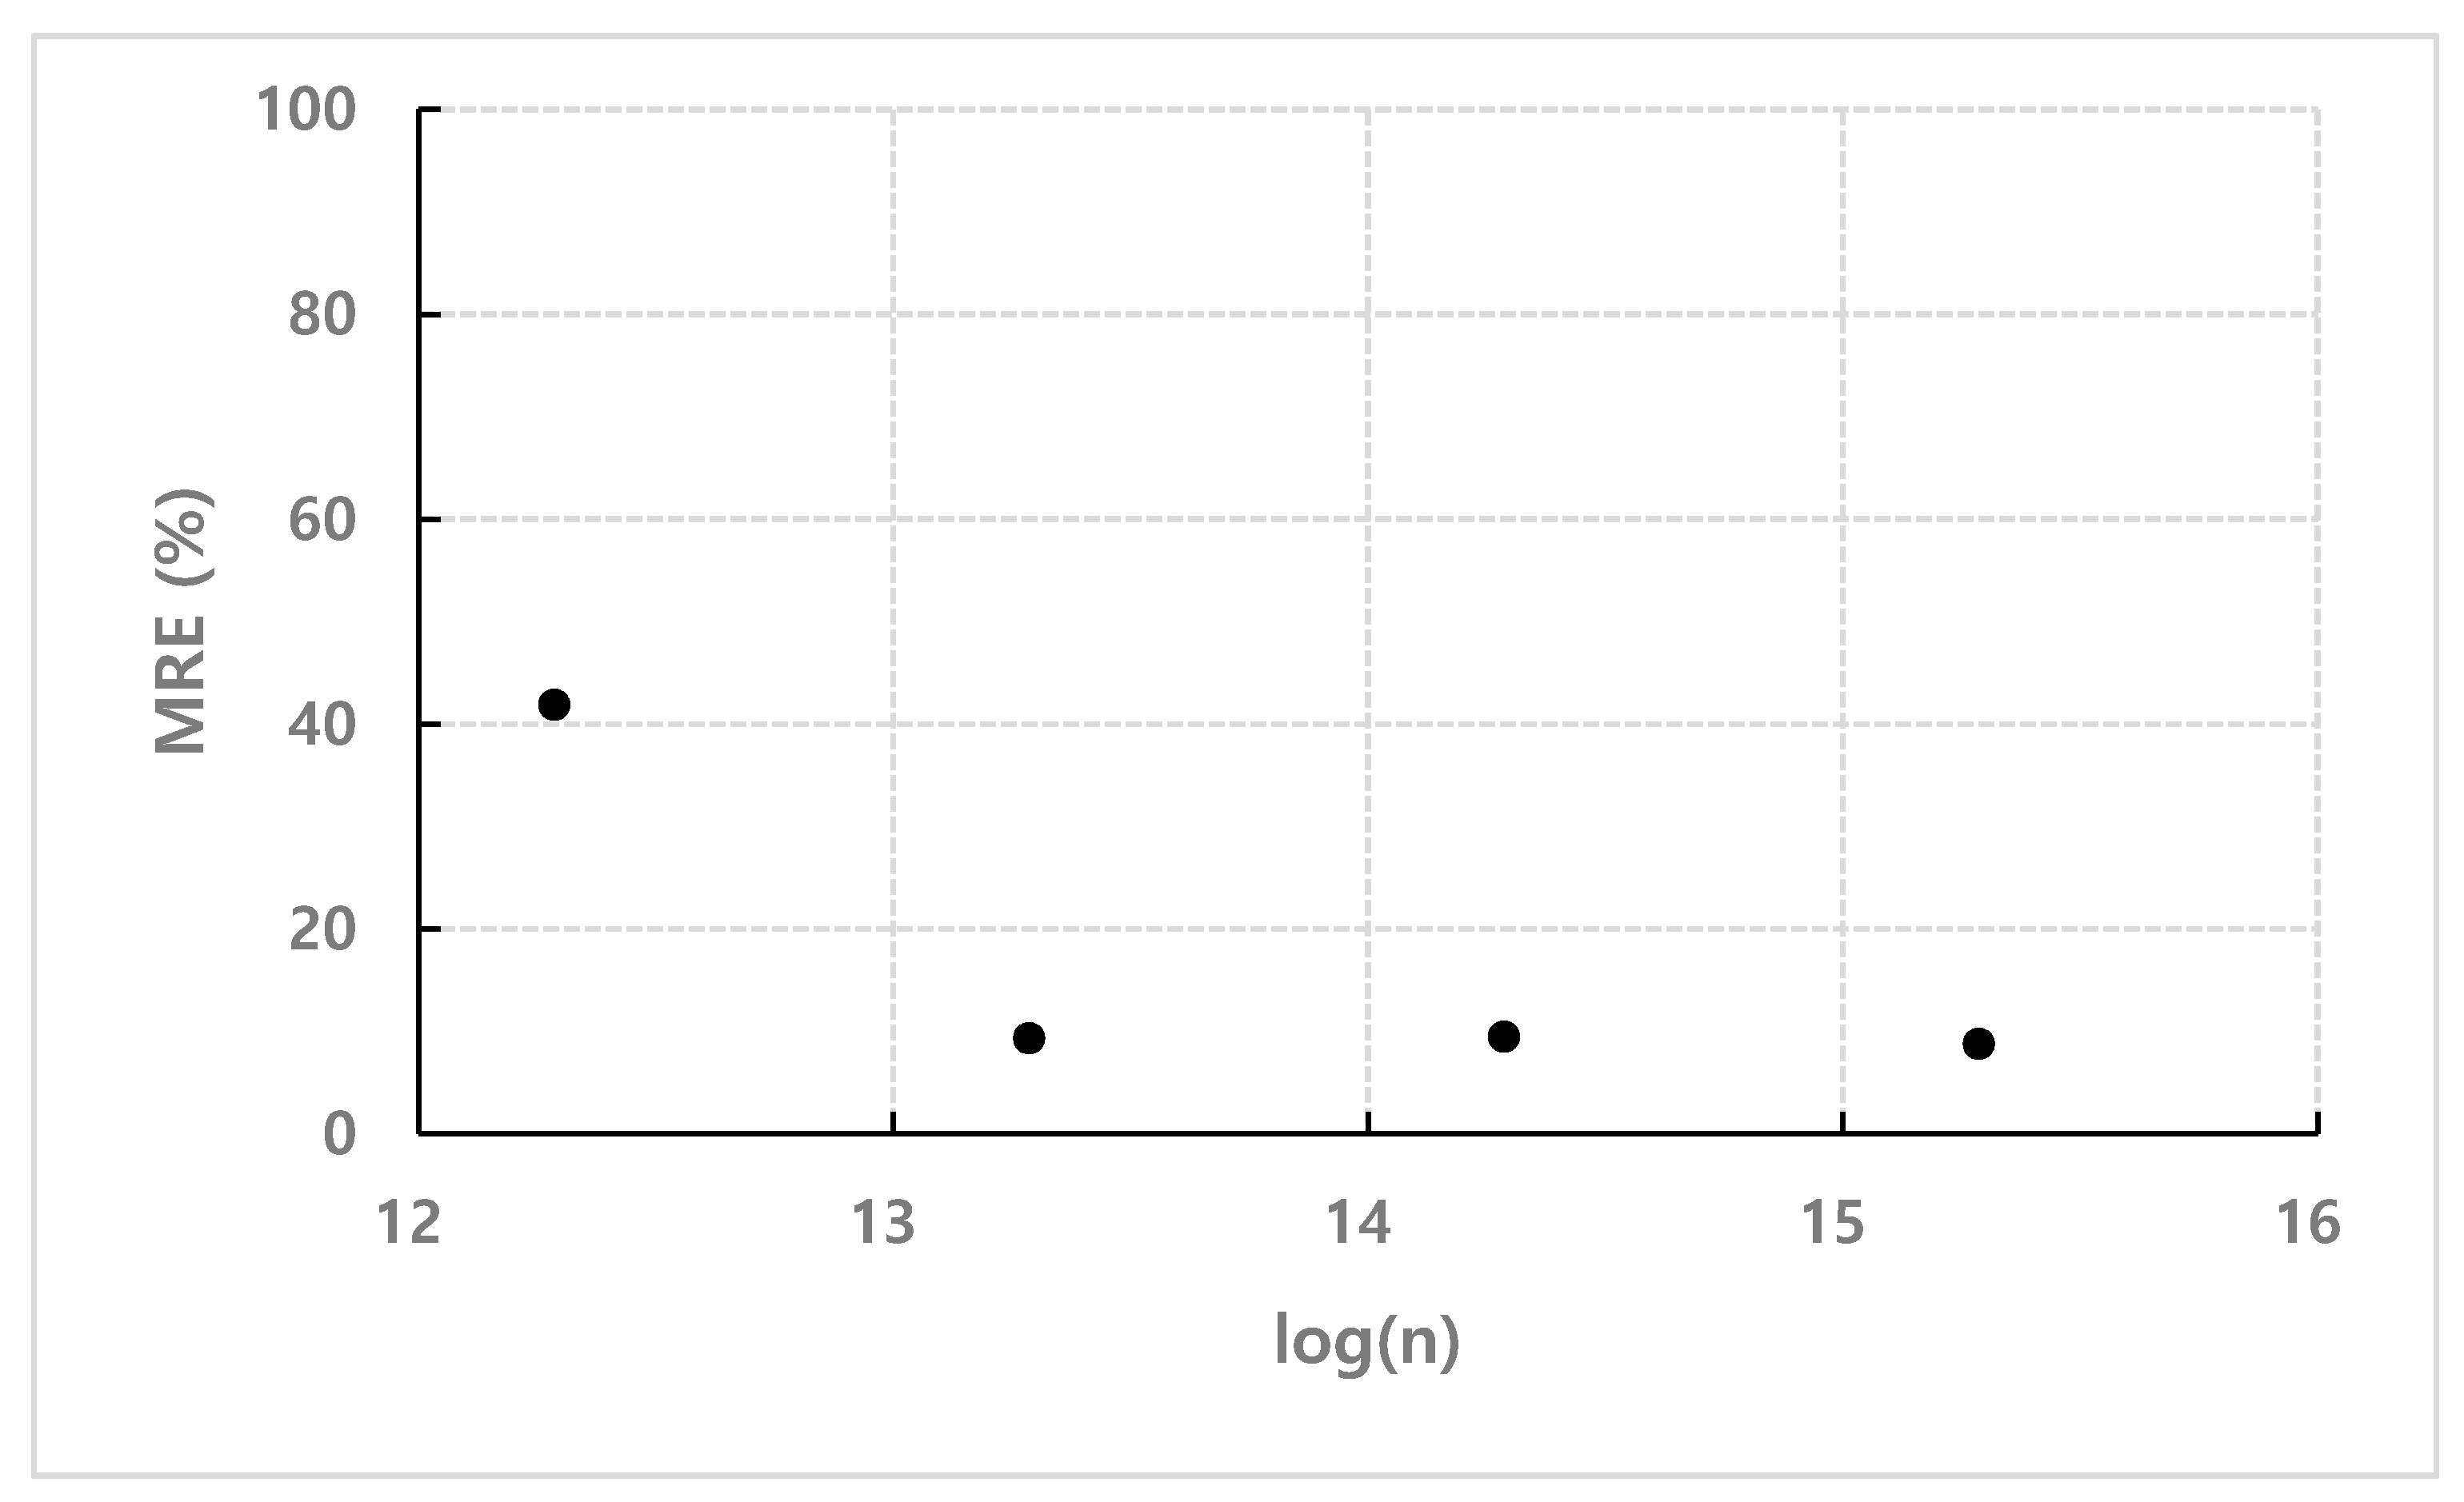
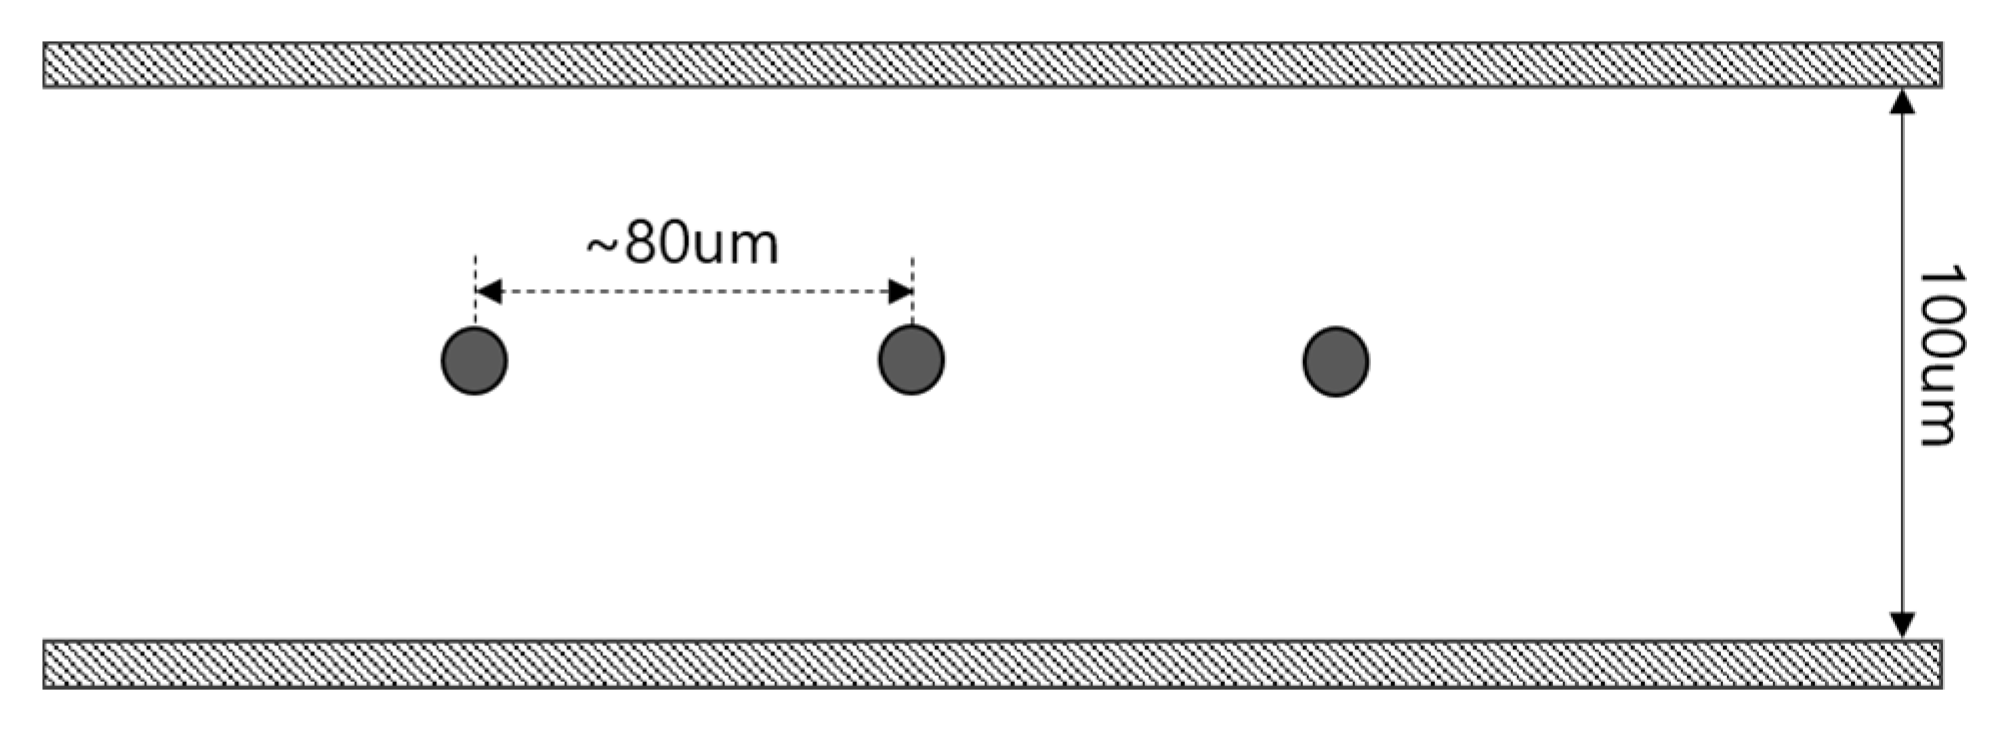
Figure 11 shows the mean relative errors (MRE) for each concentration to compare the results calculated by the empirical coefficient C with the experimental results. According to the graph, the values calculated by the mathematical model with the empirical coefficient C obtained from the normalized data in Figure 7 show a valid correlation with experimental values. However, there is a relatively large deviation in terms of number density n = 1.93 × 10 12   m 3 . This is because of the difficulty in assuming the density function for the spatial distribution of particles as a constant in extremely low-concentration samples as in Section 3. In the case of number density n = 1.93 × 10 12   m 3 , considering that the interparticle distance is about 80 µm and the height of the channel used in the experiment is 100 µm, as shown in Figure 12, only one particle is distributed in the height direction on average. Consequently, it is difficult to apply a continuum mathematical model and a large deviation is shown.
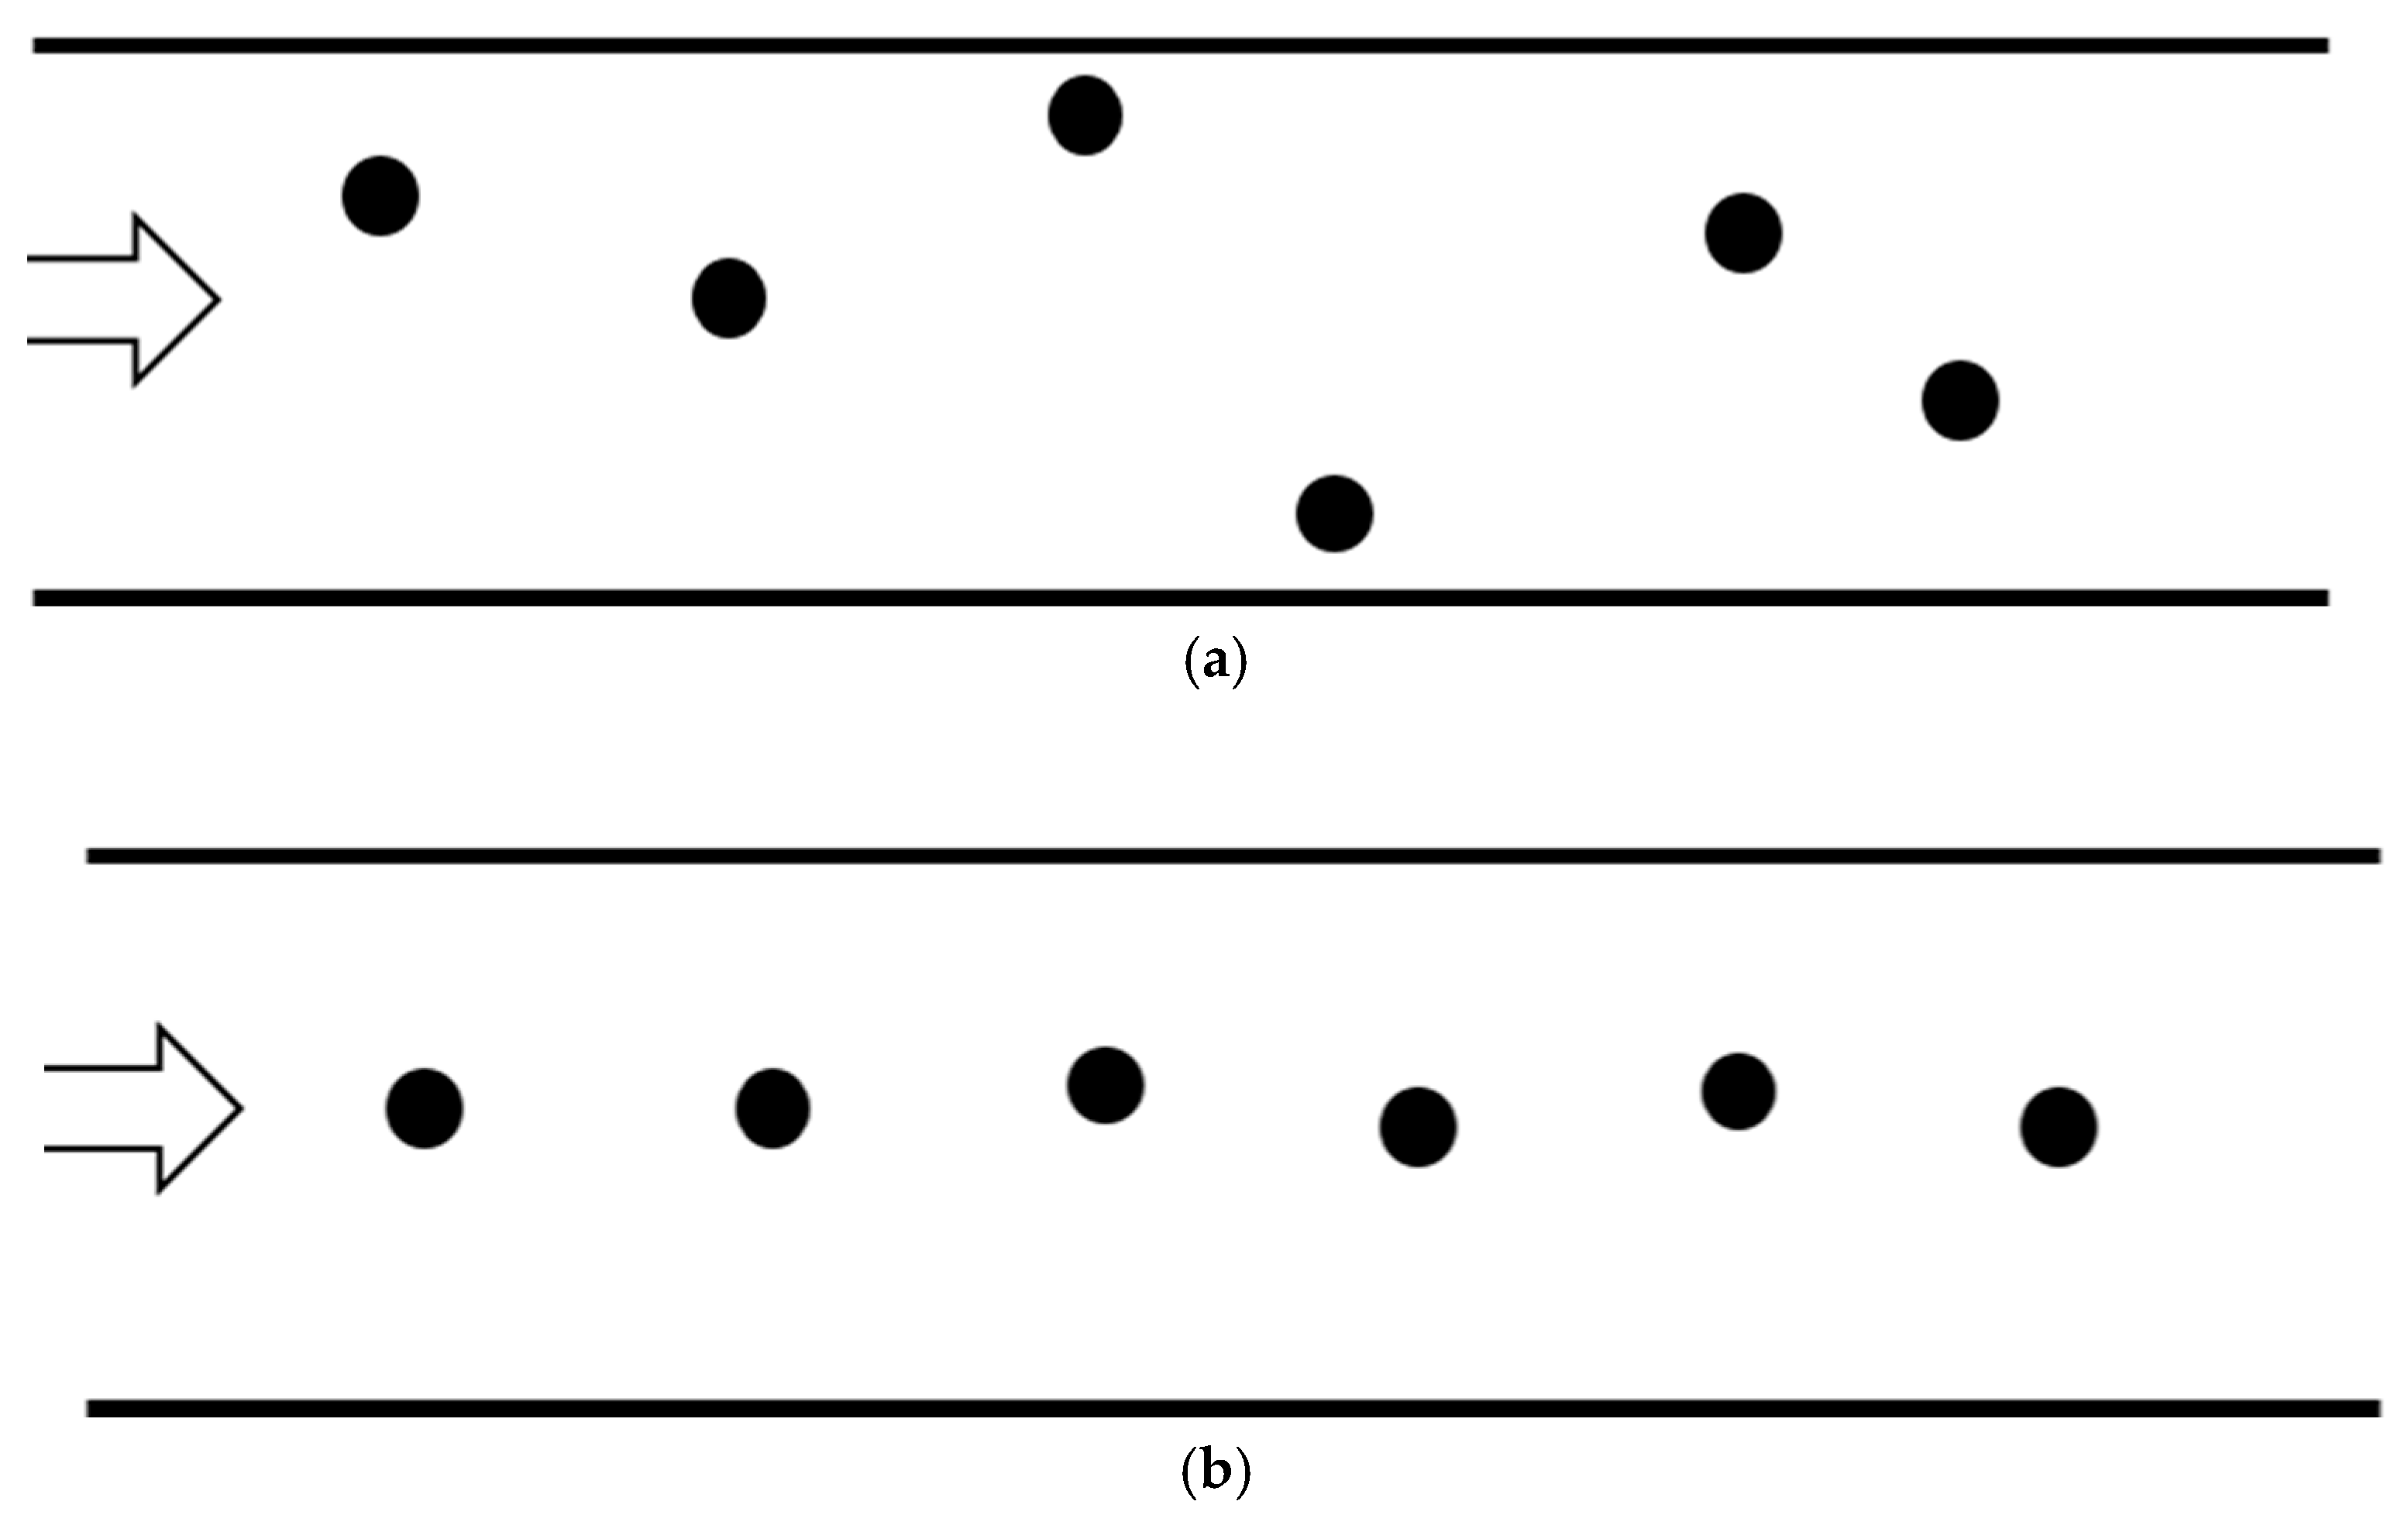
The results also show that the interaction between particles and wall has almost no effect on the distribution of particles in the channel. This is because if the repulsion of the wall and particles affects the distribution in the channel, the particles will be concentrated near the center of the channel as shown in Figure 13b, which will reduce the binding efficiency significantly. That is, the wall-particle repulsion may act strongly near the wall, but not enough to affect the distribution of particles.
Meanwhile, the shear induced lift force can affect transport of analytes and it is described as below [35].
F L = K μ V r 2 ( γ ˙ ν ) 1 / 2
where K is the numerical constant, V is the relative velocity, r is the radius of particle, γ ˙ is the shear rate, μ and ν are the dynamic and kinetic viscosity, respectively.
The maximum lift force exerted to the analyte is 6.31 × 10 18   N from Equation (11) and Goldman results for the slip velocity [36]. For this maximum lift force, the maximum terminal velocity and time to reach terminal velocity are calculated as below.
v t , max = F lift 6 π μ r   ~   3.35   nm / s
T = m 6 π μ r   ~   2 × 10 12   s
Considering that it is the maximum value and it is dissipated as the analyte moves to the channel center, the effect by the shear can be neglected.
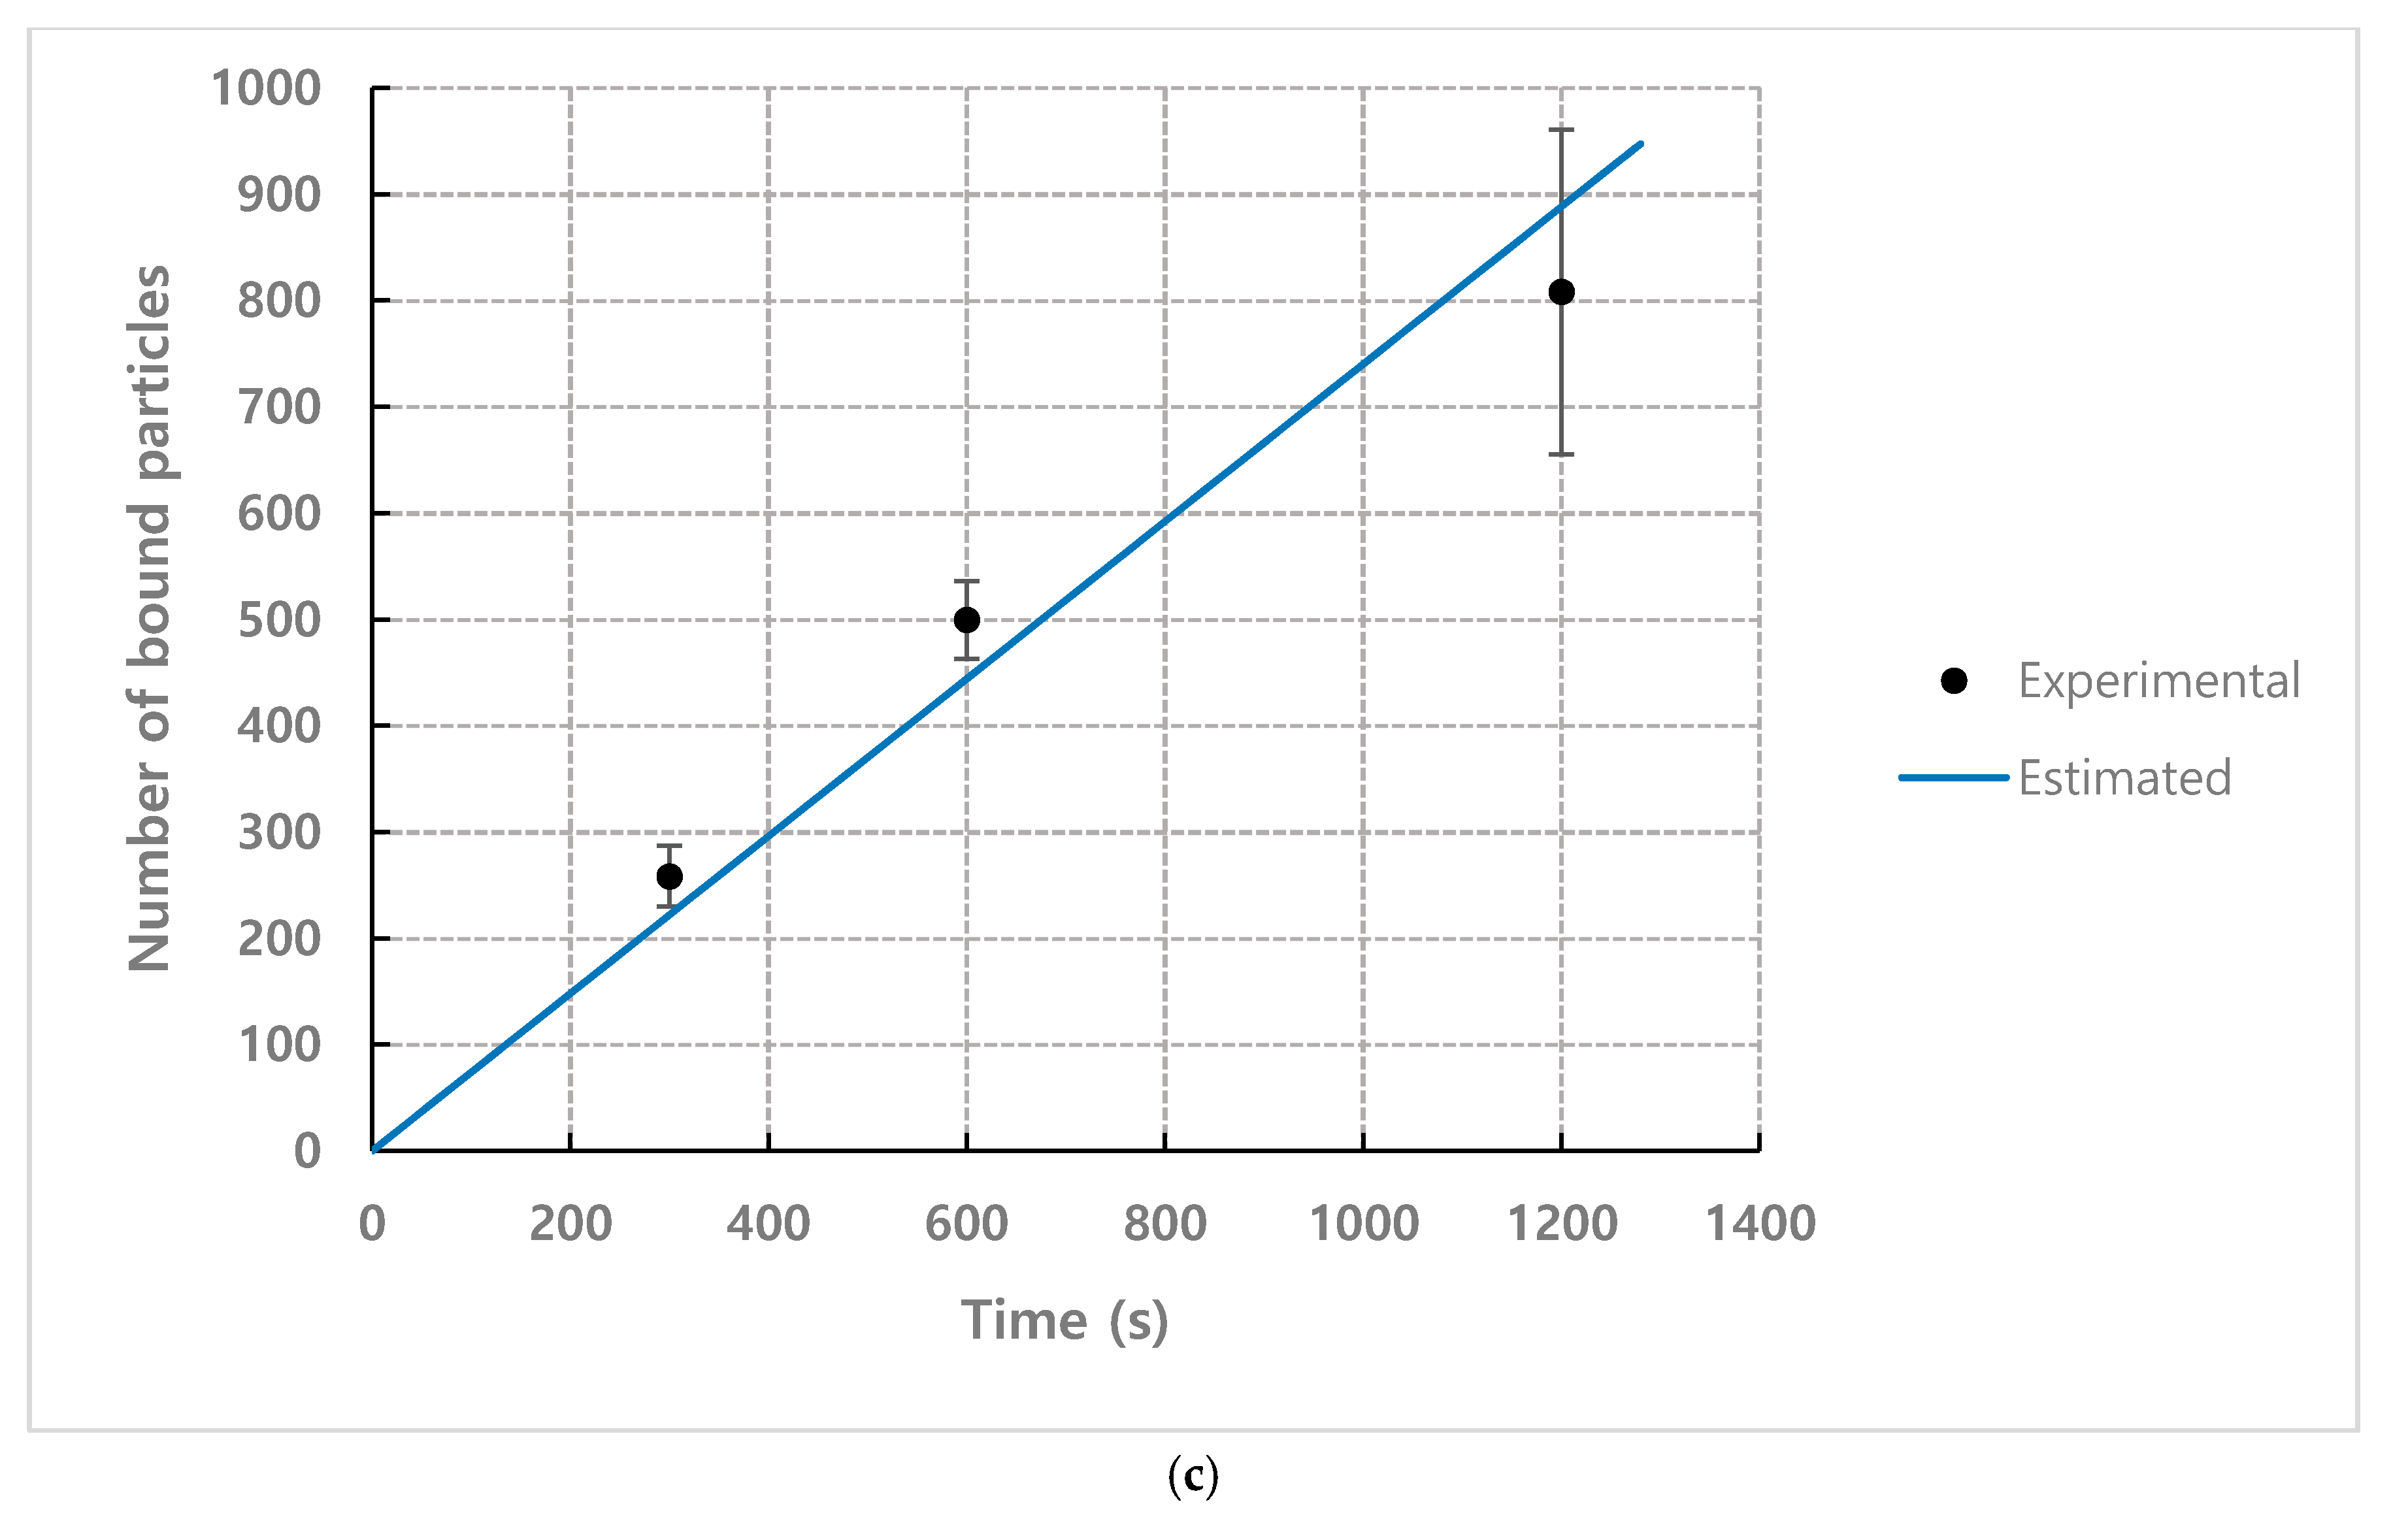
The results of comparing the test results with different flow rates using coefficient C = 0.0395 with the predicted values by the model are as follows (Figure 14). Even when the flow rate conditions were different, the results predicted by the model were close to the experimental values.
For capillary flow, which is widely used in medical diagnostic device, the flow rate is determined by the surface tension and the viscosity of sample solution. Except for the flow front, velocity profile for the capillary flow is coincident to the pressure driven flow. Thus, the mathematical model can be applied for capillary flow in the same manner with adequate velocity profile.

4.4. Effect of Observation Position from Inlet and Channel Height

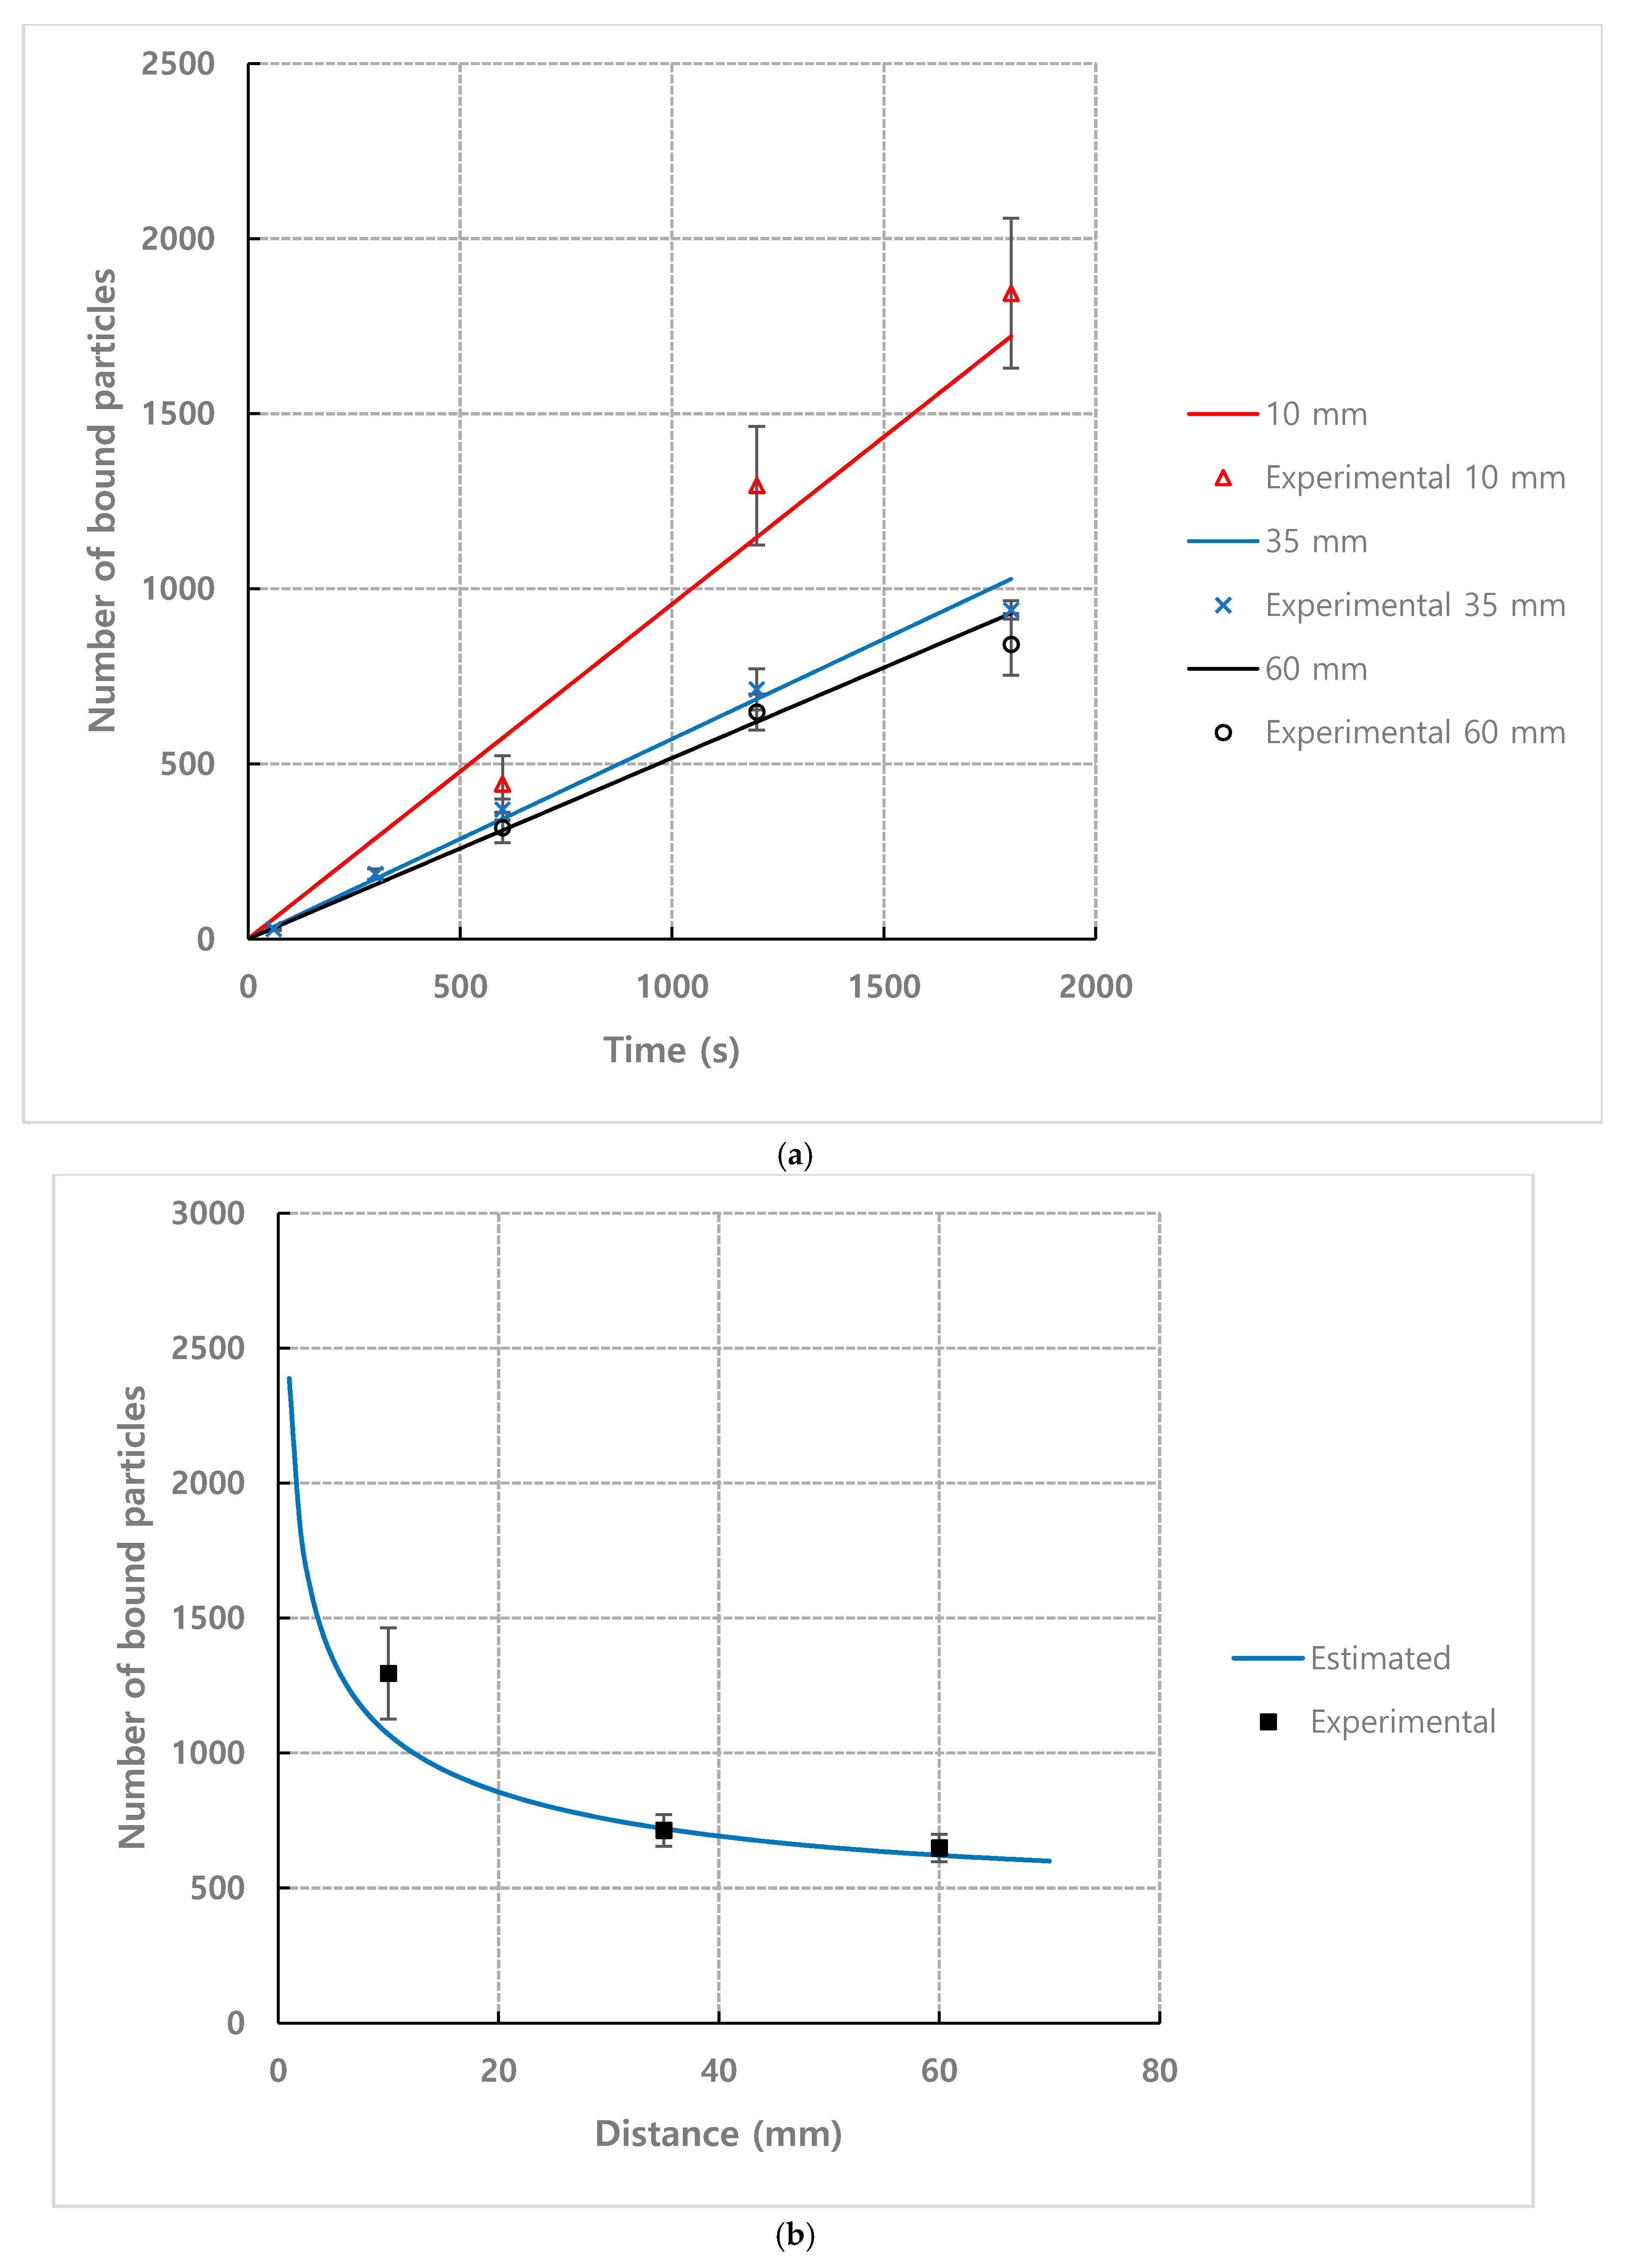
Figure 15 shows the results of comparing the estimated values by the model with the experimental results depending on the observation position for number density n = 1.93 × 10 14   m 3 and flow rate = 1.2 mL/h. The comparison was performed to examine the difference in binding efficiency according to the observation position of the channel. The observation position was set to 10 mm, 35 mm, and 60 mm from the inlet to exclude the entrance effect. Figure 15b shows the result of plotting the number of bound particles according to the observation position when fixing the detection time to 20 min. As in the experimental results, the number of bound particles exponentially decreased as the detection position moved further away from the inlet.
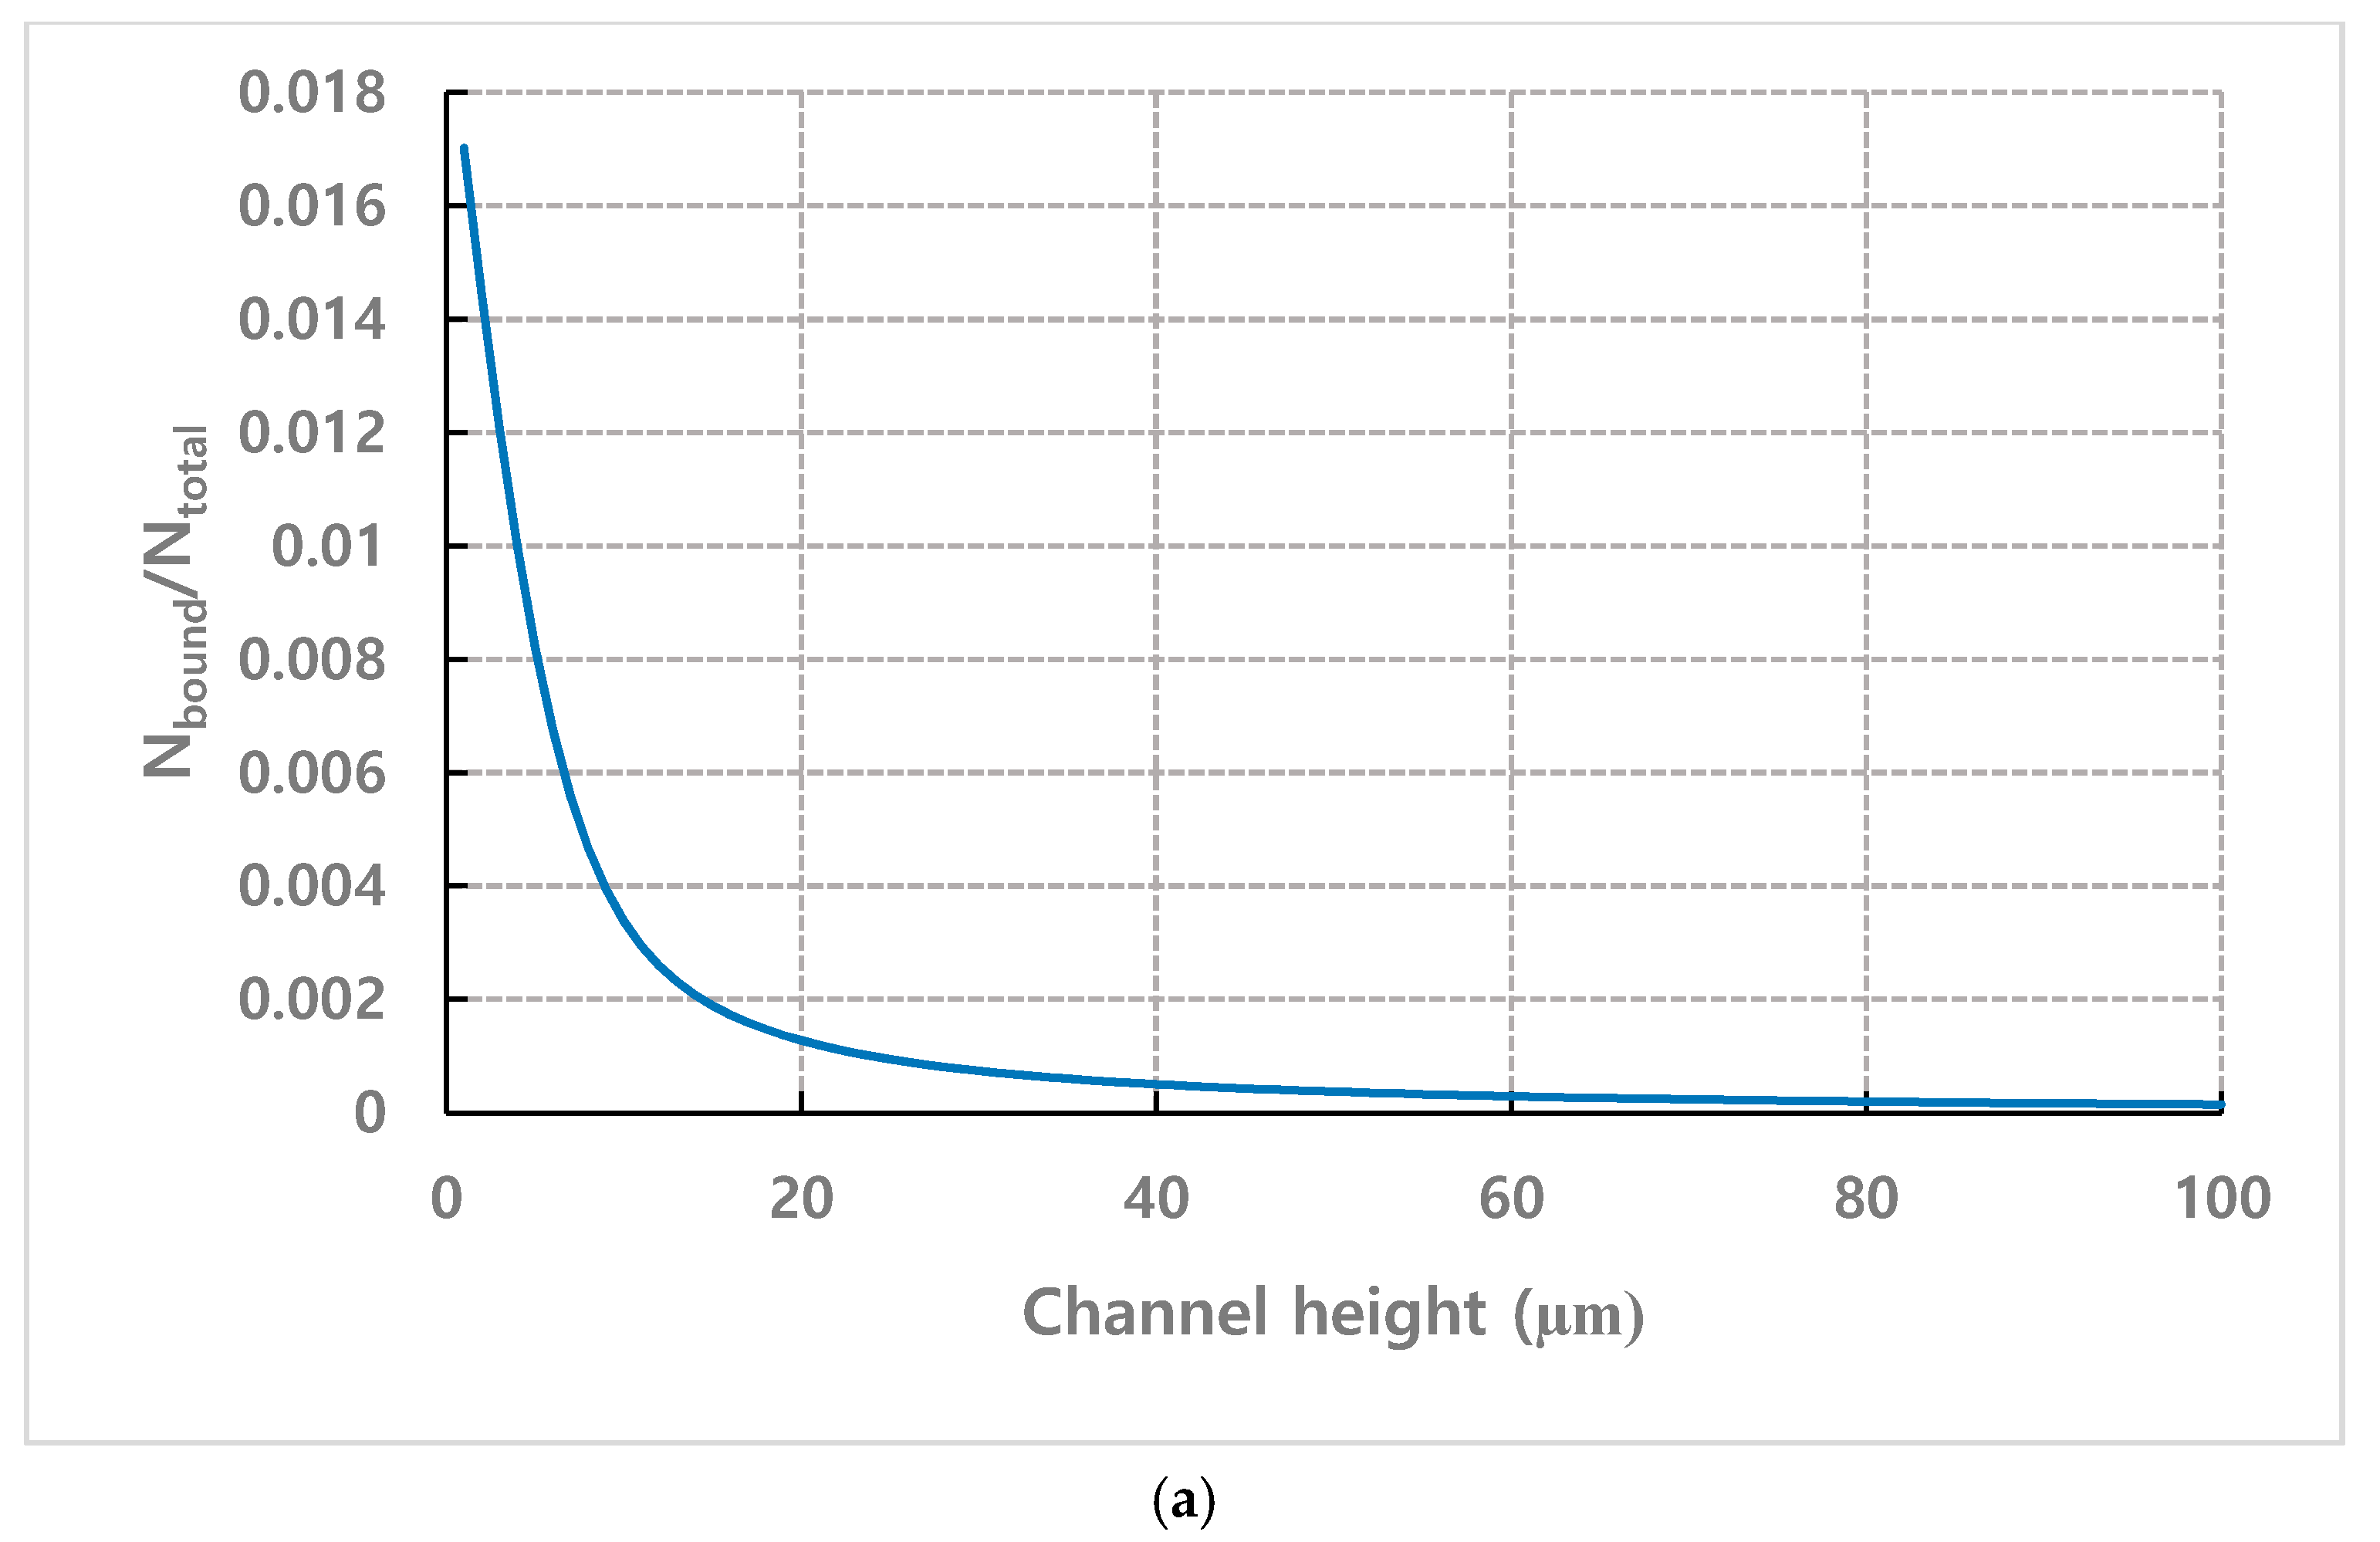
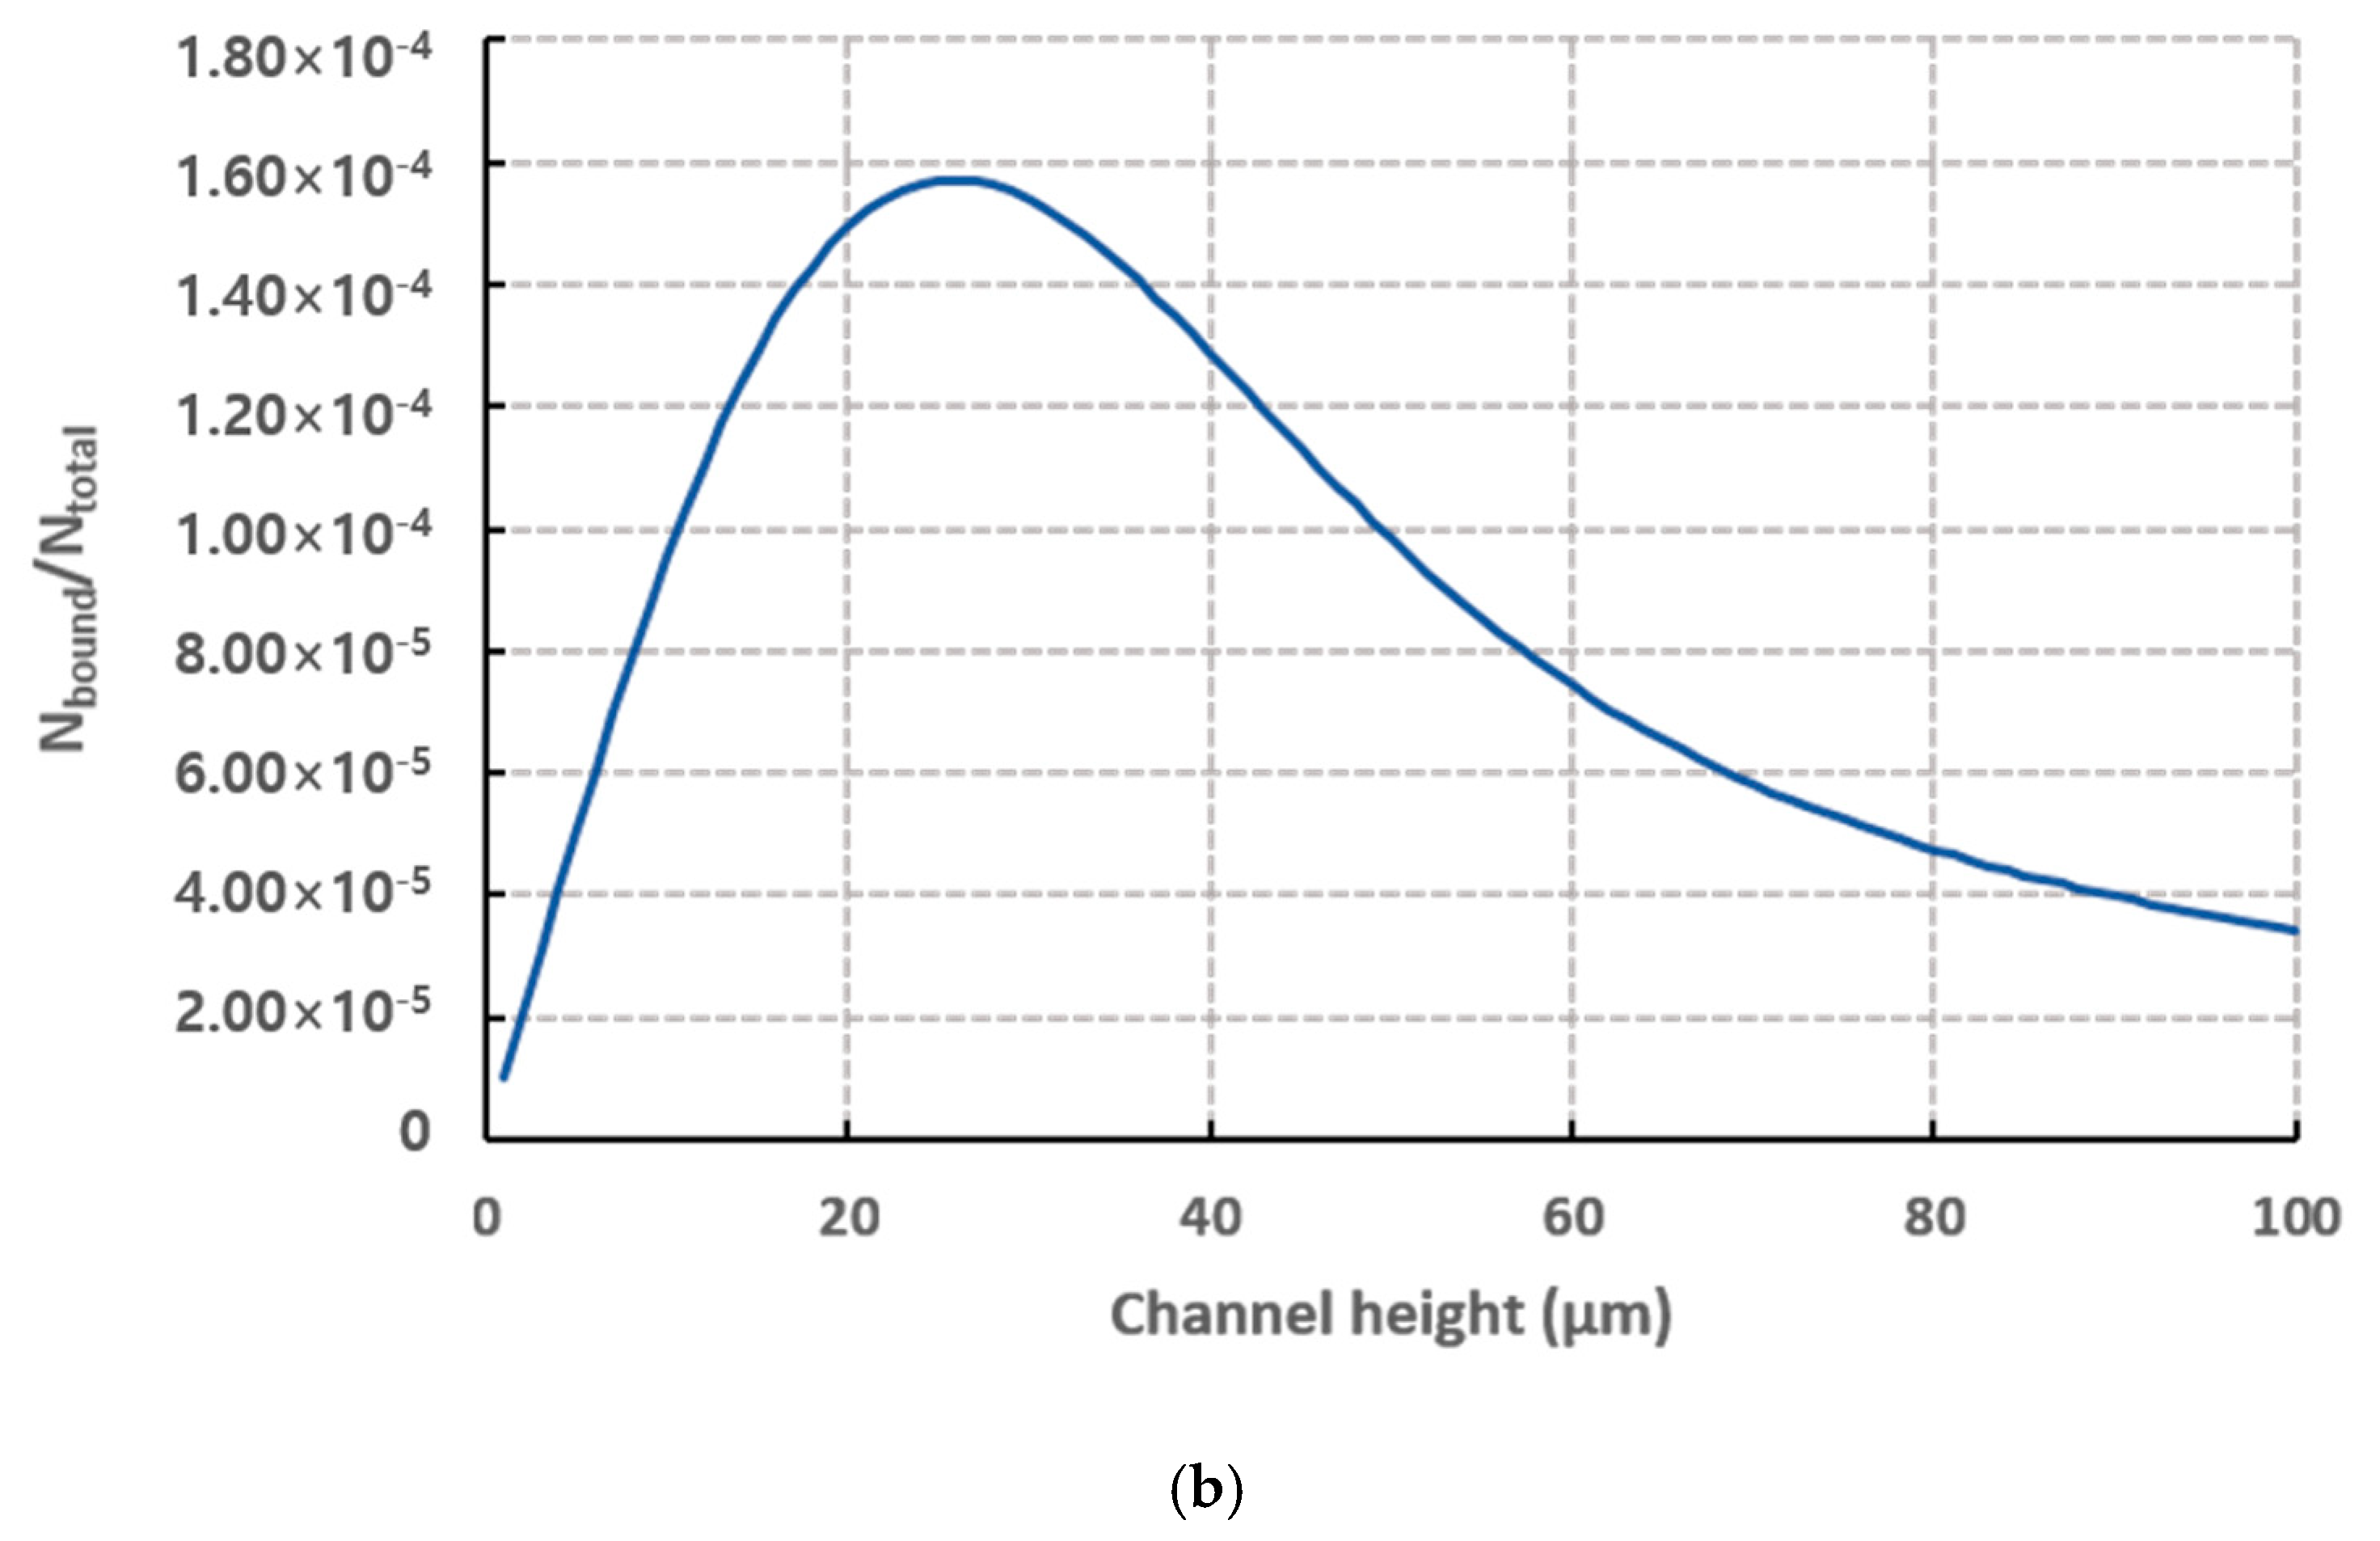
On the other hand, Figure 16 shows the results of calculating the binding efficiency according to the channel height when fixing the detection time to 20 min and setting the average x-direction velocity ( v x ¯ ) to 0.67 mm·s−1, which corresponds to the value at flow rate 1.2 mL·h−1 for 100 µm height channel. In this calculation, the binding efficiency is calculated by normalizing the number of bound particles by the total number of injected particles. As shown in Figure 16a, when observing at the inlet, the binding efficiency increases as the channel height decreases. This is because the analytes need to move less laterally to contact receptors on the wall as the height of channel decreases while the mobility by Brownian motion remains the same, regardless of the channel height. On the other hand, when observing at the position 35 mm away from the inlet, the peak for binding efficiency is shifted as shown in Figure 16b. As the channel height decreases, the particles flow away further from the wall may be bound to the receptor on wall, resulting in less particles passing to downstream. For higher channel, only particles closer to the wall can be bound to the wall near the inlet and more particles passes through the area near inlet to touch the wall away from the inlet since the particles need more time to travel before touching the wall by lateral movement. The optimal channel height for maximum binding efficiency tends to increase as the observation position moves further away from the inlet. Therefore, when setting the observation position to a certain distance from the inlet, the channel should be designed by considering the optimal value of the binding probability according to the observation position.

5. Conclusions

This article investigates experimentally and mathematically the process of analyte-receptor binding within the channel for a microfluidic biosensor. A mathematical model is proposed based on the probability density function for Brownian motion. Results from analyte-receptor binding experiments are also analyzed and a key coefficient is estimated empirically for the proposed mathematical model. The flow rate, observation position and analyte concentration are used as parameters for the binding efficiency of the microfluidic biosensor. The validity of the model is established by comparing the experimental results. Using the proposed mathematical model, an example of micro-fluidic channel for biosensor is designed and investigated the effect of the channel dimension on the binding efficiency. This study also presented an index for device design to optimize the binding efficiency, which may be used to enhance the limit of detection or to reduce the detection time or the amount of the samples.
The viscosity, temperature, interaction between analyte, or electrostatic properties such as Debye length can affect the motion of analytes. In addition, the binding phenomenon can be influenced by the chemical properties such as acidity of the sample solution. In this study, these properties were fixed in order to examine the basic motion of analyte through microfluidic channel. Hence, further research about these properties is needed.

Author Contributions

Conceptualization, W.I.L. and Y.-E.Y.; Data curation, S.C.; Formal analysis, S.C.; Funding acquisition, Y.-E.Y.; Investigation, S.C.; Methodology, S.C.; Project administration, Y.-E.Y.; Software, G.H.L.; Supervision, Y.-E.Y.; Writing—original draft, S.C.; Writing—review & editing, S.C. and Y.-E.Y. All authors have read and agreed to the published version of the manuscript.

Funding

This research was funded by the National Research Foundation of Korea (NRF) Grant funded by the Ministry of Science and ICT for First-Mover Program for Accelerating Disruptive Technology Development (2018M 3C 1B9069841), and the Institute Project of Korea Institute of Machinery and Materials (NK226E).

Conflicts of Interest

The authors declare no conflict of interest. The funders had no role in the design of the study; in the collection, analyses, or interpretation of data; in the writing of the manuscript, or in the decision to publish the results.

References

  1. Bhalla, N.; Jolly, P.; Formisano, N.; Estrela, P. Introduction to biosensors. Essays Biochem. 2016, 60, 1–8. [Google Scholar] [PubMed] [Green Version]
  2. Guo, X. Surface plasmon resonance based biosensor technique: A review. J. Biophotonics 2012, 5, 483–501. [Google Scholar] [CrossRef] [PubMed]
  3. Vigneshvar, S.; Sudhakumari, C.; Senthilkumaran, B.; Prakash, H. Recent advances in biosensor technology for potential applications—An overview. Front Bioeng. Biotechnol. 2016, 4, 11. [Google Scholar] [CrossRef] [PubMed] [Green Version]
  4. Fracchiolla, N.S.; Artuso, S.; Cortelezzi, A. Biosensors in clinical practice: Focus on oncohematology. Sensors 2013, 13, 6423–6447. [Google Scholar] [CrossRef] [Green Version]
  5. Turner, A.P. Biosensors: Sense and sensibility. Chem. Soc. Rev. 2013, 42, 3184–3196. [Google Scholar] [CrossRef] [Green Version]
  6. Mascini, M. Biosensors for medical applications. Sens. Actuators B Chem. 1992, 6, 79–82. [Google Scholar] [CrossRef]
  7. Kerman, K.; Saito, M.; Tamiya, E.; Yamamura, S.; Takamura, Y. Nanomaterial-based electrochemical biosensors for medical applications. TrAC Trends Anal. Chem. 2008, 27, 585–592. [Google Scholar] [CrossRef]
  8. Alhadrami, H.A. Biosensors: Classifications, medical applications, and future prospective. Biotechnol. Appl. Biochem. 2018, 65, 497–508. [Google Scholar] [CrossRef]
  9. Anderson, G.P.; Golden, J.P.; Ligler, F.S. A fiber optic biosensor: Combination tapered fibers designed for improved signal acquisition. Biosens. Bioelectron. 1993, 8, 249–256. [Google Scholar] [CrossRef]
  10. Luo, C.; Tang, H.; Cheng, W.; Yan, L.; Zhang, D.; Ju, H.; Ding, S. A sensitive electrochemical DNA biosensor for specific detection of Enterobacteriaceae bacteria by Exonuclease III-assisted signal amplification. Biosens. Bioelectron. 2013, 48, 132–137. [Google Scholar] [CrossRef]
  11. Chen, X.; Wang, Y.; Zhang, Y.; Chen, Z.; Liu, Y.; Li, Z.; Li, J. Sensitive electrochemical aptamer biosensor for dynamic cell surface N-glycan evaluation featuring multivalent recognition and signal amplification on a dendrimer–graphene electrode interface. Anal. Chem. 2014, 86, 4278–4286. [Google Scholar] [CrossRef] [PubMed]
  12. Liu, R.; Wang, Q.; Li, Q.; Yang, X.; Wang, K.; Nie, W. Surface plasmon resonance biosensor for sensitive detection of microRNA and cancer cell using multiple signal amplification strategy. Biosens. Bioelectron. 2017, 87, 433–438. [Google Scholar] [CrossRef] [PubMed]
  13. Zhao, X.-H.; Ma, Q.-J.; Wu, X.-X.; Zhu, X. Graphene oxide-based biosensor for sensitive fluorescence detection of DNA based on exonuclease III-aided signal amplification. Anal. Chim. Acta 2012, 727, 67–70. [Google Scholar] [CrossRef] [PubMed]
  14. Rossi, A.M.; Wang, L.; Reipa, V.; Murphy, T.E. Porous silicon biosensor for detection of viruses. Biosens. Bioelectron. 2007, 23, 741–745. [Google Scholar] [CrossRef] [PubMed]
  15. Arya, S.K.; Saha, S.; Ramirez-Vick, J.E.; Gupta, V.; Bhansali, S.; Singh, S.P. Recent advances in ZnO nanostructures and thin films for biosensor applications. Anal. Chim. Acta 2012, 737, 1–21. [Google Scholar] [CrossRef] [PubMed]
  16. Saei, A.A.; Dolatabadi, J.E.N.; Najafi-Marandi, P.; Abhari, A.; de la Guardia, M. Electrochemical biosensors for glucose based on metal nanoparticles. Trac Trends Anal. Chem. 2013, 42, 216–227. [Google Scholar] [CrossRef]
  17. Luo, X.; Morrin, A.; Killard, A.J.; Smyth, M.R. Application of nanoparticles in electrochemical sensors and biosensors. Electroanal. Int. J. Devoted Fundam. Pract. Asp. Electroanal. 2006, 18, 319–326. [Google Scholar] [CrossRef] [Green Version]
  18. Lee, G.U.; Kidwell, D.A.; Colton, R.J. Sensing discrete streptavidin-biotin interactions with atomic force microscopy. Langmuir 1994, 10, 354–357. [Google Scholar] [CrossRef]
  19. Rife, J.; Miller, M.; Sheehan, P.; Tamanaha, C.; Tondra, M.; Whitman, L. Design and performance of GMR sensors for the detection of magnetic microbeads in biosensors. Sens. Actuators A Phys. 2003, 107, 209–218. [Google Scholar] [CrossRef]
  20. Baselt, D.R.; Lee, G.U.; Natesan, M.; Metzger, S.W.; Sheehan, P.E.; Colton, R.J. A biosensor based on magnetoresistance technology. Biosens. Bioelectron. 1998, 13, 731–739. [Google Scholar] [CrossRef]
  21. Graham, D.; Ferreira, H.; Bernardo, J.; Freitas, P.; Cabral, J. Single magnetic microsphere placement and detection on-chip using current line designs with integrated spin valve sensors: Biotechnological applications. J. Appl. Phys. 2002, 91, 7786–7788. [Google Scholar] [CrossRef]
  22. Golden, J.P.; Floyd-Smith, T.M.; Mott, D.R.; Ligler, F.S. Target delivery in a microfluidic immunosensor. Biosens. Bioelectron. 2007, 22, 2763–2767. [Google Scholar] [CrossRef] [PubMed]
  23. Fürjes, P.; Holczer, E.; Tóth, E.; Iván, K.; Fekete, Z.; Bernier, D.; Dortu, F.; Giannone, D. PDMS microfluidics developed for polymer based photonic biosensors. Microsyst. Technol. 2015, 21, 581–590. [Google Scholar] [CrossRef] [Green Version]
  24. Lynn Jr, N.S.; Martínez-López, J.-I.; Bocková, M.; Adam, P.; Coello, V.; Siller, H.R.; Homola, J. Biosensing enhancement using passive mixing structures for microarray-based sensors. Biosens. Bioelectron. 2014, 54, 506–514. [Google Scholar] [CrossRef]
  25. Albrecht, T.; Gibb, T.; Nuttall, P. Ion transport in nanopores. In Engineered Nanopores for Bioanalytical Applications; Elsevier: Amsterdam, The Netherlands, 2013; pp. 1–30. [Google Scholar]
  26. Kätelhön, E.; Sokolov, S.V.; Compton, R.G. Near-wall hindered diffusion: Implications for surface-based sensors. Sens. Actuators B Chem. 2016, 234, 420–425. [Google Scholar] [CrossRef]
  27. Uma, B.; Swaminathan, T.; Radhakrishnan, R.; Eckmann, D.; Ayyaswamy, P. Nanoparticle Brownian motion and hydrodynamic interactions in the presence of flow fields. Phys. Fluids 2011, 23, 073602. [Google Scholar] [CrossRef] [Green Version]
  28. Jomeh, S.; Hoorfar, M. Numerical modeling of mass transport in microfluidic biomolecule-capturing devices equipped with reactive surfaces. Chem. Eng. J. 2010, 165, 668–677. [Google Scholar] [CrossRef]
  29. Gervais, T.; Jensen, K.F. Mass transport and surface reactions in microfluidic systems. Chem. Eng. Sci. 2006, 61, 1102–1121. [Google Scholar] [CrossRef]
  30. Sadeghi, A.; Amini, Y.; Saidi, M.H.; Chakraborty, S. Numerical modeling of surface reaction kinetics in electrokinetically actuated microfluidic devices. Anal. Chim. Acta 2014, 838, 64–75. [Google Scholar] [CrossRef]
  31. Allen, S.; Davies, J.; Dawkes, A.; Davies, M.; Edwards, J.; Parker, M.; Roberts, C.; Sefton, J.; Tendler, S.; Williams, P. In situ observation of streptavidin-biotin binding on an immunoassay well surface using an atomic force microscope. FEBS Lett. 1996, 390, 161–164. [Google Scholar] [CrossRef] [Green Version]
  32. Yuan, C.; Chen, A.; Kolb, P.; Moy, V.T. Energy landscape of streptavidin− biotin complexes measured by atomic force microscopy. Biochemistry 2000, 39, 10219–10223. [Google Scholar] [CrossRef] [PubMed]
  33. Wei, S.; Vaidya, B.; Patel, A.B.; Soper, S.A.; McCarley, R.L. Photochemically patterned poly (methyl methacrylate) surfaces used in the fabrication of microanalytical devices. J. Phys. Chem. B 2005, 109, 16988–16996. [Google Scholar] [CrossRef] [PubMed]
  34. Vesel, A.; Elersic, K.; Mozetic, M. Immobilization of protein streptavidin to the surface of PMMA polymer. Vacuum 2012, 86, 773–775. [Google Scholar] [CrossRef]
  35. Zheng, X.; Silber-Li, Z. The influence of Saffman lift force on nanoparticle concentration distribution near a wall. Appl. Phys. Lett. 2009, 95, 124105. [Google Scholar] [CrossRef]
  36. Goldman, A.; Cox, R.; Brenner, H. Slow viscous motion of a sphere parallel to a plane wall—II Couette flow. Chem. Eng. Sci. 1967, 22, 653–660. [Google Scholar] [CrossRef]
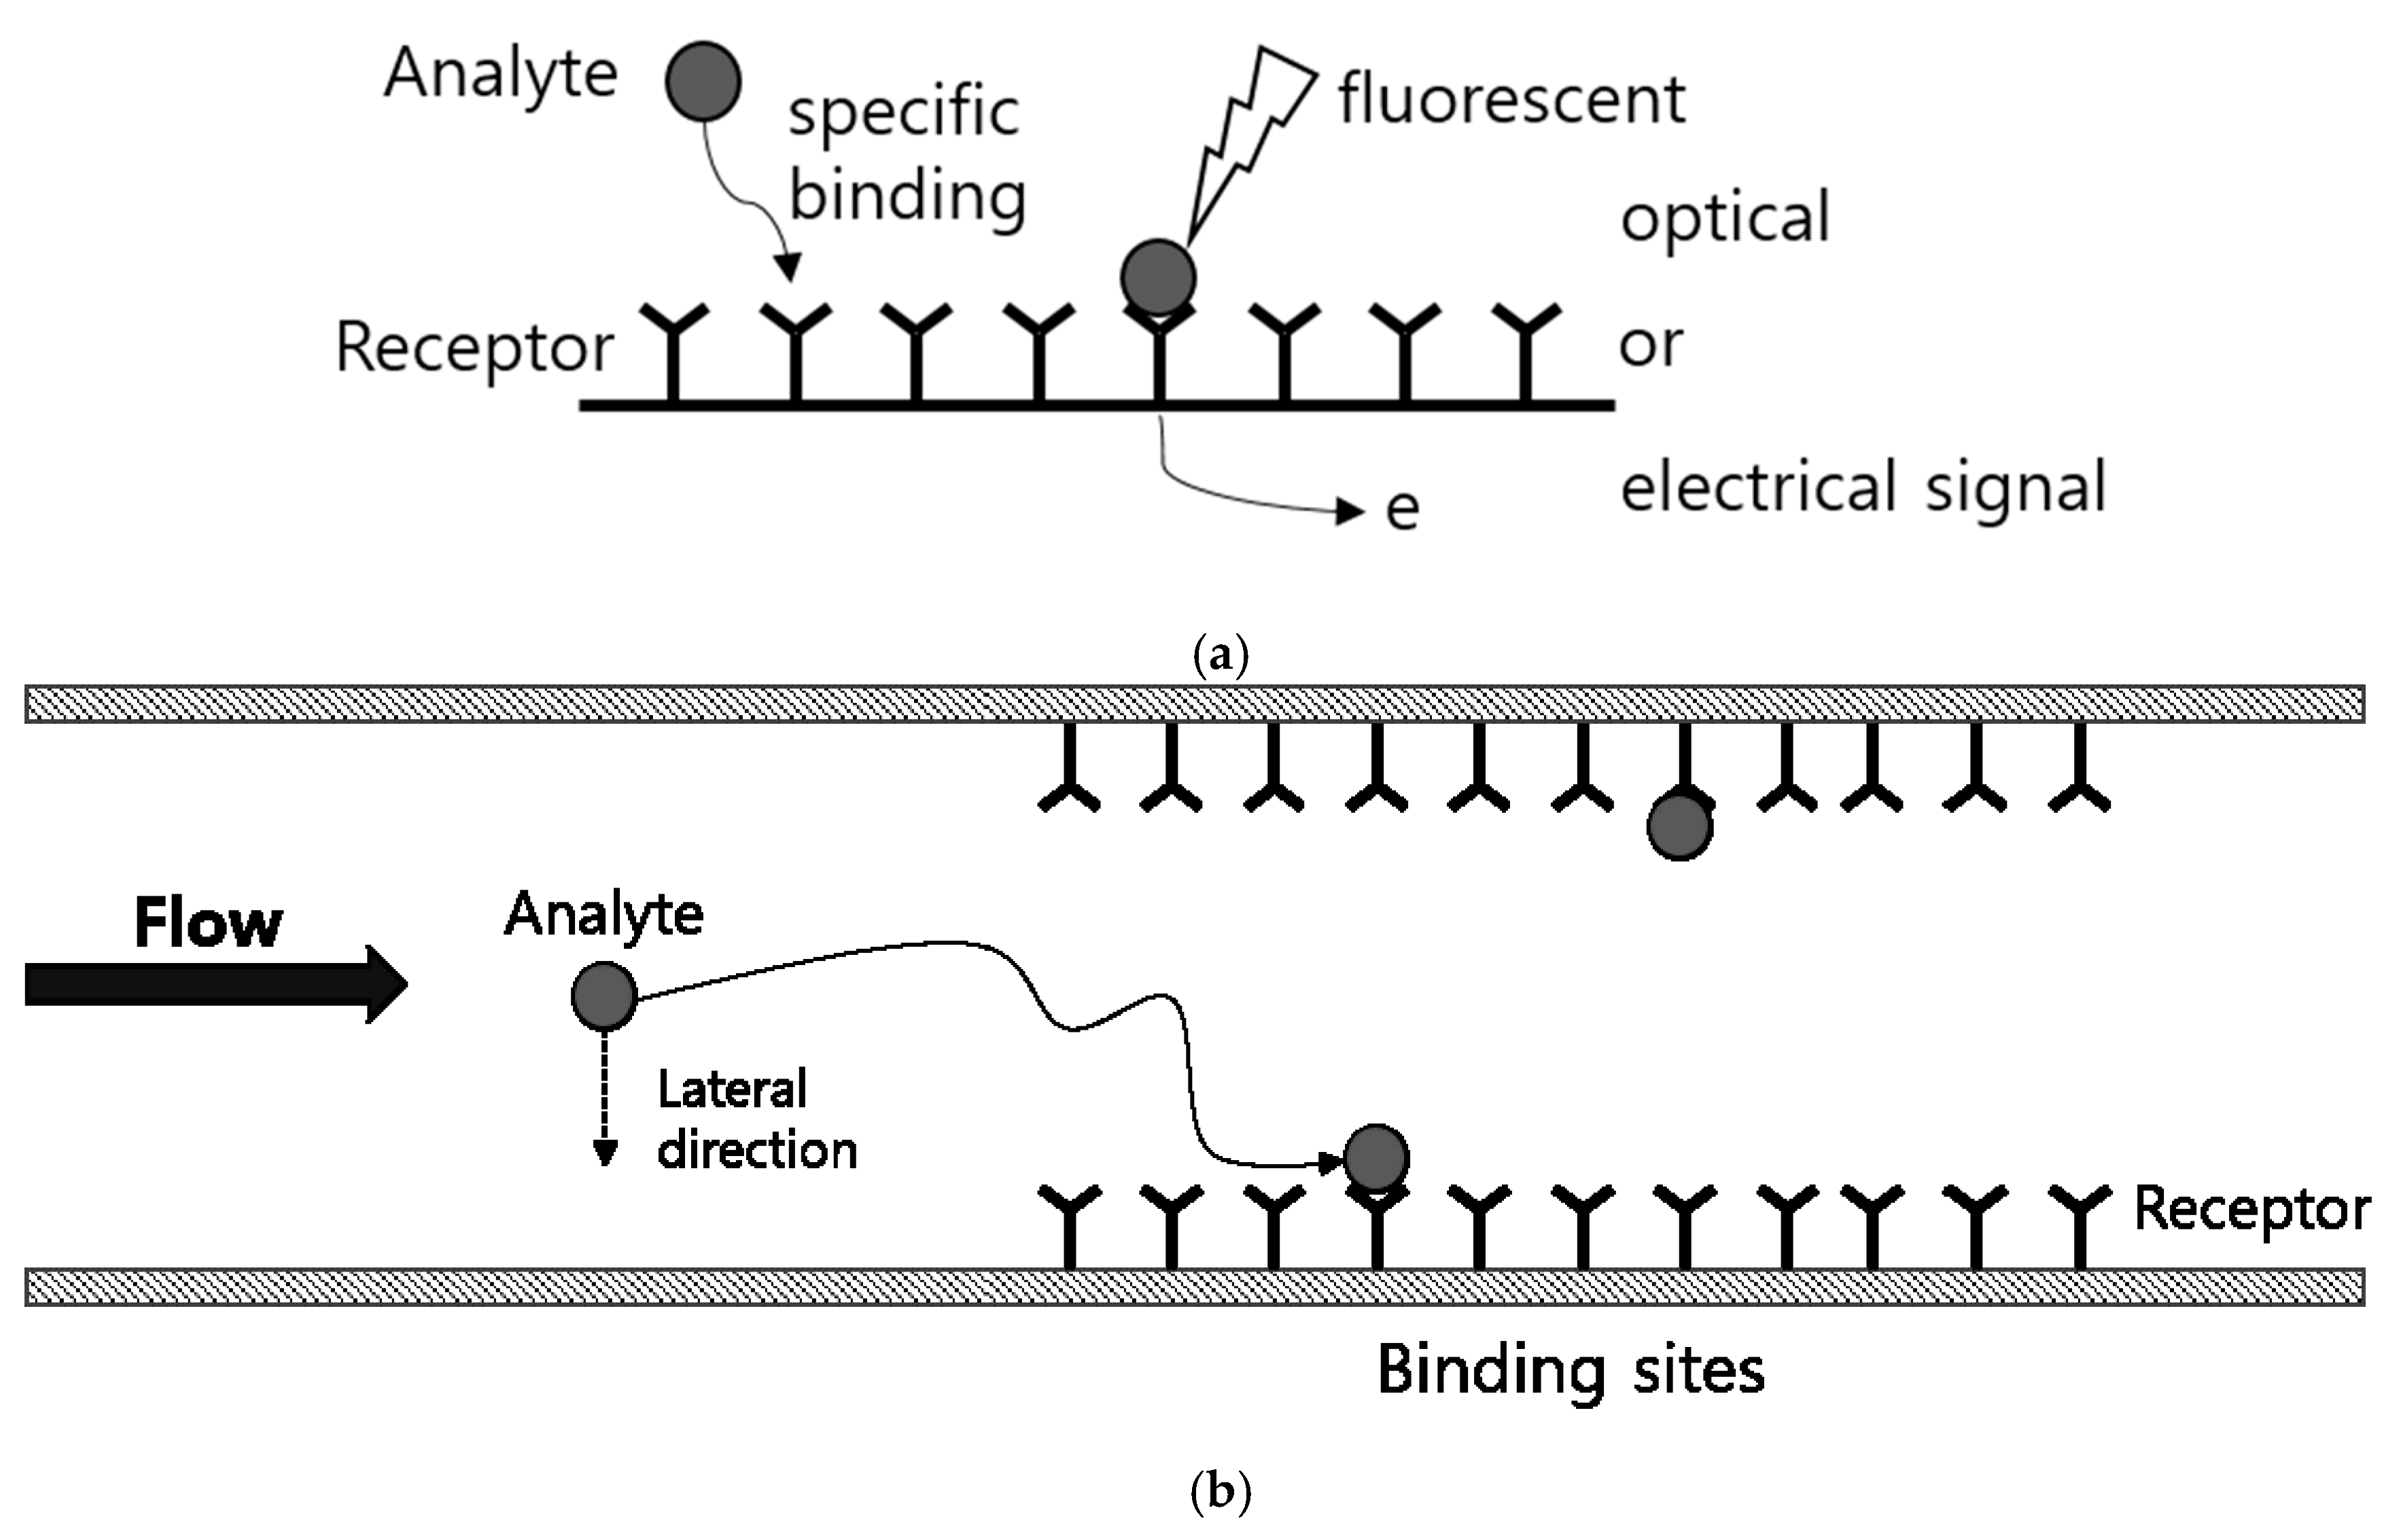
Figure 1. (a) Schematic of sensing mechanism for bio sensor. (b) Schematic of binding process between analyte and receptor in micro-channel.
Micromachines 11 00570 g001
Figure 2. Configuration of the micro-fluidic biosensor for analyte-receptor binding experiments.
Micromachines 11 00570 g002
Figure 3. Image for fluorescent biotinylated Polystyrene (PS) bead bound to streptavidin on the surface of the micro-channel (a) from fluorescent microscopy (b) after image processing for counting the bound beads.
Micromachines 11 00570 g003
Figure 4. (a) Probability density function of particles existing at distance r from the initial position after t. (b) Schematic diagram of the probability that a particle at a distance of z from the channel wall will reach the wall after t.
Micromachines 11 00570 g004aMicromachines 11 00570 g004b
Figure 5. Geometrical configuration of mathematical model for analyte-receptor binding on microscopic area of a model description.
Micromachines 11 00570 g005
Figure 6. Result of measuring the number of bound particles according to the detection time (n = 1.93 × 10 15   m 3 , flow rate = 1.2 mL·h−1, observation position = 35 mm).
Micromachines 11 00570 g006
Figure 7. Normalized Nbound according to the time for each concentration (Normalized by number density n), flow rate = 1.2 mL·h−1, observation position = 35 mm. Master curve was fitted using the least square method ( R 2 = 0.90 ).
Micromachines 11 00570 g007
Figure 8. Number of bound particles depending on flow rate for (a) n = 1.93 × 10 14   m 3 , observation position = 35 mm (b) n = 1.93 × 10 14   m 3 , observation position = 35 mm.
Micromachines 11 00570 g008
Figure 9. Number of bound particles depending on the distance of the observation position from inlet (n = 1.93 × 10 14   m 3 ,   τ = 1200 s, Flow late = 1.2 mL·h−1).
Micromachines 11 00570 g009
Figure 10. Increment of the probability of which a particle bound to the surface as time increases after being injected through inlet to the microscopic area further off from inlet.
Micromachines 11 00570 g010
Figure 11. Mean relative errors (MRE) of experimental values according to the concentration and the values calculated by using the empirical coefficient C.
Micromachines 11 00570 g011
Figure 12. Interparticle distance when the concentration is n = 1.93 × 10 12   m 3 .
Micromachines 11 00570 g012
Figure 13. (a) Random dispersed particle. (b) Focused on center of channel due to the interaction between particle and wall.
Micromachines 11 00570 g013
Figure 14. Comparison for number of bound particles from experiment and mathematical model (Equation (7)) depending on time for different flow rate condition (a) flow rate = 0.3 mL·h−1, (b) flow rate = 1.2 mL·h−1, (c) flow rate = 2.4 mL·h−1 (n = 1.93 × 10 14   m 3 , observation position = 35 mm). Solid lines depict data fitting with Equation (7). Coefficients of determination are (a) R 2 = 0.98 , (b) R 2 = 0.98 , (c) R 2 = 0.93 .
Micromachines 11 00570 g014aMicromachines 11 00570 g014b
Figure 15. Comparison for number of bound particles from experiment and mathematical model (Equation (7)) for n = 1.93 × 10 14   m 3 , flow rate = 1.2 mL·h−1. (a) depending on observation position (Coefficients of determination are R 2 = 0.95 for 10 mm, R 2 = 0.98 for 35 mm and R 2 = 0.94 for 60 mm), (b) when detection time is set to 20 min. (C = 0.0395, D = 2.4 × 10 12   m 2 · s 1 , W1 = 1362 µm, W2 = 1021 µm are used for Equation (7)).
Micromachines 11 00570 g015
Figure 16. Nbound/Ntotal according to the channel height for (a) observation position = 0 mm (b) observation position = 35 mm.
Micromachines 11 00570 g016aMicromachines 11 00570 g016b
Table 1. Experimental conditions.
Number Density (n)Flow RateObservation Position (L)
1.93 × 10 15   m 3 1.2 mL·h−135 mm
1.93 × 10 14   m 3 1.2 mL·h−135 mm
1.93 × 10 13   m 3 1.2 mL·h−135 mm
1.93 × 10 12   m 3 1.2 mL·h−135 mm
1.93 × 10 14   m 3 0.3 mL·h−135 mm
1.93 × 10 14   m 3 2.4 mL·h−135 mm
1.93 × 10 14   m 3 1.2 mL·h−110 mm
1.93 × 10 14   m 3 1.2 mL·h−160 mm