Article

Simultaneous Determination of Four DNA bases at Graphene Oxide/Multi-Walled Carbon Nanotube Nanocomposite-Modified Electrode

1
Department of Physical and Environmental Sciences, University of Toronto Scarborough, 1265 Military Trail, Toronto, ON M1C 1A4, Canada
2
Department of Chemistry, University of Toronto, 80 St. George Street, Toronto, ON M5S 3H6, Canada
*
Author to whom correspondence should be addressed.
These authors contributed equally to the work.
Micromachines 2020, 11(3), 294; https://doi.org/10.3390/mi11030294
Submission received: 17 February 2020 / Revised: 5 March 2020 / Accepted: 9 March 2020 / Published: 11 March 2020
(This article belongs to the Special Issue Graphene Nanoelectronic Devices)

Abstract

:
In this study, we developed a modified glassy carbon electrode (GCE) with graphene oxide, multi-walled carbon nanotube hybrid nanocomposite in chitosan (GCE/GO-MWCNT-CHT) to achieve simultaneous detection of four nucleobases (i.e., guanine (G), adenine (A), thymine (T) and cytosine (C)) along with uric acid (UA) as an internal standard. The nanocomposite was characterized using TEM and FT-IR. The linearity ranges were up to 151.0, 78.0, 79.5, 227.5, and 162.5 µM with a detection limit of 0.15, 0.12, 0.44, 4.02, 4.0, and 3.30 µM for UA, G, A, T, and C, respectively. Compared to a bare GCE, the nanocomposite-modified GCE demonstrated a large enhancement (~36.6%) of the electrochemical active surface area. Through chronoamperometric studies, the diffusion coefficients (D), standard catalytic rate constant (Ks), and heterogenous rate constant (Kh) were calculated for the analytes. Moreover, the nanocomposite-modified electrode was used for simultaneous detection in human serum, human saliva, and artificial saliva samples with recovery values ranging from 95% to 105%.

Graphical Abstract

1. Introduction

Deoxyribonucleic acid (DNA) is an important bio-macromolecule which plays a critical role in the storage of genetic information and the overall functioning of biological systems [1,2,3,4,5]. Deoxyribonucleic acid is composed of four nucleobases: guanine (G), adenine (A), thymine (T), and cytosine (C). Both G and A are classified as purines, whereas T and C are known as pyrimidines. These bases are the essential building blocks of the three-dimensional DNA double helix structure, where G is the complementary base with C, and A is the complementary base with T [1,2,3,4,5,6]. The order sequence of these bases in DNA is imperative, as it initiates several meticulous processes such synthesis of proteins by replication and transcription of the genetic information and duplication of the cell [1,4,7].
The abnormal concentration levels and methylation of nucleobases may be associated to DNA damage and diseases such as cancers, HIV/AIDS, myocardial cellular energy status, prostatitis, and Parkinson’s disease [6,8,9,10]. Thus, the multiplexed and sensitive detection of all nucleobases can be of great significance for clinical diagnosis and biomedical applications.
Various analytical techniques have been successfully used for the detection of nucleobases such as capillary electrophoresis (CE) [11], high-performance liquid chromatography (HPLC) [12], ultra-high-performance liquid chromatography combined with electrospray ionization and tandem spectroscopy (UHPLC-ESI-MS/MS) [13], gas chromatography [14], chemical luminescence method [15], spectrophotometric method [16], and Raman spectroscopy [17]. Although these methods are well established and very powerful, they also exhibit some drawbacks such as high-cost, time-consuming procedures, complex operation, and pre-treatment of samples [1,6,18]. To overcome some of these challenges, researchers have been leaning towards developing electrochemical sensors for the analysis of DNA bases. Electrochemical methods display many advantages such as low-cost, simple operation, rapid and real-time detection, high sensitivity, and ease of miniaturization into a portable device [1,6,18].
Nevertheless, electrochemical detection of DNA bases remains challenging because purines and pyrimidine compounds tend to strongly adsorb on the surfaces and high energy is required to oxidize T and C bases. Previously, T and C were assumed to exhibit no electrochemical activity at carbon-based electrodes because of their slow electron transfer kinetics. For example, Xiao et al. [8] fabricated a modified glassy carbon electrode (GCE) using ionic liquid, multi-walled carbon nanotubes (MWCNTs), and gold nanoparticles but could only achieve detection of guanine and adenine. Hason et al. [19] developed a mechanically roughened edge-plan pyrolytic graphite electrode and were still only able to detect the purine nucleobases. Similar attempt was made by Geng et al. [20], where they used a complex three-dimensional WS2 nanosheet/graphite microfiber hybrid electrode, but detection for pyrimidine nucleobases was still unachievable. Brett et al. [7] were the first to report the electrochemical oxidation of all four DNA bases at a GCE in highly basic conditions. In their method, linear ranges for detecting all nucleobases were quite narrow: from 0.2 to 10 μM for purines and 1 to 20 μM for pyrimidines [7]. Hence, there is a need to develop a sensor with improved linear ranges and a higher sensitivity for the simultaneous detection of the four nucleobases.
Since uric acid (UA) is the final product formed in the blood as a result of metabolism of purines such as G and A, it is important for the sensor to have the capacity to detect these bases along with UA as an internal standard [21]. The chemical structure of UA is also extremely similar to the structures of G and A purines, thus simultaneously detecting this compound along with the four DNA bases is important to ensure that no interference or overlapping of signals would be observed.
In this work, we developed a novel nanocomposite of graphene oxide (GO)-multi-walled carbon nanotube (MWCNT) hybrid in chitosan (CHT) for the modification of a GCE surface (GCE/GO-MWCNT-CHT) and utilized this modified GCE for the simultaneous determination of all four DNA bases in presence of UA as the internal standard. To the best of our knowledge, no study has been done to detect all four bases simultaneously in the presence of UA using nanocomposite modification of GCE. Both GO and MWCNT have been widely used nanomaterials for the modification of electrodes since they possess excellent mechanical flexibility, bio-compatibility, stability, large surface area, and high electrochemical conductivity [10,22,23,24]. Recently, a novel class of hybrid materials has been introduced which are generated by hybridizing MWCNT with graphene or graphene oxide sheets [25]. These hybrids showed to have better performances in electroanalytical applications compared to when the materials making up the hybrid were used separately. Moreover, this hybrid is beneficial for sensor fabrication because the π–π stacking interaction between the hydrophobic region of GO and the walls of MWCNT assist in avoiding the restacking of the MWCNT and increase the stability of the GO-MWCNT dispersion [25,26]. Additionally, the natural polymer, CHT, is used as a dispersing material in the modification steps of GCE surfaces [22]. An ideal candidate for sensor fabrication is CHT due to its unique properties such high stability, biocompatibility, good adhesion and insolubility in water [27,28].
In this study, a set of calibration curves were constructed for the four nucleobases along with uric acid using differential pulse voltammetry (DPV). Scan rate dependence and chronoamperometric studies were also conducted for the determination of effective area, diffusion coefficient (D), catalytic standard rate constant (Ks) and heterogenous electron transfer rate constant (Kh). Interference, reproducibility and stability studies were also performed using DPV. Most importantly, the nanocomposite-modified GCE was successfully tested for simultaneous determination of G, A, T, C, and UA in real samples such as human blood serum and artificial and human saliva. All experimental data demonstrated that GCE/GO-MWCNT-CHT can serve as an excellent platform for simultaneously detecting all four DNA bases and UA with good sensitivity.

2. Materials and Methods

2.1. Materials and Reagents

Uric acid (UA), guanine (G), adenine (A), thymine (T), cytosine (C), graphene oxide (GO, 2 mg/mL, dispersion in water), chitosan (CHI), potassium ferricyanide (III), potassium ferrocyanide (II), potassium chloride, phenol: chloroform: isoamyl alcohol (24:25:1 v/v), acetic acid, hydrochloric acid, sulfuric acid, and human serum (H4522-20 mL) were all acquired from Sigma–Aldrich (Oakville, ON, Canada). Electrolyte solutions of 0.2 M phosphoric acid (Fischer Scientific, Mississauga, ON) were prepared in pH range 2.0 to 8.0 using concentrated NaOH solution for pH adjustment. Multi-walled carbon nanotubes (MWCNT, 13–18 nm) were purchased from Cheap Tubes Inc. (Cambridgeport, VT). Solutions of 1% and 1.5% (w/v) chitosan in 1% (v/v) acetic acid were prepared for electrode modification procedures. Various sizes of 3.0 µm, 1.0 µm, and 0.05 µm alumina powders were obtained from CH Instrumental Inc. (Austin, TX). A solution of 15% (w/v) zinc sulfate and acetonitrile (50/40, v/v) solution was prepared to remove protein in human serum samples. All chemicals were used without further purification and deionized water was used as for the dilutions of all solutions.

2.2. Instrumentation

To characterize the nanocomposite structure of the modified GCE, a Hitachi H-7500 transmission electron microscopy (TEM, Hitachi Ltd., Japan) and an Alpha Fourier transform infrared spectroscopy (FT-IR, Bruker Corp., Germany) were used. All electrochemical measurements were performed at room temperature using μAutolab PGSTAT 128N (EcoChemie, Utrecht, The Netherlands) potentiostat/galvanostat controlled by NOVA™ 2.1 (EcoChemie, Utrecht, The Netherlands) software. The system is a conventional three- electrode cell system where GCE/GO-MWCNT-CHT was the working electrode, a platinum wire was used as the counter electrode and a saturated silver/silver chloride electrode (sat. Ag/AgCl) was used as the reference electrode. Differential pulse voltammetry (DPV) was conducted in a potential window from 0.1 to 1.6 V at a step potential of 5 mV and a modulation amplitude of 0.025 V and modulation time of 0.05 s with an interval time of 0.5 s All electrochemical runs were repeated at least three times, unless otherwise mentioned. Measurement of pH was achieved by using a VWR SB70P pH meter. The sonication of chemical mixtures was performed by a VWR B2500A-DTH ultra-sonicator.

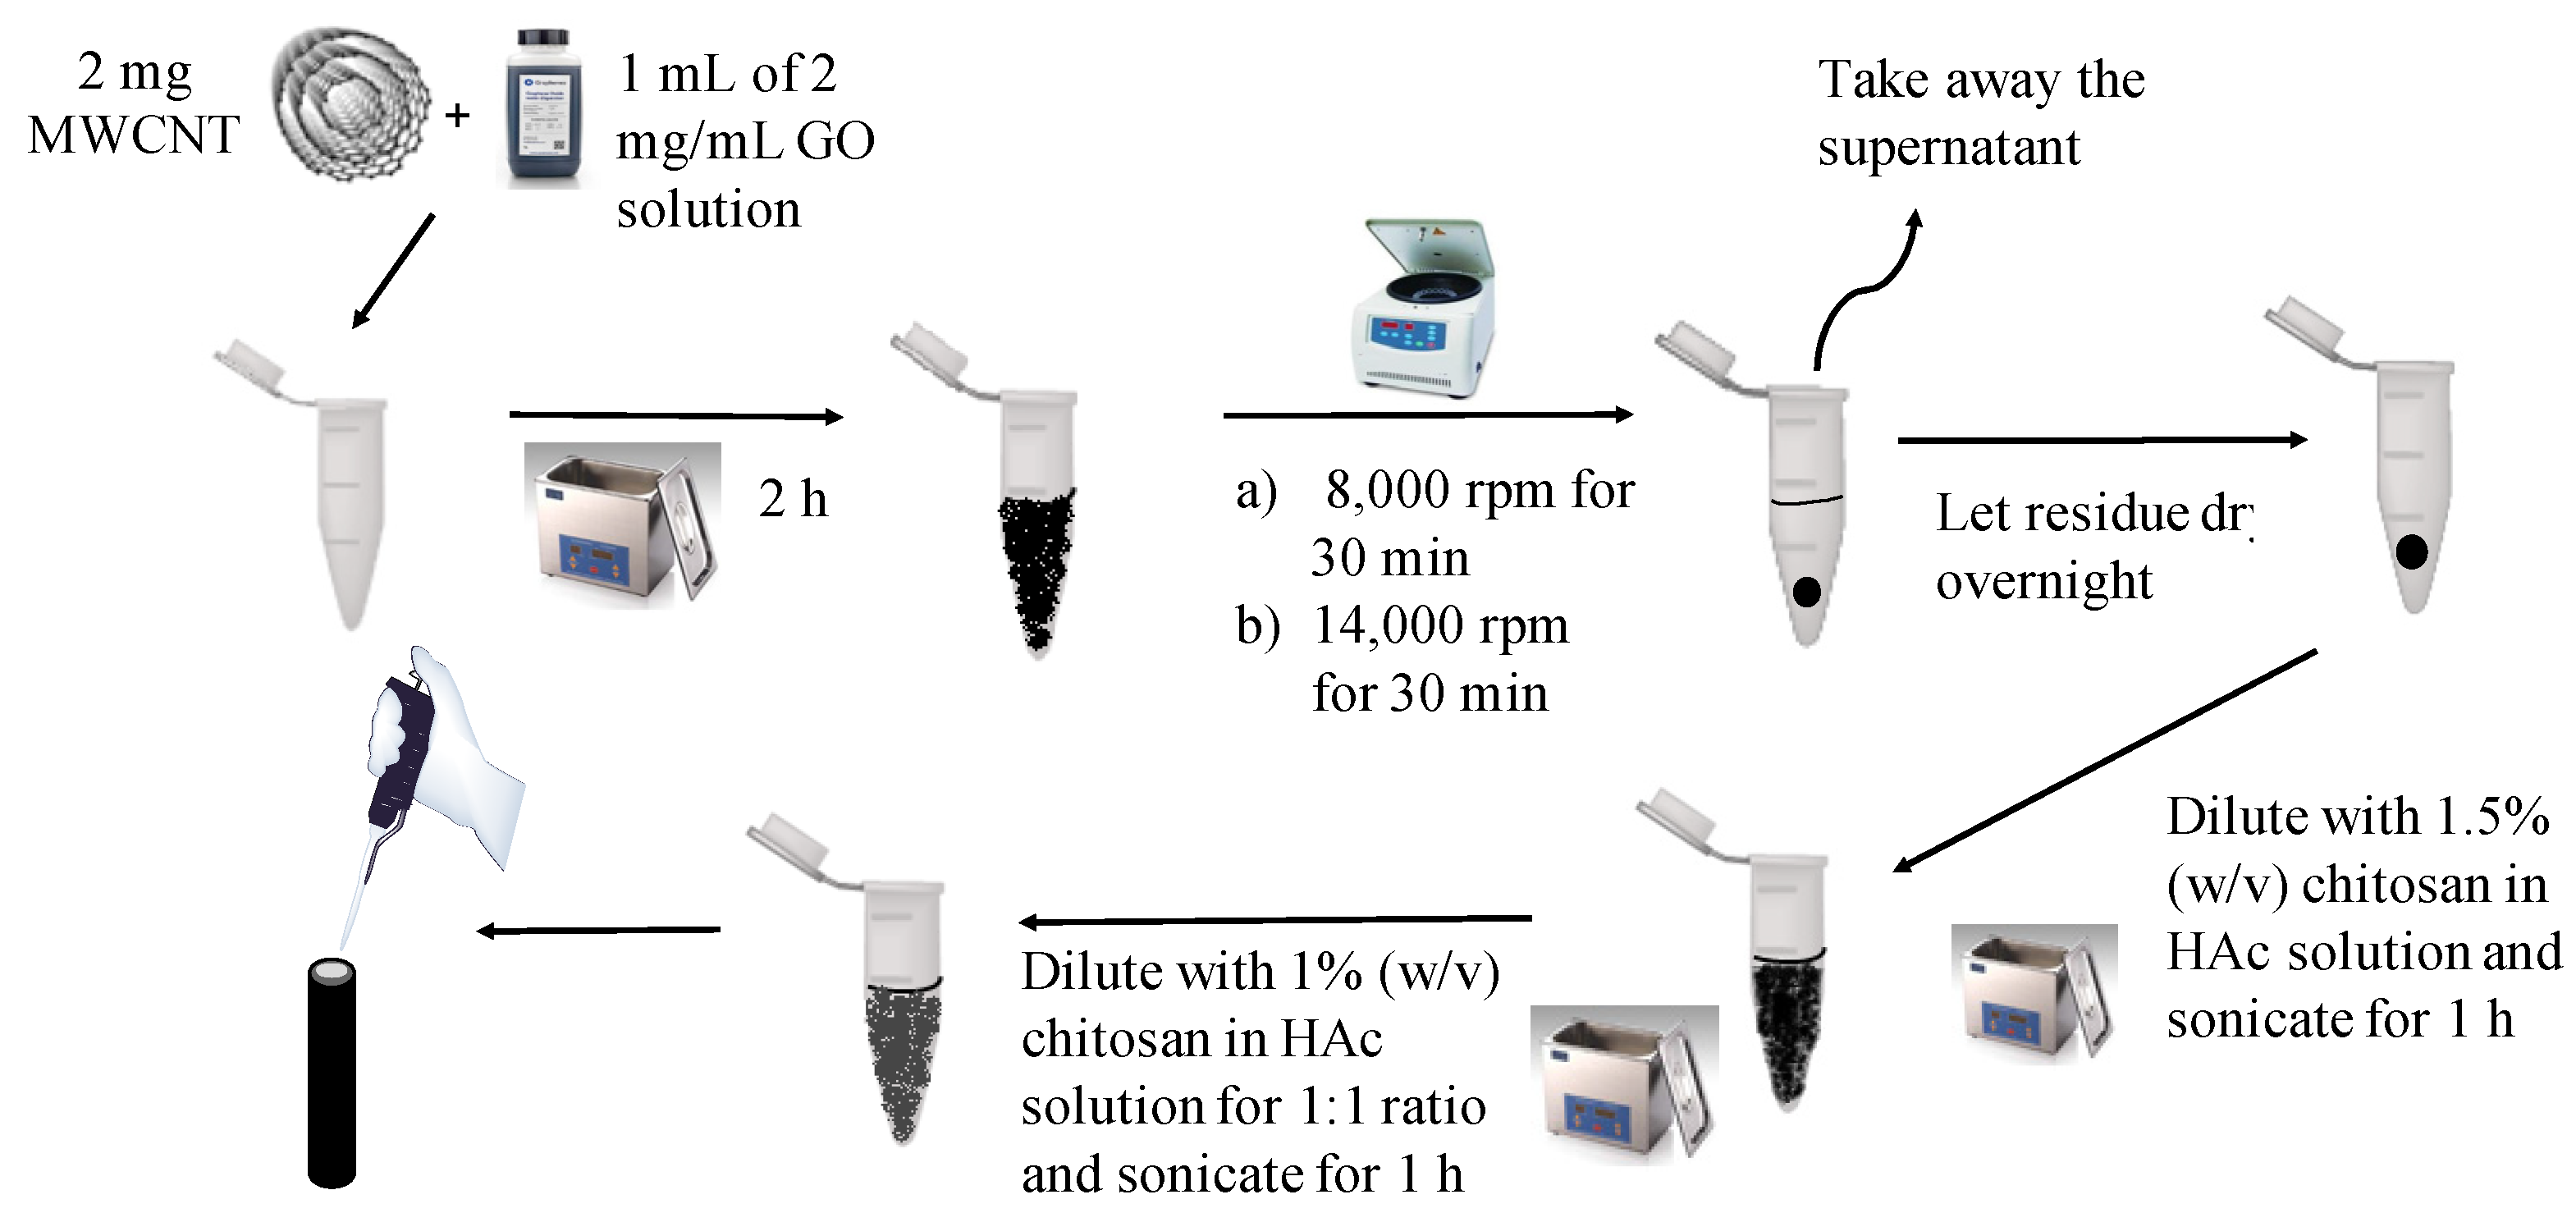
2.3. Synthesis of GO-MWCNT Hybrid in CHT

Using a method described by Veerappan et al. [26], GO-MWCNT hybrid was synthesized and dried in open tubes overnight. Then, hybrid nanocomposite (4.1 mg) was mixed with 200 μL of 1.0% (w/v) CHT in 1% acetic acid and was sonicated for 1 h. An aliquot (100 μL) of the mixture was further diluted with 100 μL of 1.5% (w/v) CHT in 1% acetic acid and was sonicated again for 1 h. A flow-chart for preparing GO-MWCNT hybrid nanocomposite in CHT is shown in Scheme 1.

2.4. Modification of GCE Surface with GO-MWCNT Hybrid Nanocomposite in CHT

A GCE (3 mm in diameter) was polished mechanically until mirror shiny with alumina powder paste in decreasing sizes from 3.0, 1.0 to 0.05 μm. It was then rinsed with deionized water followed by an ethanol rinse. The CV scanning (15 cycles) were used to activate the surface in 0.5 M H2SO4 solution with potential ranging from −1.5 V to 1.5 V at scan rate of 100 mV/s. Next, 5 µL of prepared GO-MWCNT hybrid nanocomposite in CHT was drop-cast on the surface of the activated GCE and was left to drying. The nanocomposite-modified GCE was polished electrochemically by running 10 cycles of CV in 0.2 M PBS (pH 7.0) from -0.4 V to 1.6 V at 100 mV/s.

2.5. Spiked Human Serum Sample Preparation (10x dilution)

All experimental studies on human serum samples were performed following the ethical guidelines of the University of Toronto. To prepare the human blood serum samples, the method described by Suh et al. [29] was used to precipitate out the protein in human serum sample. Briefly, 1 mL human serum was mixed in a solution of 0.9 mL 15% (w/v) zinc sulfate and acetonitrile (50/40, v/v). This mixture was then put in ice and vortexed for 20 min. After centrifuging for 5 min at 14,000 rpm for 10 min under room temperature, 0.9 mL supernatant was withdrawn and was diluted with 3.6 mL phosphate buffer solution (0.2 M). Drops of concentrated NaOH solution were added to neutralize the pH of the solution. An aliquot (3 mL) of supernatant was transferred into the cell after another centrifuge cycle. Each standard solution of G (0.0025 M), A (0.0025 M), T (0.005 M) and C (0.005 M) was prepared and gradually spiked into the processed diluted human serum sample. DPV was performed from −1.5 V to +1.5 V at 100 V/s with a step of 0.005 V and an amplitude of 0.025 V.

2.6. Spiked Human Saliva Sample and Artificial Saliva Sample Preparation (5x dilution)

All experimental studies on human saliva samples were performed following the ethical guidelines of the University of Toronto. Saliva samples were collected freshly from a healthy female volunteer and was put into ice bath prior to use. An aliquot (400 μL) of human saliva was then mixed with 1600 μL of phosphate buffer solution (pH 7.0) to serve as electrolyte solution. The same set of four standard nucleobase solutions was then used to spike the diluted human saliva solution. For the preparation of artificial saliva samples, a method described by Madsen et al. [30] was followed. An aliquot (20 mL) of artificial saliva solution (2.5 mM NaHCO3, 7.4 mM NaCl, 10 mM KCl, 2 mM CaCl2·2H2O, 6.4 mM NaH2PO4·2H2O in deionized water) was prepared [30]. Similarly, to the procedure described for human saliva samples, artificial samples were first diluted and then spiked with the standard solutions of four nucleobases for electrochemical measurements.

3. Results and Discussion

3.1. Characterization of GO-MWCNT Hybrid Nanocomposite in CHT
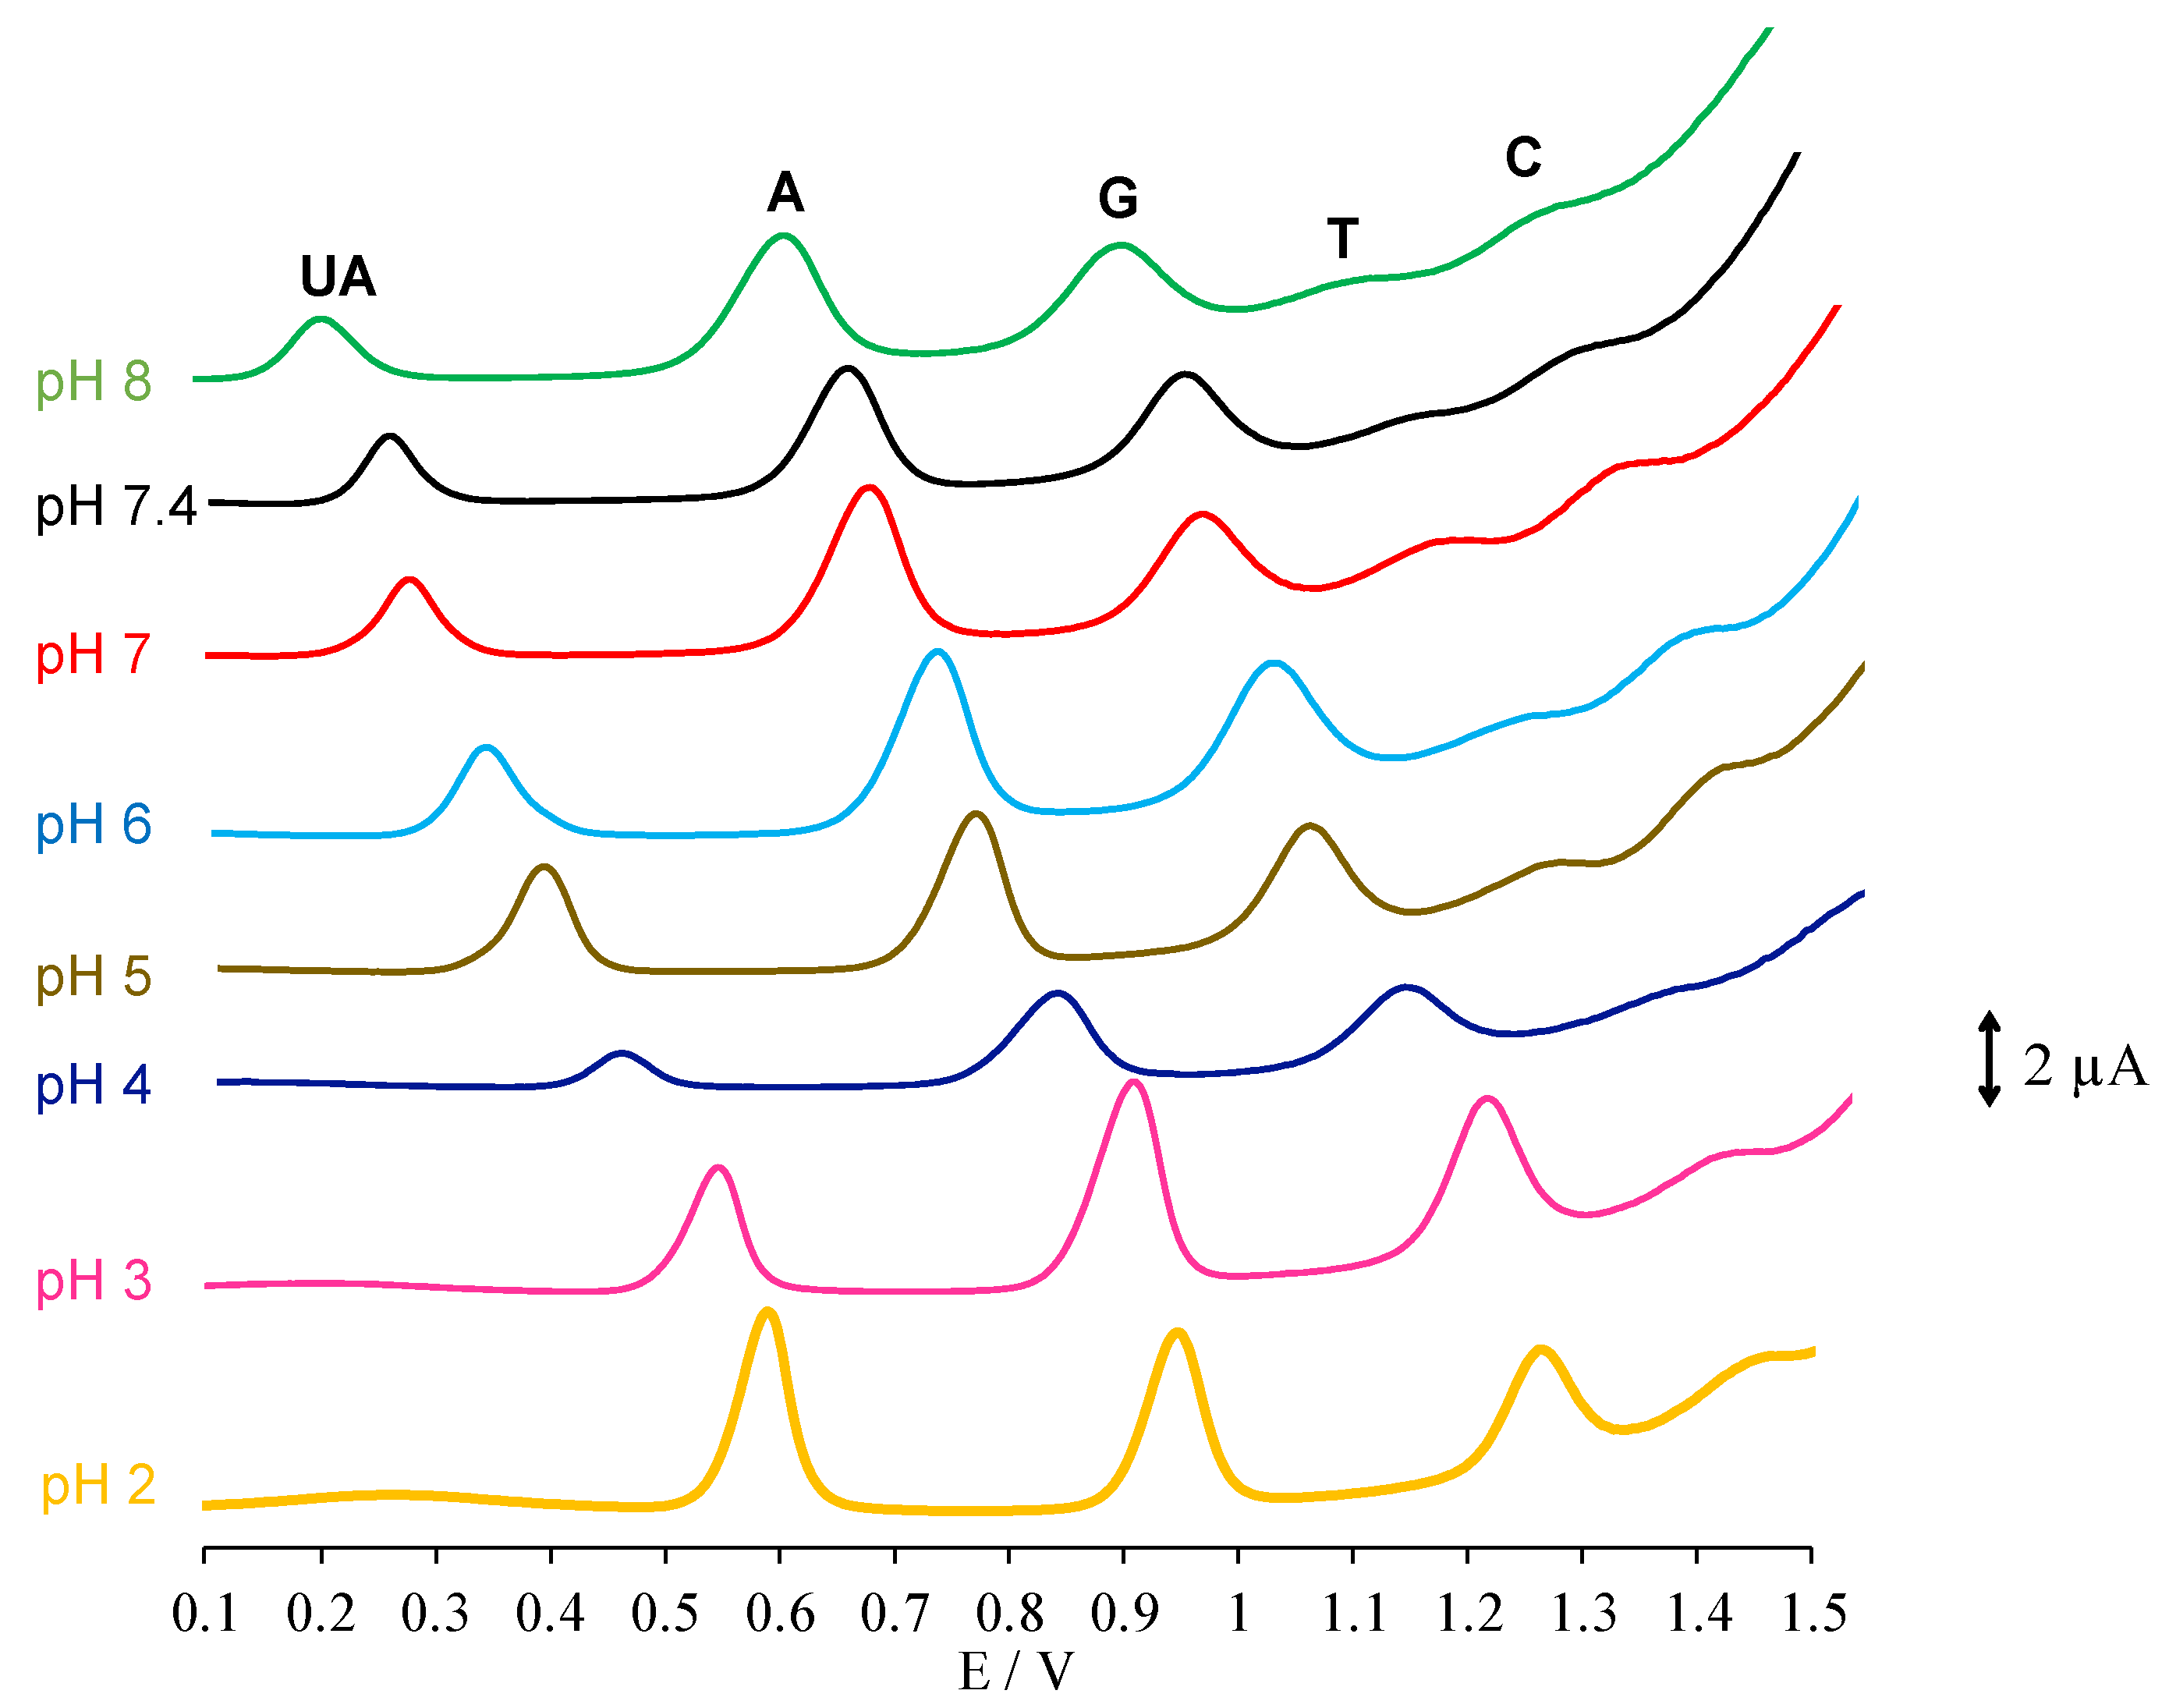
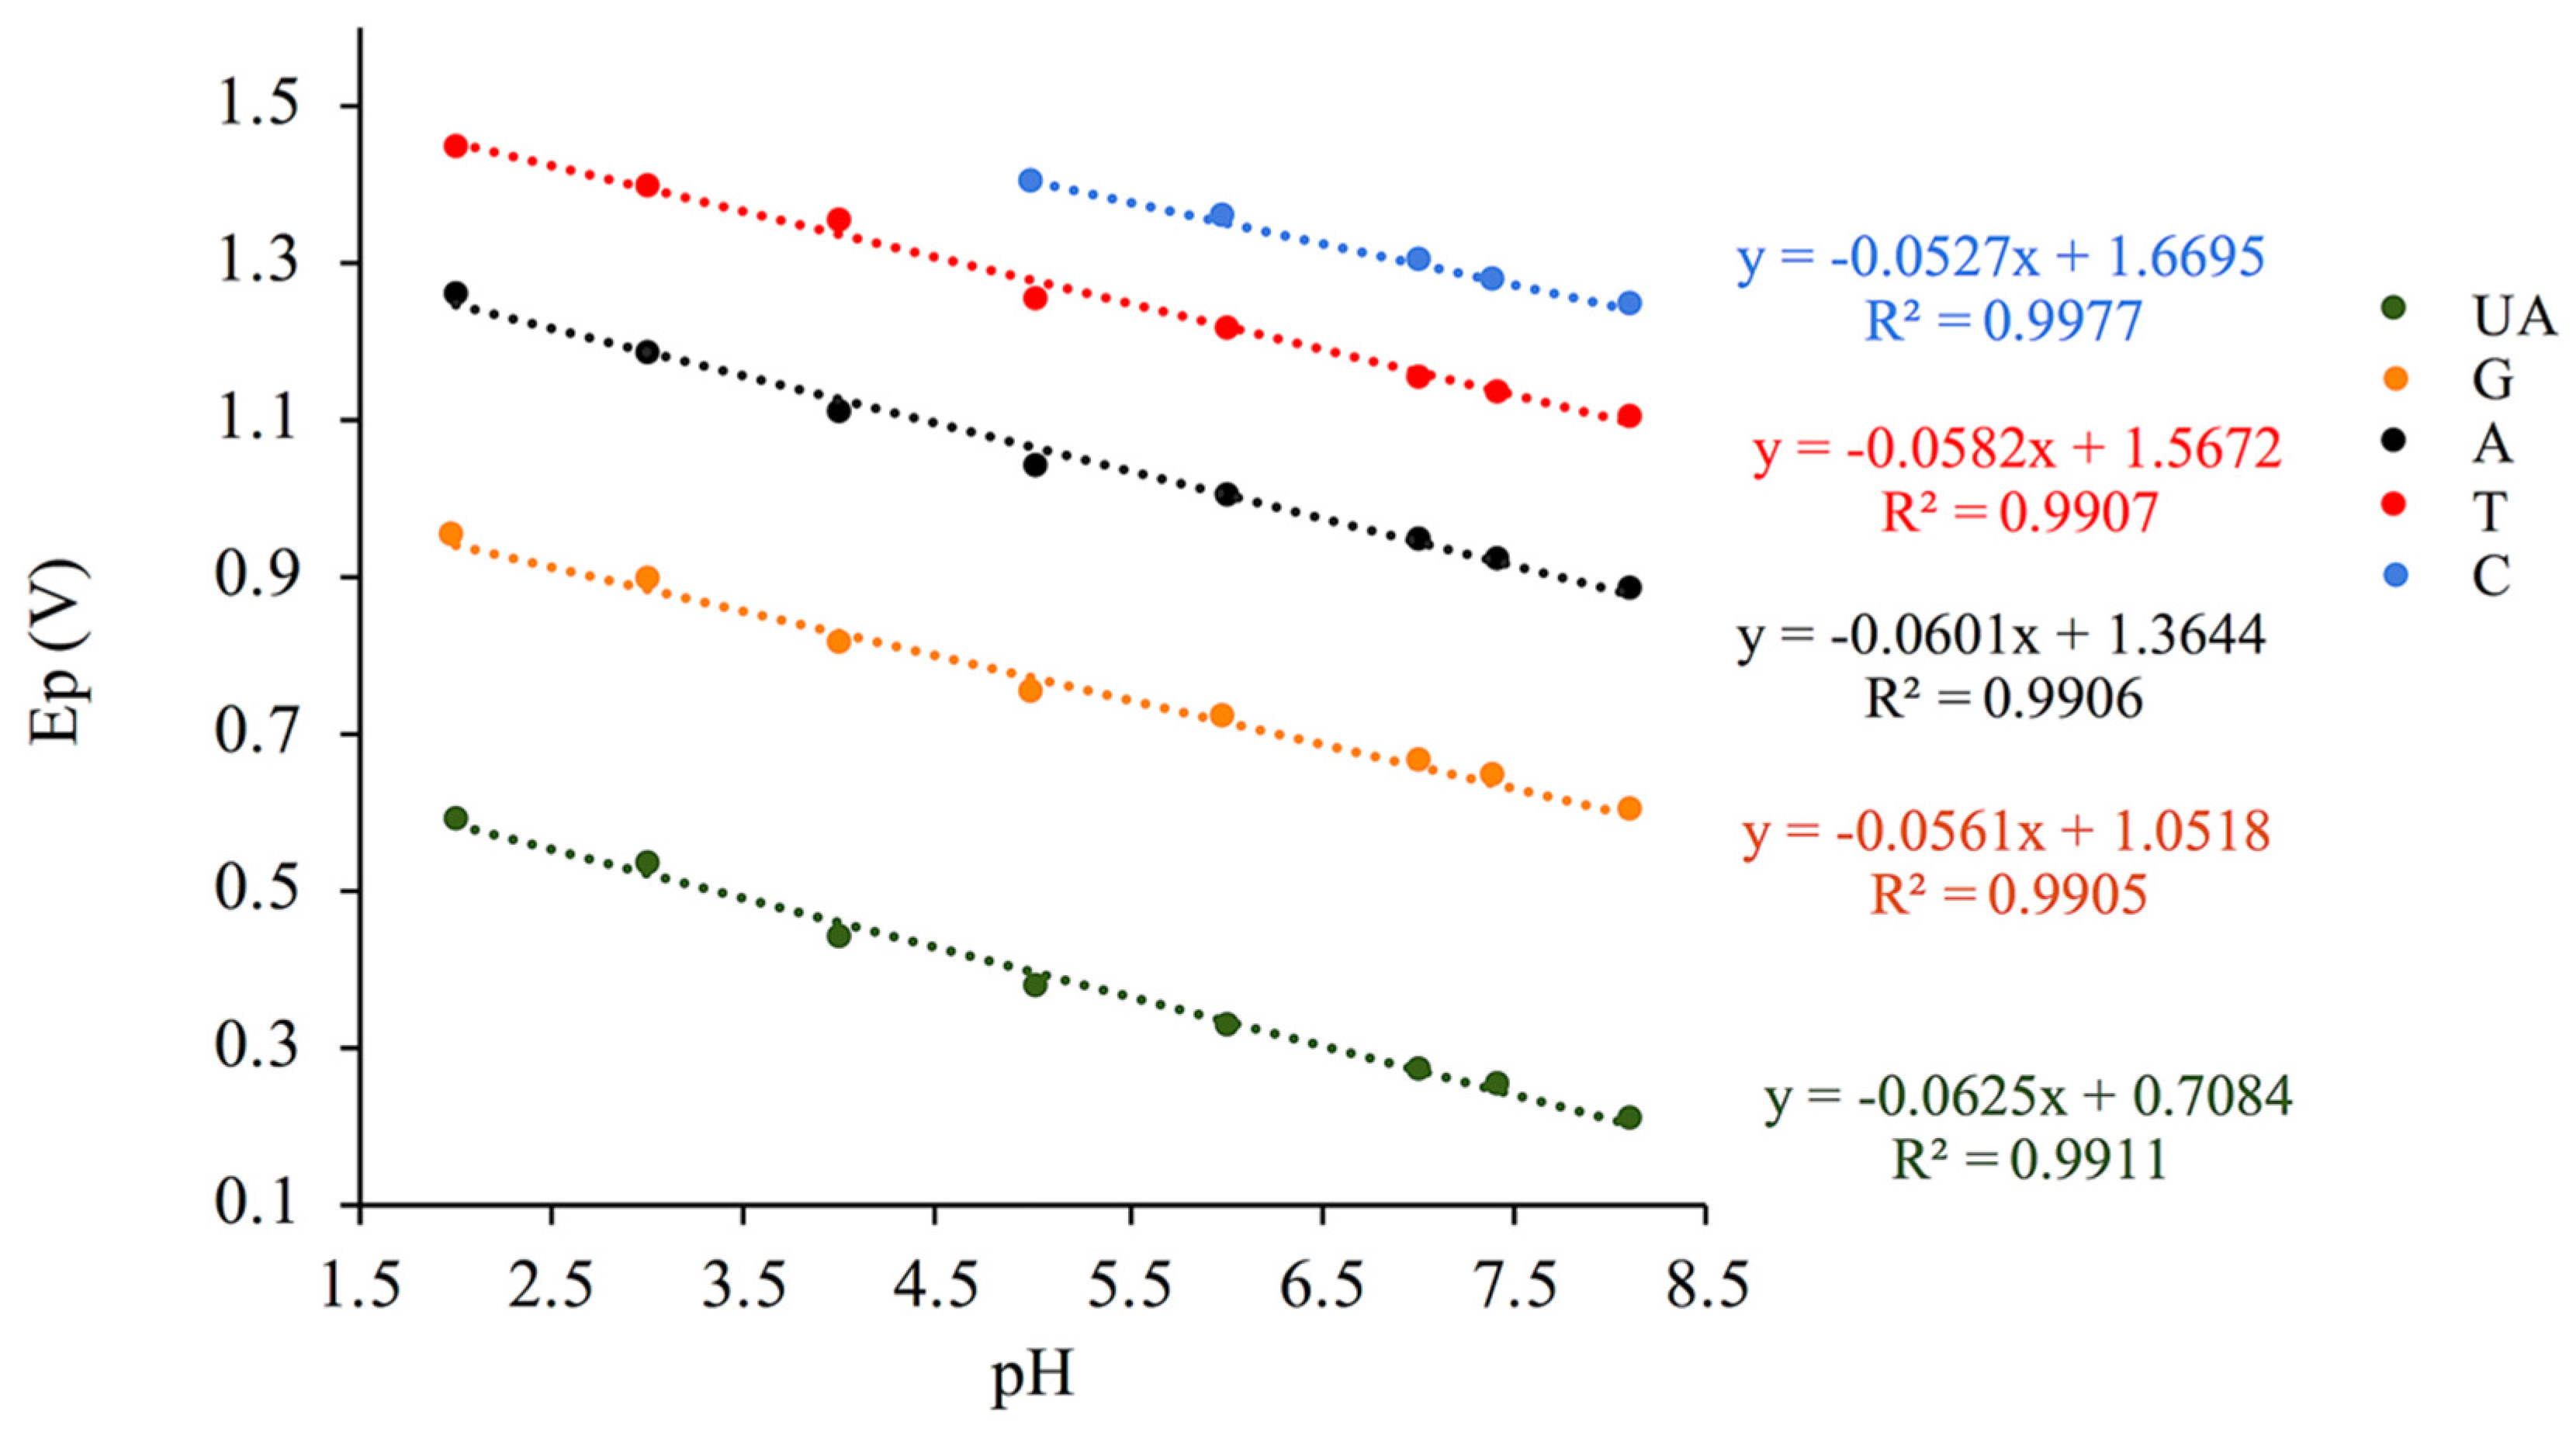
Surface morphology of the nanocomposite-modified GCE was investigated using transmission electron microscopy (TEM). As shown in Figure 1A, the hybrid nanocomposite formed a largely entangled complex, which potentially provided lots of active sites for electrochemical reactions. Thin sheets of GO and a large amount of MWCNTs twisting around pores of the complex were observed clearly in Figure 1B. With this rough surface and many highly conductive components, the surface of nanocomposite-modified GCE had the promising potential to promote electrochemical kinetics of analytes with an enhanced electron transfer efficiency.
Nanocomposite structure was also investigated using FT-IR. As shown in Figure 2, FT-IR of CHT had several characteristic peaks for -NH2 stretch at ~ 3400 cm−1, -OH stretch at ~3200 cm−1, sp3 C-H stretch at ~2900 cm−1, C=O stretch at ~1700 cm−1, N-H bend at ~1400 cm−1 and C-O stretch at ~1000 cm−1. FT-IR spectrum for GO has a very broad and intense peak for -OH stretch at ~3200 cm−1, which was expected. Peaks that were attributed to C=O stretch at ~1700 cm−1, C=C stretch at ~1600 cm−1, C-OH stretch at ~1350 cm−1 and C-O-C stretch at ~1200 cm−1 were also observed. No obvious transmittance peaks were observed for MWCNTs, which was expected as described in literature [26]. FT-IR spectrum for GO-MWCNT hybrid nanocomposite in CHT had all the characteristic peaks of CHT and GO but with reduced intensity. This result confirmed that hybrid nanocomposite in CHT was successfully synthesized.

3.2. pH Effect

Using GCE/GO-MWCNT-CHT, the pH effect of electrochemical detection of the four DNA bases along with UA was investigated using DPV. As depicted in Figure 3, anodic current peaks for five analytes all appeared with pH ranging from 5.0 to 8.0. Indeed, with an increase in pH, analyte peaks shifted towards lower oxidation potentials, which indicated involvement of protons in electrochemical oxidation reactions for each analyte. As shown in Figure 3, under acidic conditions (pH 4.0 and lower), the oxidation peaks for pyrimidine compounds disappeared due to masking of background electrolyte current as a result of oxygen evolution. Optimal pH was determined to be pH 7.0, where an excellent agreement could be reached for relatively low analyte oxidation potentials and high current intensities. All oxidation peaks for the analytes were well distinguished and separated under this physiological pH which also brought convenience for real sample measurements. The linear relationships between pH and oxidation potentials (Ep) were analyzed as shown in Figure 4. The regression equations extrapolated from Figure 4 are summarized in Table 1. The slopes for plots of Ep vs. pH were 62.5, 56.1, 60.1, 58.2, and 52.7 mV/pH for UA, G, A, T and C, respectively. All these values were close to the Nernstian theoretical value of 59.1 mV/pH which indicated that there was an equal number of protons and electrons exchanged for each analyte in the electrochemical oxidation mechanisms [31]. These experimental results matched with previous literature records [11,22,28,31,32,33,34]. As shown in the reaction scheme (1)–(3) and (5) of Scheme 2, two protons and two electrons were postulated to be involved in rate determining steps of electrochemical oxidations of UA G, A, and C [11,22,31,32,34]. While for oxidation of T, only one electron and one proton were involved (reaction scheme (4), Scheme 2) [35].

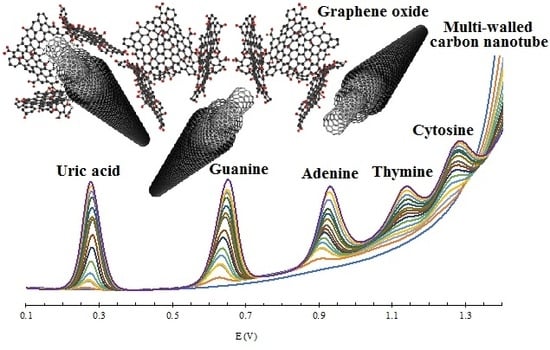
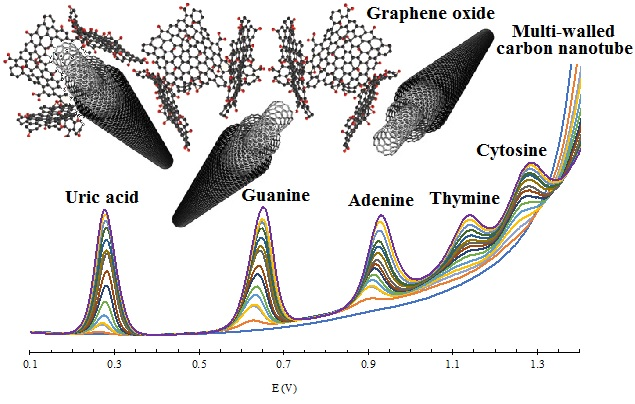
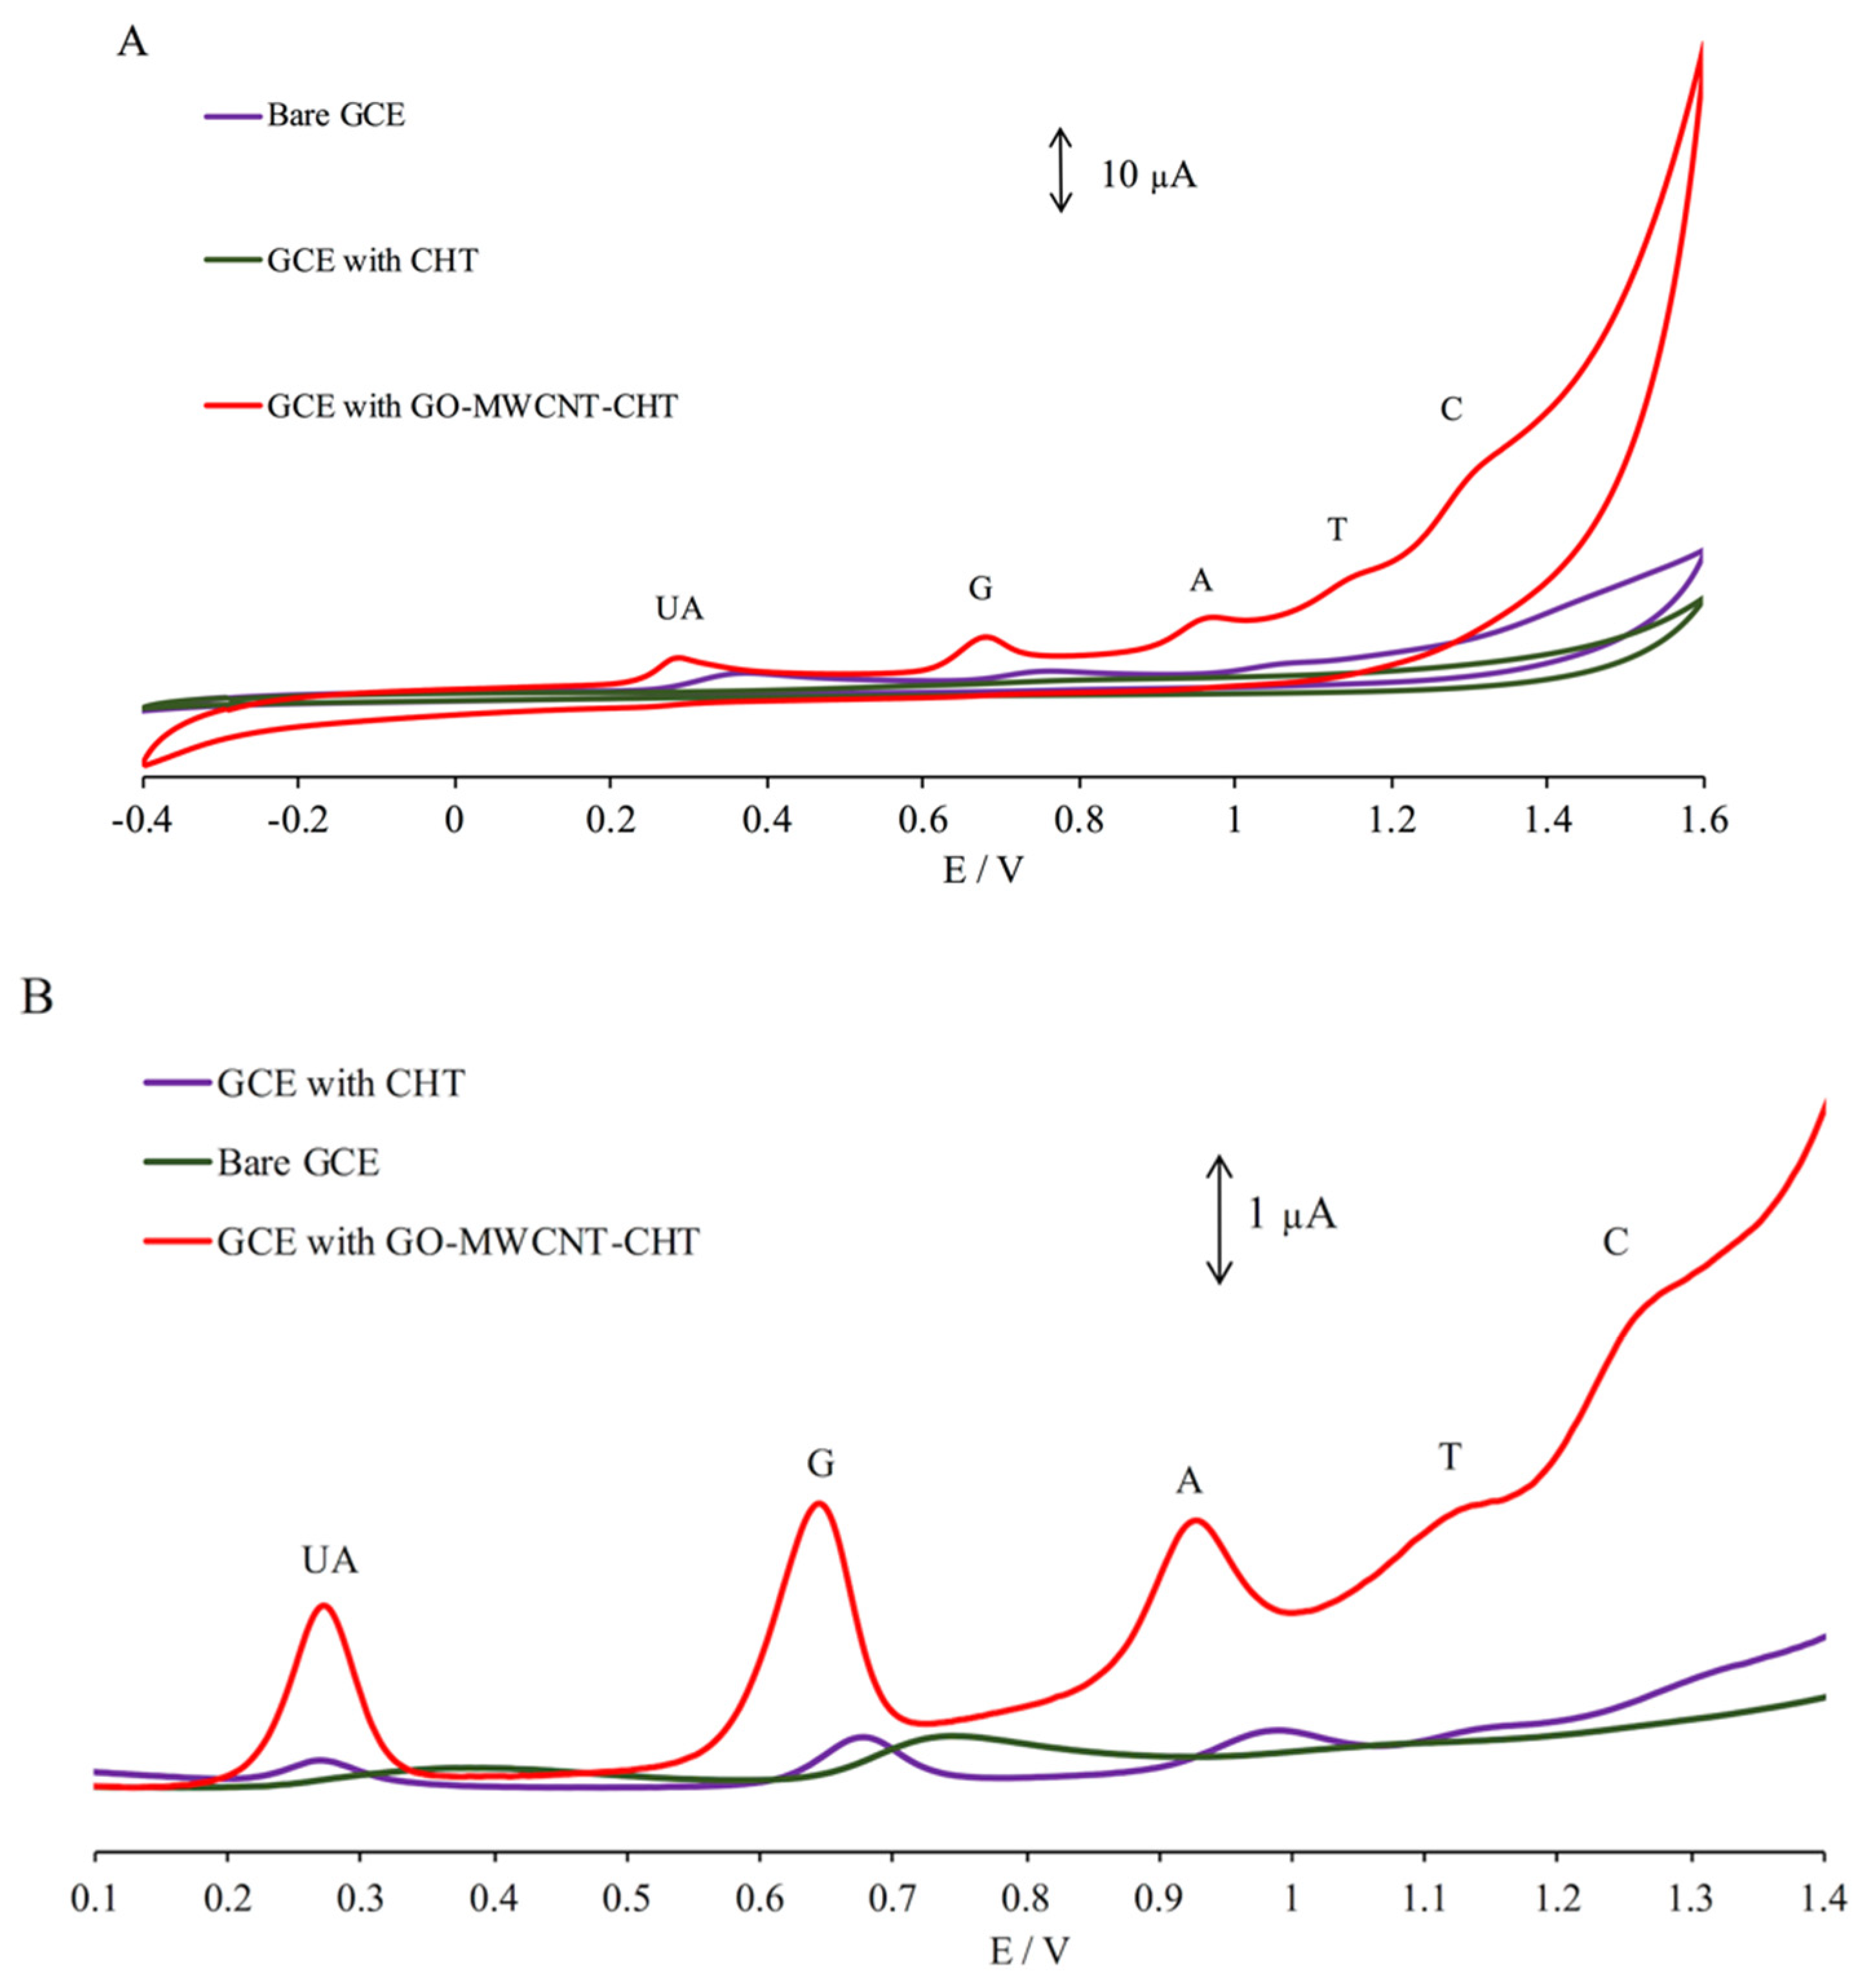
3.3. Electrochemical Behavior of UA and Nucleobases

A comparison study was completed in order to demonstrate that the nanocomposite-modified sensor is able to significantly enhance the electrocatalytic activity. The CV and DPV voltammograms for the simultaneous determination of four DNA bases along with UA as an internal standard using bare GCE, GCE modified with 1% chitosan (GCE/CHT) and the nanocomposite-modified GCE (GCE/GO-MWCNT-CHT) are shown in the Figure 5. In the CV study, there were no significant current peaks observed when using the GCE-CHT, whereas only UA, G, and A were detected using bare GCE with low current peaks at 0.37, 0.77, and 1.07 V, respectively. The GCE/GO-MWCNT-CHT enabled the simultaneous detection of all five analytes with relatively high current peaks. The electrochemical oxidation of all five analytes were irreversible on GCE/GO-MWCNT-CHT as only the anodic peaks were detected at 0.31, 0.69, 0.97, 1.15, and 1.30 V for UA, G, A, T, and C, respectively. Similarly, using DPV, the GCE-GO-MWCNT displayed a more sensitive response to the simultaneous detection of all analytes. The peaks were well-separated and well- distinguishable at 0.28, 0.65, 0.93, 1.13, and 1.27 V for UA, G, A, T, and C, respectively. The DPV of GCE-CHT demonstrated two broad peaks with significantly low current peaks which could not be identified. Based on these CV and DPV results, GCE/GO-MWCNT-CHT was shown to have better overall analytical performance for the simultaneous detection of the four DNA bases along with UA in comparison with control electrodes, bare GCE, and GCE/CHT.

3.4. Simultaneous Electrochemical Detection of Nucleobases in Presence of UA

Individual detections of each four DNA bases were also investigated using DPV. As shown in Figure 6, the peaks were observed around 0.65, 0.93, 1.13, 1.27 V for G (blue), A (brown), T (black), and C (purple), respectively. The overlay in Figure 6 of the individual detections with the simultaneous detection (red) of all four bases demonstrated that there were no significant fluctuations in current response or peak potential when comparing the individual detections (blue, brown, black, and purple lines) with the simultaneous detection (red).
To build calibration curves, the simultaneous detection of UA and DNA nucleobases using GCE/GO-MWCNT-CHT were investigated using DPV. As all analytes solutions were added into the buffer solution, the intensity of current peaks (Ip) increased with linear dependence on concentration. Therefore, a set of calibration curves were constructed as shown in Figure 7. Excellent linear dependence was observed between Ip and concentrations for each analyte as illustrated in Figure 8. As shown in Figure 8, two linear segments were obtained for UA, G, and A [28,36]. Linear ranges for detecting UA were from 1 µM to 31 µM with calibration Equation (1) and from 31 µM to 151 µM with calibration Equation (2). Similarly, linear responses for G were from 2 µM to 13 µM with calibration Equation (3) and from 13 µM to 78 µM with calibration Equation (4). The linear ranges for A were from 2 µM to 19.5 µM with calibration Equation (5) and from 14.5 µM to 79.5 µM with calibration Equation (6). For T and C, the linear ranges were from 12.5 to 227.5µM and from 5 to 162.5 µM, respectively. Calibration equations for T and C are Equations (7) and (8), respectively. LODs were calculated using 3Sb/m, where LOD is the detection limit, Sb represents the standard deviation of the blank signal, and m represents slope from calibration curves [32,36]. The LODs were determined as 0.12, 0.11, 0.43, 1.71, and 0.80 µM for UA, G, A, T, and C, respectively. In comparison with the other electrochemical ones reported in the literature, this nanocomposite-modified sensor had a promising performance for detecting all four nucleobases in the presence of UA simultaneously, as it demonstrates a low LOD and a wide linear range for each analyte as shown in Table 2 [5,32,33,37,38,39,40,41,42]. The performance between classical chromatography methods and our proposed electrochemical method were compared in Table S2. The proposed modified electrode had the capacity to provide satisfactory recovery results and limit of detection in comparison to classical methods in literature in only 4 min [43,44,45].
ΔIp1 (UA) = 0.084 [UA] + 0.0327    (R² = 0.9903)
ΔIp2 (UA) = 0.0162 [UA] + 2.1299   (R² = 0.9828)
ΔIp1 (G) = 0.208 [G] + 0.4042      (R² = 0.9861)
ΔIp2 (G) = 0.0242 [G] + 2.7964      (R² = 0.9878)
ΔIp1 (A) = 0.0928 [A] + 0.6759      (R² = 0.9800)
ΔIp2 (A) = 0.0291 [A] + 1.898      (R² = 0.9811)
ΔIp (T) = 0.0068 [T] + 0.4826      (R² = 0.9849)
ΔIp (C) = 0.0174 [C] + 0.2899      (R² = 0.9804)

3.5. Interference, Stability, and Reproducibility

A series of interference studies were conducted by increasing the concentration of one analyte while keeping the others at a constant concentration for several measurements (n = 10). For instance, as shown in Figure S1I), the current peaks for the electrochemical oxidation of UA increased in a linear fashion with increasing concentrations, while the anodic current for all other four analytes (DNA bases) remained at similar levels without significant variation (± 5%). The same behaviors were observed when varying concentrations of G, A, T, and C as demonstrated in Figure S1. These interference studies are critical when developing a simultaneous sensor platform, because increasing the concentration of one analyte should not have a significant effect on the others. [46] These results demonstrated that there was no significant interference among the analytes and that simultaneous detection of all five analytes was possible using the nanocomposite-modified sensor. Furthermore, reproducibility of our sensor was investigated by evaluating peak current variation of measurements in 0.2 M PBS (pH 7.0) at 30, 57.5, 12.5, 147.5 and 97.5 μM of UA, G, A, T, and C, respectively. The relative standard deviation for successive measurements (n=10) using GCE/GO-MWCNT-CHT were 2.37%, 1.87%, 1.40%, 0.82%, and 0.97% for UA, G, A, T, and C, respectively. These results demonstrated the promising reproducibility of our sensor. Finally, the stability of the sensor was tested for a duration of 14 days. As shown in Figure S2, the results were statistically similar, and the sensor was able to generate repeatable measurements after the 2-week storage period at room temperature.

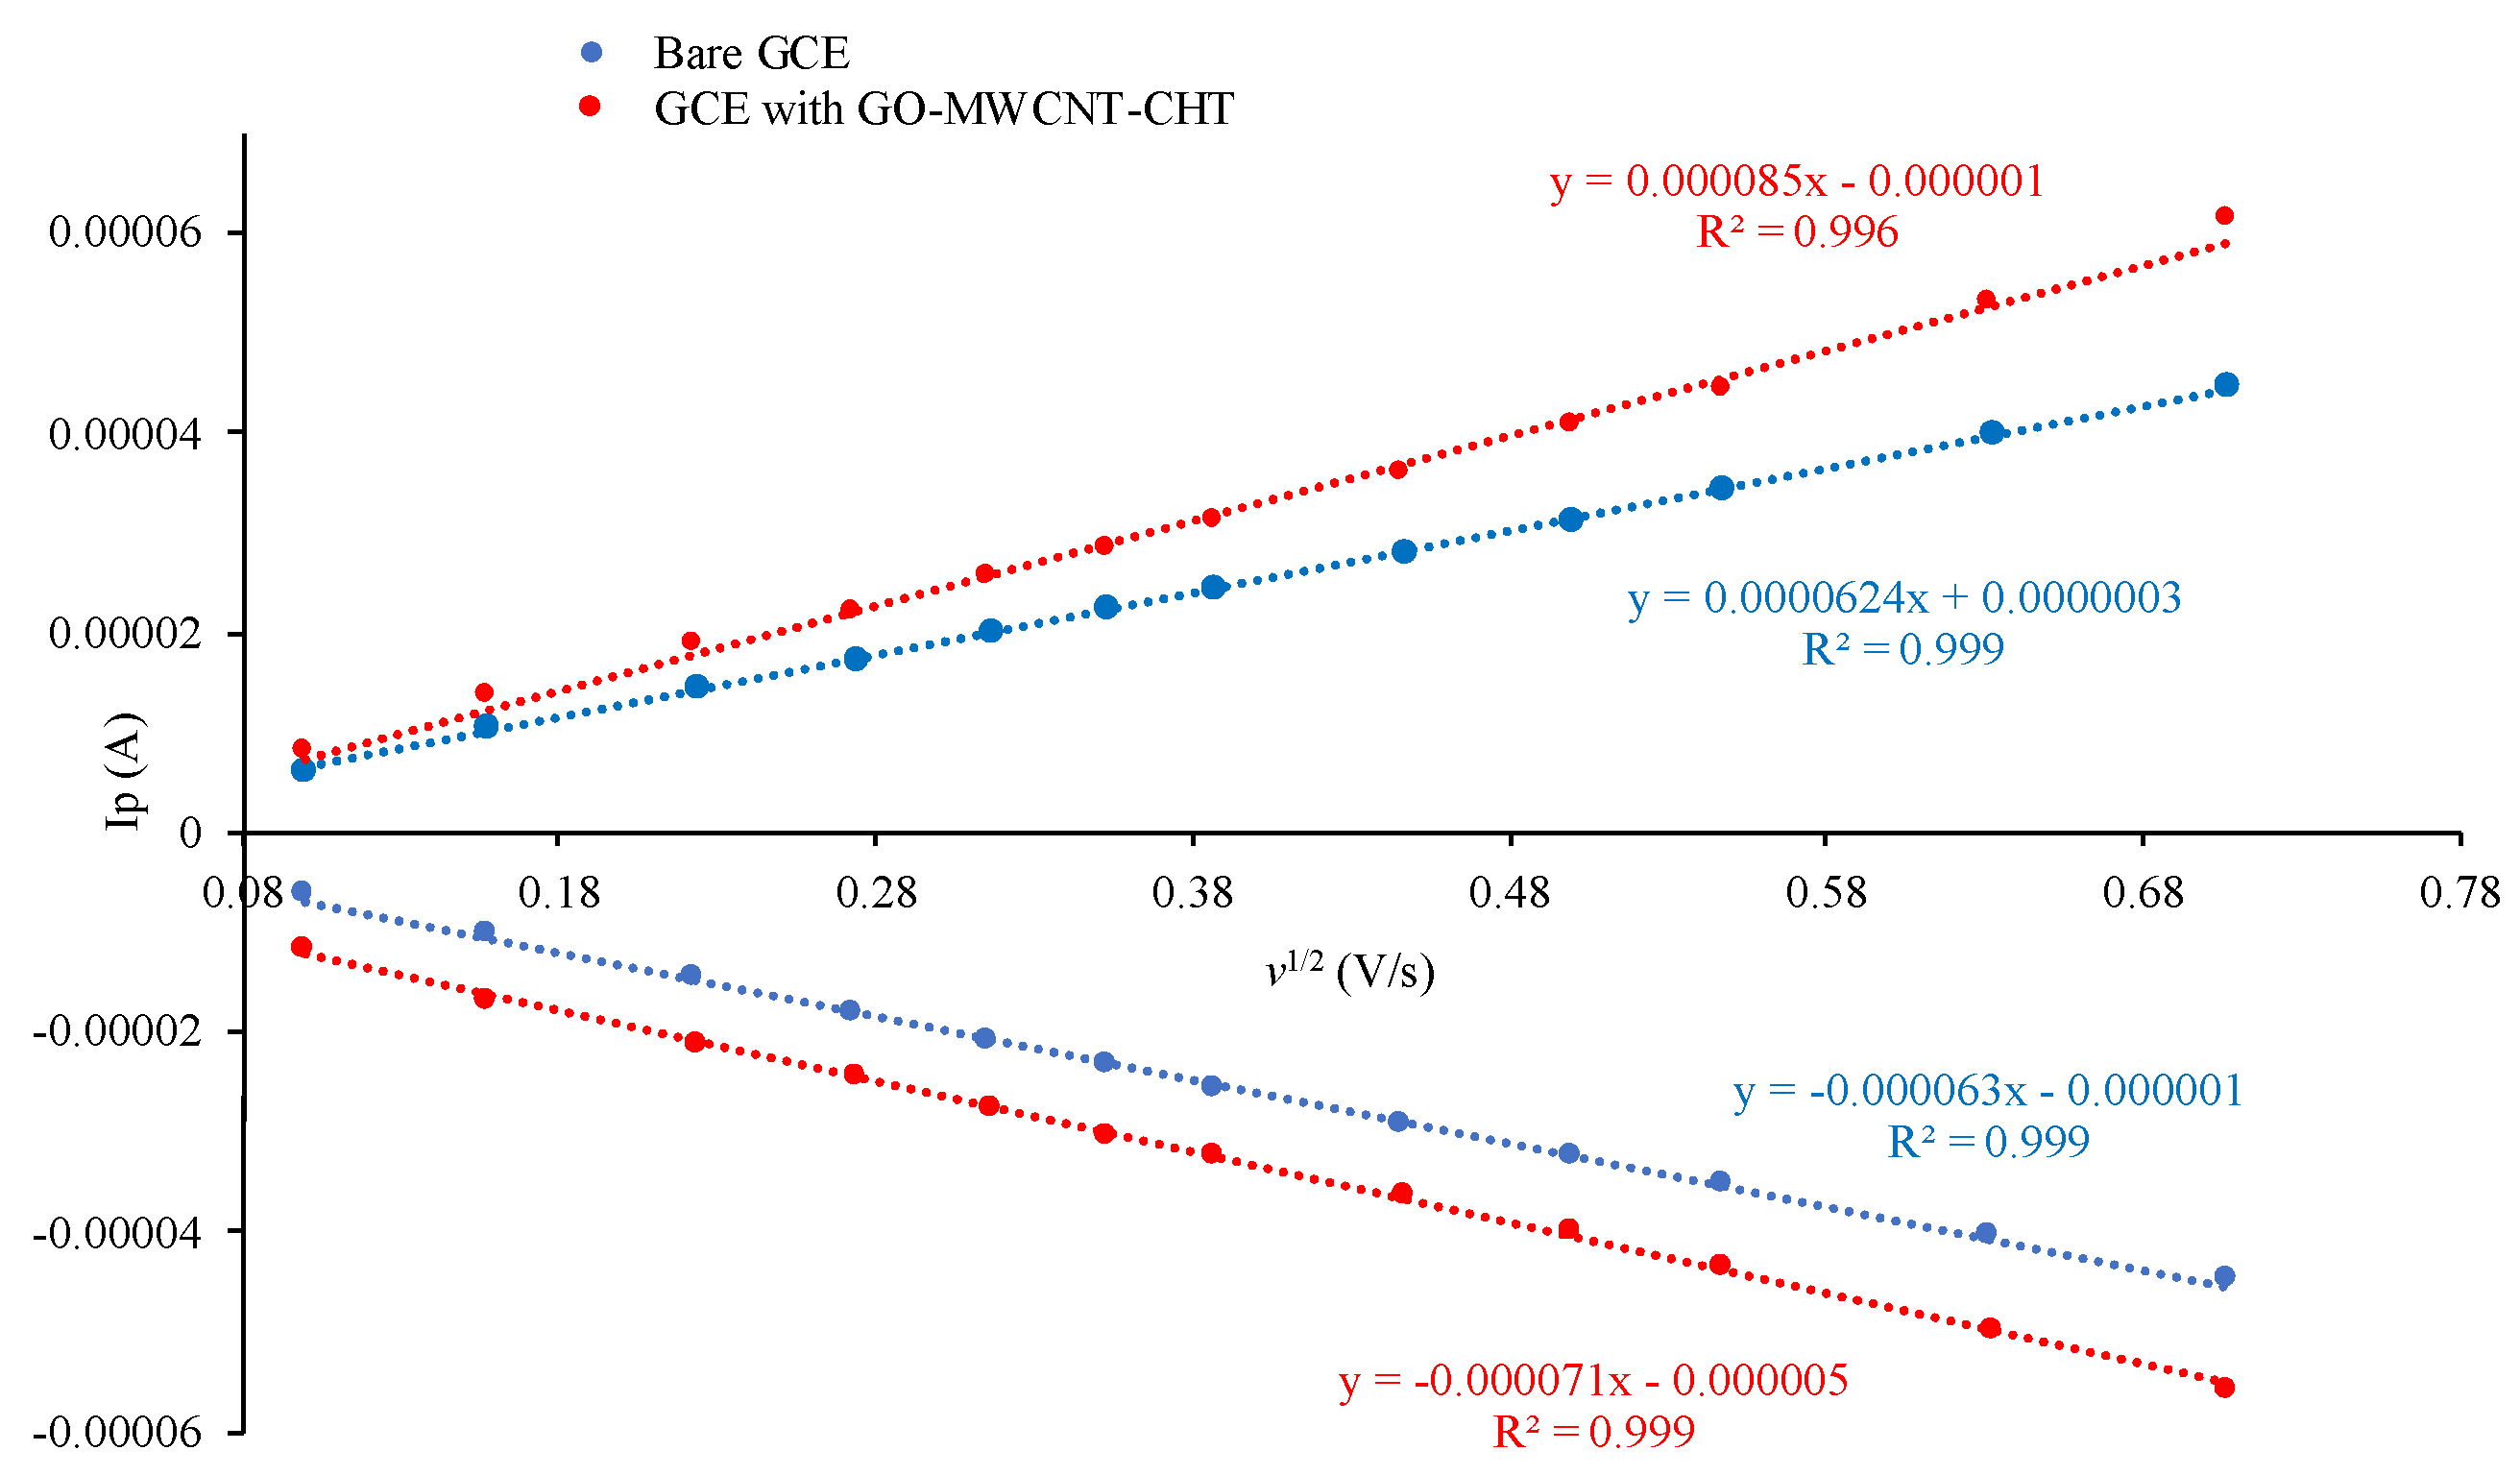
3.6. Scan Rate Dependence

The CV was performed at different scan rates to assess the effective surface areas of bare GCE and GCE/GO-MWCNT-CHT in a solution of 1 mM potassium ferrocyanide (K3Fe(CN)6). The effective areas were calculated using the Randles–Sevcik equation (9) below:
ip = 2.69 ×10⁵ n3/2 A C0 D 1/2 v1/2
where ip is the measured analyte current, n is the electron transfer number for oxidation of K3Fe(CN)6 (equal to 1), C0 equals to 10−6 mol/cm3 for the concentration of K3Fe(CN)6, and D is 7.6 × 10⁻⁶ cm∙s−1 for diffusion coefficient in this process [47]. As shown in Figure 9, both electrodes had excellent linearity between the anodic current and the square root of scan rate. This suggested electrochemical oxidations of all analytes were diffusion-controlled processes using the ferrocyanide probe. Diffusion-controlled processes can be advantageous since they can be a factor to reduce the effect of surface fouling that results from the adsorption of molecules on the electrode surface [8,21]. Slopes of Ip vs. v1/2 were 0.000062 and 0.000085 A∙s/V for bare GCE and GCE/MWCNT-GO-CHT, respectively. Based on Equation (9), effective areas were calculated as 0.0842 and 0.115 cm2 for bare GCE and GCE/MWCNT-GO-CHT, respectively. Therefore, the nanocomposite-modified electrode had a 36.6% larger redox-active surface area which considerably facilitated the electrocatalytic kinetics of analytes.

3.7. Chronoamperometry

To determine the diffusion coefficient (D) of each analyte as well as the standard kinetic rate constant (Ks) and heterogeneous kinetic rate constant (Kh) of electron transfer reactions, chronoamperometric studies were conducted. An example of the chronoamperograms obtained from these studies for analysis of A using GCE/GO-MWCNT-CHT is shown in Figure 10. All other figures of chronoamperometric studies for the detection of UA, G, T and C are displayed in Figures S3–S6, respectively. D of each analyte using GCE/ GO-MWCNT-CHT was calculated using Cottrell Equation (10) [36]:
i   = nFAC D π t
where i is current in A, n is number of electrons transferred in electrochemical oxidation process, C is the concentration of the analyte, F is Faraday constant (96485 C/mol), D is diffusion coefficient, and t is time in s [36].
At GCE/GO-MWCNT-CHT surfaces, D was calculated as 1.27 × 10⁻⁶, 6.91 × 10⁻⁵, 7.40 × 10⁻⁶, 4.57 × 10⁻⁴ and 1.49 × 10⁻⁵ cm2 s−1 for UA, G, A, T, and C, respectively.
In addition, Kh was calculated by plotting the ic/iL in function of the square root of time (Figures S7–S11). The Kh values were calculated by using the slopes obtained from these graph following the equation (11) [47]:
i c i L   =   π 1 2 ( K h C h t ) 1 / 2
where ic is the catalytic current, iL is the limiting current with no analyte, Ch is the concentration of analyte in electrolyte, and t is time in s [46]. The Kh values were determined as 1.45 × 10³ M−1s−1, 3.31 × 10⁴ M−1s−1, 7.24 × 10⁴ M−1s−1, 1.39 × 10² M−1s−1and 1.11× 10² M−1s−1 for UA, G, A, T, and C, respectively.
The Ks value of each analyte was also determined using the Velasco equation [48]:
K s = 1.11 D 0 1 2 ( E p E p 1 / 2 ) 1 2 v 1 / 2
where Ep is oxidation potential, Ep1/2 is the half-wave oxidation potential, and D0 is the diffusion coefficient [49]. As shown in Table S1, Ks values were determined as 2.00 × 10⁻³, 4.58 × 10⁻³, 1.16 × 10⁻³, 1.12 × 10⁻², and 2.61 × 10⁻³ cm s−1 for UA, G, A, T, and C, respectively. Assuming D0 to be 2.00 × 10⁻⁶ mol2 s1 for bare GCE, Ks values were also calculated as 1.90 × 10⁻³, 1.83 × 10⁻³, 8.46 × 10⁻⁴, 6.87 × 10⁻⁴ and 8.26 × 10⁻⁶ cm s−1 for UA, G, A, T and C, respectively. When comparing both bare and modified electrodes, GCE/GO-MWCNT-CHT had a larger Ks for G, A, T, and C which indicated more improved electron transfer kinetics at the surface of the nanocomposite-modified GCE.

3.8. Real Samples

To investigate the application of the nanocomposite-modified sensor in real samples, simultaneous detection of four DNA bases was performed in complex matrices such as saliva and human blood serum. To achieve these measurements the standard addition technique was used. As shown in Figure S12 to S14, standard solutions of G (0.0025 M), A (0.0025 M), T (0.005 M), and C (0.005 M) were used to spike the diluted human serum and saliva samples as well as the artificial saliva ones. Using 0.2 M PBS (pH 7.0), the real samples were diluted 10 fold, 5 fold, and 5 fold for human serum, human saliva, and artificial saliva samples, respectively. Good recovery values were obtained for all samples which ranged from 95% to 105% using the nanocomposite-modified electrode as shown in Table 3. These results demonstrated that our sensor had good potential for applications using real biological fluids.

4. Conclusions

In this work, a cost-effective and sensitive nanocomposite-modified sensor was developed for the simultaneous detection of DNA nucleobases along with UA as an internal standard. Compared with other sensors in the literature, it demonstrated wider linear ranges and lower detection limits. Scan rate studies demonstrated that the nanocomposite-modified surface had a large redox-active area that facilitated the electrochemical oxidation of analytes. Important kinetic parameters, such as D, Ks, and Kh, were calculated based on our chronoamperometric data. Moreover, simultaneous detection was successful in spiking studies using human serum and saliva samples as well as artificial saliva ones with good recovery values. Overall, the sensor had a promising potential to eventually be developed into a diagnostic tool to study DNA damage and DNA methylation in gene expression.

Supplementary Materials

The following are available online at https://www.mdpi.com/2072-666X/11/3/294/s1, Figure S1: Differential pulse voltammograms of GCE/MWCNT-GO-CHT for interference studies: I) The concentrations of G, A, T and C were kept constant at 10.5 µM, 12.5 µM, 147.5 µM and 97.5 µM, respectively, while varying the concentrations of UA from 0 to 37.5 µM; II) The concentrations of UA, A, T and C were kept constant at 30 µM, 32.5 µM, 147.5 µM and 97.5 µM, respectively, while varying the concentrations of G from 0 to 28 µM; III) The concentrations of UA, G, T and C were kept constant at 30 µM, 10.5 µM, 147.5 µM and 97.5 µM, respectively, while varying the concentrations of A from 0 to 32.5 µM; VI) The concentrations of UA, G, A and C were kept constant at 30 µM, 10.5 µM, 12.5 µM and 97.5 µM, respectively, while varying the concentrations of T from 0 to 247.5 µM; V) The concentrations of UA, G, A and T were kept constant at 30 µM, 32.5 µM, 147.5 µM and 97.5 µM, respectively, while varying the concentrations of C from 0 to 28 µM. Figure S2: DPV of simultaneous detection of 30, 57.5, 12.5, 147.5 and 97.5 µM of UA, G, A, T and C, respectively, using freshly prepared (0 days) electrode (red line) and stored (14 days at room temperature) electrode (green line). Figure S3: (A) Chronoamperograms of GCE/GO-MWCNT-CHT for varying concentrations of UA: 20, 30, 50 μM in 0.2 M PBS (pH 7.0); (B) Plots of anodic peak currents (Ipa) vs. t−1/2; (C) Plot of the slope of straight line vs. UA concentration. Figure S4: (A) Chronoamperograms of GCE/GO-MWCNT-CHT for varying concentrations of G: 10, 20, 30 μM in 0.2 M PBS (pH 7.0); (B) Plots of anodic peak currents (Ipa) vs. t−1/2; (C) Plot of the slope of straight line vs. G concentration. Figure S5: (A) Chronoamperograms of GCE/GO-MWCNT-CHT for varying concentrations of T: 25, 50, 150 μM in 0.2 M PBS (pH 7.0); (B) Plots of anodic peak currents (Ipa) vs. t−1/2; (C) Plot of the slope of straight line vs. T concentration. Figure S6: (A) Chronoamperograms of GCE/GO-MWCNT-CHT for varying concentrations of C: 25, 100, 125 μM in 0.2 M PBS (pH 7.0); (B) Plots of anodic peak currents (Ipa) vs. t−1/2; (C) Plot of the slope of straight line vs. C concentration. Figure S7: Linear dependence of square root of time on Ic/ IL for UA detection using chronoamperometry. Figure S8: Linear dependence of square root of time on Ic/ IL for G detection using chronoamperometry. Figure S9: Linear dependence of square root of time on Ic/ IL for A detection using chronoamperometry. Figure S10: Linear dependence of square root of time on Ic/ ILfor T detection using chronoamperometry. Figure S11: Linear dependence of square root of time on Ic/ IL for C detection using chronoamperometry. Figure S12: DPV for standard addition in human serum sample that was diluted 10-fold in 0.2 M PBS (pH 7.0). Figure S13: DPV for standard addition in human saliva sample that was diluted 5-fold in 0.2 M PBS (pH 7.0). Figure S14: DPV for standard addition in artificial saliva sample that was diluted 5-fold in 0.2 M PBS (pH 7.0). Table S1: A summary of calculated diffusion coefficients, catalytic rate constants and heterogeneous kinetic rate constant (Kh) for UA, G, A, T and C using the designated electrode. Table S2: Comparison table of classical methods for DNA detection and the proposed electrochemical method.

Author Contributions

Conceptualization, S.W., C.F., M.N. and K.K.; methodology, S.W., C.F. and M.N.; software, S.W., C.F. and M.N.; validation, S.W., C.F. and M.N.; formal analysis, S.W., C.F. and M.N.; investigation, S.W., C.F. and M.N.; resources, K.K.; data curation, S.W., C.F. and M.N.; writing—original draft preparation, S.W., C.F. and M.N.; writing—review and editing, S.W., C.F., M.N. and K.K.; supervision, M.N. and K.K.; project administration, K.K.; funding acquisition, K.K. All authors have read and agreed to the published version of the manuscript.

Funding

This research was funded by the Canada Research Chair Tier-2 award (project no. 950-231116), the Ontario Ministry of Research, Innovation and Science (Project no. 35272), Discovery Grant (project no. 3655) from the Natural Sciences and Engineering Research Council of Canada (NSERC), and the Canada Foundation for Innovation (project no. 35272).

Acknowledgments

The authors would like to thank the Centre for the Neurobiology of Stress in the University of Toronto Scarborough for their technical assistance with TEM studies.

Conflicts of Interest

The authors declare no conflict of interest.

References

  1. Ivandini, T.A.; Honda, K.; Rao, T.N.; Fujishima, A.; Einaga, Y. Simultaneous detection of purine and pyrimidine at highly boron-doped diamond electrodes by using liquid chromatography. Talanta 2007, 71, 648–655. [Google Scholar] [CrossRef] [PubMed]
  2. Carolina Torres, A.; Barsan, M.M.; Brett, C.M.A. Simple electrochemical sensor for caffeine based on carbon and Nafion-modified carbon electrodes. Food Chem. 2014, 149, 215–220. [Google Scholar] [CrossRef] [PubMed]
  3. Chen, G.; Han, X.; Zhang, L.; Ye, J. Determination of purine and pyrimidine bases in DNA by micellar electrokinetic capillary chromatography with electrochemical detection. J. Chromatogr. A 2002, 954, 267–276. [Google Scholar] [CrossRef]
  4. Lavanya, N.; Nizeyimana Claude, J.; Sekar, C. Electrochemical determination of purine and pyrimidine bases using copper doped cerium oxide nanoparticles. J. Colloid Interface Sci. 2018, 530, 202–211. [Google Scholar] [CrossRef] [PubMed]
  5. Ng, K.L.; Khor, S.M. Graphite-based nanocomposite electrochemical sensor for multiplex detection of adenine, guanine, thymine, and cytosine: A biomedical prospect for studying DNA damage. Anal. Chem. 2017, 89, 10004–10012. [Google Scholar] [CrossRef] [PubMed]
  6. Ouyang, X.; Luo, L.; Ding, Y.; Liu, B.; Xu, D. Simultaneous determination of purine and pyrimidine bases in DNA using poly(3,4-ethylenedioxythiophene)/graphene composite film. J. Electroanal. Chem. 2014, 735, 51–56. [Google Scholar] [CrossRef]
  7. Oliveira-Brett, A.M.; Piedade, J.A.P.; Silva, L.A.; Diculescu, V.C. Voltammetric determination of all DNA nucleotides. Anal. Biochem. 2004, 332, 321–329. [Google Scholar] [CrossRef] [Green Version]
  8. Xiao, F.; Zhao, F.; Li, J.; Liu, L.; Zeng, B. Characterization of hydrophobic ionic liquid-carbon nanotubes-gold nanoparticles composite film coated electrode and the simultaneous voltammetric determination of guanine and adenine. Electrochim. Acta 2008, 53, 7781–7788. [Google Scholar] [CrossRef]
  9. Yang, F.Q.; Guan, J.; Li, S.P. Fast simultaneous determination of 14 nucleosides and nucleobases in cultured Cordyceps using ultra-performance liquid chromatography. Talanta 2007, 73, 269–273. [Google Scholar] [CrossRef]
  10. Geng, X.; Bao, J.; Huang, T.; Wang, X.; Hou, C.; Hou, J.; Samalo, M.; Yang, M.; Huo, D. Electrochemical sensor for the simultaneous detection of guanine and adenine based on a PPyox/MWNTs-MoS2 modified electrode. J. Electrochem. Soc. 2019, 166, B498–B504. [Google Scholar] [CrossRef]
  11. Jankowska-Śliwińska, J.; Dawgul, M.; Kruk, J.; Pijanowska, D.G. Comparison of electrochemical determination of purines and pyrimidines by means of carbon, graphite and gold paste electrodes. Int. J. Electrochem. Sci. 2017, 12, 2329–2343. [Google Scholar] [CrossRef]
  12. Huang, Q.; Kaiser, K.; Benner, R. A simple high performance liquid chromatography method for the measurement of nucleobases and the RNA and DNA content of cellular material. Limnol. Oceanogr. Methods 2012, 10, 608–616. [Google Scholar] [CrossRef]
  13. Zong, S.Y.; Han, H.; Wang, B.; Li, N.; Dong, T.T.X.; Zhang, T.; Tsim, K.W.K.; McPhee, D.J. Fast simultaneous determination of 13 nucleosides and nucleobases in cordyceps sinensis by UHPLC-ESI-MS/MS. Molecules 2015, 20, 21816–21825. [Google Scholar] [CrossRef] [PubMed] [Green Version]
  14. Brohi, R.O.Z.; Khuhawar, M.Y.; Channa, A.; Laghari, A.J.; Abbasi, K. Gas chromatographic determination of purines and pyrimidines from dna using ethyl chloroformate as derivatizing reagent. Pak. J. Anal. Environ. Chem. 2016, 17, 50–57. [Google Scholar] [CrossRef]
  15. Li, T.; Li, B.; Dong, S. Aptamer-based label-free method for hemin recognition and DNA assay by capillary electrophoresis with chemiluminescence detection. Anal. Bioanal. Chem. 2007, 389, 887–893. [Google Scholar] [CrossRef]
  16. Heisler, I.; Keller, J.; Tauber, R.; Sutherland, M.; Fuchs, H. A colorimetric assay for the quantitation of free adenine applied to determine the enzymatic activity of ribosome-inactivating proteins. Anal. Biochem. 2002, 302, 114–122. [Google Scholar] [CrossRef]
  17. Zhu, Z.; Zhan, L.; Hou, C.; Wang, Z. Nanostructured metal-enhanced raman spectroscopy for DNA base detection. IEEE Photonics J. 2012, 4, 1333–1339. [Google Scholar]
  18. Xu, Q.; Liu, X.; Li, H.-B.; Yin, L.N.; Hu, X. Electrochemical determination of purine and pyrimidine DNA bases based on the recognition properties of azocalix [4] arene. Biosens. Bioelectron. 2013, 42, 355–361. [Google Scholar]
  19. Hasoň, S.; Fojt, L.; Šebest, M.F.P. Improved electrochemical detection of purine nucleobases at mechanically roughened edge-plane pyrolytic graphite electrode. Electroanalysis 2009, 21, 666–670. [Google Scholar] [CrossRef]
  20. Zhang, J.; Han, D.; Wang, S.; Zhang, X.; Yang, R.; Ji, Y.; Yu, X. Electrochemical detection of adenine and guanine using a three-dimensional WS2 nanosheet/graphite microfiber hybrid electrode. Electrochem. Commun. 2019, 99, 75–80. [Google Scholar] [CrossRef]
  21. Jesny, S.; Girish Kumar, K. Electrocatalytic resolution of guanine, adenine and cytosine along with uric acid on poly (4-amino-3-hydroxy naphthalene-1-sulfonic acid) modified glassy carbon electrode. J. Electroanal. Chem. 2017, 801, 153–161. [Google Scholar] [CrossRef]
  22. Li, D.; Yang, X.L.; Xiao, B.L.; Geng, F.Y.; Hong, J.; Sheibani, N.; Moosavi-Movahedi, A.A. Detection of guanine and adenine using an aminated reduced graphene oxide functional membrane-modified glassy carbon electrode. Sensors 2017, 17, 1652. [Google Scholar] [CrossRef] [PubMed] [Green Version]
  23. Oliveira, T.M.B.F.; Morais, S. New generation of electrochemical sensors based on multi-walled carbon nanotubes. Appl. Sci. 2018, 8, 1925. [Google Scholar] [CrossRef] [Green Version]
  24. Aboutalebi, S.H.; Chidembo, A.T.; Salari, M.; Konstantinov, K.; Wexler, D.; Liu, H.K.; Dou, S.X. Comparison of GO, GO/MWCNTs composite and MWCNTs as potential electrode materials for supercapacitors. Energy Environ. Sci. 2011, 4, 1855–1865. [Google Scholar] [CrossRef] [Green Version]
  25. Kong, H.X. Hybrids of carbon nanotubes and graphene/graphene oxide. Curr. Opin. Solid State Mater. Sci. 2013, 17, 31–37. [Google Scholar] [CrossRef]
  26. Mani, V.; Devadas, B.; Chen, S.M. Direct electrochemistry of glucose oxidase at electrochemically reduced graphene oxide-multiwalled carbon nanotubes hybrid material modified electrode for glucose biosensor. Biosens. Bioelectron. 2013, 41, 309–315. [Google Scholar] [CrossRef]
  27. Arena, A.; Scandurra, G.; Ciofi, C. Copper oxide chitosan nanocomposite: Characterization and application in non-enzymatic hydrogen peroxide sensing. Sensors 2017, 17, 2198. [Google Scholar] [CrossRef] [Green Version]
  28. Li, S.; Noroozifar, M.; Kerman, K. Nanocomposite of ferricyanide-doped chitosan with multi-walled carbon nanotubes for simultaneous senary detection of redox-active biomolecules. J. Electroanal. Chem. 2019, 849, 113376. [Google Scholar] [CrossRef]
  29. Suh, J.H.; Lee, Y.Y.; Lee, H.J.; Kang, M.; Hur, Y.; Lee, S.N.; Yang, D.H.; Han, S.B. Dispersive liquid-liquid microextraction based on solidification of floating organic droplets followed by high performance liquid chromatography for the determination of duloxetine in human plasma. J. Pharm. Biomed. Anal. 2013, 75, 214–219. [Google Scholar] [CrossRef]
  30. Madsen, K.D.; Sander, C.; Baldursdottir, S.; Pedersen, A.M.L.; Jacobsen, J. Development of an ex vivo retention model simulating bioadhesion in the oral cavity using human saliva and physiologically relevant irrigation media. Int. J. Pharm. 2013, 448, 373–381. [Google Scholar] [CrossRef]
  31. Tohidinia, M.; Noroozifar, M. Investigation of carbon allotropes for simultaneous determination of ascorbic acid, epinephrine, uric acid, nitrite and xanthine. Int. J. Electrochem. Sci. 2018, 13, 2310–2328. [Google Scholar] [CrossRef]
  32. Anu Prathap, M.U.; Srivastava, R.; Satpati, B. Simultaneous detection of guanine, adenine, thymine, and cytosine at polyaniline/MnO2 modified electrode. Electrochim. Acta 2013, 114, 285–295. [Google Scholar] [CrossRef]
  33. Veera Manohara Reddy, Y.; Sravani, B.; Agarwal, S.; Gupta, V.K.; Madhavi, G. Electrochemical sensor for detection of uric acid in the presence of ascorbic acid and dopamine using the poly(DPA)/SiO2@Fe3O4 modified carbon paste electrode. J. Electroanal. Chem. 2018, 820, 168–175. [Google Scholar] [CrossRef]
  34. Sharma, V.K.; Jelen, F.; Trnkova, L. Functionalized solid electrodes for electrochemical biosensing of purine nucleobases and their analogues: A review. Sensors 2015, 15, 1564–1600. [Google Scholar] [CrossRef] [Green Version]
  35. Sun, W.; Xi, M.; Zhang, L.; Zhan, T.; Gao, H.; Jiao, K. Electrochemical behaviors of thymine on a new ionic liquid modified carbon electrode and its detection. Electrochim. Acta 2010, 56, 222–226. [Google Scholar] [CrossRef]
  36. Ganesh, H.V.S.; Noroozifar, M.; Kerman, K. Epigallocatechin gallate-modified graphite paste electrode for simultaneous detection of redox-active biomolecules. Sensors 2018, 18, 23. [Google Scholar] [CrossRef] [Green Version]
  37. Yin, H.; Zhou, Y.; Ma, Q.; Ai, S.; Ju, P.; Zhu, L.; Lu, L. Electrochemical oxidation behavior of guanine and adenine on graphene-Nafion composite film modified glassy carbon electrode and the simultaneous determination. Process Biochem. 2010, 45, 1707–1712. [Google Scholar] [CrossRef]
  38. Yari, A.; Derki, S. New MWCNT-Fe3O4@PDA-Ag nanocomposite as a novel sensing element of an electrochemical sensor for determination of guanine and adenine contents of DNA. Sensors Actuators B Chem. 2016, 227, 456–466. [Google Scholar] [CrossRef]
  39. Thangaraj, R.; Senthil Kumar, A. Simultaneous detection of guanine and adenine in DNA and meat samples using graphitized mesoporous carbon modified electrode. J. Solid State Electrochem. 2013, 17, 583–590. [Google Scholar] [CrossRef]
  40. Da Cruz, F.S.; de Souza Paula, F.; Franco, D.L.; dos Santos, W.T.P.; Ferreira, L.F. Electrochemical detection of uric acid using graphite screen-printed electrodes modified with Prussian blue/poly(4-aminosalicylic acid)/Uricase. J. Electroanal. Chem. 2017, 806, 172–179. [Google Scholar] [CrossRef]
  41. Ping, J.; Wu, J.; Wang, Y.; Ying, Y. Simultaneous determination of ascorbic acid, dopamine and uric acid using high-performance screen-printed graphene electrode. Biosens. Bioelectron. 2012, 34, 70–76. [Google Scholar] [CrossRef]
  42. Stozhko, N.; Bukharinova, M.; Galperin, L.; Brainina, K. A Nanostructured sensor based on gold nanoparticles and Nafion for determination of uric acid. Biosensors 2018, 8, 21. [Google Scholar] [CrossRef] [PubMed] [Green Version]
  43. Brohi, R.O.Z.Z.; Khuhawar, M.Y.; Khuhawar, T.M.J. GC-FID determination of nucleobases guanine, adenine, cytosine, and thymine from DNA by precolumn derivatization with isobutyl chloroformate. J. Anal. Sci. Technol. 2016, 7, 10. [Google Scholar] [CrossRef] [Green Version]
  44. Duan, B.; Wang, L.; Dai, X.; Huang, L.; Yang, M.; Chen, S. Identification and quantitative analysis of nucleosides and nucleobases in aqueous extracts of Fritillaria cirrhosa D. DON. using HPLC-DAD and HPLC-ESI-MS. Anal. Lett. 2011, 44, 2491–2502. [Google Scholar] [CrossRef]
  45. Cheng, W.; Zhang, X.; Song, Q.; Lu, W.; Wu, T.; Zhang, Q.; Li, C. Determination and comparative analysis of 13 nucleosides and nucleobases in natural fruiting body of Ophiocordyceps sinensis and its substitutes. Mycology 2017, 8, 318–326. [Google Scholar] [CrossRef] [PubMed]
  46. Ferrag, C.; Noroozifar, M.; Kerman, K. Thiol functionalized carbon ceramic electrode modified with multi-walled carbon nanotubes and gold nanoparticles for simultaneous determination of purine derivatives. Mater. Sci. Eng. C 2020, 110, 110568. [Google Scholar] [CrossRef]
  47. Rajabi, H.; Noroozifar, M.; Khorasani-Motlagh, M. Graphite paste electrode modified with Lewatit® FO36 nano-resin for simultaneous determination of ascorbic acid, acetaminophen and tryptophan. Anal. Methods 2016, 8, 1924–1934. [Google Scholar] [CrossRef]
  48. Velasco, J.G. Determination of standard rate constants for electrochemical irreversible processes from linear sweep voltammograms. Electroanalysis 1997, 9, 880–882. [Google Scholar] [CrossRef]
  49. Noroozifar, M.; Khorasani-Motlagh, M.; Tavakkoli, H. Preparation of tetraheptylammonium iodide-iodine graphite-multiwall carbon nanotube paste electrode: Electrocatalytic determination of ascorbic acid in pharmaceuticals and foods. Anal. Sci. 2011, 27, 929–935. [Google Scholar] [CrossRef] [Green Version]
Scheme 1. Diagram for the preparation of graphene oxide, multi-walled carbon nanotube (GO-MWCNT) hybrid nanocomposite and the modification of glassy carbon electrode (GCE) surface.
Micromachines 11 00294 sch001
Figure 1. TEM images for the GO-MWCNT nanocomposites in CHT which were used for the modification of GCE surface (scale bars for image (A) to (B) are 1.0 and 0.5 μm).
Micromachines 11 00294 g001
Figure 2. FT-IR spectra for MWCNT, GO, CHT and GO-MWCNT hybrid nanocomposite in CHT.
Micromachines 11 00294 g002
Figure 3. DPV voltammograms using GCE/GO-MWCNT-CHT for pH effect on the simultaneous electrochemical detection of four DNA bases in the presence of UA (pH range: 2.0, 3.0, 4.0, 5.0, 6.0, 7.0, 7.4, and 8.1).
Micromachines 11 00294 g003
Figure 4. Relationship between pH and Ep for the simultaneous electrochemical detection of all four DNA bases in the presence of UA using GCE/GO-MWCNT-CHT.
Micromachines 11 00294 g004
Scheme 2. Electrochemical oxidation mechanisms of UA and DNA bases as determined from our experimental data and literature.
Micromachines 11 00294 sch002
Figure 5. (A) Comparison of CV using bare GCE, GCE/CHT, and the GCE/GO-MWCNT-CHT to detect 175 µM UA, 50 µM G, 50 µM A, 250 µM T, and 250 µM C in 0.2 M PBS (pH 7.0); (B) comparison of DPV using bare GCE, GCE/CHT, and the GCE/GO-MWCNT-CHT to detect 15 µM UA, 15 µM G, 15 µM A, 35 µM T, and 35 µM C in 0.2 M PBS (pH 7.0).
Micromachines 11 00294 g005
Figure 6. Overlay of DPV measurements using GCE/GO-MWCNT-CHT for individual detections and simultaneous detection of 12.5, 147.5, 97.5, and 10 μM of A, T, C, and G in 0.2 M PBS (pH 7.0).
Micromachines 11 00294 g006
Figure 7. Calibration curves based on DPV for simultaneous detection of UA, G, A, T, and C using GCE/GO-MWCNT-CHT with concentrations ranging from 1.0–151.0, 1.0-78.0, 1.0-79.5, 5.0-267.5, and 12.5–182.5 µM for UA, G, A, T, and C, respectively. The lowest end of the dynamic ranges started from the blue curve and ended in the purple curve for the highest.
Micromachines 11 00294 g007
Figure 8. Calibration graphs for UA (A) and all four nucleobases (BE), respectively.
Micromachines 11 00294 g008
Figure 9. Linear dependence of ip on v for bare GCE and GCE/GO-MWCNT-CHT.
Micromachines 11 00294 g009
Figure 10. (A) Chronoamperograms of GCE/GO-MWCNT-CHT for varying concentrations of adenine (A): 25, 50, and 150 μM in 0.2 M PBS (pH 7.0); (B) plots of anodic peak currents (Ipa) versus t−1/2; (C) plot of the slope of the straight line versus concentration of A.
Micromachines 11 00294 g010
Table 1. A summary of the results for the linear dependence of Ep on pH for UA and DNA bases using GCE/GO-MWCNT-CHT.
AnalytesLinear RelationshipsSlopes (mV/pH)Regression Coefficients
UAEp (UA) = −0.0625 pH + 0.708462.5R² = 0.9911
GEp (G) = −0.0561 pH + 1.051856.1R² = 0.9905
AEp (A) = −0.0601 pH + 1.364460.1R² = 0.9906
TEp (T) = −0.0582 pH + 1.567258.2R² = 0.9907
CEp (C) = −0.0458 pH + 1.626852.7R² = 0.9913
Table 2. Comparison of the nanocomposite-modified sensor with the ones recorded in the literature for the detection of all four nucleobases.
ElectrodeAnalytesDetection Limit (µM)Linear Range (µM)Reference
Graphene-Nafion modified GCEG0.582–120[37]
A0.755–170
MWCNT-Fe3O4 coated with PDA-Ag modified GPEG1.58–130[38]
A5.70.1–120
GMC modified GCEG0.7625–150[39]
A0.6325–200
PANI-MnO2 modified GCEG4.810–100[32]
A2.910–100
T1.310–100
C1.310–100
MWCNT-graphite deposited with Au-rGO modified GPEG3.33–170[5]
A3.73–190
T7.97.5–800
C9.09–900
Prussian blue/ poly(4-aminosalicylic acid)/ uricase modified graphite screen-printed electrodeUA3.010–200[40]
Screen-printed graphene electrode UA0.41.2–1.8[41]
Poly(DPA) on SiO2@Fe3O4 modified screen-printed graphene electrodeUA0.200.8–2500[33]
Au-Nafion-modified carbon screen-printed electrodeUA0.30.5–600 [42]
GO-MWCNT hybrid with CHT modified GCEUA0.121–151This work
G0.111–78
A0.432–119.5
T1.7112.5–227.5
C0.805–132.5
PDA: polydopamine; GPE: graphite paste electrode; GMC: graphitized mesoporous carbon; PANI: polyaniline; rGO: reduced graphene oxide; poly(DPA): polydopamine.
Table 3. Summary of simultaneous voltammetric detection studies using the spiked human serum, saliva, and artificial saliva samples at GCE/GO-MWCNT-CHT surfaces.
Real SampleAnalytesSpiked Concentration (μM)Detected Concentration (μM)% Recovery
Human serumG55.0100
A1010.4104
T13.3313.3100
C83.380.897
Human salivaG51.2552.6103
A32.532.4100
T62.559.195
C62.564.5103
Artificial salivaG5048.196
A5048.296
T10098.699
C100105.0105

